hercules high school 1900 refugio valley rd., hercules, ca ... · hercules high school is located...
TRANSCRIPT
Hercules High School 1900 Refugio Valley Rd., Hercules, CA 94547
WASC Self Study Focus on Learning
2014-2015
1
2014-15 WASC Report
West Contra Costa Unified School District 1108 Bissell Avenue Richmond, CA 94801 Superintendent Dr. Bruce Harter Associate Superintendent, Operations Lisa LeBlanc Associate Superintendent, Business Services Sheri Gamba Associate Superintendent, K-12 School Operations Wendell Greer Assistant Superintendent, Education Services Nia Rashidchi Assistant Superintendent, Human Resources Kenneth Whittemore Chief Technology Officer, Technology Mary Phillips Executive Director Adam Taylor Board of Trustees: President Todd Groves Clerk Randall Enos Madeline Kronenberg Liz Block Val Cuevas Hercules High School 1900 Refugio Valley Hercules, CA 94547 Principal Paul Mansingh Associate Principal Catherine Floresca Assistant Principal Dingane Newsom WASC Leadership Team: Academic Counselor Molly Couto Science Michael Hudson Social Science John Franz Math/Data Support Julieta Palis English Igor Litvin Librarian/Tech Liaison Melanie Perkins World Language Barbara Bruns EL Baener Lucas English Ryan Barrett Social Science/UTR Rep JoAnne Whitlock
1
Table of Contents
Section # I: Introduction and Basic Student/Community Profile Data .......................................... 8
Introduction and Basic Student/Community Profile Data .............................................................. 8
Background/The School Community ...................................................................................... 8
Hercules High School Accreditation History .......................................................................... 9
Hercules High School Vision, Mission and Expected Student Learning Results ..................... 10
Student ESLR ........................................................................................................................ 10
School-wide Focus, 2014-15 ..................................................................................................... 11
Student Demographics .............................................................................................................. 12
Enrollment by grade .............................................................................................................. 12
Ethnic Trends, 2008 - 2015 ................................................................................................... 13
Ethnic Breakdown, 2014-15 .................................................................................................. 14
English Learners Classification ............................................................................................. 14
Primary Language Spoken at Home ...................................................................................... 15
Special Education (SPED) Population .................................................................................. 15
Socioeconomic Disadvantage Enrollment ............................................................................. 16
Parent Education Level .......................................................................................................... 17
CLIMATE DATA ..................................................................................................................... 17
School Safety Plan ................................................................................................................. 17
Average Daily Attendance Rate ............................................................................................ 19
Truancy Rate.......................................................................................................................... 19
Suspension & Expulsion Rates .............................................................................................. 20
Faculty/Staff Demographics ...................................................................................................... 22
Staff Demographics ............................................................................................................... 22
Security Staffing .................................................................................................................... 23
ASB Clubs/Organizations: ........................................................................................................ 23
Then nine newly establish clubs are listed below. ................................................................. 24
Interscholastic Athletics ........................................................................................................ 24
Athletics ................................................................................................................................. 26
Hercules High School Extended Learning Program ................................................................. 26
2
Special Academic Programs ...................................................................................................... 27
Advanced Placement Policies ................................................................................................ 27
Current AP Enrollment .......................................................................................................... 27
AP Enrollment by Ethnicity .................................................................................................. 28
Honors Courses Policies ........................................................................................................ 29
Honors Courses by Ethnicity ................................................................................................. 29
Programs/Academies ............................................................................................................. 29
California English Language Development Test (CELDT) ...................................................... 31
Enrollment by Language Proficiency .................................................................................... 31
Student Achievement Data ........................................................................................................ 34
State & Federal Accountability Systems ............................................................................... 34
Academic Performance Index (API) ..................................................................................... 34
School Rankings: ................................................................................................................... 42
Student Achievement Data: CST, EAP, CAHSEE, Graduation ............................................... 42
California Standards Tests (CST) .......................................................................................... 42
Grade Level and Course Specific CST Results ..................................................................... 44
Percentage of Students Scoring Proficient or Higher on CSTs: .................................. 44
California High School Exit Exam (CAHSEE) Combined Results—Grade 10 ....................... 48
CAHSEE 4 Year Trend Pass Rates (English) ...................................................................... 49
CAHSEE 4 Year Trend Pass Rates (Math) .......................................................................... 50
CAHSEE 3 Year Trend Proficiency Rates .......................................................................... 51
CAHSEE – Subgroup Performance ....................................................................................... 53
CAHSEE Performance Class of 2014 ................................................................................... 54
Advanced Placement Test Results ............................................................................................ 59
AP Comparison Scores –Hercules, California and Global .................................................... 60
AP Summary Scores – 4 Year Trend ..................................................................................... 60
AP Summary Scores – 4 Year Trend ..................................................................................... 62
AP Enrollment by Ethnicity .................................................................................................. 62
AP Mathematics: Enrollment by Ethnicity ............................................................................ 63
AP Science: Enrollment by Ethnicity .................................................................................... 64
AP Social Science: Enrollment by Ethnicity ......................................................................... 65
3
AP English: Enrollment by Ethnicity .................................................................................... 66
CSU Early Assessment Program (EAP) .................................................................................... 67
EAP English – 4 Year Trend ................................................................................................ 67
EAP Math – 4 Year Trend ..................................................................................................... 68
Preliminary Scholastic Aptitude Test (PSAT) .......................................................................... 69
PSAT Score Distribution ....................................................................................................... 70
PSAT Composite Score - College & Career Readiness Benchmarks ................................... 71
Scholastic Aptitude Test (SAT) Results .................................................................................... 72
Scholastic Aptitude Test (SAT) Results – 2013-14............................................................... 72
SAT Reasoning Test – 3 Year Trend..................................................................................... 73
SAT Reasoning Test: 7-Year Score Reports ......................................................................... 73
SAT Writing Section Sub-scores ........................................................................................... 73
Number of Graduates Meeting UC/CSU Requirements ........................................................... 74
2014 A-G Completion Rates – .............................................................................................. 74
A-G Completion Rates – 3 year trend ................................................................................... 74
Report Card Analysis – Core Academic Success Rate ............................................................. 76
Academic Success Rates ....................................................................................................... 76
Core Academic Success Rates - 9th Grade ........................................................................... 78
Core Academic Success Rates - 10th Grade .......................................................................... 78
Core Academic Success Rates - 11th Grade .......................................................................... 81
Core Academic Success Rates - 12th Grade ......................................................................... 81
Student Achievement ............................................................................................................. 81
Report Card Analysis – 2013-14 ............................................................................................... 83
Physical Fitness Test (PFT) – ................................................................................................ 86
Graduation Rate & Drop Out Rate ........................................................................................ 86
Graduates by Ethnicity and Gender ....................................................................................... 87
Post-Secondary Education and Plans ........................................................................................ 89
Parent and Community Involvement......................................................................................... 90
Parent Volunteer Program/Opportunities: ............................................................................. 90
Perceptive Data ......................................................................................................................... 90
California Healthy Kids Survey (CHKS) .............................................................................. 90
4
School Climate Index ............................................................................................................ 93
Section II: Significant School Changes and Developments ......................................................... 95
Staffing ...................................................................................................................................... 95
Collaboration Structure ............................................................................................................. 96
Instructional Leadership Team .................................................................................................. 98
Common Core State Standards – Professional Development ............................................. 100
Safety Plan ............................................................................................................................. 101
Safety Goals ......................................................................................................................... 101
2014-15 Safety Goals: ......................................................................................................... 102
Emergency Preparedness/Emergency Drills ....................................................................... 105
The National Incident Management System ....................................................................... 106
Administrative Consequences Matrix/Progressive Discipline ............................................ 106
Academic Environment ....................................................................................................... 107
Electronic Devices ............................................................................................................... 108
Photo ID/Lanyards ............................................................................................................... 109
Hall Passes ........................................................................................................................... 110
Tardy Policy ........................................................................................................................ 111
Cognitive Behavioral Instruction......................................................................................... 113
Technology ............................................................................................................................. 113
Communication ................................................................................................................... 115
Impact on School: .............................................................................................................. 116
Data Driven Decision Making ................................................................................................. 117
Department Focus ................................................................................................................ 118
S.M.A.R.T Goals ................................................................................................................. 118
District Benchmarks ............................................................................................................ 118
Illuminate ............................................................................................................................. 118
Academic Intervention Program .......................................................................................... 119
College and Career Center ...................................................................................................... 121
Rising Scholars .................................................................................................................... 121
III: Follow-up and Progress Report Development Process ....................................................... 124
WASC Accreditation Status – 2014-15 .................................................................................. 124
5
WASC Leadership Team ........................................................................................................ 124
WASC Re-Organization .......................................................................................................... 125
WASC Collaboration – process to prepare report ............................................................... 127
Revised Vision & Mission Statement ..................................................................................... 130
StudentSenate ..................................................................................................................... 131
SchoolSiteCouncil .............................................................................................................. 131
ParentGroup ........................................................................................................................ 132
Governing Board ................................................................................................................. 133
IV: Progress on the Critical Areas for Follow-up within the Action Plan ................................. 135
Goal # 1: Increase College Readiness for all Students ............................................................ 136
Goal # 2: Increasing rrepresentation for underserved subgroups in advanced and AP classes. ................................................................................................................................................. 136
Goal # 3: Creating and developing a culture of professional teacher collaboration and community. .............................................................................................................................. 136
Goal # 4: Increasing communication between all stakeholders (district, administration, teachers, parents, staff, community members) ........................................................................ 137
Critical Area # 1: ..................................................................................................................... 137
Integration of critical area #1 into school-wide action plan: Identified within Action Plan 139
Critical Area # 2: ..................................................................................................................... 139
Integration of critical area #2 into school-wide action plan: Identified within Action Plan 141
Critical Area # 3: ..................................................................................................................... 141
Integration of critical area #3 into school-wide action plan: Identified within Action Plan 143
Critical Area # 4: ..................................................................................................................... 143
Integration of critical area #4 into school-wide action plan: Identified within Action Plan 145
Critical Area # 5: ..................................................................................................................... 145
Integration of critical area #5 into school-wide action plan: Identified within Action Plan 146
Critical Area # 6: ..................................................................................................................... 146
Integration of critical area #6 into school-wide action plan: Identified within Action Plan 148
Critical Area # 7: ..................................................................................................................... 148
Integration of critical area #7 into school-wide action plan: Identified within Action Plan 149
Critical Area # 8: ..................................................................................................................... 149
Integration of critical area #8 into school-wide action plan: Identified within Action Plan 151
6
Critical Area # 9: ..................................................................................................................... 151
Integration of critical area #9 into school-wide action plan: Identified within Action Plan 154
V: Schoolwide Action Plan ........................................................................................................ 154

7
8
Section # I: Introduction and Basic Student/Community Profile Data Include the following:
A brief general description of the school, the school-wide student goals, the student demographics, and the faculty/staff demographics.
A summary of the disaggregated and interpreted student achievement data since the last full self-study, and how it may have impacted the entire school and designated subgroups of students.
The status of the school with respect to governing authority expectations, e.g., program improvement school, year three; Academic Performance Index (API); audit and resulting corrective action plan integrated into the single school plan.
Note: Utilize the current student/community profile and summary that has been updated annually since the last full visit and other annual progress reports.
Introduction and Basic Student/Community Profile Data Background/The School Community Hercules High School is located in Hercules, California in the beautiful San Pablo Bay area
midway between San Francisco and Napa. The City of Hercules is located along the Interstate 80
corridor, within thirty-minutes of San Francisco and sixty-minutes of Sacramento. The City
maintains an abundance of open spaces and trails throughout the surrounding landscapes offering
dazzling views of the bay from various locations within the city boundaries. Named after
Hercules, the legendary Greek hero known for his strength, the town has thrived for over 100
years through three owners and five wars.
The town of Hercules was originally established as the California Powder Works company town
in 1881. The potent and explosive black powder produced in Hercules was first used by Allied
Forces in World War I. In 1917, after the U.S. had entered the war, the Hercules plant became
the largest producer of TNT in the country. During the 1960s, the plant made the transition from
the production of black powder to fertilizer. Due to the abundant open space and the lack of need
for buffer zones associated with dynamite production, the company decided to create a new city
on the land outside the plant. After two years of public meetings, a general plan for a city of
22,000 residents was adopted with a target date of the year 2000.
The city of Hercules has grown into a culturally rich community with a population hovering
around 20,000 strong. Hercules has one of the largest populations of Filipino and Asian residents
compared to other communities along the I-80 corridor. The largest make-up of the community
9
is Asian (Filipino and various Asian) representing a combined 42.7% of the population. The
White population represents 28% of the whole and the African American residents are at 18%.
The City of Hercules shares its border with two school districts. The majority of residents are
within the West Contra Costa Unified School District boundary. West Contra Costa Unified
School District is a K-12 district comprised of 64 schools, six of which are comprehensive high
schools. The district serves approximately 30,500 students in grades K-12. Elementary schools
serve K-6 and the secondary schools in the district serve either 7th and 8th, or 9th through 12th
grade students. Hercules High School was originally established in 2001 as a Middle/High
School serving 6th -11th grade students. Hercules celebrated its first graduating class in 2003. In
late spring of 2014, the WCCUSD board approved a diversion from the established 6th -12th
institution led by one administrative staff to a single middle school and a sole high school with
separate administrative leadership. Hercules High School still shares a common address with
Hercules Middle School. The two schools remain to be physically connected by an
administrative complex and library buildings.
Hercules High School Accreditation History West Contra Costa Unified School District utilizes the services of the Accrediting Commission
for Schools, Western Association of Schools and Colleges (ACS/WASC) to verify that each of
its schools educational programs provide high learning opportunities for all students as well as
engaged in a process that continuously monitors school improvement focused on student
achievement. Hercules Middle/High School (HMHS) was initially accredited in 2002 for grades
6th to 11th. The subsequent year, a substantial change accreditation was awarded for the addition
of grade 12. A full self-study was completed in the spring of 2005 with HMHS being granted a
six-year accreditation term. In April, 2011 the school performed a full self-study to renew their
accreditation. In June of 2011, the school was granted a six year accreditation with a 2 day
midterm visit in 2014. In April of 2014, the school produced a mid-term report to a visiting
WASC committee and was granted a one year probationary accreditation through June 30th,
2015. Hercules High School is scheduled to submit a probationary mid-cycle review in
preparation for a two-day visit in April of 2015. What follows is Hercules High Schools
probationary year one progress report. This report encapsulates significant changes and
improvements made, based on WASC visiting committee recommendations in the April, 2014
visiting committee report.
10
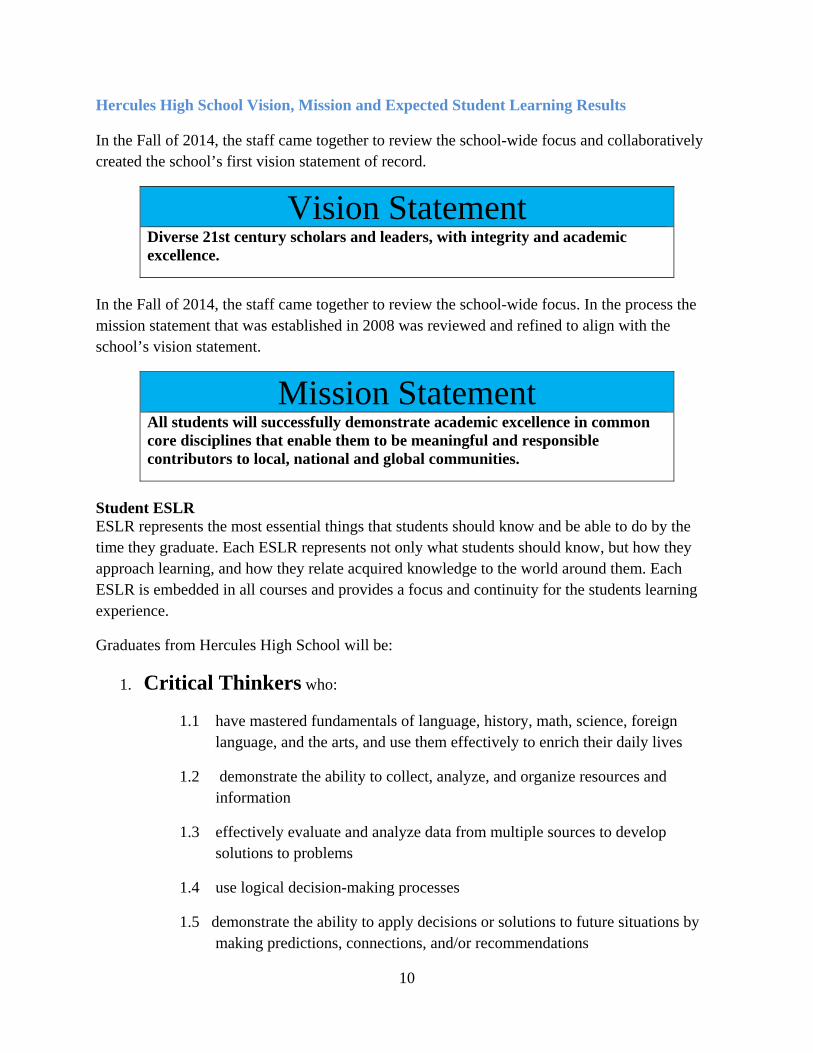
Hercules High School Vision, Mission and Expected Student Learning Results In the Fall of 2014, the staff came together to review the school-wide focus and collaboratively created the school’s first vision statement of record.
Vision Statement Diverse 21st century scholars and leaders, with integrity and academic excellence.
In the Fall of 2014, the staff came together to review the school-wide focus. In the process the mission statement that was established in 2008 was reviewed and refined to align with the school’s vision statement.
Mission Statement All students will successfully demonstrate academic excellence in common core disciplines that enable them to be meaningful and responsible contributors to local, national and global communities.
Student ESLR ESLR represents the most essential things that students should know and be able to do by the time they graduate. Each ESLR represents not only what students should know, but how they approach learning, and how they relate acquired knowledge to the world around them. Each ESLR is embedded in all courses and provides a focus and continuity for the students learning experience.
Graduates from Hercules High School will be:
1. Critical Thinkers who:
1.1 have mastered fundamentals of language, history, math, science, foreign language, and the arts, and use them effectively to enrich their daily lives
1.2 demonstrate the ability to collect, analyze, and organize resources and information
1.3 effectively evaluate and analyze data from multiple sources to develop solutions to problems
1.4 use logical decision-making processes
1.5 demonstrate the ability to apply decisions or solutions to future situations by making predictions, connections, and/or recommendations
11
2. Effective Engaged Communicators who:
2.1 organize thoughts and emotions, and express them in oral, written and artistic forms
2.2 listen to, comprehend, and process information
2.3 understand and follow directions
2.4 read, write, speak, and listen analytically, thoughtfully, and reflectively
2.5 use technology thoughtfully, critically, and appropriately as a tool of communication (e.g. correspondence, display of information, expression of ideas, creative self-expression)
2.6 explore, develop, and demonstrate creative expression in a variety of forms
3. Responsible Citizens who:
3.1 adopt and value ethical principles and attitudes (e.g. honesty, integrity, responsibility, compassion) and apply them to their daily lives
3.2 recognize and value their responsibility to society and make positive contributions to their community (e.g. register to vote, care for the environment, drive responsibly, volunteer)
3.3 respect cultural, physical, economic, intellectual, age, gender, religious and sexual diversity
3.4 understand history, government, economics, legal systems and art forms from our own and other countries
3.5 participate in community, social, civic, cultural, and philanthropic services
School-wide Focus, 2014-15 In August of 2015, the district supported the re-establishment of the Instructional Leadership
Team (ILT) with a 2 day professional development academy sponsored by Pivot Learning. The
objective of the Pivot Learning training was to re-establish an Instructional Leadership Team that
was collaborative in nature, that utilized a shared decision making process and one that focused
on student achievement with emphasis on teaching and learning utilizing 21st century skills. The
tools developed in the summer training were applied in preparation for the first professional
development day for all teachers that would officially kick off the 2014-15 school year. The first
step was to determine and identify a rationale for change or re-direction. The administration team
12
led the staff through an activity that identified 20th century teaching styles and 21st century
teaching styles. Each department identified their top three focus areas underneath the umbrella of
21st century teaching and learning and shared them with the whole staff. Site administration led
the staff through a consensus model that identified commonalities within each department’s
focus. Through this process it was concluded that our school-wide focus would be Research and
Evidence Based Writing. The ILT initiated planning professional development around
supporting teacher implementation of the school-wide theme. ILT also led professional
development sessions on identifying the extent teachers currently utilize the 4 C’s as
instructional strategies and how further professional development sessions could enhance student
learning within the school-wide focus. As a school, we agreed to venture in the direction of
implementing instructional rounds to support individual teacher’s progress in successfully
facilitating student learning.
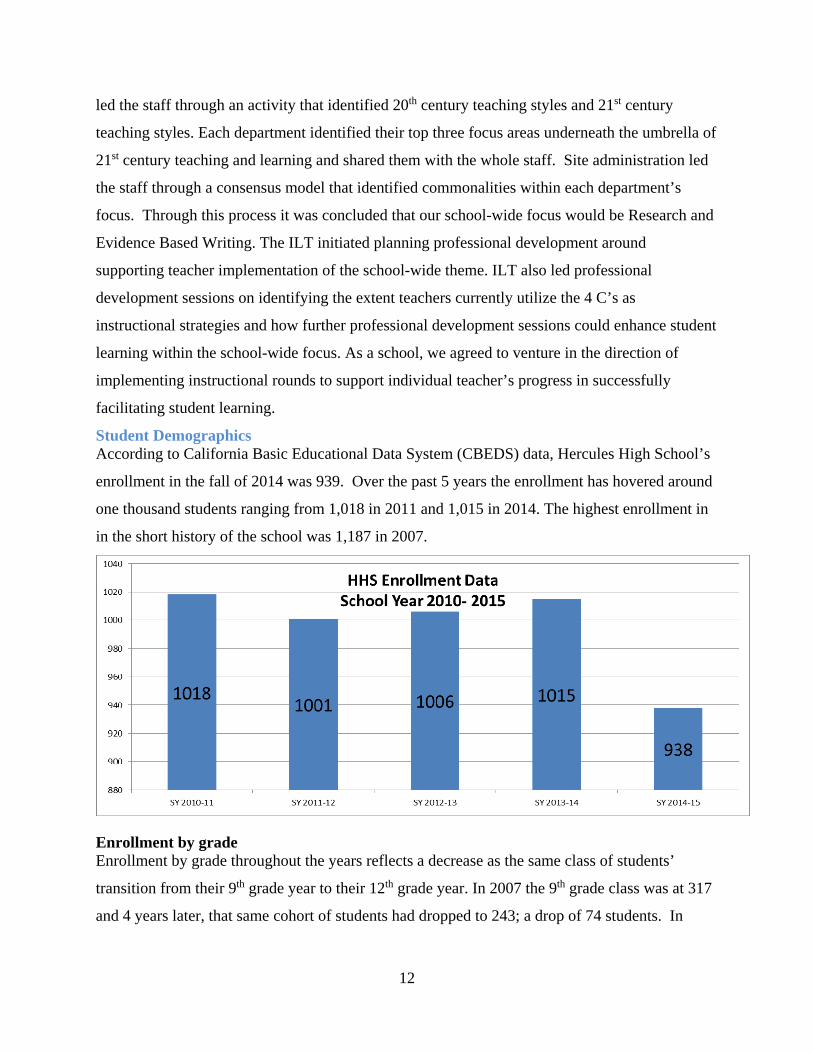
Student Demographics According to California Basic Educational Data System (CBEDS) data, Hercules High School’s
enrollment in the fall of 2014 was 939. Over the past 5 years the enrollment has hovered around
one thousand students ranging from 1,018 in 2011 and 1,015 in 2014. The highest enrollment in
in the short history of the school was 1,187 in 2007.
Enrollment by grade Enrollment by grade throughout the years reflects a decrease as the same class of students’
transition from their 9th grade year to their 12th grade year. In 2007 the 9th grade class was at 317
and 4 years later, that same cohort of students had dropped to 243; a drop of 74 students. In
13
2011-12 the 9th grade class started off at 296 and 4 years later that same cohort of students had
dropped to 259; a drop of 37 students.
Enrollment by 2007-08 2008-09 2009-10 2010-11 2011-12 2012-13 2013-14 2014-159th 317 258 257 296 253 264 282 21710th 309 298 250 253 295 239 252 27711th 284 261 270 226 237 267 222 23612th 277 290 231 243 216 235 259 209TOTAL 1187 1107 1008 1018 1001 1005 1015 939Source:PowerSchool, 10/10/2014
Ethnic Trends, 2008 - 2015 Hercules High School has an ethnically diverse student body that is reflective of the residents of
the community. The table below shows the last 8 years of diversity at Hercules High School.
The African American had a high percentage of 28.3% in 2010 and a low of 21.8 in 2011. The
current African American population represents 24.4% of the student body.
The Asian subgroup had a high of 21% in 2007 and a low of 17% in 2010. The current Asian
population represents 18.2% of the student body.
The Filipino population was the highest percent in 2015 and the lowest percentage was in 2011
when it was at 19.6%. The current Filipino population represents 27.4% of the student body.
The Hispanic population was the highest in 2011 registering at 19.6% and the lowest range was
in 2008 at 15.2%. The current Hispanic population represents 19.5% of the student body.
The White population was at the highest in 2012 at 10.3% and the lowest in 2011. The current
white population represents 8.1% of the student body.
Ethnic Sub Group 2007-08 2008-09 2009-10 2010-11 2011-12 2012-13 2013-14 2014-15African American 25.5% 26.8% 28.3% 21.8% 24.9% 24.7% 26.1% 24.4%Asian 21.5% 20.2% 20.9% 17.6% 19.5% 19.1% 18.6% 18.2%Filipino 20.8% 19.8% 20.7% 19.6% 24.7% 25.2% 27.4% 27.4%Hispanic or Latino 15.2% 15.7% 18.2% 16.5% 19.6% 20.1% 17.6% 19.5%White (Caucasian) 9.8% 10.1% 10.8% 9.4% 10.3% 9.0% 8.6% 8.1%
Hercules High School Ethnic Trends
Source: PowerSchool, 10/10/2014
14
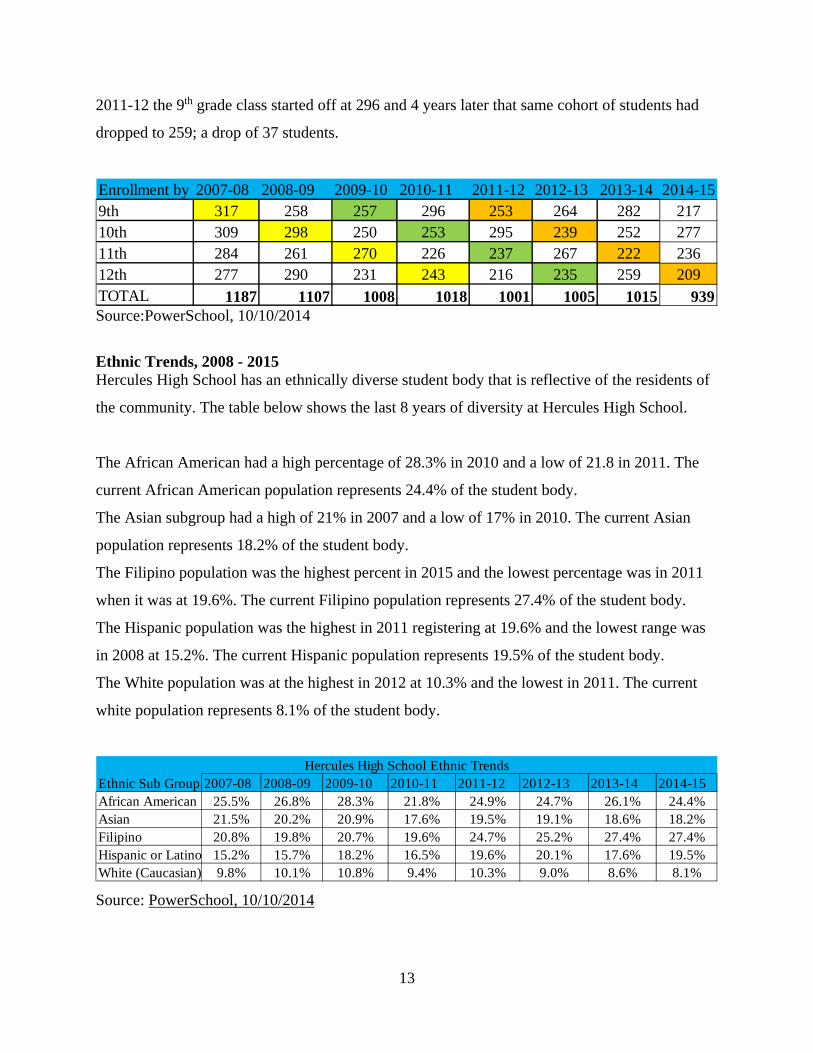
Ethnic Breakdown, 2014-15 The ethnic breakdown of the school depicts 4 ethnic groups, each representing more than 17 percent of the school population. The Filipino population represents the highest number of students at 27.45% of the student body. The next highest percentage is 24.40%, which is the African American (Black) population. The Asian population represents 18.2% while the Hispanic population is at 19.5% of the student body. The Caucasian (White) population represents 8.10% of all students.
24.40%
18.20%
27.45%
19.50%
8.10%
Ethnic Breakdown 2014‐15
African American
Asian
Filipino,
Hispanic or Latino
White
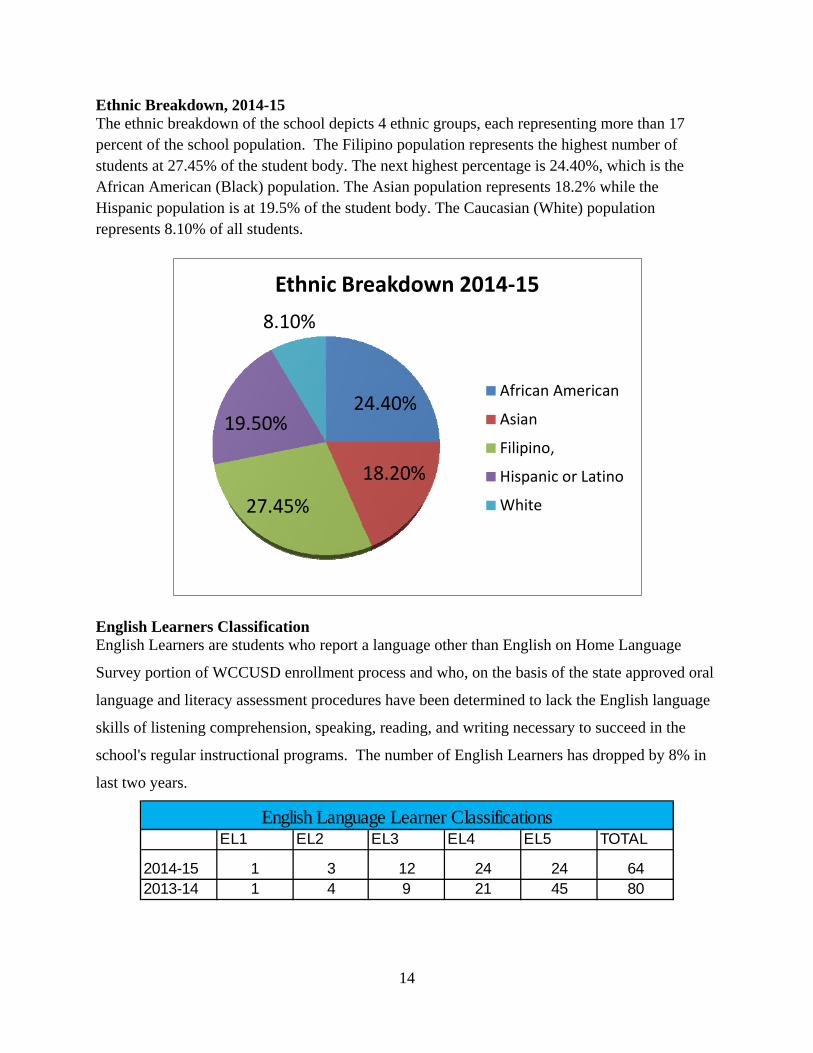
English Learners Classification English Learners are students who report a language other than English on Home Language
Survey portion of WCCUSD enrollment process and who, on the basis of the state approved oral
language and literacy assessment procedures have been determined to lack the English language
skills of listening comprehension, speaking, reading, and writing necessary to succeed in the
school's regular instructional programs. The number of English Learners has dropped by 8% in
last two years.
EL1 EL2 EL3 EL4 EL5 TOTAL
2014-15 1 3 12 24 24 642013-14 1 4 9 21 45 80
English Language Learner Classifications
15
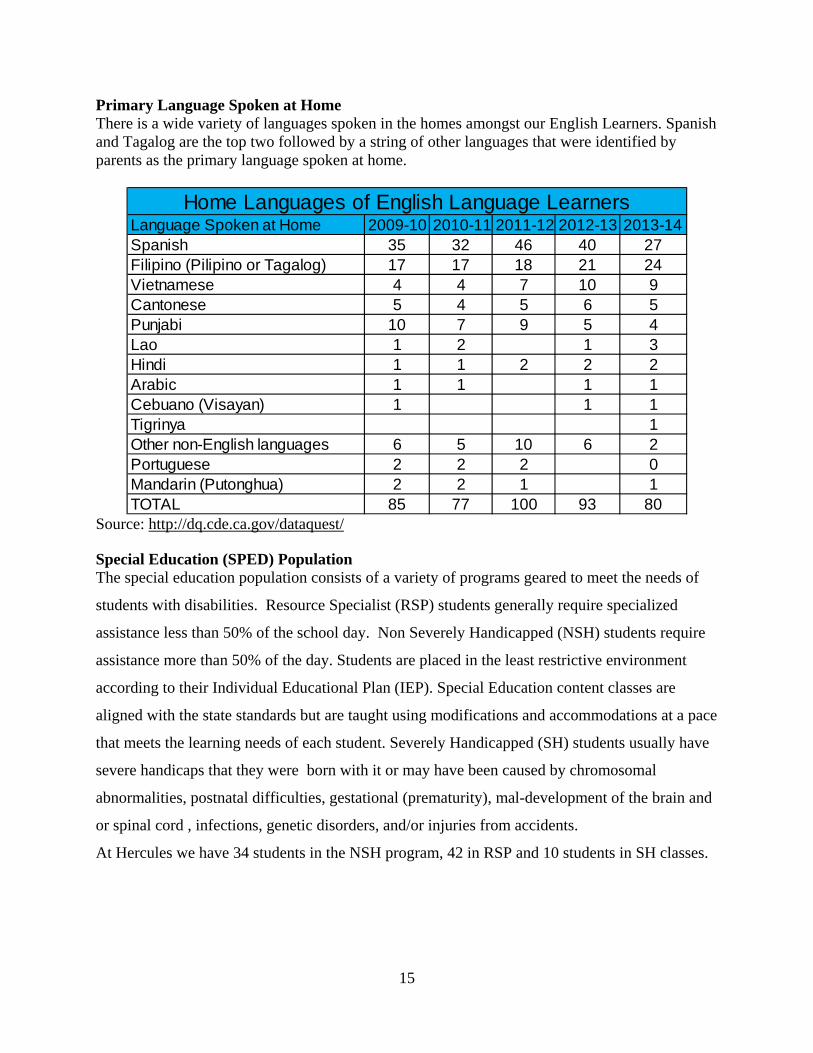
Primary Language Spoken at Home There is a wide variety of languages spoken in the homes amongst our English Learners. Spanish and Tagalog are the top two followed by a string of other languages that were identified by parents as the primary language spoken at home.
Language Spoken at Home 2009-10 2010-11 2011-12 2012-13 2013-14Spanish 35 32 46 40 27Filipino (Pilipino or Tagalog) 17 17 18 21 24Vietnamese 4 4 7 10 9Cantonese 5 4 5 6 5Punjabi 10 7 9 5 4Lao 1 2 1 3Hindi 1 1 2 2 2Arabic 1 1 1 1Cebuano (Visayan) 1 1 1Tigrinya 1Other non-English languages 6 5 10 6 2Portuguese 2 2 2 0Mandarin (Putonghua) 2 2 1 1TOTAL 85 77 100 93 80
Home Languages of English Language Learners
Source: http://dq.cde.ca.gov/dataquest/ Special Education (SPED) Population The special education population consists of a variety of programs geared to meet the needs of
students with disabilities. Resource Specialist (RSP) students generally require specialized
assistance less than 50% of the school day. Non Severely Handicapped (NSH) students require
assistance more than 50% of the day. Students are placed in the least restrictive environment
according to their Individual Educational Plan (IEP). Special Education content classes are
aligned with the state standards but are taught using modifications and accommodations at a pace
that meets the learning needs of each student. Severely Handicapped (SH) students usually have
severe handicaps that they were born with it or may have been caused by chromosomal
abnormalities, postnatal difficulties, gestational (prematurity), mal-development of the brain and
or spinal cord , infections, genetic disorders, and/or injuries from accidents.
At Hercules we have 34 students in the NSH program, 42 in RSP and 10 students in SH classes.
16
Specialized Academic Instruction 2013-14 2014-2015
NSH Enrollment 32 34
RSP Enrollment 50 42SH Enrollment 13 10
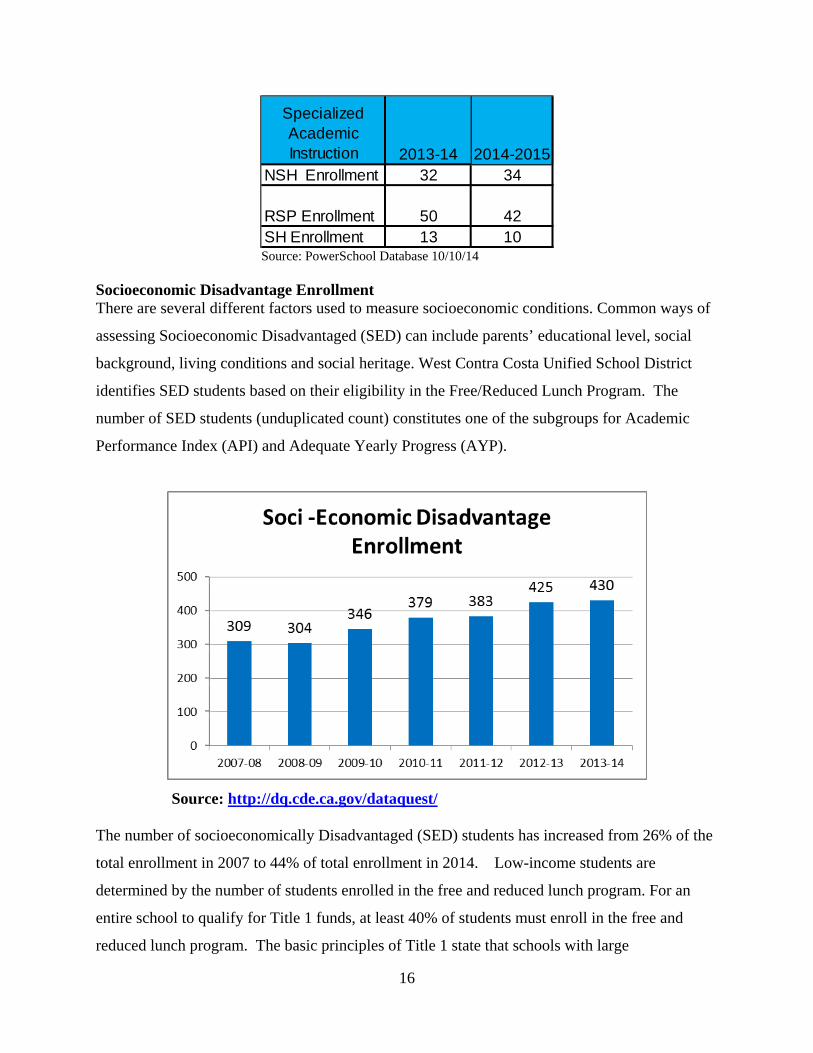
Source: PowerSchool Database 10/10/14 Socioeconomic Disadvantage Enrollment There are several different factors used to measure socioeconomic conditions. Common ways of
assessing Socioeconomic Disadvantaged (SED) can include parents’ educational level, social
background, living conditions and social heritage. West Contra Costa Unified School District
identifies SED students based on their eligibility in the Free/Reduced Lunch Program. The
number of SED students (unduplicated count) constitutes one of the subgroups for Academic
Performance Index (API) and Adequate Yearly Progress (AYP).
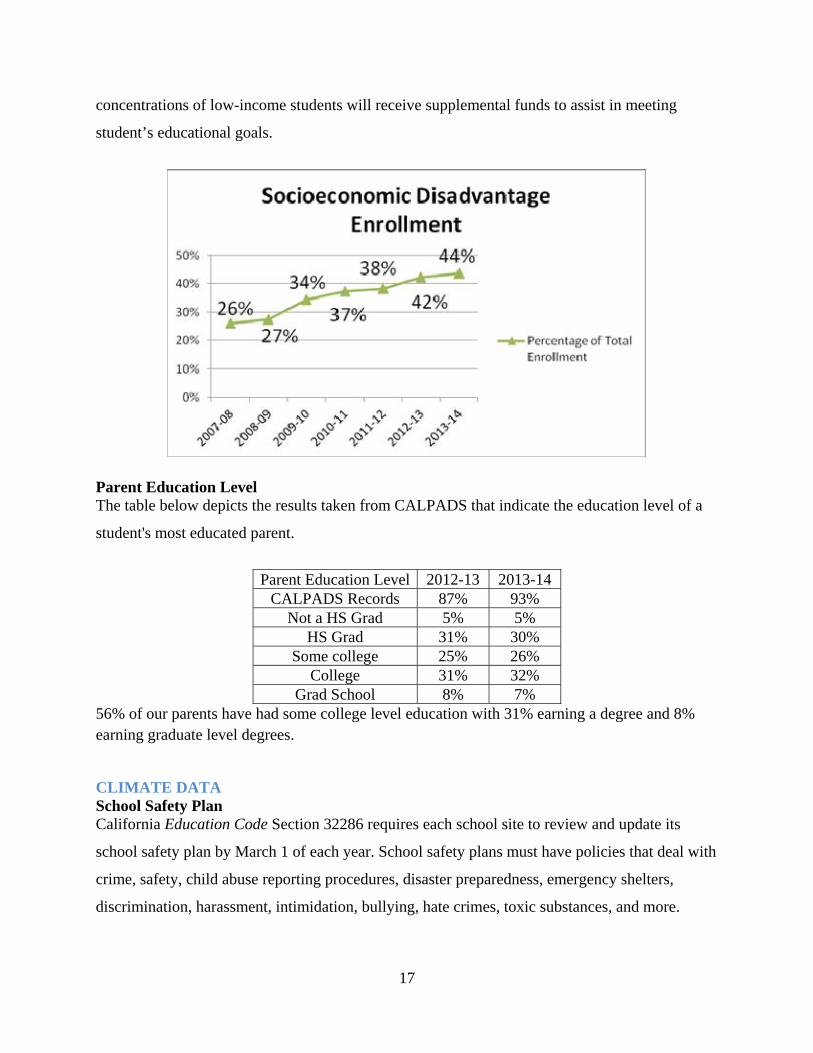
Source: http://dq.cde.ca.gov/dataquest/ The number of socioeconomically Disadvantaged (SED) students has increased from 26% of the
total enrollment in 2007 to 44% of total enrollment in 2014. Low-income students are
determined by the number of students enrolled in the free and reduced lunch program. For an
entire school to qualify for Title 1 funds, at least 40% of students must enroll in the free and
reduced lunch program. The basic principles of Title 1 state that schools with large
17
concentrations of low-income students will receive supplemental funds to assist in meeting
student’s educational goals.
Parent Education Level The table below depicts the results taken from CALPADS that indicate the education level of a
student's most educated parent.
Parent Education Level 2012-13 2013-14
CALPADS Records 87% 93% Not a HS Grad 5% 5%
HS Grad 31% 30% Some college 25% 26%
College 31% 32% Grad School 8% 7%
56% of our parents have had some college level education with 31% earning a degree and 8% earning graduate level degrees.
CLIMATE DATA School Safety Plan California Education Code Section 32286 requires each school site to review and update its
school safety plan by March 1 of each year. School safety plans must have policies that deal with
crime, safety, child abuse reporting procedures, disaster preparedness, emergency shelters,
discrimination, harassment, intimidation, bullying, hate crimes, toxic substances, and more.
18
In preparation to update the most recent school safety plan, it was found that the latest approved
safety plan was in 2008. The process of updating the 2014-15 school safety plan involved
developing a committee (site admin, SRO’s, SCO’s, staff, and parents) that reviewed the latest
plans and made recommendations to upgrade the 2014-15 safety plan with the most effective
measures to assure student and staff safety. The updated school safety plan will be presented to
the School Site Council in February prior to the submission to the district office in compliance
with the March 1st deadline set forward by the state.
Many measures have been implemented in the 2014-15 school year to ensure student and staff
safety throughout the school day. The following measures used to support student and staff
safety are as follows: All visitors are required to check in at the main office, signs pointing
visitors to the main office are posted throughout campus, security/student parking lot gates are
locked 10 minutes after the start of 1st period, all students and staff are required to wear their
photo ID’s around their necks, prior to a student leaving campus during the regular school day,
they must be checked out of school by their legal guardian or designated family representative,
and 4 Campus Security Officers (CSO) and 2 School Resource Officers (SRO) patrol the campus
monitoring all individuals who pass through.
In addition to the previously mentioned items, emergency preparedness drills are performed a
minimum of 4 times per school year. We conduct 2 fire drills, 1 earthquake drill, and 1 lockdown
drill per year. Unannounced drills are conducted as deemed necessary by the school
safety/climate team. Professional development sessions are held to train teachers in evacuation
and lock down procedures.
19
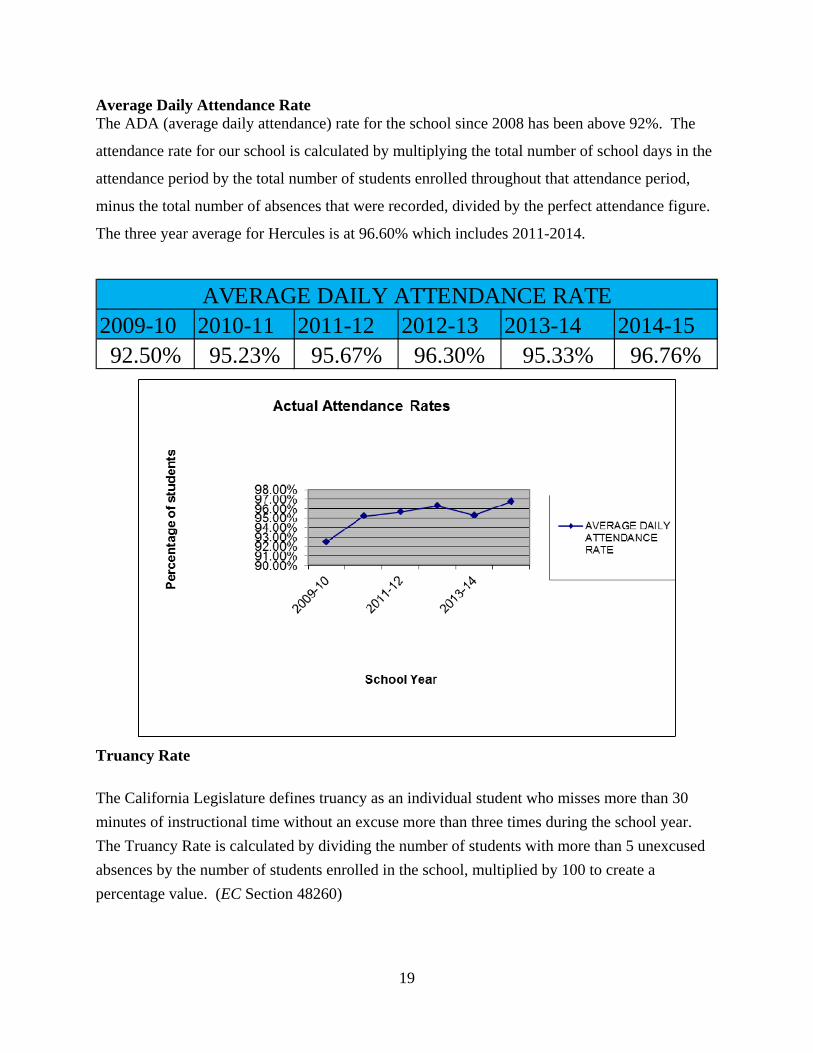
Average Daily Attendance Rate The ADA (average daily attendance) rate for the school since 2008 has been above 92%. The
attendance rate for our school is calculated by multiplying the total number of school days in the
attendance period by the total number of students enrolled throughout that attendance period,
minus the total number of absences that were recorded, divided by the perfect attendance figure.
The three year average for Hercules is at 96.60% which includes 2011-2014.
2009-10 2010-11 2011-12 2012-13 2013-14 2014-1592.50% 95.23% 95.67% 96.30% 95.33% 96.76%
AVERAGE DAILY ATTENDANCE RATE
Truancy Rate
The California Legislature defines truancy as an individual student who misses more than 30
minutes of instructional time without an excuse more than three times during the school year.
The Truancy Rate is calculated by dividing the number of students with more than 5 unexcused
absences by the number of students enrolled in the school, multiplied by 100 to create a
percentage value. (EC Section 48260)
20
Attendance and truancies at Hercules High School are monitored closely in several ways. Parents are notified of student absences or truancies through mail, phone (automated dialer &/or personal phone calls), and online via PowerSchool. Parents receive a letter every time their student has more than 5 unexcused absences, a second letter home is generated out when students have 15 or more unexcused absences, and a third letter is posted when student(s) have reached 30 unexcused absences in addition to a scheduled parent conference with a school administrator. WCCUSD utilizes Blackboard Connect, an automated phone messaging system to communicate with parents whenever their child has an unverified absence.
The #’s below represent the number of truancy letters generated over the past three years.
School Year
# of Recorded Truants
Truancy Rate
2012-13 398 39.56%
2013-14 382 35.86%
2014-15 72 11/20/2014
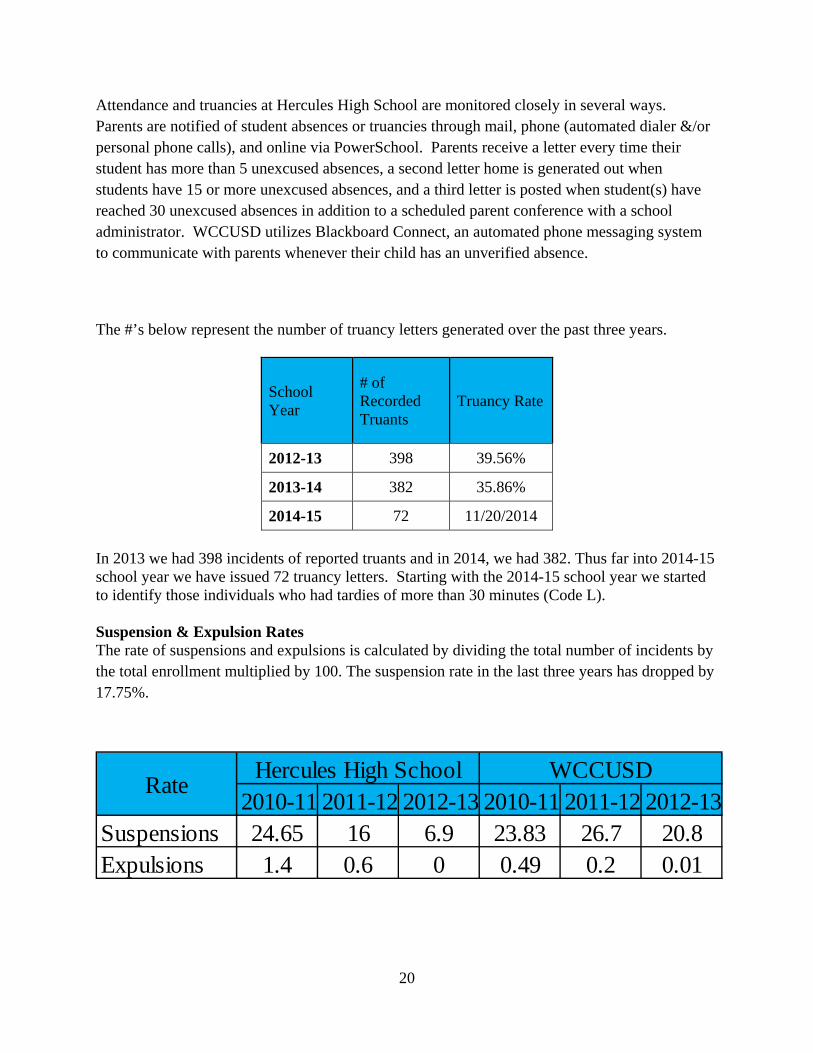
In 2013 we had 398 incidents of reported truants and in 2014, we had 382. Thus far into 2014-15 school year we have issued 72 truancy letters. Starting with the 2014-15 school year we started to identify those individuals who had tardies of more than 30 minutes (Code L). Suspension & Expulsion Rates The rate of suspensions and expulsions is calculated by dividing the total number of incidents by the total enrollment multiplied by 100. The suspension rate in the last three years has dropped by 17.75%.
2010-11 2011-12 2012-13 2010-11 2011-12 2012-13Suspensions 24.65 16 6.9 23.83 26.7 20.8Expulsions 1.4 0.6 0 0.49 0.2 0.01
Hercules High School WCCUSDRate
21
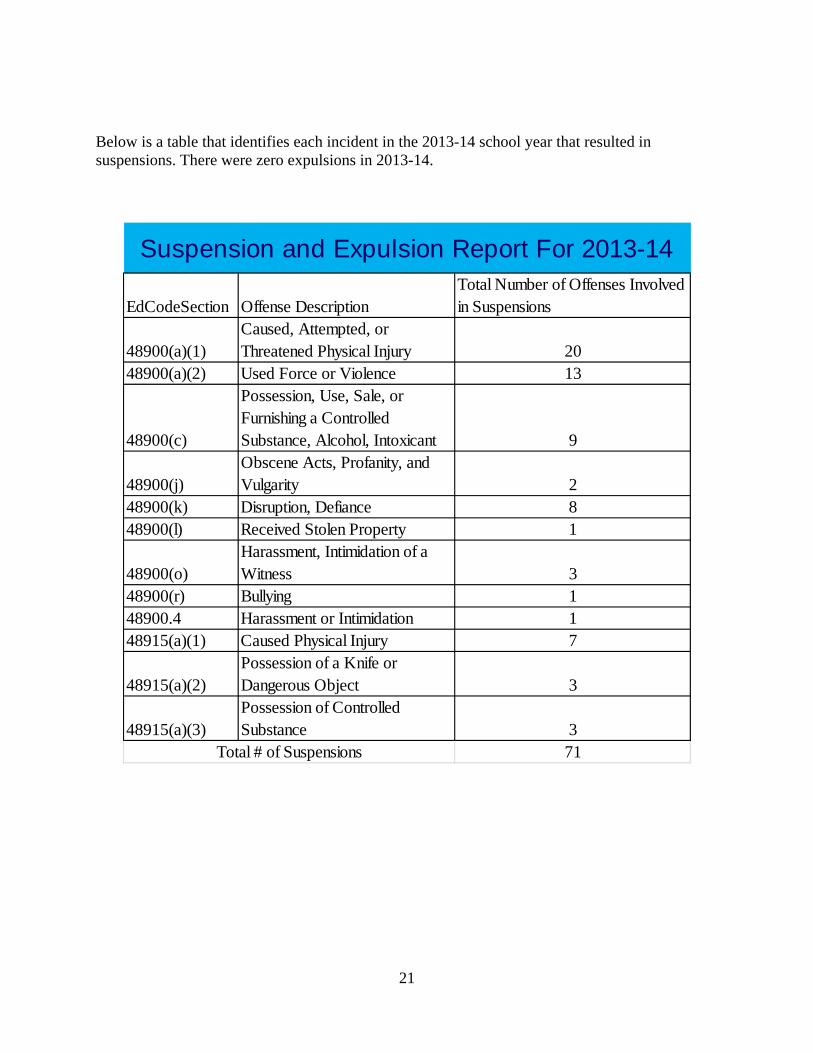
Below is a table that identifies each incident in the 2013-14 school year that resulted in suspensions. There were zero expulsions in 2013-14.
EdCodeSection Offense DescriptionTotal Number of Offenses Involved in Suspensions
48900(a)(1)Caused, Attempted, or Threatened Physical Injury 20
48900(a)(2) Used Force or Violence 13
48900(c)
Possession, Use, Sale, or Furnishing a Controlled Substance, Alcohol, Intoxicant 9
48900(j)Obscene Acts, Profanity, and Vulgarity 2
48900(k) Disruption, Defiance 848900(l) Received Stolen Property 1
48900(o)Harassment, Intimidation of a Witness 3
48900(r) Bullying 148900.4 Harassment or Intimidation 148915(a)(1) Caused Physical Injury 7
48915(a)(2)Possession of a Knife or Dangerous Object 3
48915(a)(3)Possession of Controlled Substance 3
71
Suspension and Expulsion Report For 2013-14
Total # of Suspensions
22
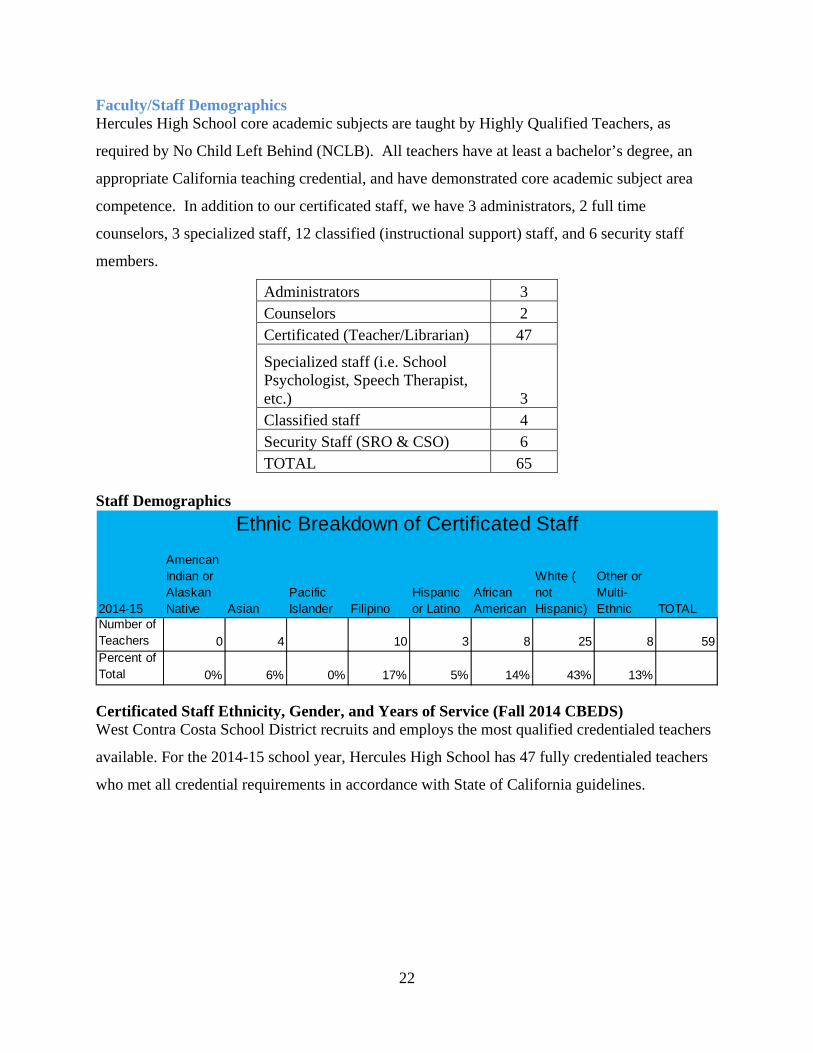
Faculty/Staff Demographics Hercules High School core academic subjects are taught by Highly Qualified Teachers, as
required by No Child Left Behind (NCLB). All teachers have at least a bachelor’s degree, an
appropriate California teaching credential, and have demonstrated core academic subject area
competence. In addition to our certificated staff, we have 3 administrators, 2 full time
counselors, 3 specialized staff, 12 classified (instructional support) staff, and 6 security staff
members.
Administrators 3 Counselors 2 Certificated (Teacher/Librarian) 47
Specialized staff (i.e. School Psychologist, Speech Therapist, etc.) 3 Classified staff 4 Security Staff (SRO & CSO) 6 TOTAL 65
Staff Demographics
2014-15
American Indian or Alaskan Native Asian
Pacific Islander Filipino
Hispanic or Latino
African American
White ( not Hispanic)
Other or Multi-Ethnic TOTAL
Number of Teachers 0 4 10 3 8 25 8 59Percent of Total 0% 6% 0% 17% 5% 14% 43% 13%
Ethnic Breakdown of Certificated Staff
Certificated Staff Ethnicity, Gender, and Years of Service (Fall 2014 CBEDS) West Contra Costa School District recruits and employs the most qualified credentialed teachers
available. For the 2014-15 school year, Hercules High School has 47 fully credentialed teachers
who met all credential requirements in accordance with State of California guidelines.
23
Security Staffing 4 Campus Security Officers (CSO) and 2 School Resource Officers (SRO) are assigned to
Hercules High School full time. Four CSOs are assigned to monitor, secure and respond to
situations for the entire campus. Some of their duties include but not limited to the following:
security clearance checks, lunch supervision, conflict mediation, and monitoring their designated
areas. The 2 SR0s assist in campus supervision, disciplinary investigations that may be
considered a criminal act, conflict mediation, social/emotional support of students who may be at
risk to themselves, and assist school staff maintain a safe learning environment. All security staff
personnel carry school issued radios to enhance communication with office staff, administration,
and amongst themselves.
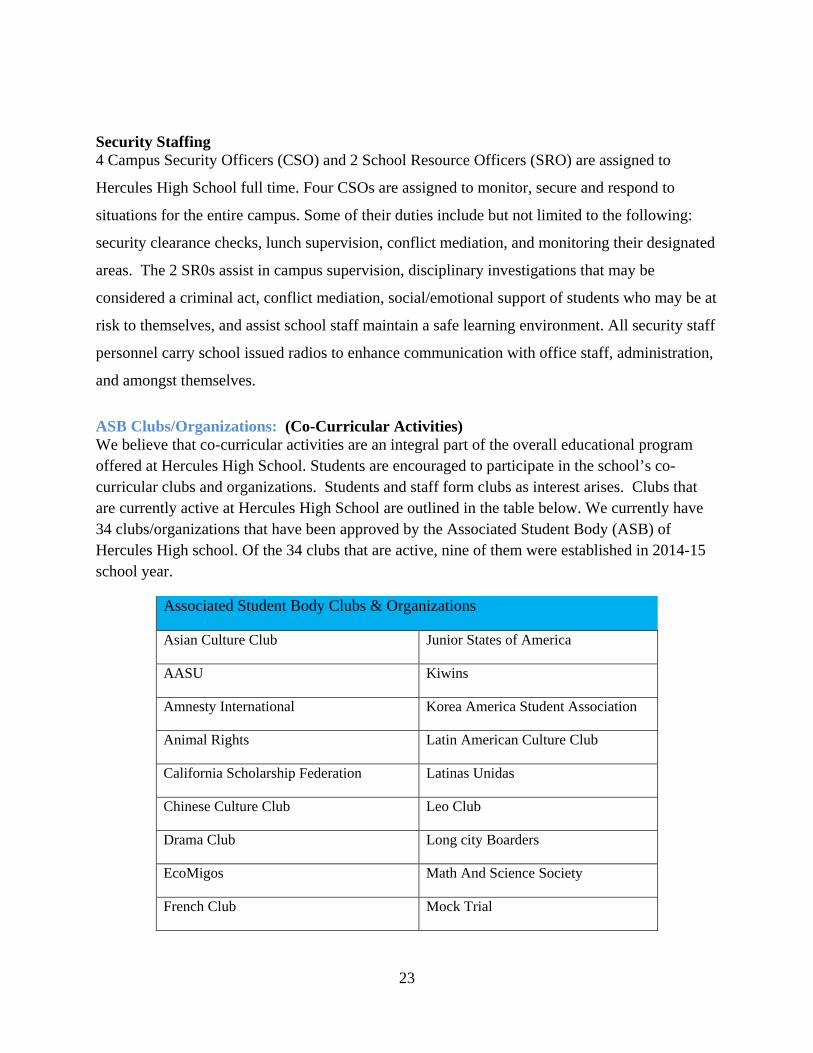
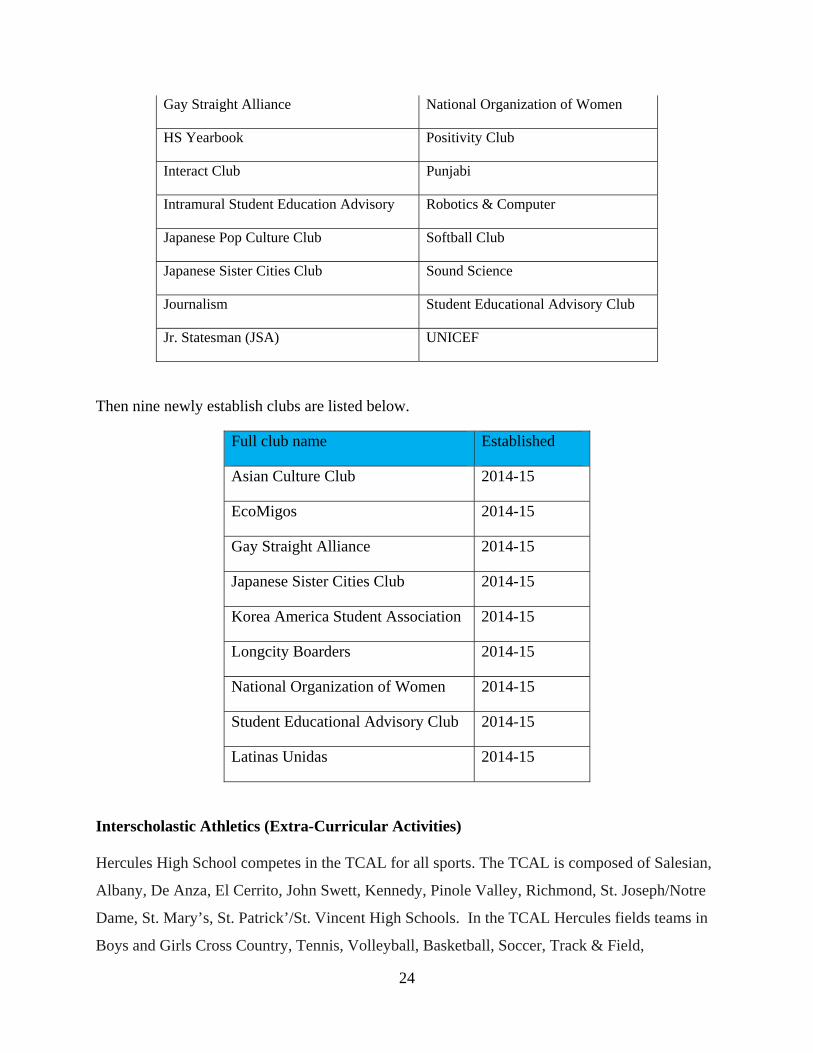
ASB Clubs/Organizations: (Co-Curricular Activities) We believe that co-curricular activities are an integral part of the overall educational program offered at Hercules High School. Students are encouraged to participate in the school’s co-curricular clubs and organizations. Students and staff form clubs as interest arises. Clubs that are currently active at Hercules High School are outlined in the table below. We currently have 34 clubs/organizations that have been approved by the Associated Student Body (ASB) of Hercules High school. Of the 34 clubs that are active, nine of them were established in 2014-15 school year.
Associated Student Body Clubs & Organizations
Asian Culture Club Junior States of America
AASU Kiwins
Amnesty International Korea America Student Association
Animal Rights Latin American Culture Club
California Scholarship Federation Latinas Unidas
Chinese Culture Club Leo Club
Drama Club Long city Boarders
EcoMigos Math And Science Society
French Club Mock Trial
24
Gay Straight Alliance National Organization of Women
HS Yearbook Positivity Club
Interact Club Punjabi
Intramural Student Education Advisory Robotics & Computer
Japanese Pop Culture Club Softball Club
Japanese Sister Cities Club Sound Science
Journalism Student Educational Advisory Club
Jr. Statesman (JSA) UNICEF
Then nine newly establish clubs are listed below.
Full club name Established
Asian Culture Club 2014-15
EcoMigos 2014-15
Gay Straight Alliance 2014-15
Japanese Sister Cities Club 2014-15
Korea America Student Association 2014-15
Longcity Boarders 2014-15
National Organization of Women 2014-15
Student Educational Advisory Club 2014-15
Latinas Unidas 2014-15
Interscholastic Athletics (Extra-Curricular Activities) Hercules High School competes in the TCAL for all sports. The TCAL is composed of Salesian,
Albany, De Anza, El Cerrito, John Swett, Kennedy, Pinole Valley, Richmond, St. Joseph/Notre
Dame, St. Mary’s, St. Patrick’/St. Vincent High Schools. In the TCAL Hercules fields teams in
Boys and Girls Cross Country, Tennis, Volleyball, Basketball, Soccer, Track & Field,
25
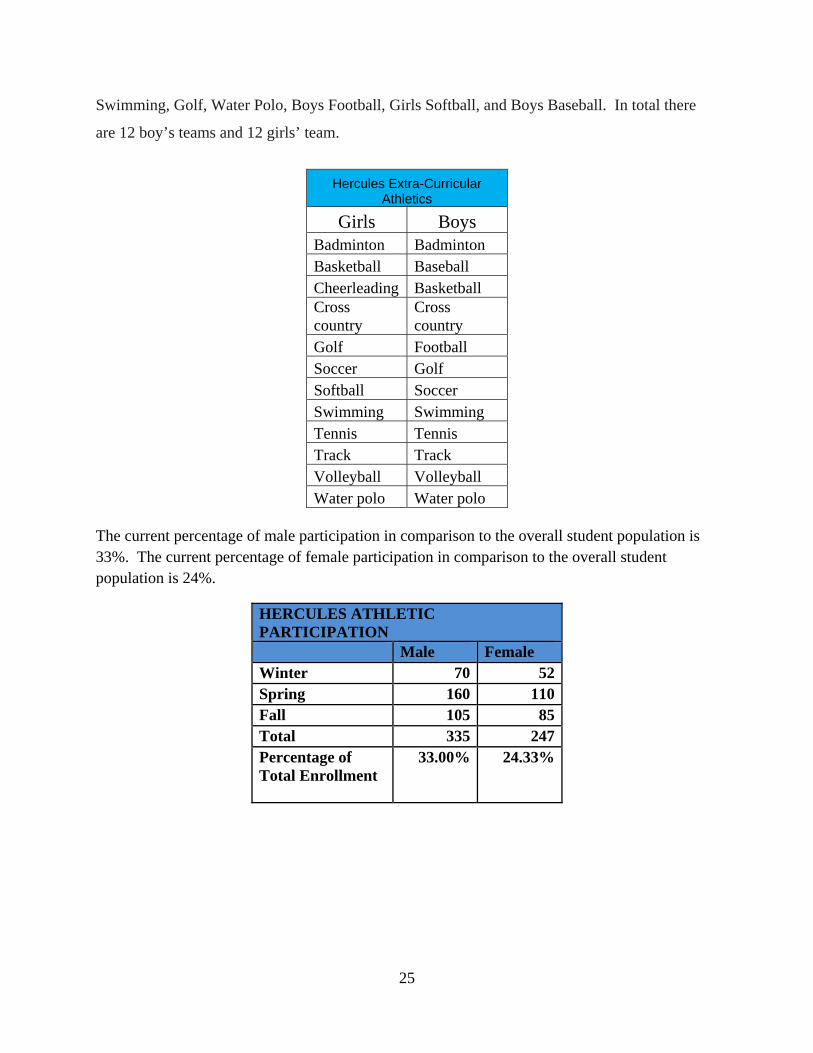
Swimming, Golf, Water Polo, Boys Football, Girls Softball, and Boys Baseball. In total there
are 12 boy’s teams and 12 girls’ team.
Hercules Extra-Curricular Athletics
Girls Boys Badminton Badminton Basketball Baseball Cheerleading Basketball Cross country
Cross country
Golf Football Soccer Golf Softball Soccer Swimming Swimming Tennis Tennis Track Track Volleyball Volleyball Water polo Water polo
The current percentage of male participation in comparison to the overall student population is 33%. The current percentage of female participation in comparison to the overall student population is 24%.
HERCULES ATHLETIC PARTICIPATION Male Female Winter 70 52 Spring 160 110 Fall 105 85 Total 335 247 Percentage of Total Enrollment
33.00% 24.33%
26
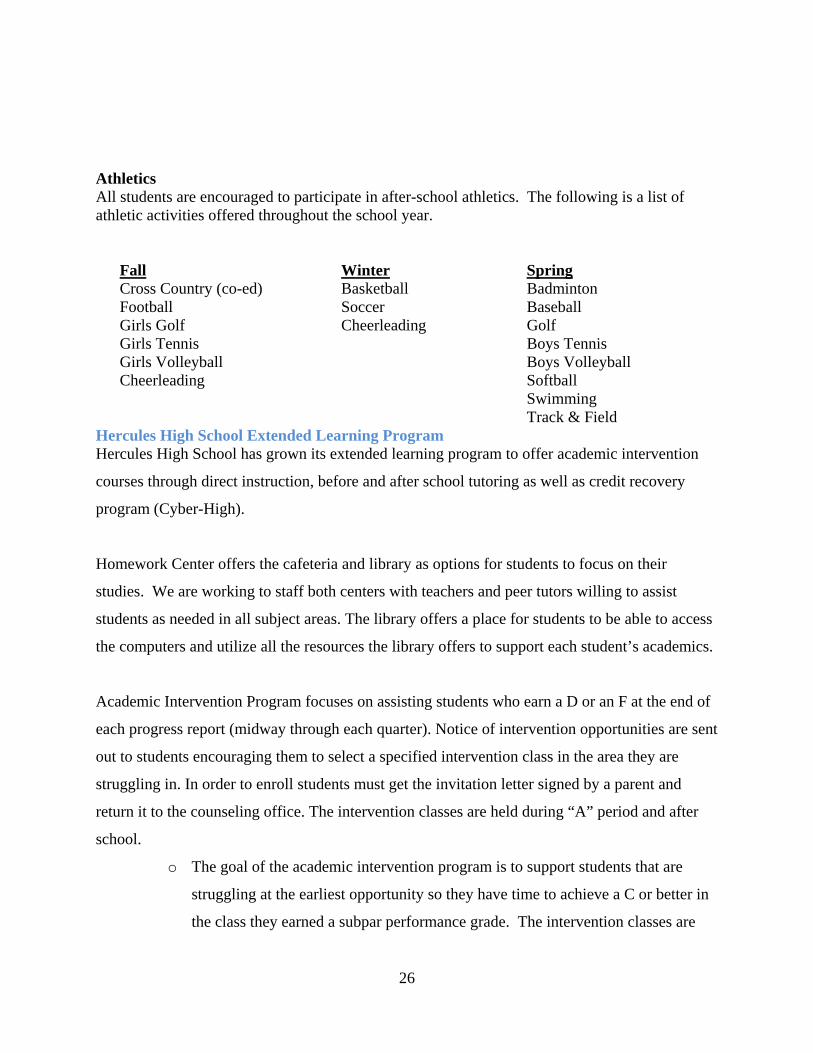
Athletics All students are encouraged to participate in after-school athletics. The following is a list of athletic activities offered throughout the school year.
Fall Winter Spring Cross Country (co-ed) Basketball Badminton Football Soccer Baseball Girls Golf Cheerleading Golf Girls Tennis Boys Tennis Girls Volleyball Boys Volleyball Cheerleading Softball Swimming Track & Field
Hercules High School Extended Learning Program Hercules High School has grown its extended learning program to offer academic intervention
courses through direct instruction, before and after school tutoring as well as credit recovery
program (Cyber-High).
Homework Center offers the cafeteria and library as options for students to focus on their
studies. We are working to staff both centers with teachers and peer tutors willing to assist
students as needed in all subject areas. The library offers a place for students to be able to access
the computers and utilize all the resources the library offers to support each student’s academics.
Academic Intervention Program focuses on assisting students who earn a D or an F at the end of
each progress report (midway through each quarter). Notice of intervention opportunities are sent
out to students encouraging them to select a specified intervention class in the area they are
struggling in. In order to enroll students must get the invitation letter signed by a parent and
return it to the counseling office. The intervention classes are held during “A” period and after
school.
o The goal of the academic intervention program is to support students that are
struggling at the earliest opportunity so they have time to achieve a C or better in
the class they earned a subpar performance grade. The intervention classes are
27
designed to provide direct instruction, re-teaching of missed concepts, assistance
with current class work and prepare for tests and quizzes.
Special Academic Programs Advanced Placement Policies
All HHS students may request to enroll in a more rigorous advanced placement (AP) course
assignment. By selecting an AP course, a student is committing to that course for at least one
complete semester. For the current school year, 2013-14, individual teachers stress the
commitment and communicate expected work load through individual class syllabus. We are in
the process of developing an AP agreement that is accepted by all AP teachers and
communicated to students and parents for the 2015-16 school year.
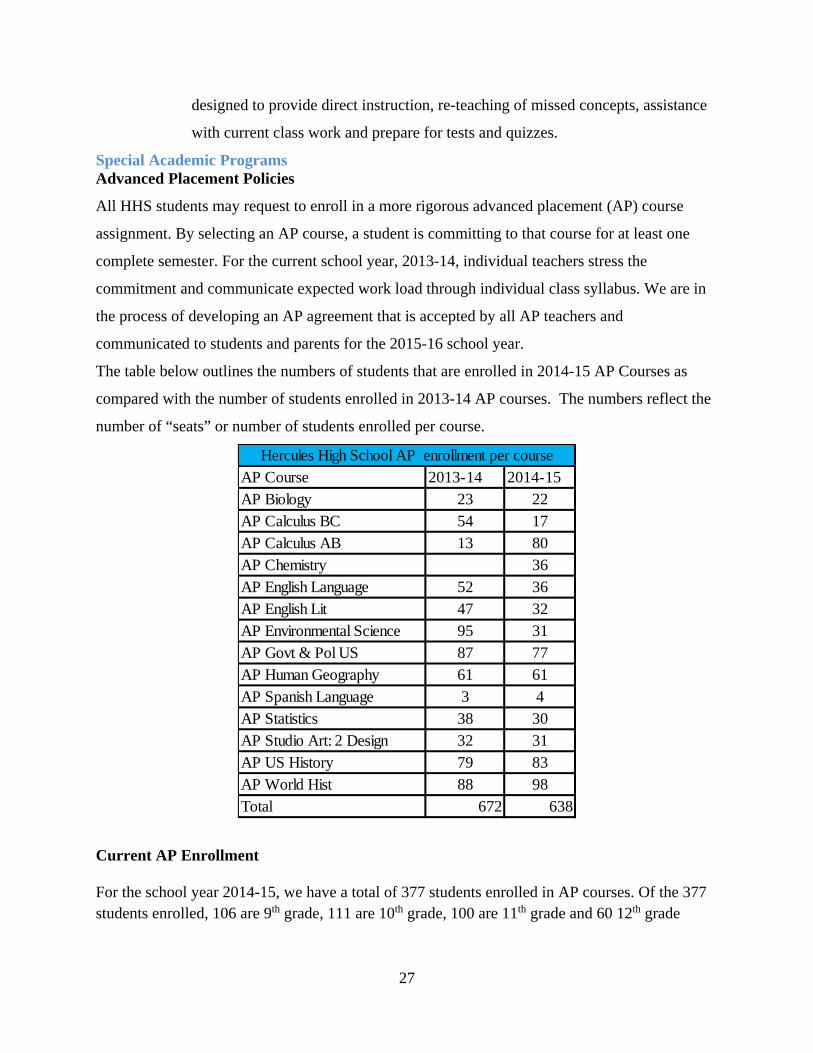
The table below outlines the numbers of students that are enrolled in 2014-15 AP Courses as
compared with the number of students enrolled in 2013-14 AP courses. The numbers reflect the
number of “seats” or number of students enrolled per course.
AP Course 2013-14 2014-15AP Biology 23 22AP Calculus BC 54 17AP Calculus AB 13 80AP Chemistry 36AP English Language 52 36AP English Lit 47 32AP Environmental Science 95 31AP Govt & Pol US 87 77AP Human Geography 61 61AP Spanish Language 3 4AP Statistics 38 30AP Studio Art: 2 Design 32 31AP US History 79 83AP World Hist 88 98Total 672 638
Hercules High School AP enrollment per course
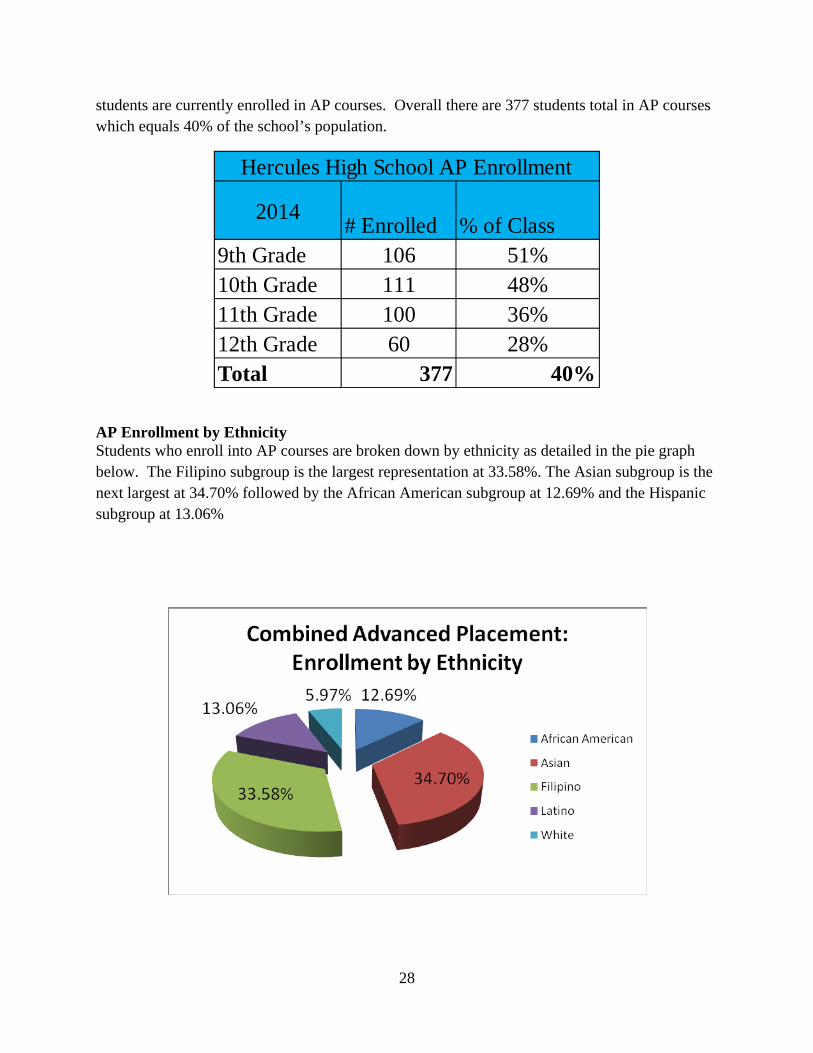
Current AP Enrollment For the school year 2014-15, we have a total of 377 students enrolled in AP courses. Of the 377 students enrolled, 106 are 9th grade, 111 are 10th grade, 100 are 11th grade and 60 12th grade
28
students are currently enrolled in AP courses. Overall there are 377 students total in AP courses which equals 40% of the school’s population.
2014# Enrolled % of Class
9th Grade 106 51%10th Grade 111 48%11th Grade 100 36%12th Grade 60 28%Total 377 40%
Hercules High School AP Enrollment
AP Enrollment by Ethnicity Students who enroll into AP courses are broken down by ethnicity as detailed in the pie graph below. The Filipino subgroup is the largest representation at 33.58%. The Asian subgroup is the next largest at 34.70% followed by the African American subgroup at 12.69% and the Hispanic subgroup at 13.06%
29
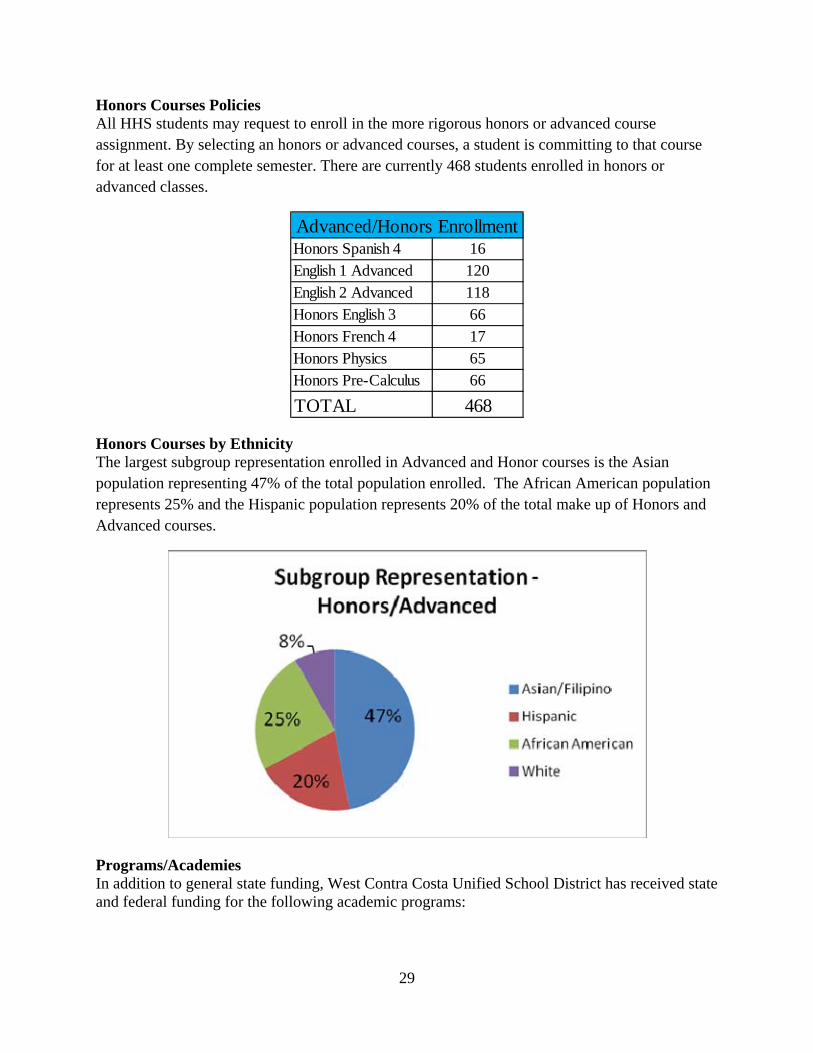
Honors Courses Policies All HHS students may request to enroll in the more rigorous honors or advanced course assignment. By selecting an honors or advanced courses, a student is committing to that course for at least one complete semester. There are currently 468 students enrolled in honors or advanced classes.
Honors Spanish 4 16English 1 Advanced 120English 2 Advanced 118Honors English 3 66Honors French 4 17Honors Physics 65Honors Pre-Calculus 66
TOTAL 468
Advanced/Honors Enrollment
Honors Courses by Ethnicity The largest subgroup representation enrolled in Advanced and Honor courses is the Asian population representing 47% of the total population enrolled. The African American population represents 25% and the Hispanic population represents 20% of the total make up of Honors and Advanced courses.
Programs/Academies In addition to general state funding, West Contra Costa Unified School District has received state and federal funding for the following academic programs:
30
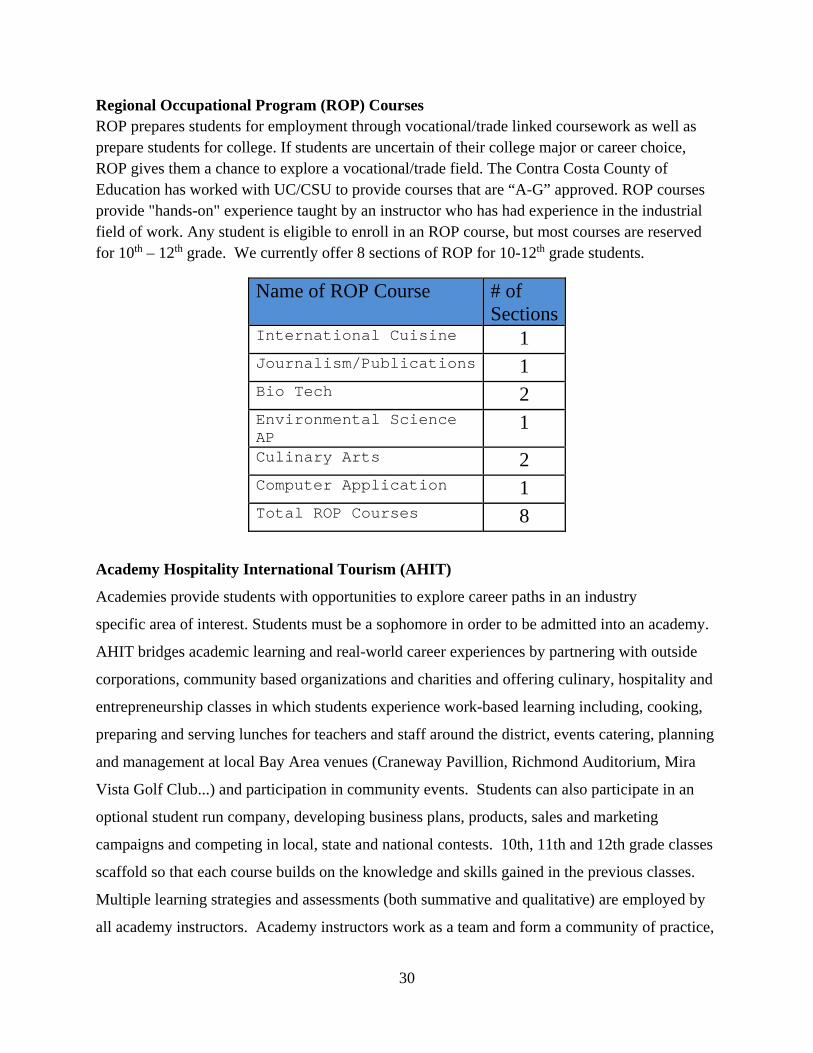
Regional Occupational Program (ROP) Courses ROP prepares students for employment through vocational/trade linked coursework as well as prepare students for college. If students are uncertain of their college major or career choice, ROP gives them a chance to explore a vocational/trade field. The Contra Costa County of Education has worked with UC/CSU to provide courses that are “A-G” approved. ROP courses provide "hands-on" experience taught by an instructor who has had experience in the industrial field of work. Any student is eligible to enroll in an ROP course, but most courses are reserved for 10th – 12th grade. We currently offer 8 sections of ROP for 10-12th grade students.
Name of ROP Course # of Sections
International Cuisine 1 Journalism/Publications 1 Bio Tech 2 Environmental Science AP
1
Culinary Arts 2 Computer Application 1 Total ROP Courses 8
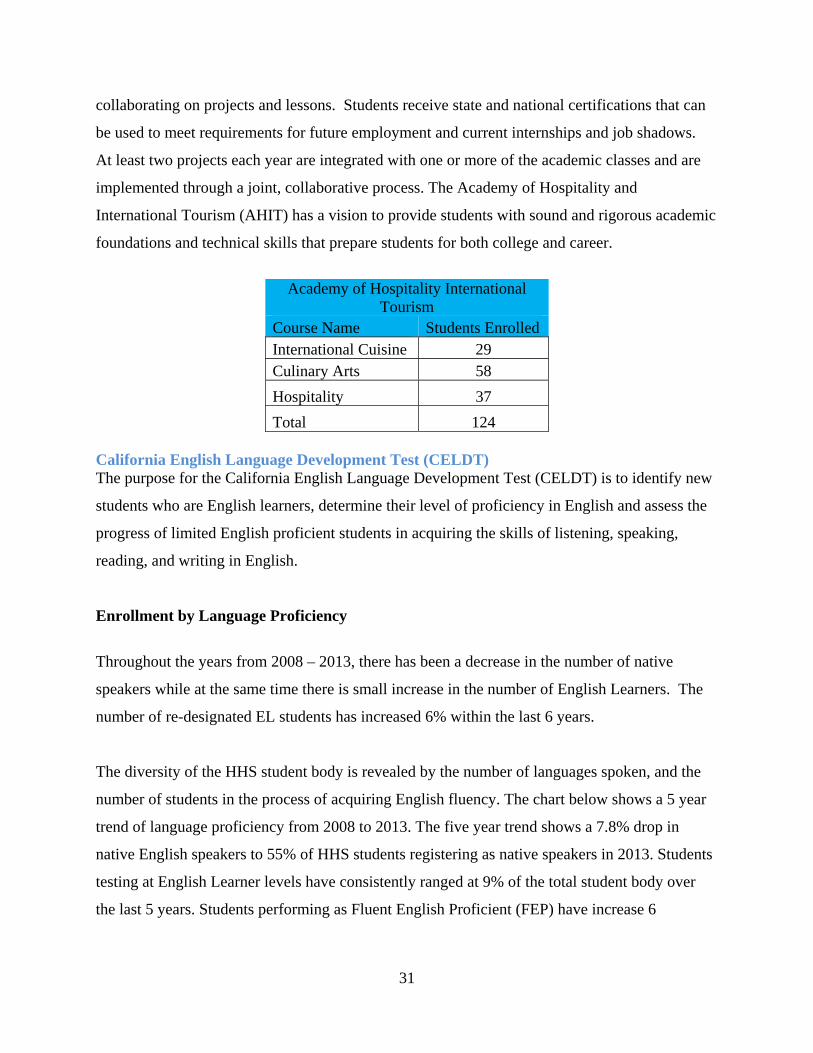
Academy Hospitality International Tourism (AHIT)
Academies provide students with opportunities to explore career paths in an industry
specific area of interest. Students must be a sophomore in order to be admitted into an academy.
AHIT bridges academic learning and real-world career experiences by partnering with outside
corporations, community based organizations and charities and offering culinary, hospitality and
entrepreneurship classes in which students experience work-based learning including, cooking,
preparing and serving lunches for teachers and staff around the district, events catering, planning
and management at local Bay Area venues (Craneway Pavillion, Richmond Auditorium, Mira
Vista Golf Club...) and participation in community events. Students can also participate in an
optional student run company, developing business plans, products, sales and marketing
campaigns and competing in local, state and national contests. 10th, 11th and 12th grade classes
scaffold so that each course builds on the knowledge and skills gained in the previous classes.
Multiple learning strategies and assessments (both summative and qualitative) are employed by
all academy instructors. Academy instructors work as a team and form a community of practice,
31
collaborating on projects and lessons. Students receive state and national certifications that can
be used to meet requirements for future employment and current internships and job shadows.
At least two projects each year are integrated with one or more of the academic classes and are
implemented through a joint, collaborative process. The Academy of Hospitality and
International Tourism (AHIT) has a vision to provide students with sound and rigorous academic
foundations and technical skills that prepare students for both college and career.
Academy of Hospitality International
Tourism Course Name Students Enrolled International Cuisine 29 Culinary Arts 58
Hospitality 37
Total 124 California English Language Development Test (CELDT) The purpose for the California English Language Development Test (CELDT) is to identify new
students who are English learners, determine their level of proficiency in English and assess the
progress of limited English proficient students in acquiring the skills of listening, speaking,
reading, and writing in English.
Enrollment by Language Proficiency
Throughout the years from 2008 – 2013, there has been a decrease in the number of native
speakers while at the same time there is small increase in the number of English Learners. The
number of re-designated EL students has increased 6% within the last 6 years.
The diversity of the HHS student body is revealed by the number of languages spoken, and the
number of students in the process of acquiring English fluency. The chart below shows a 5 year
trend of language proficiency from 2008 to 2013. The five year trend shows a 7.8% drop in
native English speakers to 55% of HHS students registering as native speakers in 2013. Students
testing at English Learner levels have consistently ranged at 9% of the total student body over
the last 5 years. Students performing as Fluent English Proficient (FEP) have increase 6
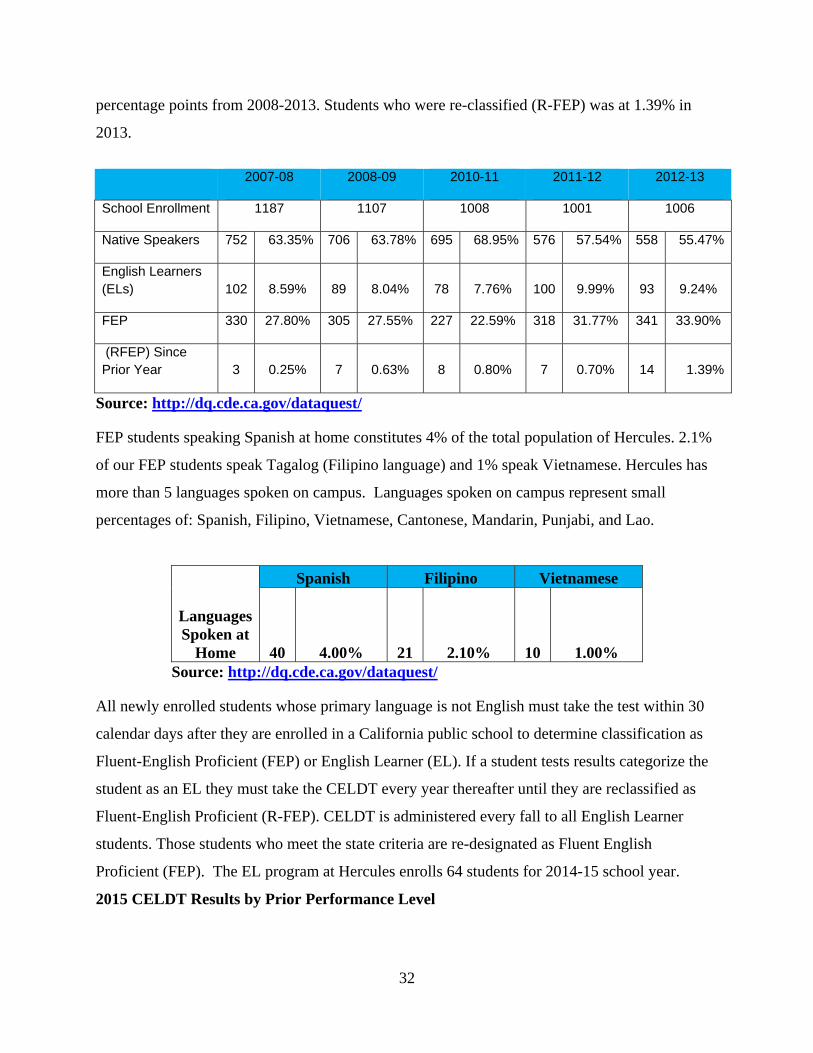
32
percentage points from 2008-2013. Students who were re-classified (R-FEP) was at 1.39% in
2013.
2007-08 2008-09 2010-11 2011-12 2012-13
School Enrollment 1187 1107 1008 1001 1006
Native Speakers 752 63.35% 706 63.78% 695 68.95% 576 57.54% 558 55.47%
English Learners (ELs) 102 8.59% 89 8.04% 78 7.76% 100 9.99% 93 9.24%
FEP 330 27.80% 305 27.55% 227 22.59% 318 31.77% 341 33.90%
(RFEP) Since Prior Year 3 0.25% 7 0.63% 8 0.80% 7 0.70% 14 1.39%
Source: http://dq.cde.ca.gov/dataquest/
FEP students speaking Spanish at home constitutes 4% of the total population of Hercules. 2.1%
of our FEP students speak Tagalog (Filipino language) and 1% speak Vietnamese. Hercules has
more than 5 languages spoken on campus. Languages spoken on campus represent small
percentages of: Spanish, Filipino, Vietnamese, Cantonese, Mandarin, Punjabi, and Lao.
Languages Spoken at
Home
Spanish Filipino Vietnamese
40 4.00% 21 2.10% 10 1.00% Source: http://dq.cde.ca.gov/dataquest/
All newly enrolled students whose primary language is not English must take the test within 30
calendar days after they are enrolled in a California public school to determine classification as
Fluent-English Proficient (FEP) or English Learner (EL). If a student tests results categorize the
student as an EL they must take the CELDT every year thereafter until they are reclassified as
Fluent-English Proficient (R-FEP). CELDT is administered every fall to all English Learner
students. Those students who meet the state criteria are re-designated as Fluent English
Proficient (FEP). The EL program at Hercules enrolls 64 students for 2014-15 school year.
2015 CELDT Results by Prior Performance Level
33
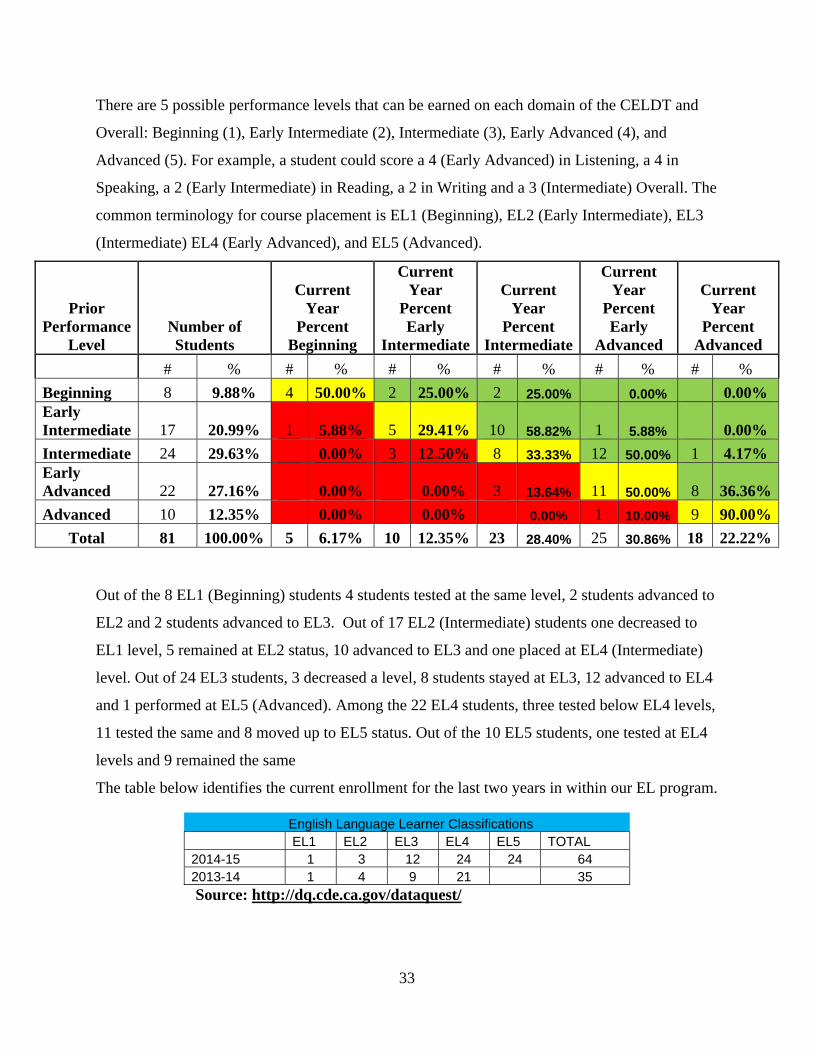
There are 5 possible performance levels that can be earned on each domain of the CELDT and
Overall: Beginning (1), Early Intermediate (2), Intermediate (3), Early Advanced (4), and
Advanced (5). For example, a student could score a 4 (Early Advanced) in Listening, a 4 in
Speaking, a 2 (Early Intermediate) in Reading, a 2 in Writing and a 3 (Intermediate) Overall. The
common terminology for course placement is EL1 (Beginning), EL2 (Early Intermediate), EL3
(Intermediate) EL4 (Early Advanced), and EL5 (Advanced).
Prior Performance
Level Number of Students
Current Year
Percent Beginning
Current Year
Percent Early
Intermediate
Current Year
Percent Intermediate
Current Year
Percent Early
Advanced
Current Year
Percent Advanced
# % # % # % # % # % # %
Beginning 8 9.88% 4 50.00% 2 25.00% 2 25.00% 0.00% 0.00% Early Intermediate 17 20.99% 1 5.88% 5 29.41% 10 58.82% 1 5.88% 0.00%
Intermediate 24 29.63% 0.00% 3 12.50% 8 33.33% 12 50.00% 1 4.17% Early Advanced 22 27.16% 0.00% 0.00% 3 13.64% 11 50.00% 8 36.36%
Advanced 10 12.35% 0.00% 0.00% 0.00% 1 10.00% 9 90.00%
Total 81 100.00% 5 6.17% 10 12.35% 23 28.40% 25 30.86% 18 22.22%
Out of the 8 EL1 (Beginning) students 4 students tested at the same level, 2 students advanced to
EL2 and 2 students advanced to EL3. Out of 17 EL2 (Intermediate) students one decreased to
EL1 level, 5 remained at EL2 status, 10 advanced to EL3 and one placed at EL4 (Intermediate)
level. Out of 24 EL3 students, 3 decreased a level, 8 students stayed at EL3, 12 advanced to EL4
and 1 performed at EL5 (Advanced). Among the 22 EL4 students, three tested below EL4 levels,
11 tested the same and 8 moved up to EL5 status. Out of the 10 EL5 students, one tested at EL4
levels and 9 remained the same
The table below identifies the current enrollment for the last two years in within our EL program.
English Language Learner Classifications EL1 EL2 EL3 EL4 EL5 TOTAL 2014-15 1 3 12 24 24 64 2013-14 1 4 9 21 35
Source: http://dq.cde.ca.gov/dataquest/
34
Student Achievement Data In 2013, Assembly Bill (AB) 484 suspended the state’s Standardized Testing and Reporting
(STAR) program. This marked the transition to Smarter Balanced Assessment Consortium
(SBAC), the new assessment tool aligned to the Common Core State Standards. Starting in the
spring of 2015 the California Department of Education will implement the new California
Assessment of Student Performance and Progress (CASPP). The California Assessment of
Student Performance and Progress (CASPP) will include some CSTs for 10th grade as well as
SBAC for the 11th grade students in English Language Arts (ELA) and Mathematics. In addition
we also measure student success utilizing the California High School Exit Exam (CAHSEE),
SAT/PSAT(college entrance exams), district benchmark assessments, graduation rates, and Ds &
Fs list ( core academic success rates) and others as identified. As part of our WASC self-study
process, we first analyzed our students’ achievement in terms of state and federal accountability
systems. Second, we looked at our students’ performance in relation to state standards which
include CAHSEE results. Third, we examined our 12th grade students’ success in meeting
UC/CSU requirements. Lastly, we monitor core academic success rates, honor roll (above a 3.0)
and students receiving Ds and Fs.
State & Federal Accountability Systems Academic Performance Index (API)
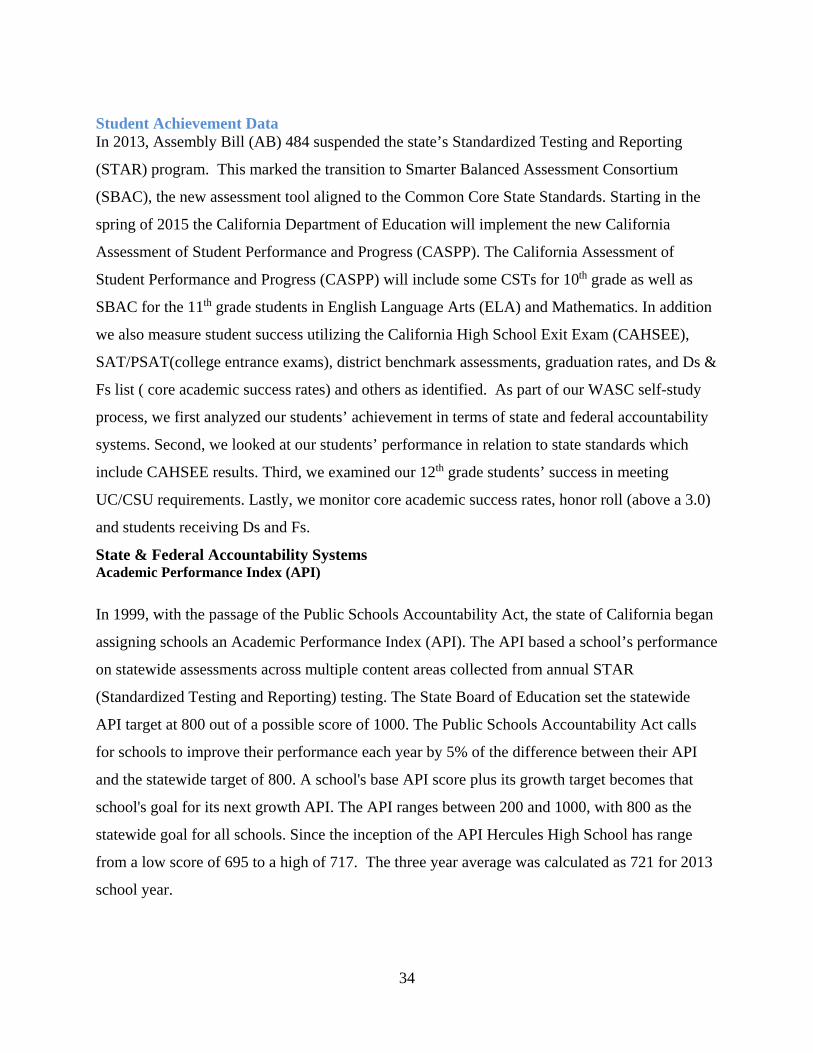
In 1999, with the passage of the Public Schools Accountability Act, the state of California began
assigning schools an Academic Performance Index (API). The API based a school’s performance
on statewide assessments across multiple content areas collected from annual STAR
(Standardized Testing and Reporting) testing. The State Board of Education set the statewide
API target at 800 out of a possible score of 1000. The Public Schools Accountability Act calls
for schools to improve their performance each year by 5% of the difference between their API
and the statewide target of 800. A school's base API score plus its growth target becomes that
school's goal for its next growth API. The API ranges between 200 and 1000, with 800 as the
statewide goal for all schools. Since the inception of the API Hercules High School has range
from a low score of 695 to a high of 717. The three year average was calculated as 721 for 2013
school year.
35
Source: http://dq.cde.ca.gov/dataquest/ Historical API Subgroup Performance (2009-2012) Numerically significant subgroups are defined by the state as having at least 100 students in the
group who have valid test scores. Subgroups include the following ethnic and socioeconomic
categories: African American or Black (not of Hispanic origin), American Indian or Alaska
Native, Asian, Filipino, Hispanic or Latino, Pacific Islander and White (not of Hispanic origin),
plus socioeconomically disadvantaged. Students are categorized as socioeconomically
disadvantaged if they participate in the federal free and reduced-price lunch program.
The state goal for the API is 800. All student subgroups that score below 800 are assigned an
API improvement target each year. Hercules High School did not meet all student subgroup API
targets in 2013.
36
Source: http://dq.cde.ca.gov/dataquest/
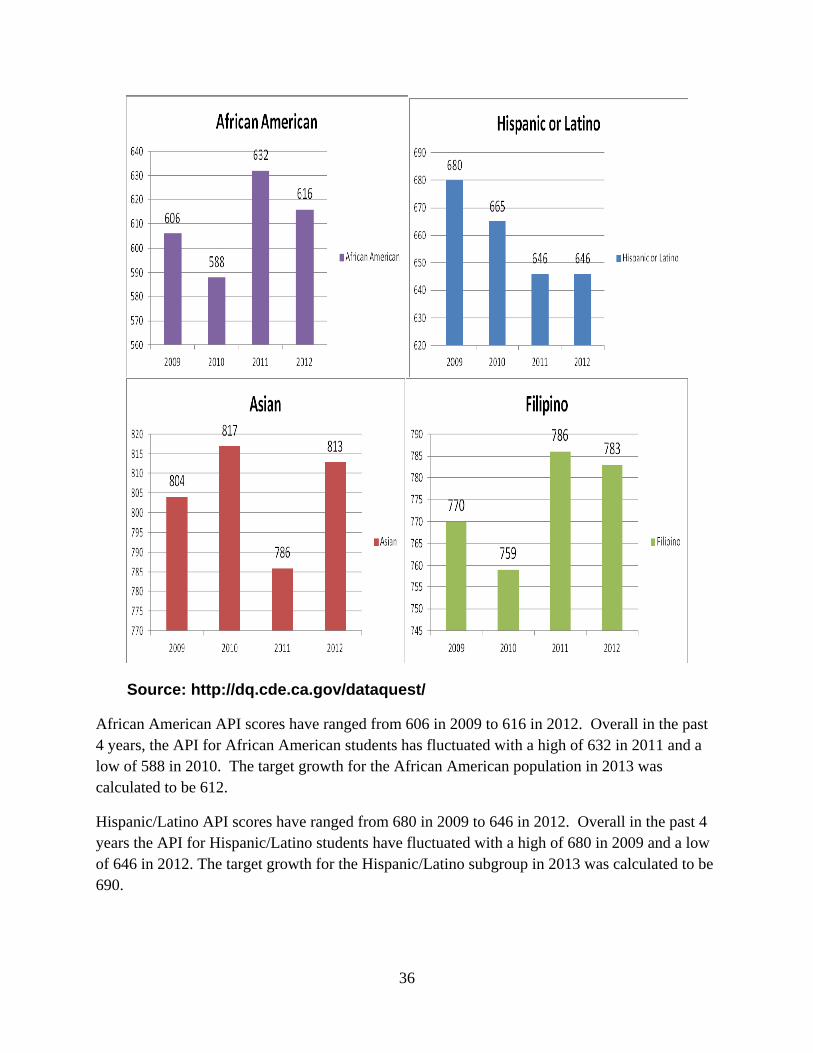
African American API scores have ranged from 606 in 2009 to 616 in 2012. Overall in the past 4 years, the API for African American students has fluctuated with a high of 632 in 2011 and a low of 588 in 2010. The target growth for the African American population in 2013 was calculated to be 612.
Hispanic/Latino API scores have ranged from 680 in 2009 to 646 in 2012. Overall in the past 4 years the API for Hispanic/Latino students have fluctuated with a high of 680 in 2009 and a low of 646 in 2012. The target growth for the Hispanic/Latino subgroup in 2013 was calculated to be 690.
37
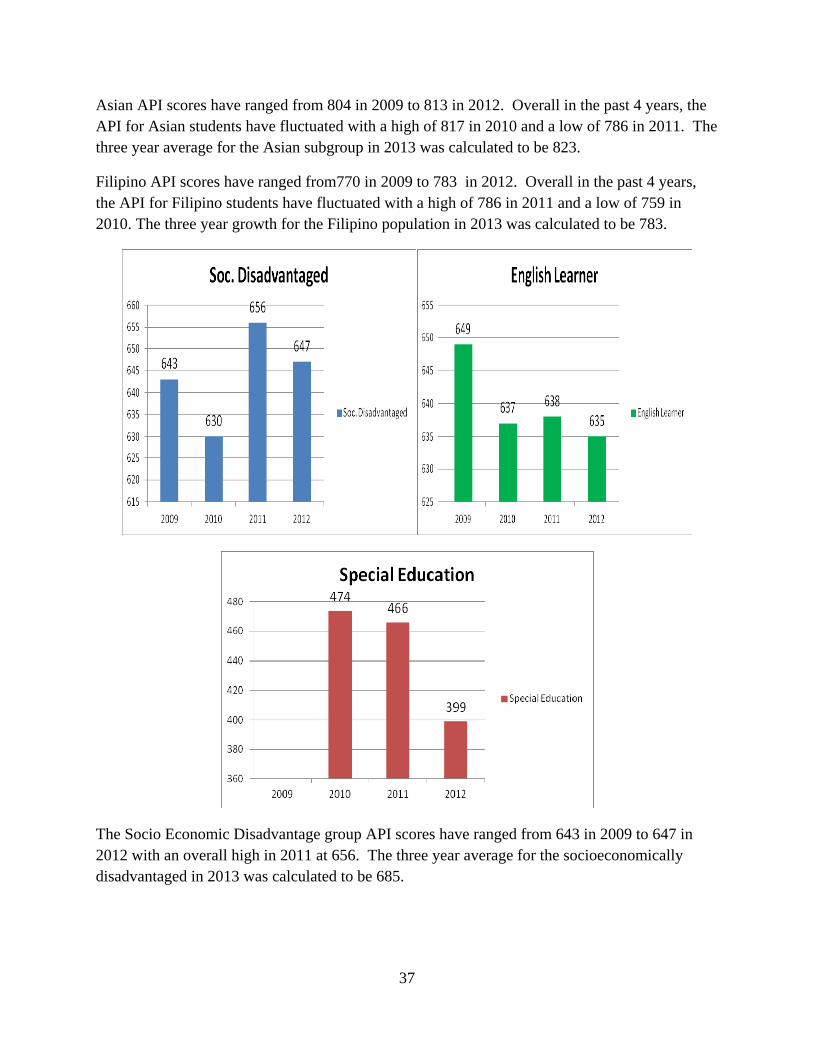
Asian API scores have ranged from 804 in 2009 to 813 in 2012. Overall in the past 4 years, the API for Asian students have fluctuated with a high of 817 in 2010 and a low of 786 in 2011. The three year average for the Asian subgroup in 2013 was calculated to be 823.
Filipino API scores have ranged from770 in 2009 to 783 in 2012. Overall in the past 4 years, the API for Filipino students have fluctuated with a high of 786 in 2011 and a low of 759 in 2010. The three year growth for the Filipino population in 2013 was calculated to be 783.
The Socio Economic Disadvantage group API scores have ranged from 643 in 2009 to 647 in 2012 with an overall high in 2011 at 656. The three year average for the socioeconomically disadvantaged in 2013 was calculated to be 685.
38
The English Learner group API scores have ranged from 649 in 2009 to 635 in 2012 with an overall high in 2009 at 649. The three year average for the English Learner subgroup in 2013 was calculated to be 687.
The Special Education group API scores have ranged from 474 in 2010 to 399 in 2012 with an overall high in 2010 at 474. The three year average for the special education subgroup in 2013 was calculated to be 535.
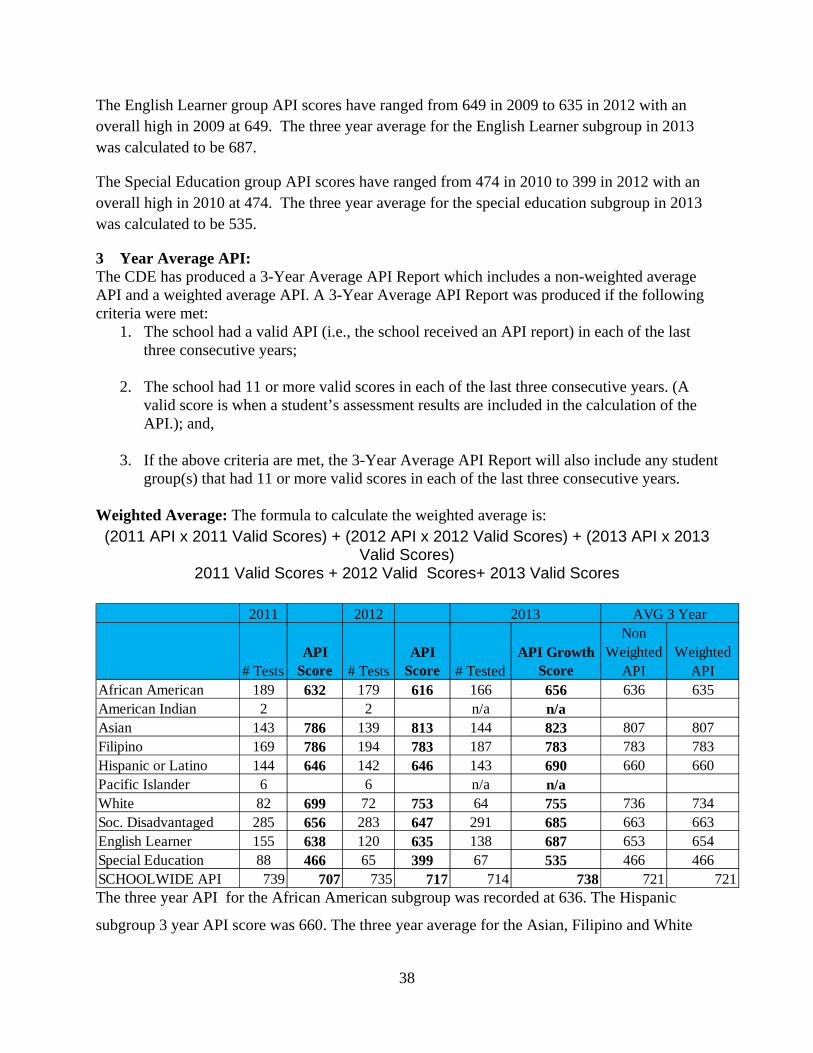
3 Year Average API: The CDE has produced a 3-Year Average API Report which includes a non-weighted average API and a weighted average API. A 3-Year Average API Report was produced if the following criteria were met:
1. The school had a valid API (i.e., the school received an API report) in each of the last three consecutive years;
2. The school had 11 or more valid scores in each of the last three consecutive years. (A valid score is when a student’s assessment results are included in the calculation of the API.); and,
3. If the above criteria are met, the 3-Year Average API Report will also include any student group(s) that had 11 or more valid scores in each of the last three consecutive years.
Weighted Average: The formula to calculate the weighted average is: (2011 API x 2011 Valid Scores) + (2012 API x 2012 Valid Scores) + (2013 API x 2013
Valid Scores) 2011 Valid Scores + 2012 Valid Scores+ 2013 Valid Scores
2011 2012
# TestsAPI
Score # TestsAPI
Score # TestedAPI Growth
Score
Non Weighted
APIWeighted
APIAfrican American 189 632 179 616 166 656 636 635American Indian 2 2 n/a n/aAsian 143 786 139 813 144 823 807 807Filipino 169 786 194 783 187 783 783 783Hispanic or Latino 144 646 142 646 143 690 660 660Pacific Islander 6 6 n/a n/aWhite 82 699 72 753 64 755 736 734Soc. Disadvantaged 285 656 283 647 291 685 663 663English Learner 155 638 120 635 138 687 653 654Special Education 88 466 65 399 67 535 466 466SCHOOLWIDE API 739 707 735 717 714 738 721 721
2013 AVG 3 Year
The three year API for the African American subgroup was recorded at 636. The Hispanic
subgroup 3 year API score was 660. The three year average for the Asian, Filipino and White
39
were at 807, 783, and 736 respectively. Within the specialized population, students with
disabilities scored a three year average of 535, the socioeconomically disadvantaged cohort was
at 685 and the English Learners scored at a 687 API. The school wide three year running average
was calculated to be 721.
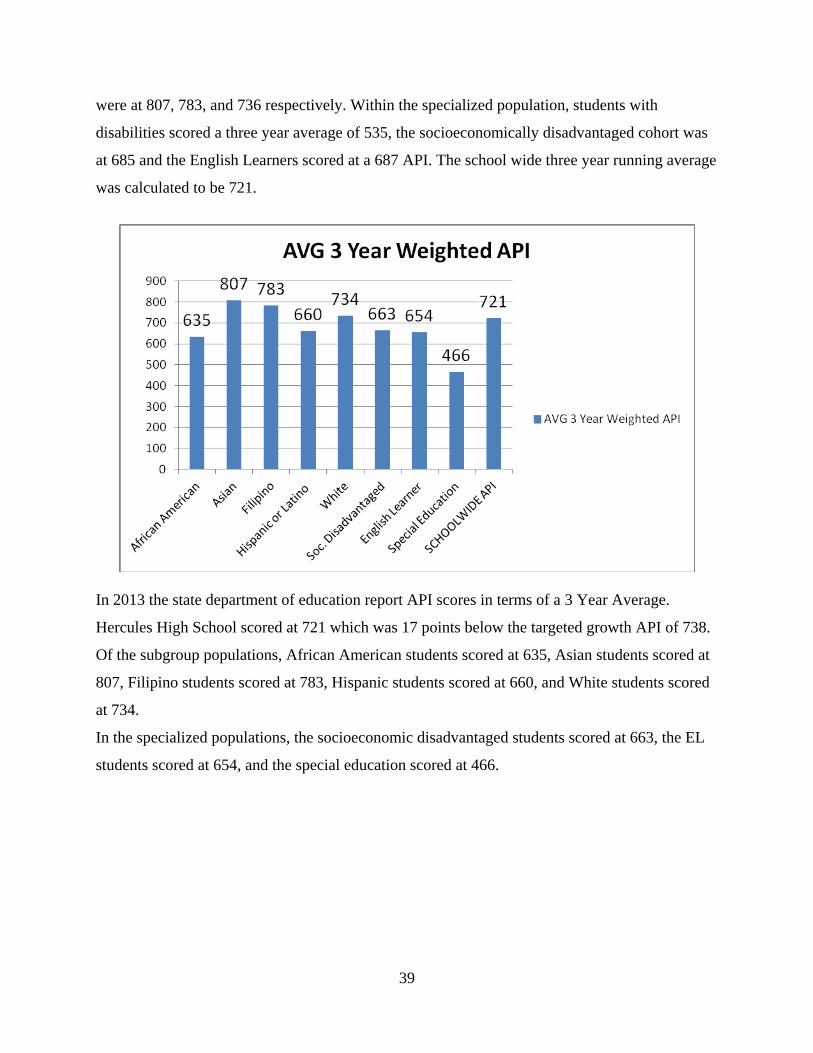
In 2013 the state department of education report API scores in terms of a 3 Year Average.
Hercules High School scored at 721 which was 17 points below the targeted growth API of 738.
Of the subgroup populations, African American students scored at 635, Asian students scored at
807, Filipino students scored at 783, Hispanic students scored at 660, and White students scored
at 734.
In the specialized populations, the socioeconomic disadvantaged students scored at 663, the EL
students scored at 654, and the special education scored at 466.
40
In 2012, Senate Bill (SB) 1458, called for significant changes to the composition of the state’s
high school Academic Performance Index (API). In 2014, the California State Board of
Education decided not to produce a Growth API for two years during the transition to the state’s
new Common Core standards and Smarter Balanced assessments. New API and
STAR/California Standards Test (CST) data will not be available for 2013-14. Until results from
the new Smarter Balanced assessments are available, the Department will calculate a 3-year
average API in May 2014, as authorized by AB 484.
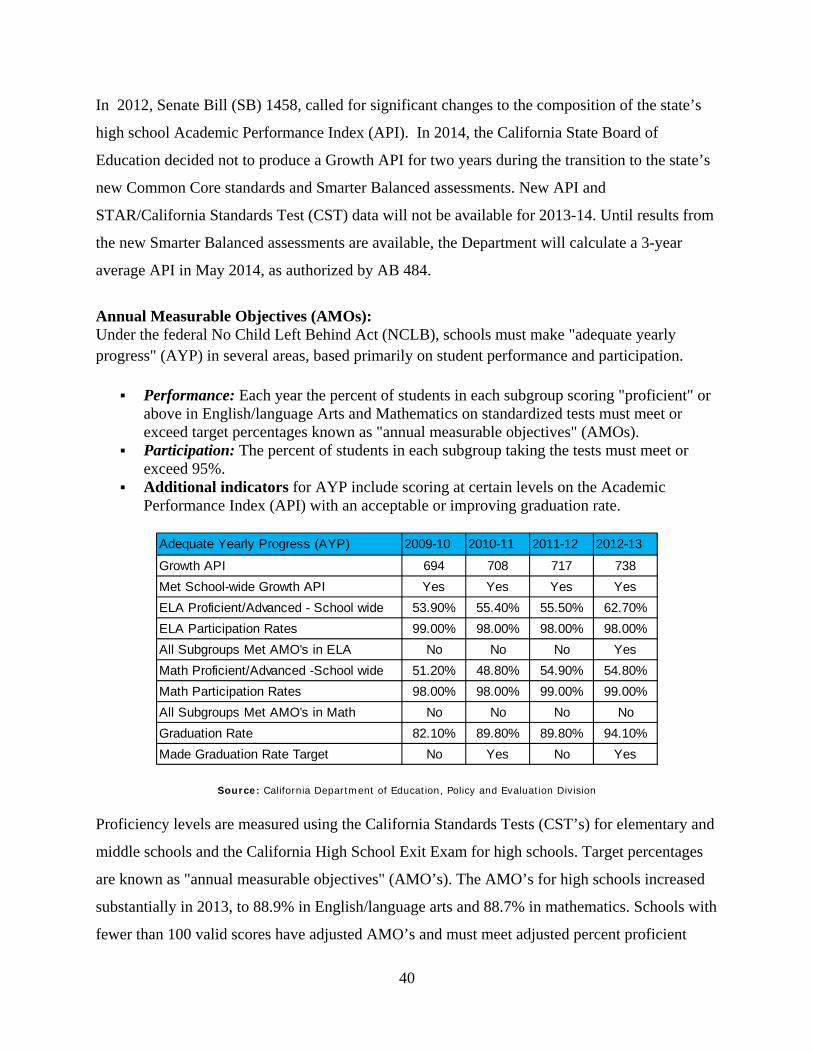
Annual Measurable Objectives (AMOs): Under the federal No Child Left Behind Act (NCLB), schools must make "adequate yearly progress" (AYP) in several areas, based primarily on student performance and participation.
Performance: Each year the percent of students in each subgroup scoring "proficient" or above in English/language Arts and Mathematics on standardized tests must meet or exceed target percentages known as "annual measurable objectives" (AMOs).
Participation: The percent of students in each subgroup taking the tests must meet or exceed 95%.
Additional indicators for AYP include scoring at certain levels on the Academic Performance Index (API) with an acceptable or improving graduation rate.
Adequate Yearly Progress (AYP) 2009-10 2010-11 2011-12 2012-13
Growth API 694 708 717 738
Met School-wide Growth API Yes Yes Yes Yes
ELA Proficient/Advanced - School wide 53.90% 55.40% 55.50% 62.70%
ELA Participation Rates 99.00% 98.00% 98.00% 98.00%
All Subgroups Met AMO's in ELA No No No Yes
Math Proficient/Advanced -School wide 51.20% 48.80% 54.90% 54.80%
Math Participation Rates 98.00% 98.00% 99.00% 99.00%
All Subgroups Met AMO's in Math No No No No
Graduation Rate 82.10% 89.80% 89.80% 94.10%
Made Graduation Rate Target No Yes No Yes
Source: California Department of Education, Policy and Evaluation Division
Proficiency levels are measured using the California Standards Tests (CST’s) for elementary and
middle schools and the California High School Exit Exam for high schools. Target percentages
are known as "annual measurable objectives" (AMO’s). The AMO’s for high schools increased
substantially in 2013, to 88.9% in English/language arts and 88.7% in mathematics. Schools with
fewer than 100 valid scores have adjusted AMO’s and must meet adjusted percent proficient
41
targets. The original NCLB legislation had a goal of 100% proficiency by the 2013-2014 school
year. In 2012 the United States Department of Education (USDOE) granted states permission to
freeze AMOs at the 2010-2011 level. This means that the tests that were administered last spring
will be judged by the 2010-2011 AMOs instead of the stepped-up 2011-2012 AMOs.
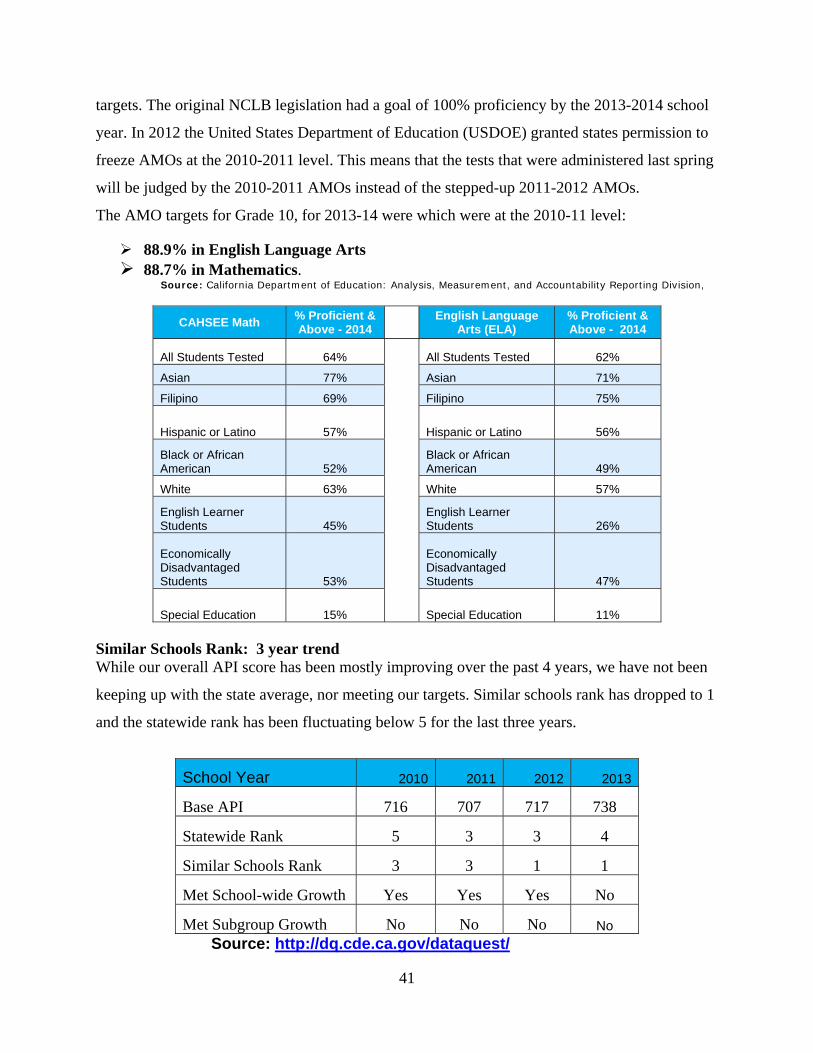
The AMO targets for Grade 10, for 2013-14 were which were at the 2010-11 level:
88.9% in English Language Arts 88.7% in Mathematics.
Source: California Department of Education: Analysis, Measurement, and Accountability Reporting Division,
CAHSEE Math % Proficient & Above - 2014
English Language Arts (ELA)
% Proficient & Above - 2014
All Students Tested 64% All Students Tested 62%
Asian 77% Asian 71%
Filipino 69% Filipino 75%
Hispanic or Latino 57% Hispanic or Latino 56%
Black or African American 52%
Black or African American 49%
White 63% White 57%
English Learner Students 45%
English Learner Students 26%
Economically Disadvantaged Students 53%
Economically Disadvantaged Students 47%
Special Education 15% Special Education 11%
Similar Schools Rank: 3 year trend While our overall API score has been mostly improving over the past 4 years, we have not been
keeping up with the state average, nor meeting our targets. Similar schools rank has dropped to 1
and the statewide rank has been fluctuating below 5 for the last three years.
School Year 2010 2011 2012 2013
Base API 716 707 717 738
Statewide Rank 5 3 3 4
Similar Schools Rank 3 3 1 1
Met School-wide Growth Yes Yes Yes No
Met Subgroup Growth No No No No
Source: http://dq.cde.ca.gov/dataquest/
42
School Rankings: Schools have two rankings: (1) a statewide ranking that compares each school with all other
schools in the state of the same type, and (2) a Similar Schools’ ranking that compares each
school with 100 others that have similar parent education level, poverty level, student ethnicity
and other defining characteristics
Similar Schools Rank The California Department of Education ranks all schools from 1 to 10 according to their Base
API. A rank of 10 means that the school's API fell into the top 10% of all schools in the state at
the same grade level. The most recent ranks are based on the results of standardized tests taken in
spring 2012. The API Similar Schools’ Rank compares the test score performance of schools
with comparable demographic profiles using a scale of 1 to 10. A school with a low API but high
Similar Schools Rank may be more effective than a school with low ranks all around..
Statewide Rank Hercules statewide rank was a 5 in 2010 and dropped to a 3 in 2011 and 2012. A ranking of 3
reflects the school performance at the lower 30% of schools across the state of the same type.
Hercules was also given a rank of 3 for similar schools’ in 2010 and was ranked a 1 in 2012. A
ranking of 1 reflects the schools’ performance at the lower 10% of similar schools in terms of
student population and demographics. In 2013 our state rank was a 4 out of 10 and the similar
schools’ rank dropped to 1 out of 10.
Student Achievement Data: CST, EAP, CAHSEE, Graduation In 2012-2013 California used the California Standards Tests (CSTs) to test students in English
Language Arts, Math and Science. The CSTs are standards-based tests, which mean they
measure how well students are mastering specific skills defined for each grade by the state of
California. The states’ goal for each school is to have all students score at or above proficient on
each test.
California Standards Tests (CST) In the last 10 years all schools in the State of California participated in the Standardized Testing
and Reporting (STAR). The assessments under the STAR Program show how well students are
doing in relation to the state content standards. On each of these assessments, student scores are
reported as performance levels. Student results are posted into one of 5 categories: Advanced,
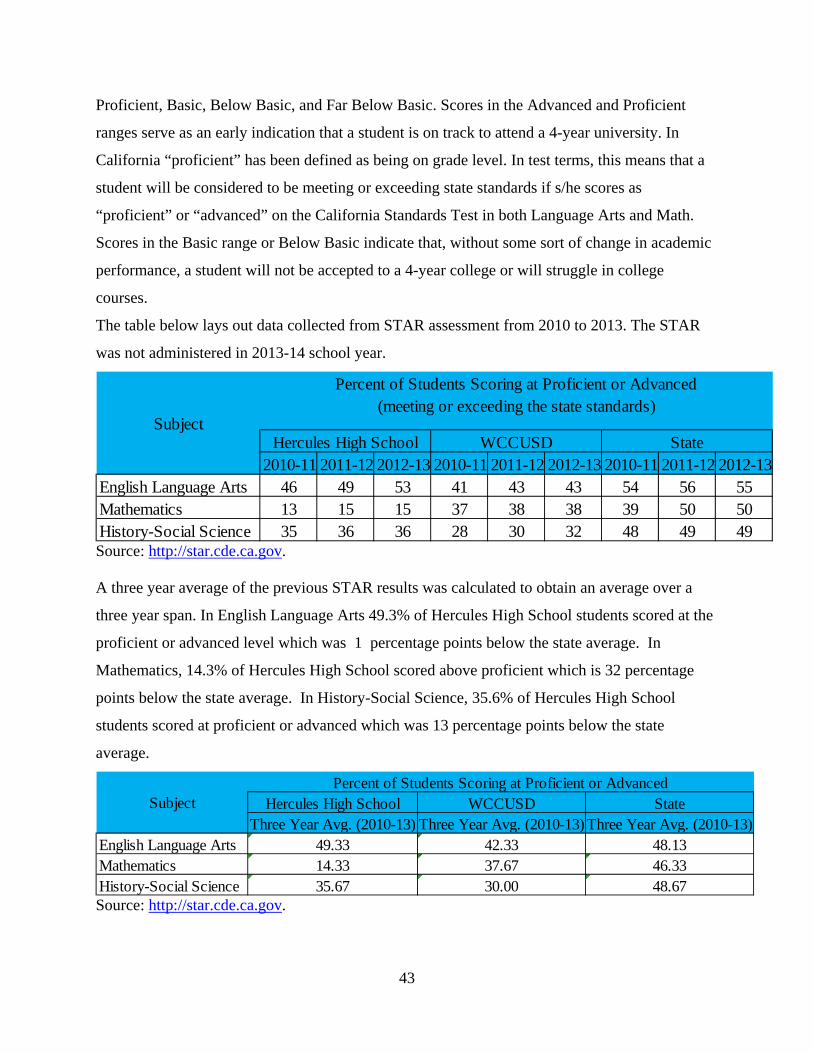
43
Proficient, Basic, Below Basic, and Far Below Basic. Scores in the Advanced and Proficient
ranges serve as an early indication that a student is on track to attend a 4-year university. In
California “proficient” has been defined as being on grade level. In test terms, this means that a
student will be considered to be meeting or exceeding state standards if s/he scores as
“proficient” or “advanced” on the California Standards Test in both Language Arts and Math.
Scores in the Basic range or Below Basic indicate that, without some sort of change in academic
performance, a student will not be accepted to a 4-year college or will struggle in college
courses.
The table below lays out data collected from STAR assessment from 2010 to 2013. The STAR
was not administered in 2013-14 school year.
2010-11 2011-12 2012-13 2010-11 2011-12 2012-13 2010-11 2011-12 2012-13English Language Arts 46 49 53 41 43 43 54 56 55Mathematics 13 15 15 37 38 38 39 50 50History-Social Science 35 36 36 28 30 32 48 49 49
Hercules High School WCCUSD State
Percent of Students Scoring at Proficient or Advanced (meeting or exceeding the state standards)
Subject
Source: http://star.cde.ca.gov. A three year average of the previous STAR results was calculated to obtain an average over a
three year span. In English Language Arts 49.3% of Hercules High School students scored at the
proficient or advanced level which was 1 percentage points below the state average. In
Mathematics, 14.3% of Hercules High School scored above proficient which is 32 percentage
points below the state average. In History-Social Science, 35.6% of Hercules High School
students scored at proficient or advanced which was 13 percentage points below the state
average.
English Language ArtsMathematicsHistory-Social Science
48.1346.3348.67
Three Year Avg. (2010-13) Three Year Avg. (2010-13)Three Year Avg. (2010-13)49.3314.3335.67
42.3337.6730.00
SubjectPercent of Students Scoring at Proficient or Advanced
Hercules High School WCCUSD State
Source: http://star.cde.ca.gov.
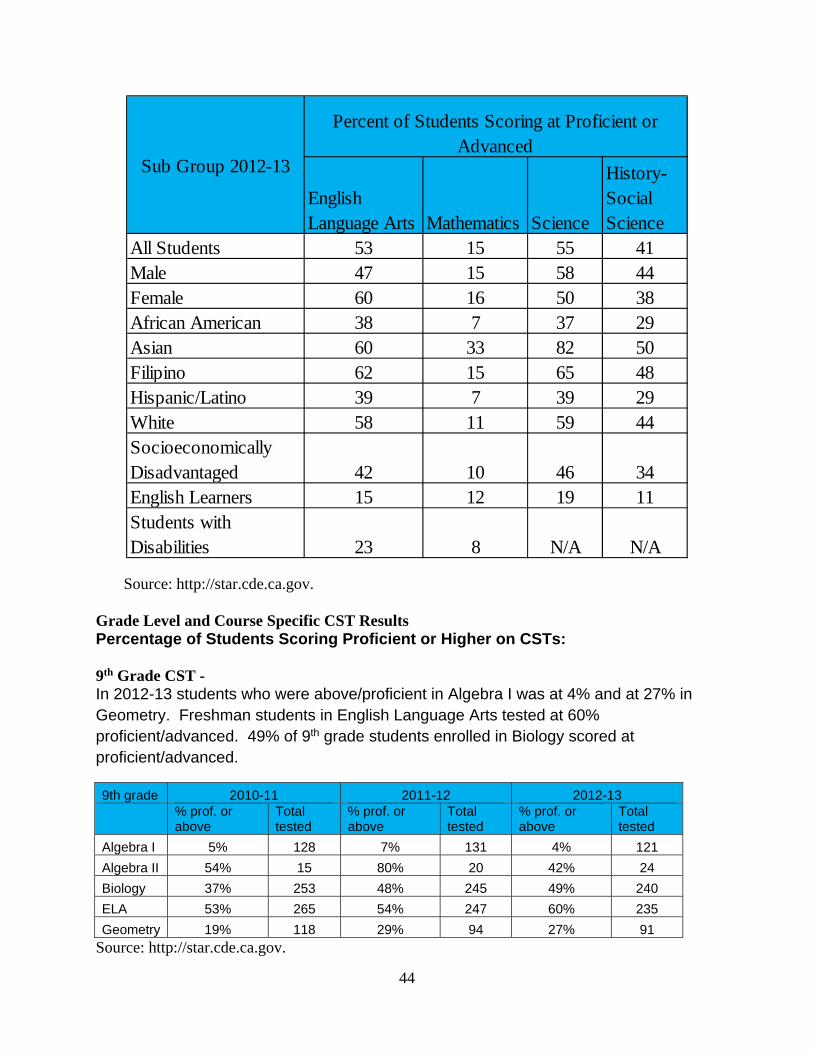
44
English Language Arts Mathematics Science
History-Social Science
All Students 53 15 55 41Male 47 15 58 44Female 60 16 50 38African American 38 7 37 29Asian 60 33 82 50Filipino 62 15 65 48Hispanic/Latino 39 7 39 29White 58 11 59 44Socioeconomically Disadvantaged 42 10 46 34English Learners 15 12 19 11Students with Disabilities 23 8 N/A N/A
Sub Group 2012-13
Percent of Students Scoring at Proficient or Advanced
Source: http://star.cde.ca.gov. Grade Level and Course Specific CST Results Percentage of Students Scoring Proficient or Higher on CSTs: 9th Grade CST - In 2012-13 students who were above/proficient in Algebra I was at 4% and at 27% in Geometry. Freshman students in English Language Arts tested at 60% proficient/advanced. 49% of 9th grade students enrolled in Biology scored at proficient/advanced.
9th grade 2010-11 2011-12 2012-13
% prof. or above
Total tested
% prof. or above
Total tested
% prof. or above
Total tested
Algebra I 5% 128 7% 131 4% 121
Algebra II 54% 15 80% 20 42% 24
Biology 37% 253 48% 245 49% 240
ELA 53% 265 54% 247 60% 235
Geometry 19% 118 29% 94 27% 91 Source: http://star.cde.ca.gov.
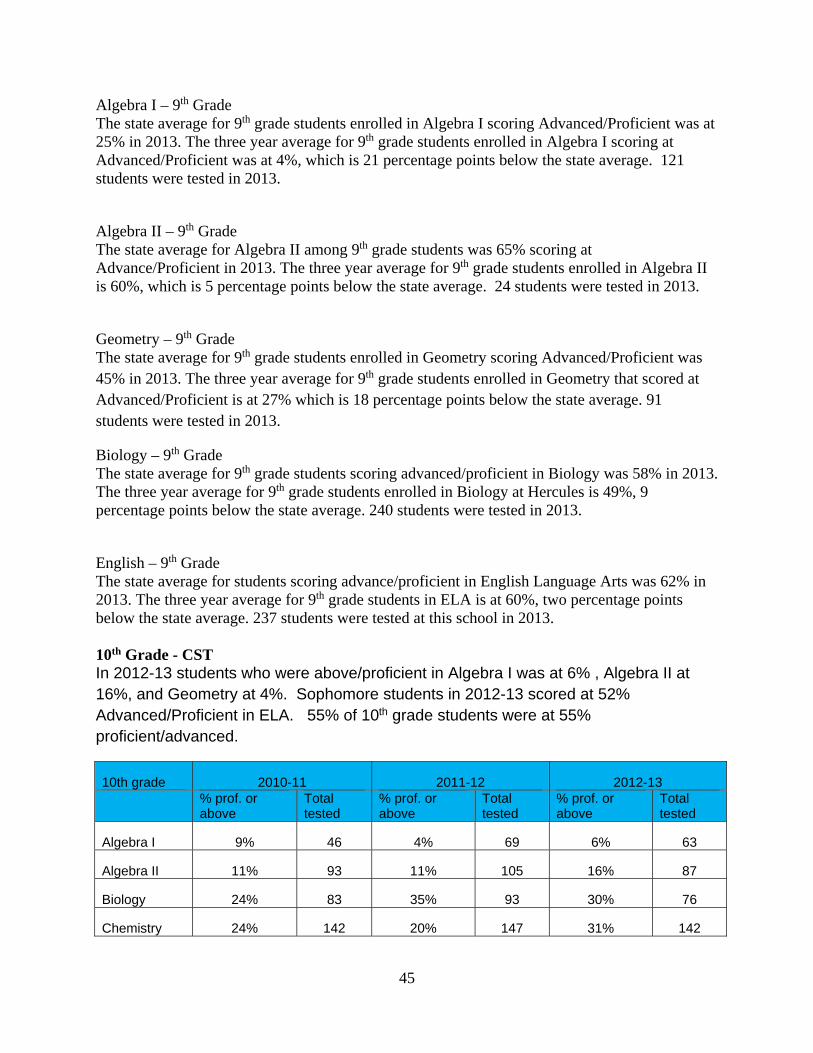
45
Algebra I – 9th Grade The state average for 9th grade students enrolled in Algebra I scoring Advanced/Proficient was at 25% in 2013. The three year average for 9th grade students enrolled in Algebra I scoring at Advanced/Proficient was at 4%, which is 21 percentage points below the state average. 121 students were tested in 2013.
Algebra II – 9th Grade The state average for Algebra II among 9th grade students was 65% scoring at Advance/Proficient in 2013. The three year average for 9th grade students enrolled in Algebra II is 60%, which is 5 percentage points below the state average. 24 students were tested in 2013.
Geometry – 9th Grade The state average for 9th grade students enrolled in Geometry scoring Advanced/Proficient was 45% in 2013. The three year average for 9th grade students enrolled in Geometry that scored at Advanced/Proficient is at 27% which is 18 percentage points below the state average. 91 students were tested in 2013.
Biology – 9th Grade The state average for 9th grade students scoring advanced/proficient in Biology was 58% in 2013. The three year average for 9th grade students enrolled in Biology at Hercules is 49%, 9 percentage points below the state average. 240 students were tested in 2013.
English – 9th Grade The state average for students scoring advance/proficient in English Language Arts was 62% in 2013. The three year average for 9th grade students in ELA is at 60%, two percentage points below the state average. 237 students were tested at this school in 2013. 10th Grade - CST In 2012-13 students who were above/proficient in Algebra I was at 6% , Algebra II at 16%, and Geometry at 4%. Sophomore students in 2012-13 scored at 52% Advanced/Proficient in ELA. 55% of 10th grade students were at 55% proficient/advanced.
10th grade 2010-11 2011-12 2012-13
% prof. or above
Total tested
% prof. or above
Total tested
% prof. or above
Total tested
Algebra I 9% 46 4% 69 6% 63
Algebra II 11% 93 11% 105 16% 87
Biology 24% 83 35% 93 30% 76
Chemistry 24% 142 20% 147 31% 142
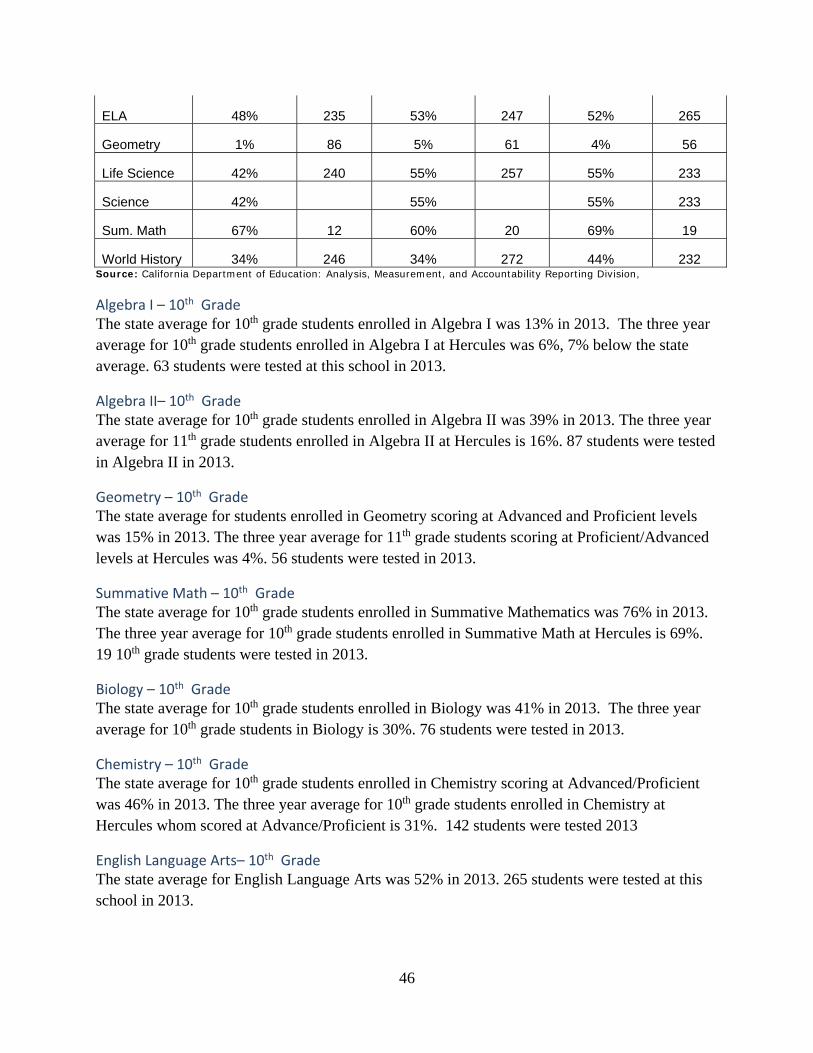
46
ELA 48% 235 53% 247 52% 265
Geometry 1% 86 5% 61 4% 56
Life Science 42% 240 55% 257 55% 233
Science 42% 55% 55% 233
Sum. Math 67% 12 60% 20 69% 19
World History 34% 246 34% 272 44% 232 Source: California Department of Education: Analysis, Measurement, and Accountability Reporting Division,
Algebra I – 10th Grade The state average for 10th grade students enrolled in Algebra I was 13% in 2013. The three year average for 10th grade students enrolled in Algebra I at Hercules was 6%, 7% below the state average. 63 students were tested at this school in 2013.
Algebra II– 10th Grade The state average for 10th grade students enrolled in Algebra II was 39% in 2013. The three year average for 11th grade students enrolled in Algebra II at Hercules is 16%. 87 students were tested in Algebra II in 2013.
Geometry – 10th Grade The state average for students enrolled in Geometry scoring at Advanced and Proficient levels was 15% in 2013. The three year average for 11th grade students scoring at Proficient/Advanced levels at Hercules was 4%. 56 students were tested in 2013.
Summative Math – 10th Grade The state average for 10th grade students enrolled in Summative Mathematics was 76% in 2013. The three year average for 10th grade students enrolled in Summative Math at Hercules is 69%. 19 10th grade students were tested in 2013.
Biology – 10th Grade The state average for 10th grade students enrolled in Biology was 41% in 2013. The three year average for 10th grade students in Biology is 30%. 76 students were tested in 2013.
Chemistry – 10th Grade The state average for 10th grade students enrolled in Chemistry scoring at Advanced/Proficient was 46% in 2013. The three year average for 10th grade students enrolled in Chemistry at Hercules whom scored at Advance/Proficient is 31%. 142 students were tested 2013
English Language Arts– 10th Grade The state average for English Language Arts was 52% in 2013. 265 students were tested at this school in 2013.
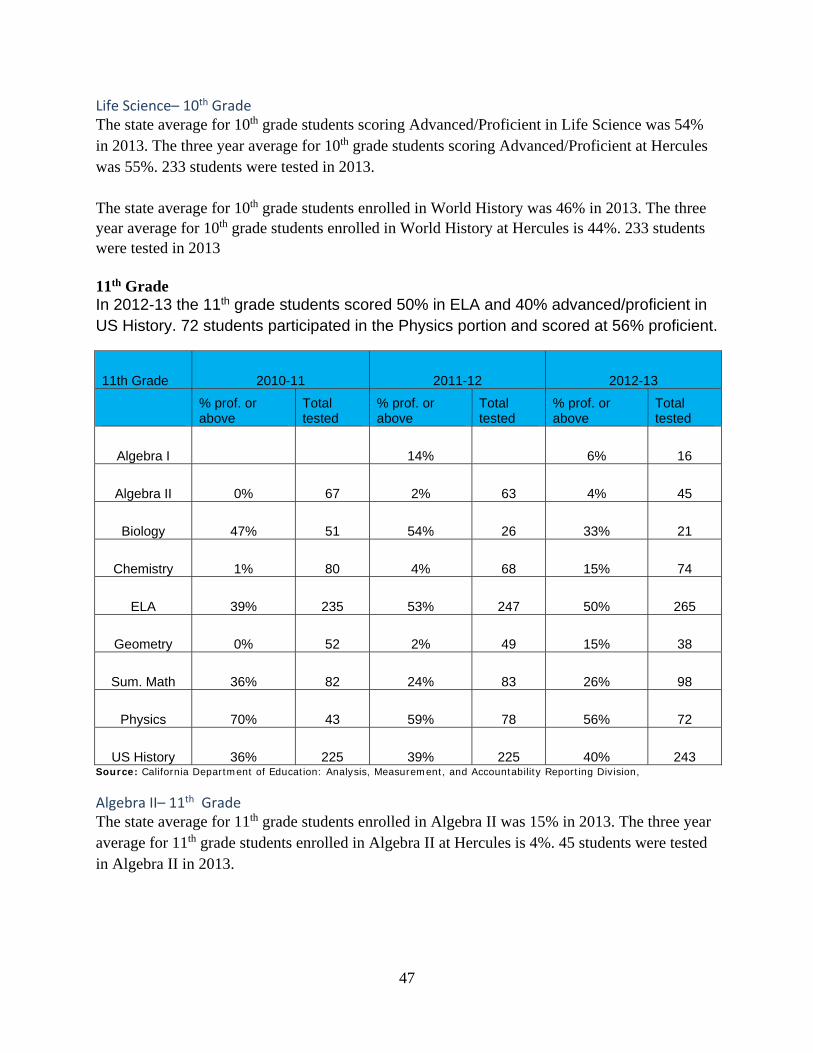
47
Life Science– 10th Grade The state average for 10th grade students scoring Advanced/Proficient in Life Science was 54% in 2013. The three year average for 10th grade students scoring Advanced/Proficient at Hercules was 55%. 233 students were tested in 2013.
The state average for 10th grade students enrolled in World History was 46% in 2013. The three year average for 10th grade students enrolled in World History at Hercules is 44%. 233 students were tested in 2013
11th Grade In 2012-13 the 11th grade students scored 50% in ELA and 40% advanced/proficient in US History. 72 students participated in the Physics portion and scored at 56% proficient.
11th Grade 2010-11 2011-12 2012-13
% prof. or above
Total tested
% prof. or above
Total tested
% prof. or above
Total tested
Algebra I 14% 6% 16
Algebra II 0% 67 2% 63 4% 45
Biology 47% 51 54% 26 33% 21
Chemistry 1% 80 4% 68 15% 74
ELA 39% 235 53% 247 50% 265
Geometry 0% 52 2% 49 15% 38
Sum. Math 36% 82 24% 83 26% 98
Physics 70% 43 59% 78 56% 72
US History 36% 225 39% 225 40% 243 Source: California Department of Education: Analysis, Measurement, and Accountability Reporting Division,
Algebra II– 11th Grade The state average for 11th grade students enrolled in Algebra II was 15% in 2013. The three year average for 11th grade students enrolled in Algebra II at Hercules is 4%. 45 students were tested in Algebra II in 2013.
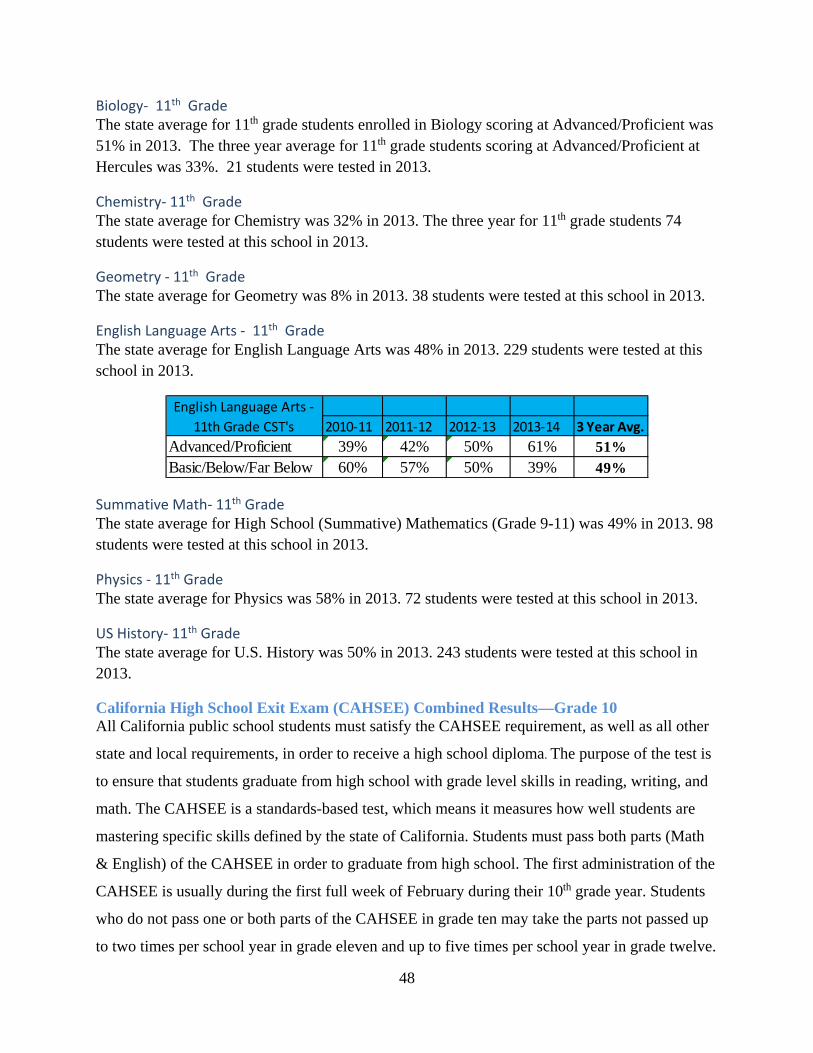
48
Biology‐ 11th Grade The state average for 11th grade students enrolled in Biology scoring at Advanced/Proficient was 51% in 2013. The three year average for 11th grade students scoring at Advanced/Proficient at Hercules was 33%. 21 students were tested in 2013.
Chemistry‐ 11th Grade The state average for Chemistry was 32% in 2013. The three year for 11th grade students 74 students were tested at this school in 2013.
Geometry ‐ 11th Grade The state average for Geometry was 8% in 2013. 38 students were tested at this school in 2013.
English Language Arts ‐ 11th Grade The state average for English Language Arts was 48% in 2013. 229 students were tested at this school in 2013.
2010‐11 2011‐12 2012‐13 2013‐14 3 Year Avg.
Advanced/Proficient 39% 42% 50% 61% 51%Basic/Below/Far Below 60% 57% 50% 39% 49%
English Language Arts ‐
11th Grade CST's
Summative Math‐ 11th Grade The state average for High School (Summative) Mathematics (Grade 9-11) was 49% in 2013. 98 students were tested at this school in 2013.
Physics ‐ 11th Grade The state average for Physics was 58% in 2013. 72 students were tested at this school in 2013.
US History‐ 11th Grade The state average for U.S. History was 50% in 2013. 243 students were tested at this school in 2013.
California High School Exit Exam (CAHSEE) Combined Results—Grade 10 All California public school students must satisfy the CAHSEE requirement, as well as all other
state and local requirements, in order to receive a high school diploma. The purpose of the test is
to ensure that students graduate from high school with grade level skills in reading, writing, and
math. The CAHSEE is a standards-based test, which means it measures how well students are
mastering specific skills defined by the state of California. Students must pass both parts (Math
& English) of the CAHSEE in order to graduate from high school. The first administration of the
CAHSEE is usually during the first full week of February during their 10th grade year. Students
who do not pass one or both parts of the CAHSEE in grade ten may take the parts not passed up
to two times per school year in grade eleven and up to five times per school year in grade twelve.
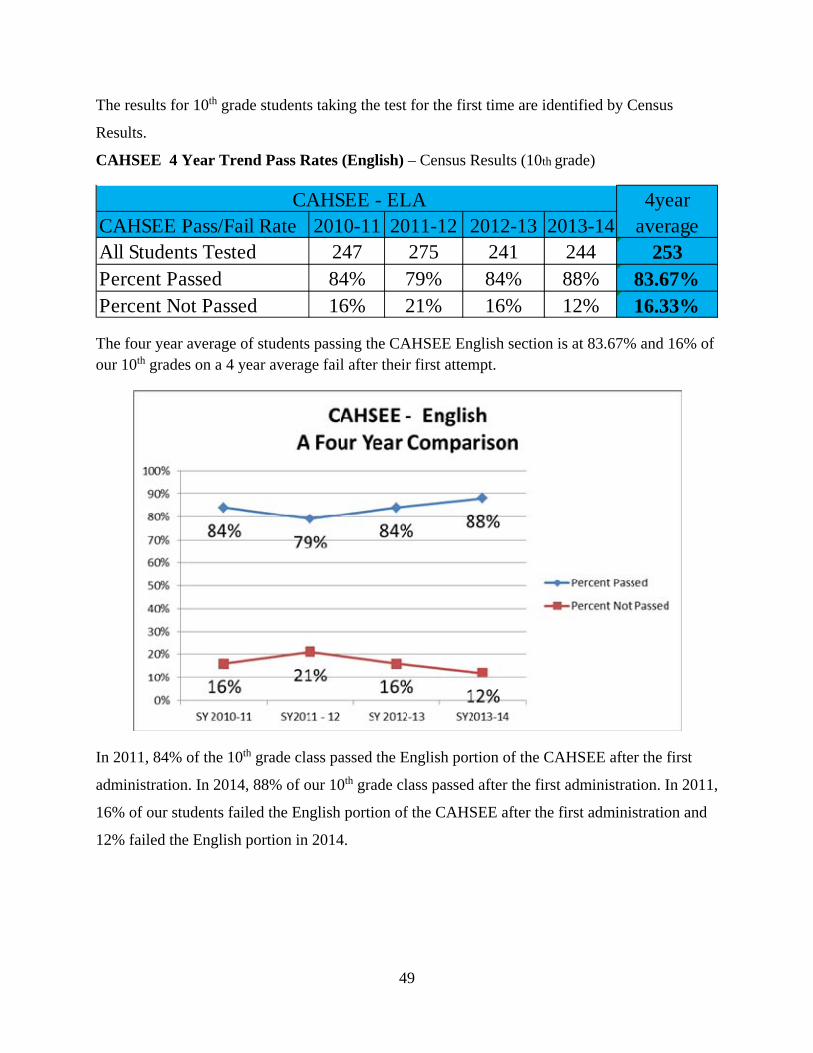
49
The results for 10th grade students taking the test for the first time are identified by Census
Results.
CAHSEE 4 Year Trend Pass Rates (English) – Census Results (10th grade)
CAHSEE Pass/Fail Rate 2010-11 2011-12 2012-13 2013-14All Students Tested 247 275 241 244 253Percent Passed 84% 79% 84% 88% 83.67%Percent Not Passed 16% 21% 16% 12% 16.33%
4year average
CAHSEE - ELA
The four year average of students passing the CAHSEE English section is at 83.67% and 16% of our 10th grades on a 4 year average fail after their first attempt.
In 2011, 84% of the 10th grade class passed the English portion of the CAHSEE after the first
administration. In 2014, 88% of our 10th grade class passed after the first administration. In 2011,
16% of our students failed the English portion of the CAHSEE after the first administration and
12% failed the English portion in 2014.
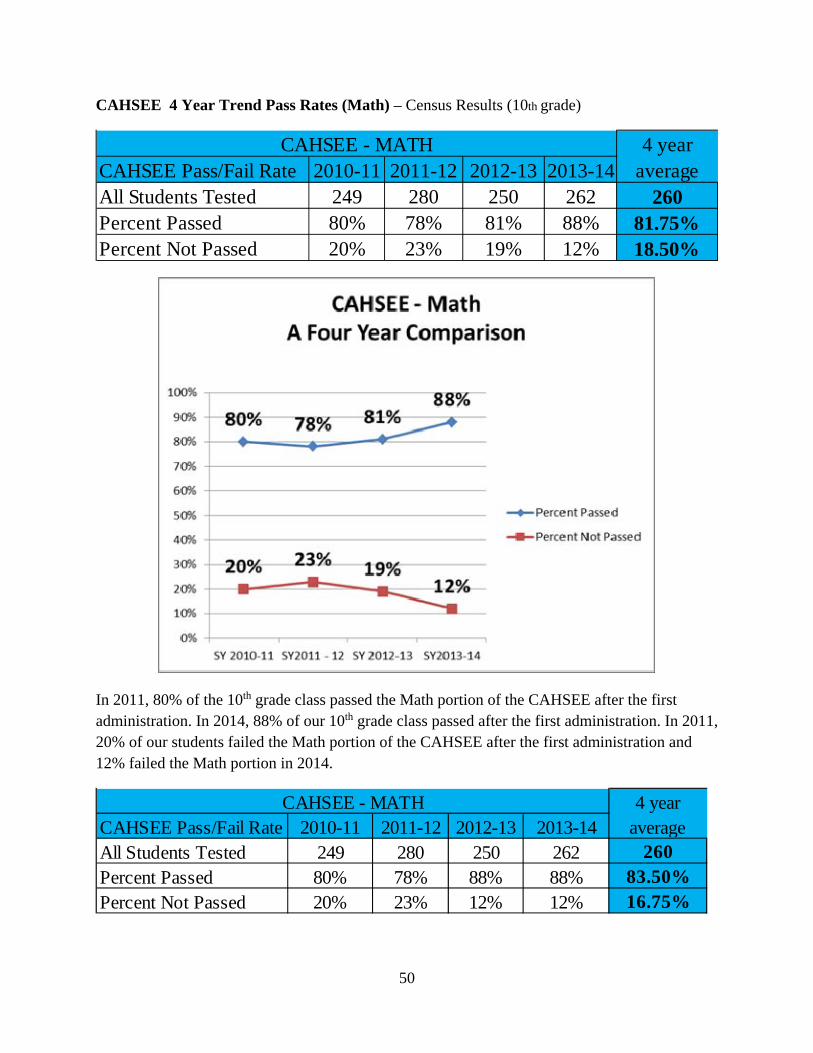
50
CAHSEE 4 Year Trend Pass Rates (Math) – Census Results (10th grade)
CAHSEE Pass/Fail Rate 2010-11 2011-12 2012-13 2013-14All Students Tested 249 280 250 262 260Percent Passed 80% 78% 81% 88% 81.75%Percent Not Passed 20% 23% 19% 12% 18.50%
4 year average
CAHSEE - MATH
In 2011, 80% of the 10th grade class passed the Math portion of the CAHSEE after the first administration. In 2014, 88% of our 10th grade class passed after the first administration. In 2011, 20% of our students failed the Math portion of the CAHSEE after the first administration and 12% failed the Math portion in 2014.
CAHSEE Pass/Fail Rate 2010-11 2011-12 2012-13 2013-14All Students Tested 249 280 250 262 260Percent Passed 80% 78% 88% 88% 83.50%Percent Not Passed 20% 23% 12% 12% 16.75%
4 year average
CAHSEE - MATH
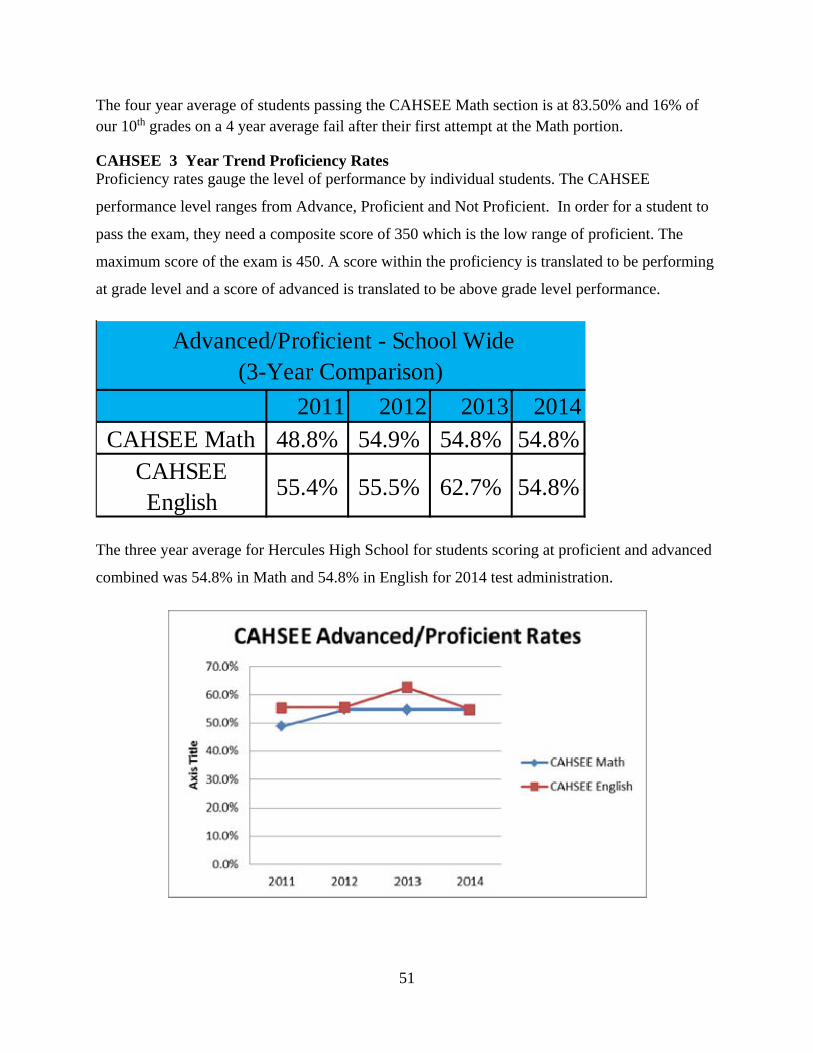
51
The four year average of students passing the CAHSEE Math section is at 83.50% and 16% of our 10th grades on a 4 year average fail after their first attempt at the Math portion.
CAHSEE 3 Year Trend Proficiency Rates Proficiency rates gauge the level of performance by individual students. The CAHSEE
performance level ranges from Advance, Proficient and Not Proficient. In order for a student to
pass the exam, they need a composite score of 350 which is the low range of proficient. The
maximum score of the exam is 450. A score within the proficiency is translated to be performing
at grade level and a score of advanced is translated to be above grade level performance.
2011 2012 2013 2014CAHSEE Math 48.8% 54.9% 54.8% 54.8%
CAHSEE English
55.4% 55.5% 62.7% 54.8%
Advanced/Proficient - School Wide (3-Year Comparison)
The three year average for Hercules High School for students scoring at proficient and advanced
combined was 54.8% in Math and 54.8% in English for 2014 test administration.
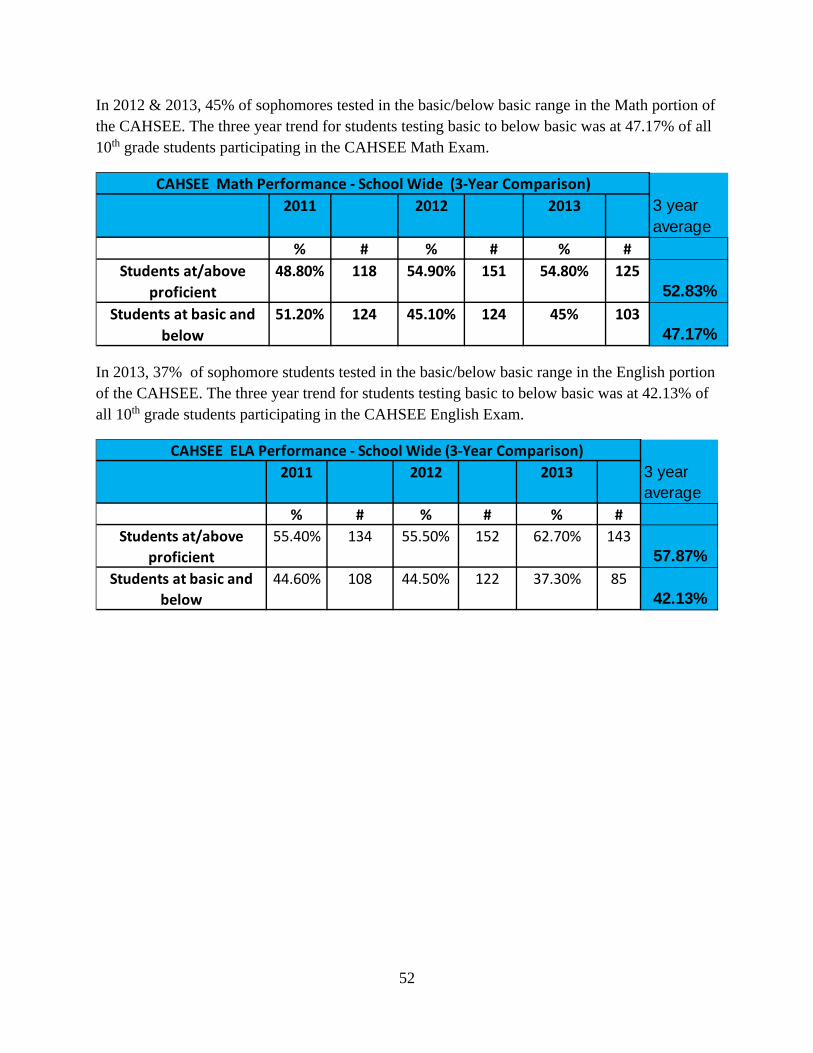
52
In 2012 & 2013, 45% of sophomores tested in the basic/below basic range in the Math portion of the CAHSEE. The three year trend for students testing basic to below basic was at 47.17% of all 10th grade students participating in the CAHSEE Math Exam.
2011 2012 2013 3 year average
% # % # % #
Students at/above
proficient
48.80% 118 54.90% 151 54.80% 12552.83%
Students at basic and
below
51.20% 124 45.10% 124 45% 10347.17%
CAHSEE Math Performance ‐ School Wide (3‐Year Comparison)
In 2013, 37% of sophomore students tested in the basic/below basic range in the English portion of the CAHSEE. The three year trend for students testing basic to below basic was at 42.13% of all 10th grade students participating in the CAHSEE English Exam.
2011 2012 2013 3 year average
% # % # % #
Students at/above
proficient
55.40% 134 55.50% 152 62.70% 14357.87%
Students at basic and
below
44.60% 108 44.50% 122 37.30% 8542.13%
CAHSEE ELA Performance ‐ School Wide (3‐Year Comparison)
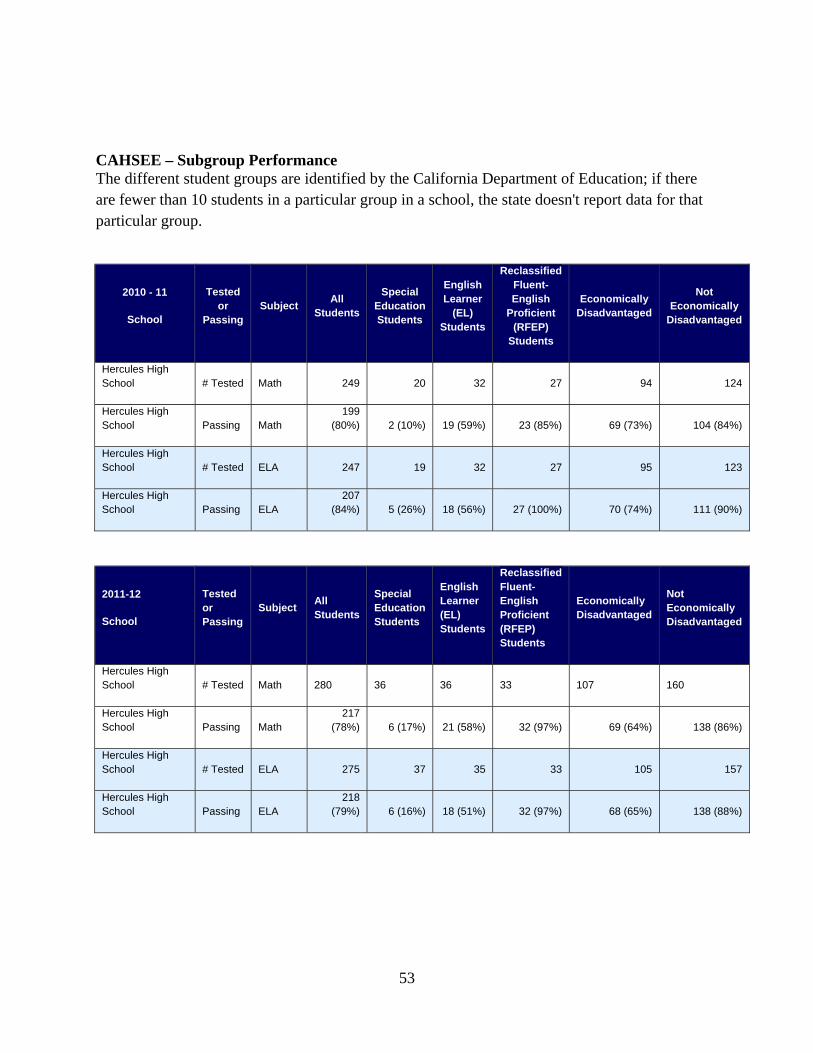
53
CAHSEE – Subgroup Performance The different student groups are identified by the California Department of Education; if there are fewer than 10 students in a particular group in a school, the state doesn't report data for that particular group.
2010 - 11
School
Tested or
Passing Subject
All Students
Special Education Students
English Learner
(EL) Students
Reclassified Fluent-English
Proficient (RFEP)
Students
Economically Disadvantaged
Not Economically
Disadvantaged
Hercules High School # Tested Math 249 20 32 27 94 124
Hercules High School Passing Math
199 (80%) 2 (10%) 19 (59%) 23 (85%) 69 (73%) 104 (84%)
Hercules High School # Tested ELA 247 19 32 27 95 123
Hercules High School Passing ELA
207 (84%) 5 (26%) 18 (56%) 27 (100%) 70 (74%) 111 (90%)
2011-12
School
Tested or Passing
Subject All Students
Special Education Students
English Learner (EL) Students
Reclassified Fluent-English Proficient (RFEP) Students
Economically Disadvantaged
Not Economically Disadvantaged
Hercules High School # Tested Math 280 36 36 33 107 160
Hercules High School Passing Math
217 (78%) 6 (17%) 21 (58%) 32 (97%) 69 (64%) 138 (86%)
Hercules High School # Tested ELA 275 37 35 33 105 157
Hercules High School Passing ELA
218 (79%) 6 (16%) 18 (51%) 32 (97%) 68 (65%) 138 (88%)
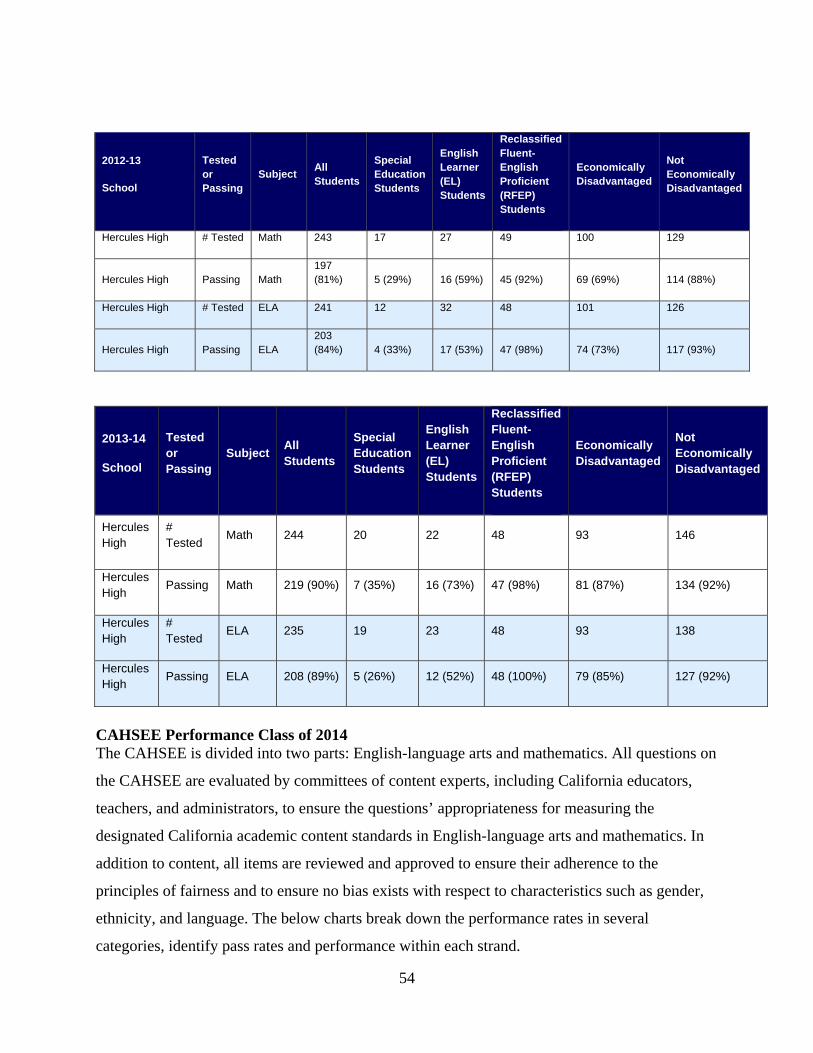
54
2012-13
School
Tested or Passing
Subject All Students
Special Education Students
English Learner (EL) Students
Reclassified Fluent-English Proficient (RFEP) Students
Economically Disadvantaged
Not Economically Disadvantaged
Hercules High # Tested Math 243 17 27 49 100 129
Hercules High Passing Math 197 (81%) 5 (29%) 16 (59%) 45 (92%) 69 (69%) 114 (88%)
Hercules High # Tested ELA 241 12 32 48 101 126
Hercules High Passing ELA 203 (84%) 4 (33%) 17 (53%) 47 (98%) 74 (73%) 117 (93%)
2013-14
School
Tested or Passing
Subject All Students
Special Education Students
English Learner (EL) Students
Reclassified Fluent-English Proficient (RFEP) Students
Economically Disadvantaged
Not Economically Disadvantaged
Hercules High
# Tested
Math 244 20 22 48 93 146
Hercules High
Passing Math 219 (90%) 7 (35%) 16 (73%) 47 (98%) 81 (87%) 134 (92%)
Hercules High
# Tested
ELA 235 19 23 48 93 138
Hercules High
Passing ELA 208 (89%) 5 (26%) 12 (52%) 48 (100%) 79 (85%) 127 (92%)
CAHSEE Performance Class of 2014 The CAHSEE is divided into two parts: English-language arts and mathematics. All questions on
the CAHSEE are evaluated by committees of content experts, including California educators,
teachers, and administrators, to ensure the questions’ appropriateness for measuring the
designated California academic content standards in English-language arts and mathematics. In
addition to content, all items are reviewed and approved to ensure their adherence to the
principles of fairness and to ensure no bias exists with respect to characteristics such as gender,
ethnicity, and language. The below charts break down the performance rates in several
categories, identify pass rates and performance within each strand.
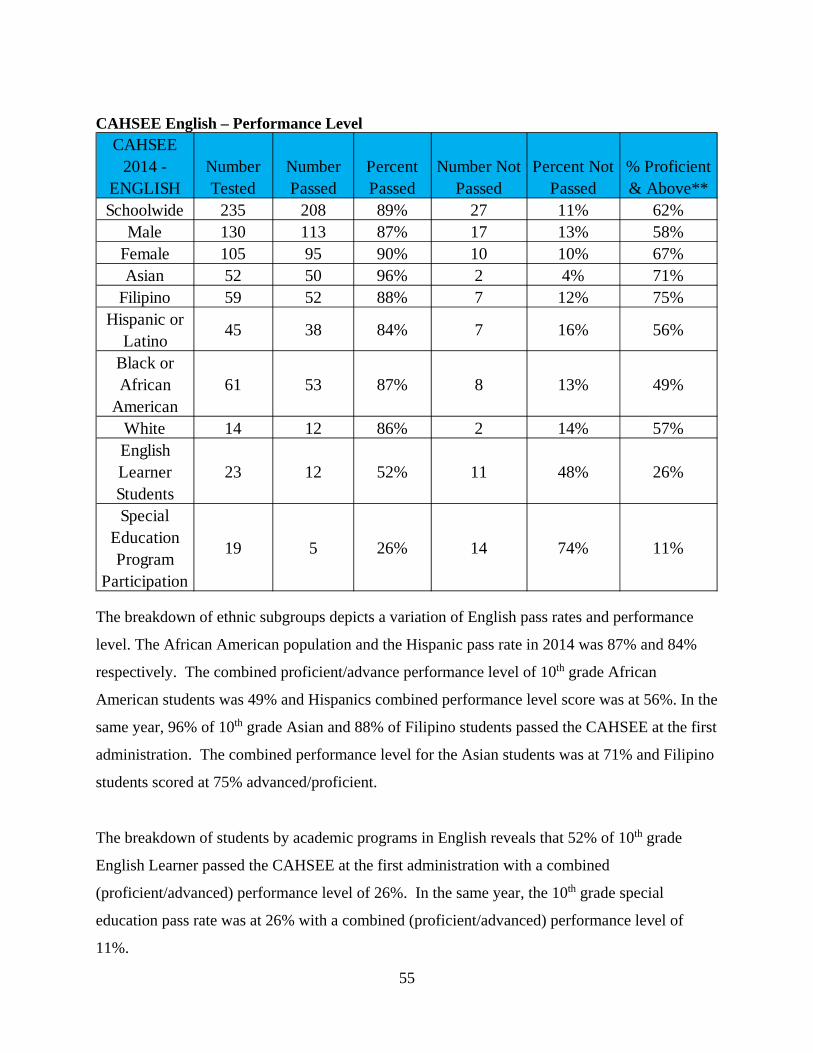
55
CAHSEE English – Performance Level
CAHSEE 2014 -
ENGLISHNumber Tested
Number Passed
Percent Passed
Number Not Passed
Percent Not Passed
% Proficient & Above**
Schoolwide 235 208 89% 27 11% 62%Male 130 113 87% 17 13% 58%
Female 105 95 90% 10 10% 67%Asian 52 50 96% 2 4% 71%
Filipino 59 52 88% 7 12% 75%Hispanic or
Latino45 38 84% 7 16% 56%
Black or African
American61 53 87% 8 13% 49%
White 14 12 86% 2 14% 57%English Learner Students
23 12 52% 11 48% 26%
Special Education Program
Participation
19 5 26% 14 74% 11%
The breakdown of ethnic subgroups depicts a variation of English pass rates and performance
level. The African American population and the Hispanic pass rate in 2014 was 87% and 84%
respectively. The combined proficient/advance performance level of 10th grade African
American students was 49% and Hispanics combined performance level score was at 56%. In the
same year, 96% of 10th grade Asian and 88% of Filipino students passed the CAHSEE at the first
administration. The combined performance level for the Asian students was at 71% and Filipino
students scored at 75% advanced/proficient.
The breakdown of students by academic programs in English reveals that 52% of 10th grade
English Learner passed the CAHSEE at the first administration with a combined
(proficient/advanced) performance level of 26%. In the same year, the 10th grade special
education pass rate was at 26% with a combined (proficient/advanced) performance level of
11%.
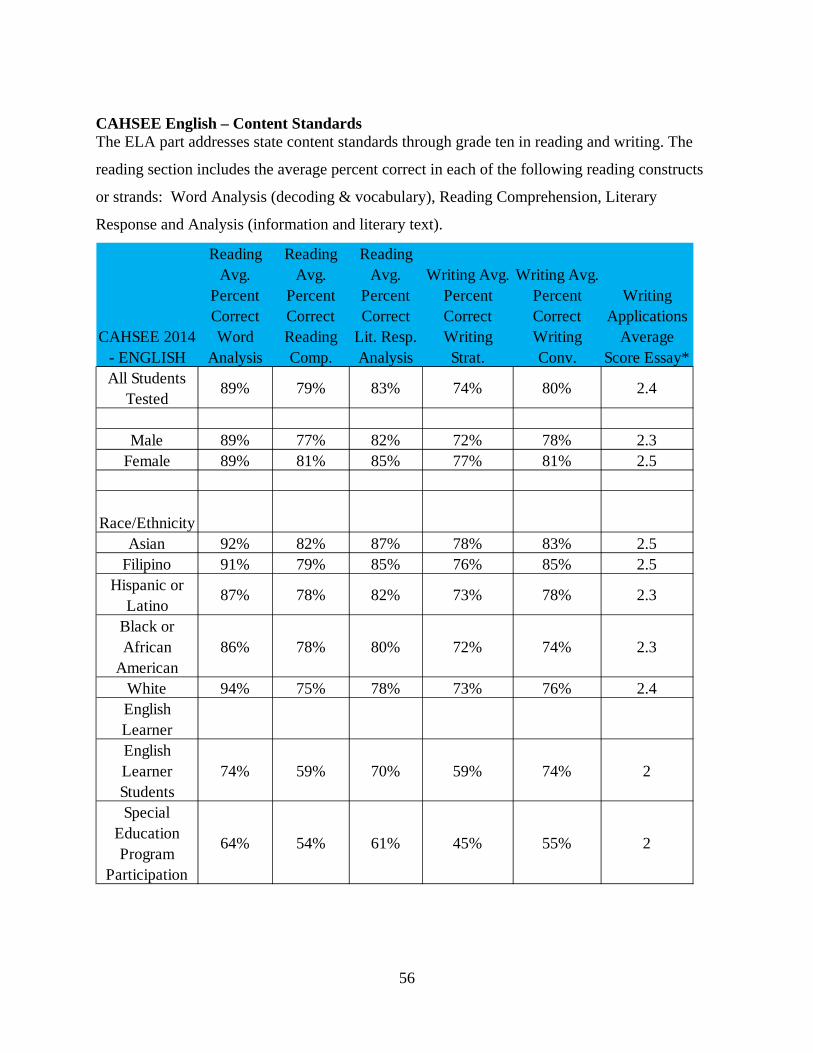
56
CAHSEE English – Content Standards The ELA part addresses state content standards through grade ten in reading and writing. The
reading section includes the average percent correct in each of the following reading constructs
or strands: Word Analysis (decoding & vocabulary), Reading Comprehension, Literary
Response and Analysis (information and literary text).
CAHSEE 2014 - ENGLISH
Reading Avg.
Percent Correct Word
Analysis
Reading Avg.
Percent Correct Reading Comp.
Reading Avg.
Percent Correct
Lit. Resp. Analysis
Writing Avg. Percent Correct Writing Strat.
Writing Avg. Percent Correct Writing Conv.
Writing Applications
Average Score Essay*
All Students Tested
89% 79% 83% 74% 80% 2.4
Male 89% 77% 82% 72% 78% 2.3Female 89% 81% 85% 77% 81% 2.5
Race/EthnicityAsian 92% 82% 87% 78% 83% 2.5
Filipino 91% 79% 85% 76% 85% 2.5Hispanic or
Latino87% 78% 82% 73% 78% 2.3
Black or African
American86% 78% 80% 72% 74% 2.3
White 94% 75% 78% 73% 76% 2.4English LearnerEnglish Learner Students
74% 59% 70% 59% 74% 2
Special Education Program
Participation
64% 54% 61% 45% 55% 2
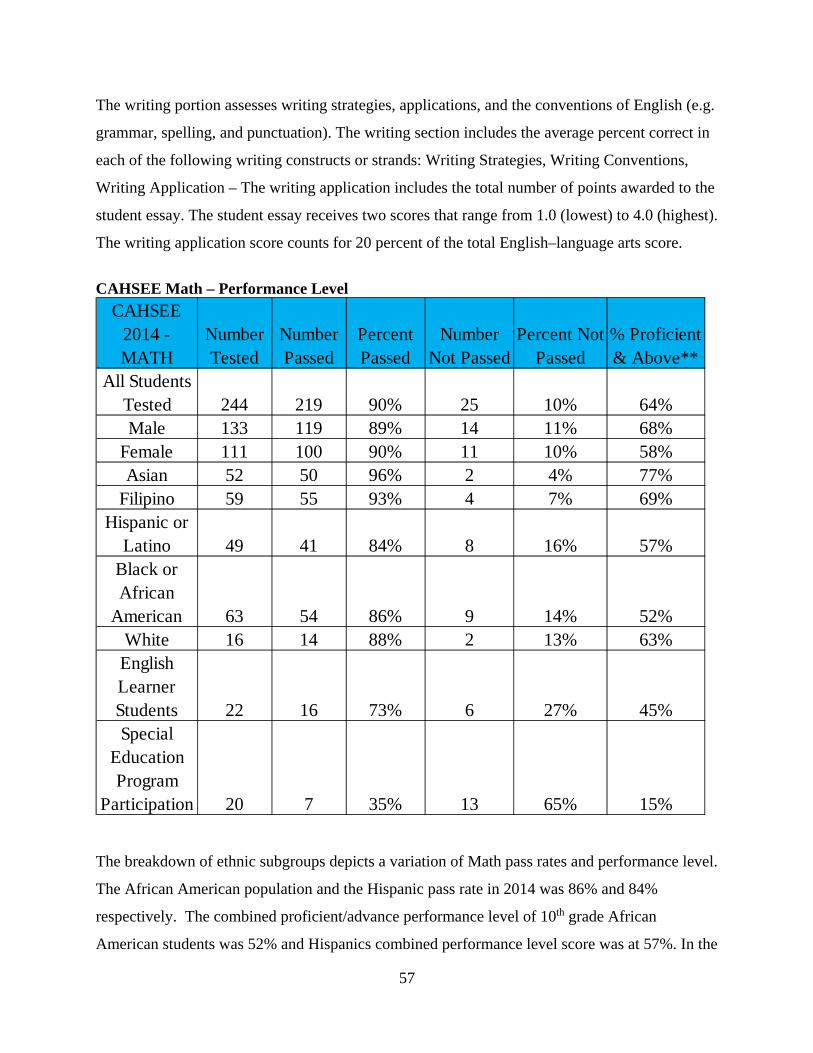
57
The writing portion assesses writing strategies, applications, and the conventions of English (e.g.
grammar, spelling, and punctuation). The writing section includes the average percent correct in
each of the following writing constructs or strands: Writing Strategies, Writing Conventions,
Writing Application – The writing application includes the total number of points awarded to the
student essay. The student essay receives two scores that range from 1.0 (lowest) to 4.0 (highest).
The writing application score counts for 20 percent of the total English–language arts score.
CAHSEE Math – Performance Level
CAHSEE 2014 - MATH
Number Tested
Number Passed
Percent Passed
Number Not Passed
Percent Not Passed
% Proficient & Above**
All Students Tested 244 219 90% 25 10% 64%Male 133 119 89% 14 11% 68%
Female 111 100 90% 11 10% 58%Asian 52 50 96% 2 4% 77%
Filipino 59 55 93% 4 7% 69%Hispanic or
Latino 49 41 84% 8 16% 57%Black or African
American 63 54 86% 9 14% 52%White 16 14 88% 2 13% 63%
English Learner Students 22 16 73% 6 27% 45%Special
Education Program
Participation 20 7 35% 13 65% 15%
The breakdown of ethnic subgroups depicts a variation of Math pass rates and performance level.
The African American population and the Hispanic pass rate in 2014 was 86% and 84%
respectively. The combined proficient/advance performance level of 10th grade African
American students was 52% and Hispanics combined performance level score was at 57%. In the
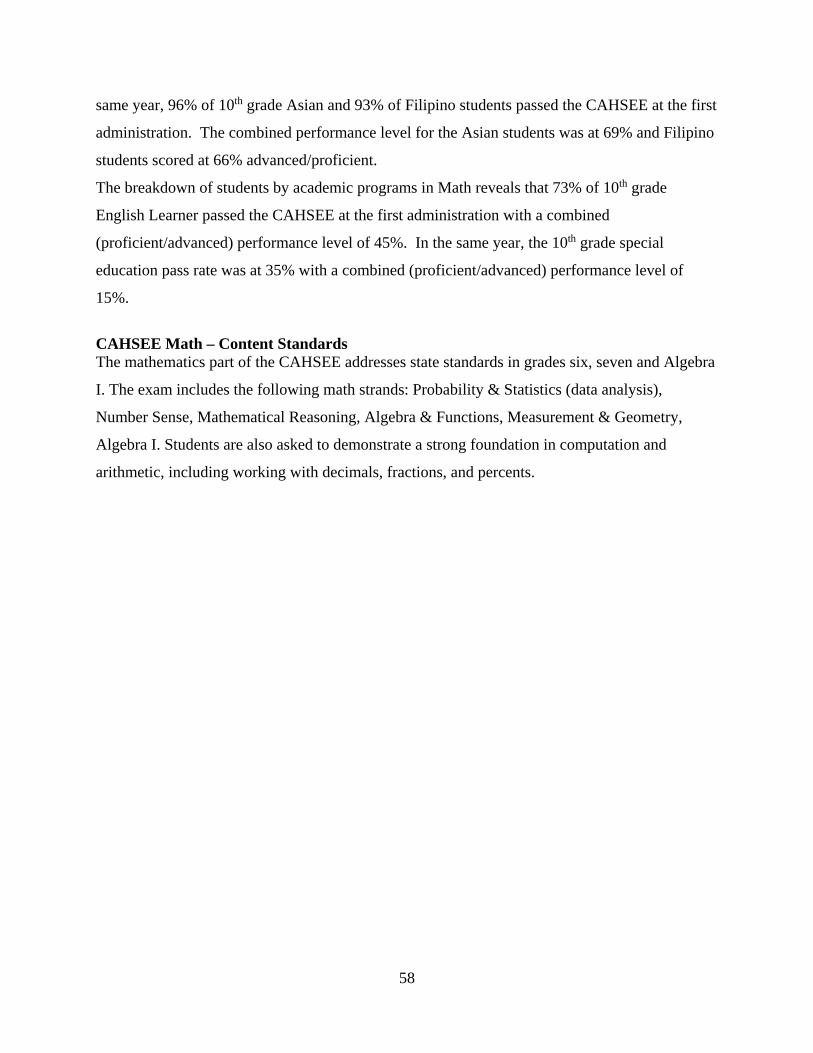
58
same year, 96% of 10th grade Asian and 93% of Filipino students passed the CAHSEE at the first
administration. The combined performance level for the Asian students was at 69% and Filipino
students scored at 66% advanced/proficient.
The breakdown of students by academic programs in Math reveals that 73% of 10th grade
English Learner passed the CAHSEE at the first administration with a combined
(proficient/advanced) performance level of 45%. In the same year, the 10th grade special
education pass rate was at 35% with a combined (proficient/advanced) performance level of
15%.
CAHSEE Math – Content Standards The mathematics part of the CAHSEE addresses state standards in grades six, seven and Algebra
I. The exam includes the following math strands: Probability & Statistics (data analysis),
Number Sense, Mathematical Reasoning, Algebra & Functions, Measurement & Geometry,
Algebra I. Students are also asked to demonstrate a strong foundation in computation and
arithmetic, including working with decimals, fractions, and percents.
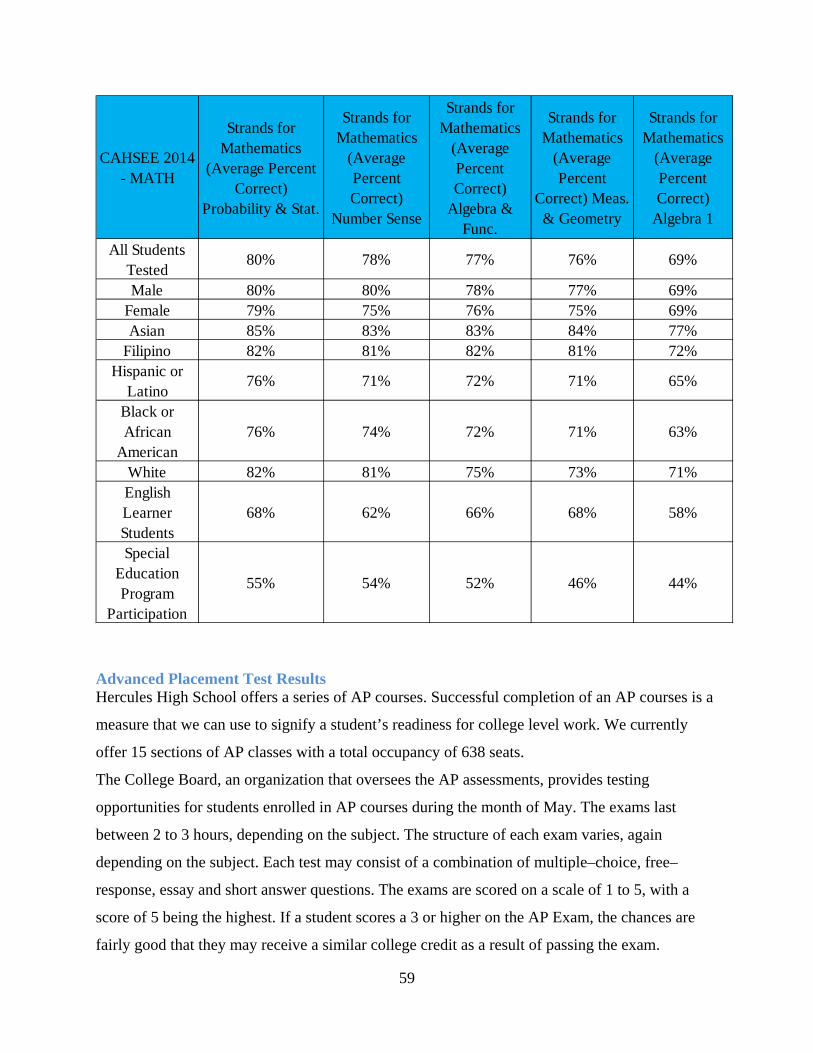
59
CAHSEE 2014 - MATH
Strands for Mathematics
(Average Percent Correct)
Probability & Stat.
Strands for Mathematics
(Average Percent Correct)
Number Sense
Strands for Mathematics
(Average Percent Correct)
Algebra & Func.
Strands for Mathematics
(Average Percent
Correct) Meas. & Geometry
Strands for Mathematics
(Average Percent Correct)
Algebra 1
All Students Tested
80% 78% 77% 76% 69%
Male 80% 80% 78% 77% 69%Female 79% 75% 76% 75% 69%Asian 85% 83% 83% 84% 77%
Filipino 82% 81% 82% 81% 72%Hispanic or
Latino76% 71% 72% 71% 65%
Black or African
American76% 74% 72% 71% 63%
White 82% 81% 75% 73% 71%English Learner Students
68% 62% 66% 68% 58%
Special Education Program
Participation
55% 54% 52% 46% 44%
Advanced Placement Test Results Hercules High School offers a series of AP courses. Successful completion of an AP courses is a
measure that we can use to signify a student’s readiness for college level work. We currently
offer 15 sections of AP classes with a total occupancy of 638 seats.
The College Board, an organization that oversees the AP assessments, provides testing
opportunities for students enrolled in AP courses during the month of May. The exams last
between 2 to 3 hours, depending on the subject. The structure of each exam varies, again
depending on the subject. Each test may consist of a combination of multiple–choice, free–
response, essay and short answer questions. The exams are scored on a scale of 1 to 5, with a
score of 5 being the highest. If a student scores a 3 or higher on the AP Exam, the chances are
fairly good that they may receive a similar college credit as a result of passing the exam.
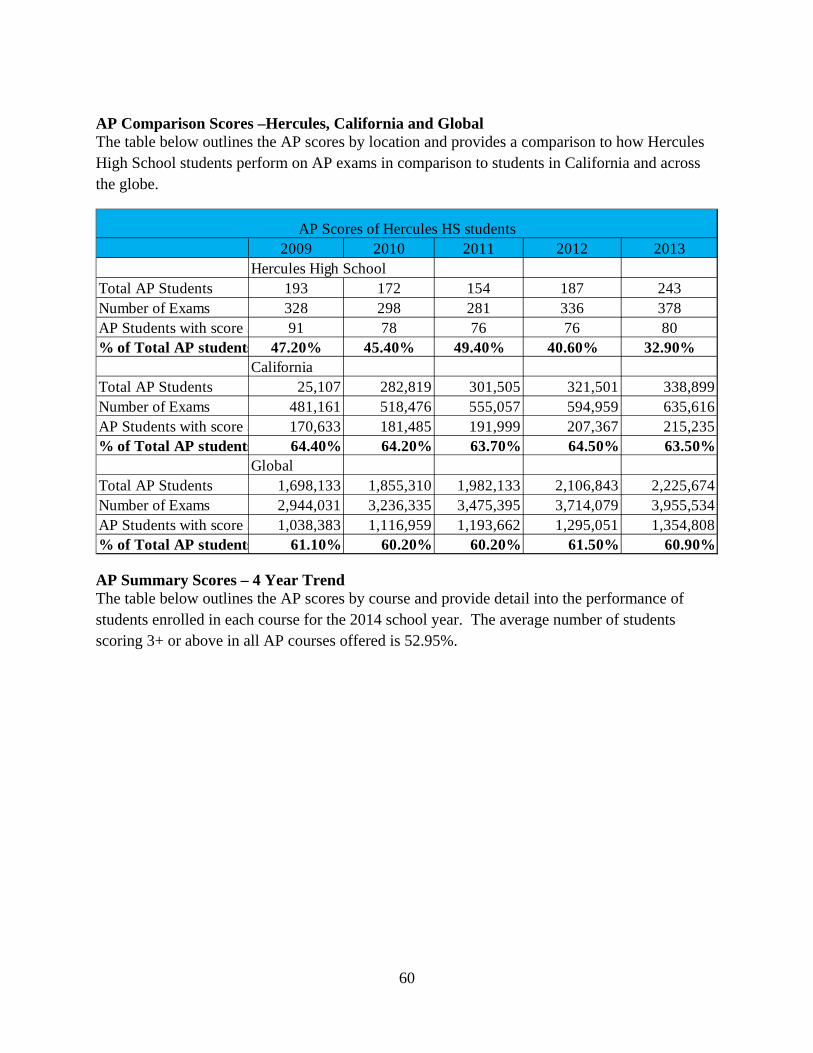
60
AP Comparison Scores –Hercules, California and Global The table below outlines the AP scores by location and provides a comparison to how Hercules High School students perform on AP exams in comparison to students in California and across the globe.
2009 2010 2011 2012 2013Hercules High School
Total AP Students 193 172 154 187 243Number of Exams 328 298 281 336 378AP Students with score 3 91 78 76 76 80% of Total AP students 47.20% 45.40% 49.40% 40.60% 32.90%
CaliforniaTotal AP Students 25,107 282,819 301,505 321,501 338,899Number of Exams 481,161 518,476 555,057 594,959 635,616AP Students with score 3 170,633 181,485 191,999 207,367 215,235% of Total AP students 64.40% 64.20% 63.70% 64.50% 63.50%
GlobalTotal AP Students 1,698,133 1,855,310 1,982,133 2,106,843 2,225,674Number of Exams 2,944,031 3,236,335 3,475,395 3,714,079 3,955,534AP Students with score 3 1,038,383 1,116,959 1,193,662 1,295,051 1,354,808% of Total AP students 61.10% 60.20% 60.20% 61.50% 60.90%
AP Scores of Hercules HS students
AP Summary Scores – 4 Year Trend The table below outlines the AP scores by course and provide detail into the performance of students enrolled in each course for the 2014 school year. The average number of students scoring 3+ or above in all AP courses offered is 52.95%.
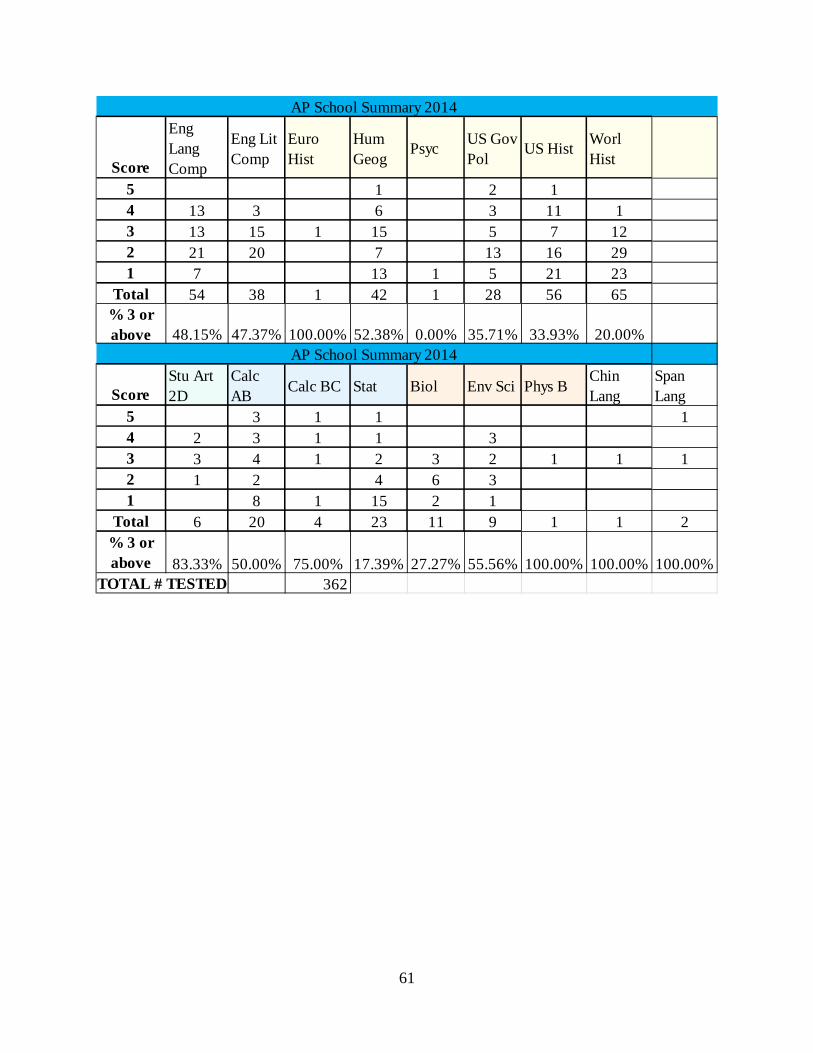
61
Score
Eng Lang Comp
Eng Lit Comp
Euro Hist
Hum Geog
PsycUS Gov Pol
US HistWorl Hist
5 1 2 14 13 3 6 3 11 13 13 15 1 15 5 7 122 21 20 7 13 16 291 7 13 1 5 21 23
Total 54 38 1 42 1 28 56 65% 3 or above 48.15% 47.37% 100.00% 52.38% 0.00% 35.71% 33.93% 20.00%
ScoreStu Art 2D
Calc AB
Calc BC Stat Biol Env Sci Phys BChin Lang
Span Lang
5 3 1 1 14 2 3 1 1 33 3 4 1 2 3 2 1 1 12 1 2 4 6 31 8 1 15 2 1
Total 6 20 4 23 11 9 1 1 2% 3 or above 83.33% 50.00% 75.00% 17.39% 27.27% 55.56% 100.00% 100.00% 100.00%
362
AP School Summary 2014
TOTAL # TESTED
AP School Summary 2014
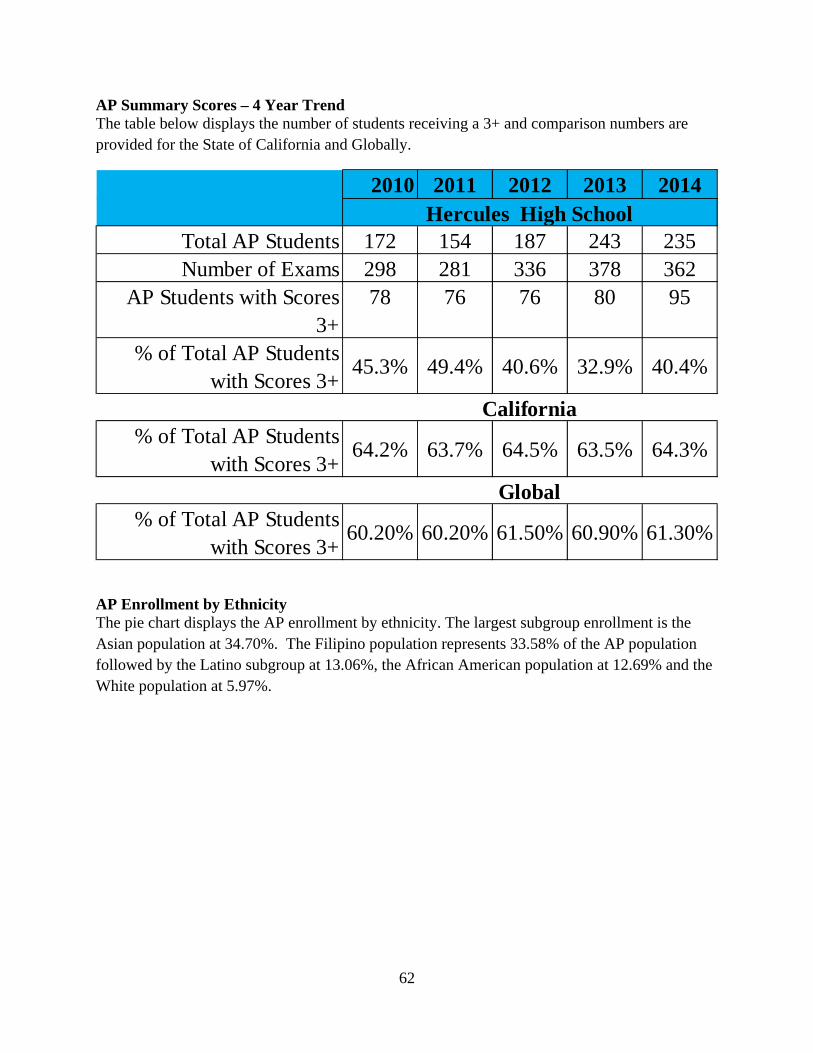
62
AP Summary Scores – 4 Year Trend The table below displays the number of students receiving a 3+ and comparison numbers are provided for the State of California and Globally.
2010 2011 2012 2013 2014
Total AP Students 172 154 187 243 235Number of Exams 298 281 336 378 362
AP Students with Scores 3+
78 76 76 80 95
% of Total AP Students with Scores 3+
45.3% 49.4% 40.6% 32.9% 40.4%
% of Total AP Students with Scores 3+
64.2% 63.7% 64.5% 63.5% 64.3%
% of Total AP Students with Scores 3+
60.20% 60.20% 61.50% 60.90% 61.30%
Hercules High School
California
Global
AP Enrollment by Ethnicity The pie chart displays the AP enrollment by ethnicity. The largest subgroup enrollment is the Asian population at 34.70%. The Filipino population represents 33.58% of the AP population followed by the Latino subgroup at 13.06%, the African American population at 12.69% and the White population at 5.97%.
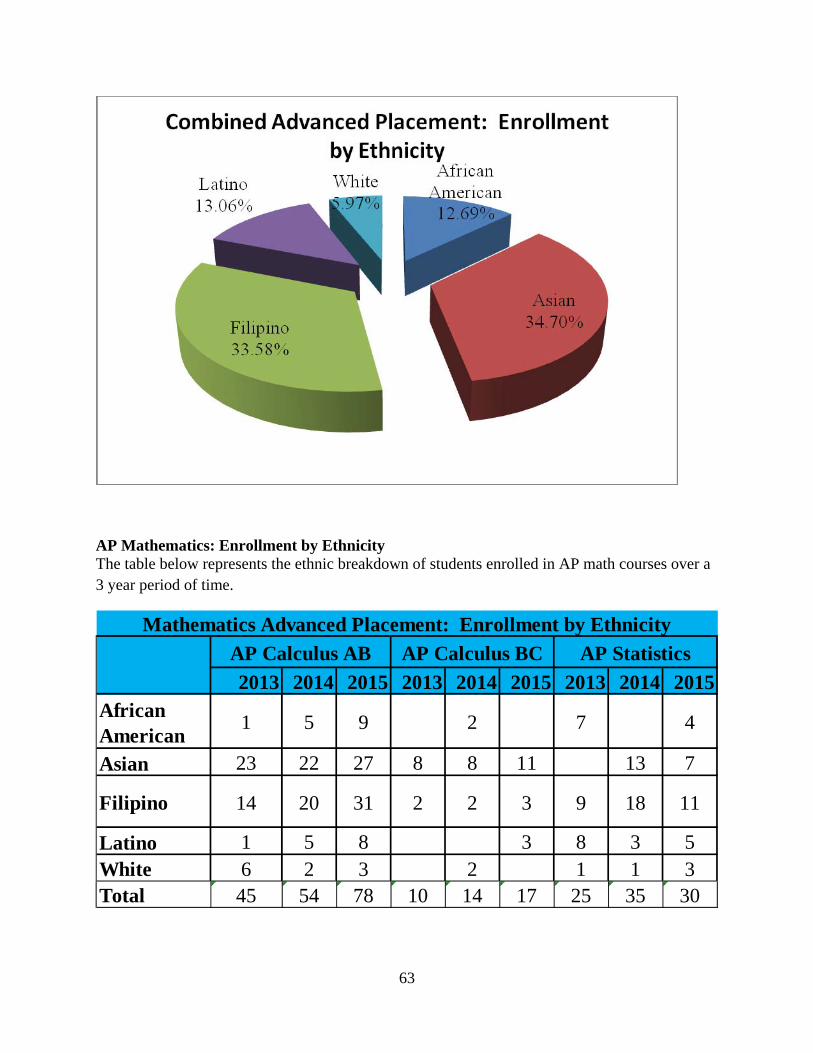
63
AP Mathematics: Enrollment by Ethnicity The table below represents the ethnic breakdown of students enrolled in AP math courses over a 3 year period of time.
2013 2014 2015 2013 2014 2015 2013 2014 2015African American
1 5 9 2 7 4
Asian 23 22 27 8 8 11 13 7
Filipino 14 20 31 2 2 3 9 18 11
Latino 1 5 8 3 8 3 5White 6 2 3 2 1 1 3Total 45 54 78 10 14 17 25 35 30
Mathematics Advanced Placement: Enrollment by Ethnicity
AP Calculus AB AP Calculus BC AP Statistics
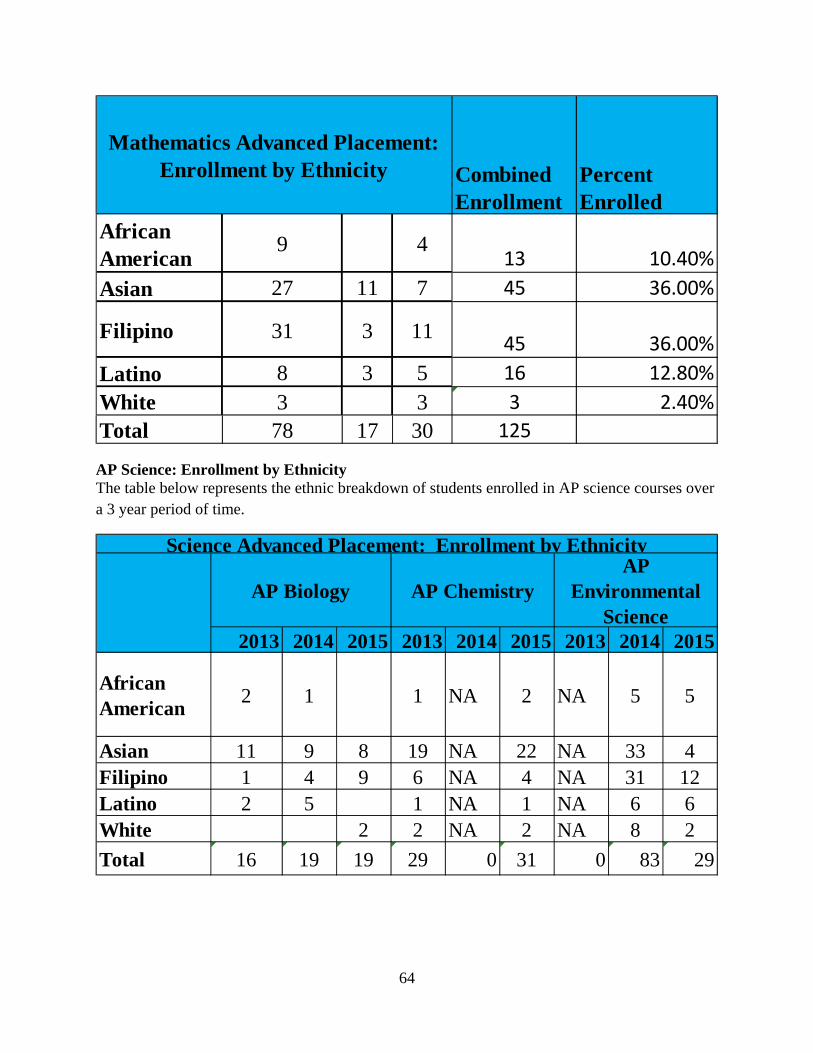
64
Combined Enrollment
Percent Enrolled
African American
9 413 10.40%
Asian 27 11 7 45 36.00%
Filipino 31 3 1145 36.00%
Latino 8 3 5 16 12.80%
White 3 3 3 2.40%
Total 78 17 30 125
Mathematics Advanced Placement: Enrollment by Ethnicity
AP Science: Enrollment by Ethnicity The table below represents the ethnic breakdown of students enrolled in AP science courses over a 3 year period of time.
2013 2014 2015 2013 2014 2015 2013 2014 2015
African American
2 1 1 NA 2 NA 5 5
Asian 11 9 8 19 NA 22 NA 33 4Filipino 1 4 9 6 NA 4 NA 31 12Latino 2 5 1 NA 1 NA 6 6White 2 2 NA 2 NA 8 2
Total 16 19 19 29 0 31 0 83 29
Science Advanced Placement: Enrollment by Ethnicity
AP Biology AP ChemistryAP
Environmental Science
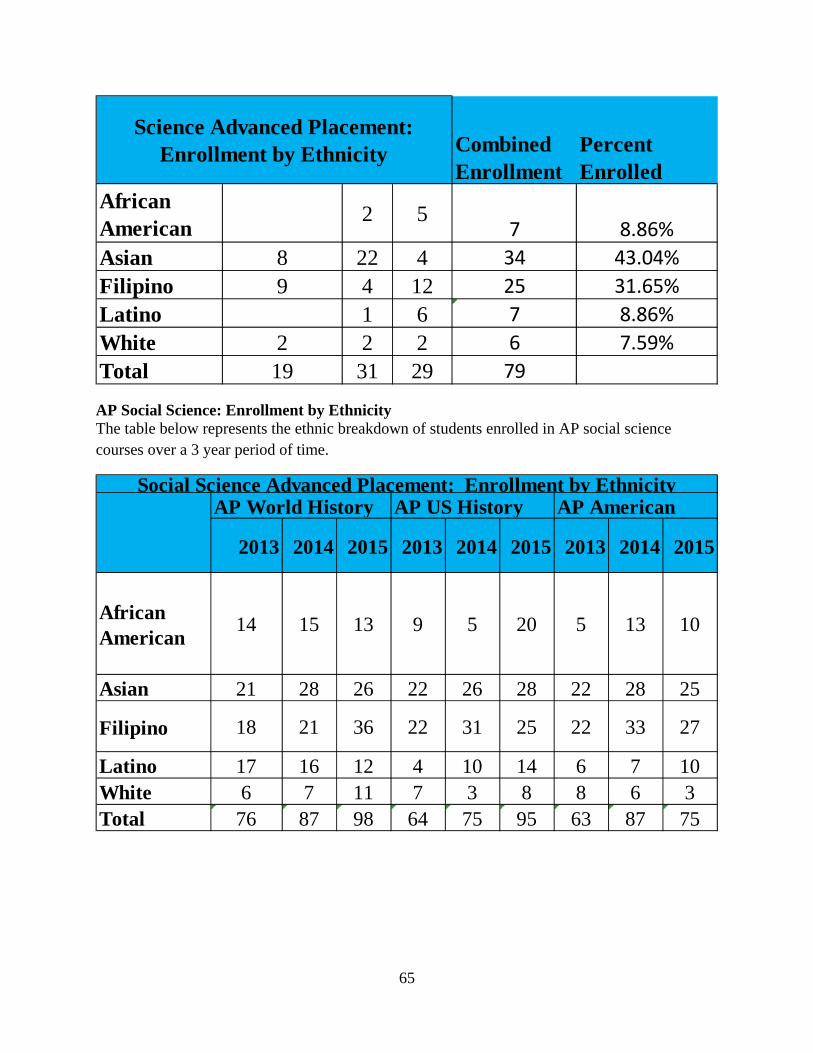
65
Combined Enrollment
Percent Enrolled
African American
2 57 8.86%
Asian 8 22 4 34 43.04%
Filipino 9 4 12 25 31.65%
Latino 1 6 7 8.86%
White 2 2 2 6 7.59%
Total 19 31 29 79
Science Advanced Placement: Enrollment by Ethnicity
AP Social Science: Enrollment by Ethnicity The table below represents the ethnic breakdown of students enrolled in AP social science courses over a 3 year period of time.
2013 2014 2015 2013 2014 2015 2013 2014 2015
African American
14 15 13 9 5 20 5 13 10
Asian 21 28 26 22 26 28 22 28 25
Filipino 18 21 36 22 31 25 22 33 27
Latino 17 16 12 4 10 14 6 7 10White 6 7 11 7 3 8 8 6 3Total 76 87 98 64 75 95 63 87 75
Social Science Advanced Placement: Enrollment by EthnicityAP World History AP US History AP American
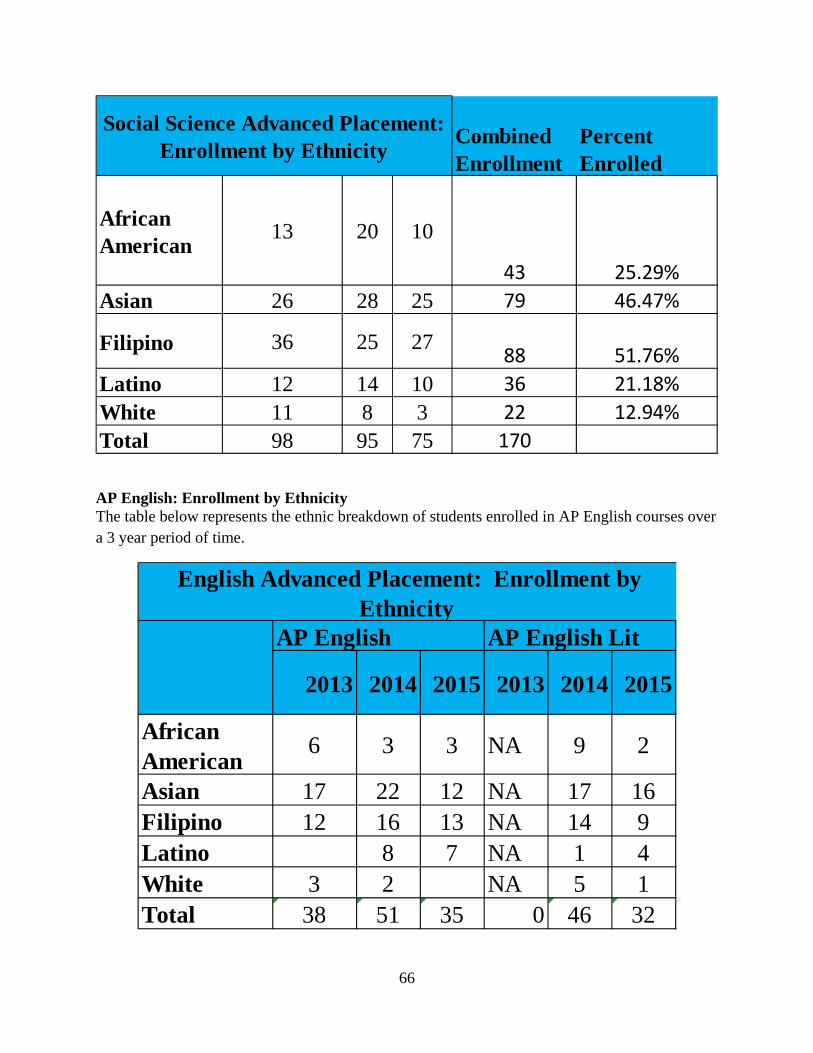
66
Combined Enrollment
Percent Enrolled
African American
13 20 10
43 25.29%
Asian 26 28 25 79 46.47%
Filipino 36 25 2788 51.76%
Latino 12 14 10 36 21.18%
White 11 8 3 22 12.94%
Total 98 95 75 170
Social Science Advanced Placement: Enrollment by Ethnicity
AP English: Enrollment by Ethnicity The table below represents the ethnic breakdown of students enrolled in AP English courses over a 3 year period of time.
2013 2014 2015 2013 2014 2015
African American
6 3 3 NA 9 2
Asian 17 22 12 NA 17 16Filipino 12 16 13 NA 14 9Latino 8 7 NA 1 4White 3 2 NA 5 1Total 38 51 35 0 46 32
AP English AP English Lit
English Advanced Placement: Enrollment by Ethnicity
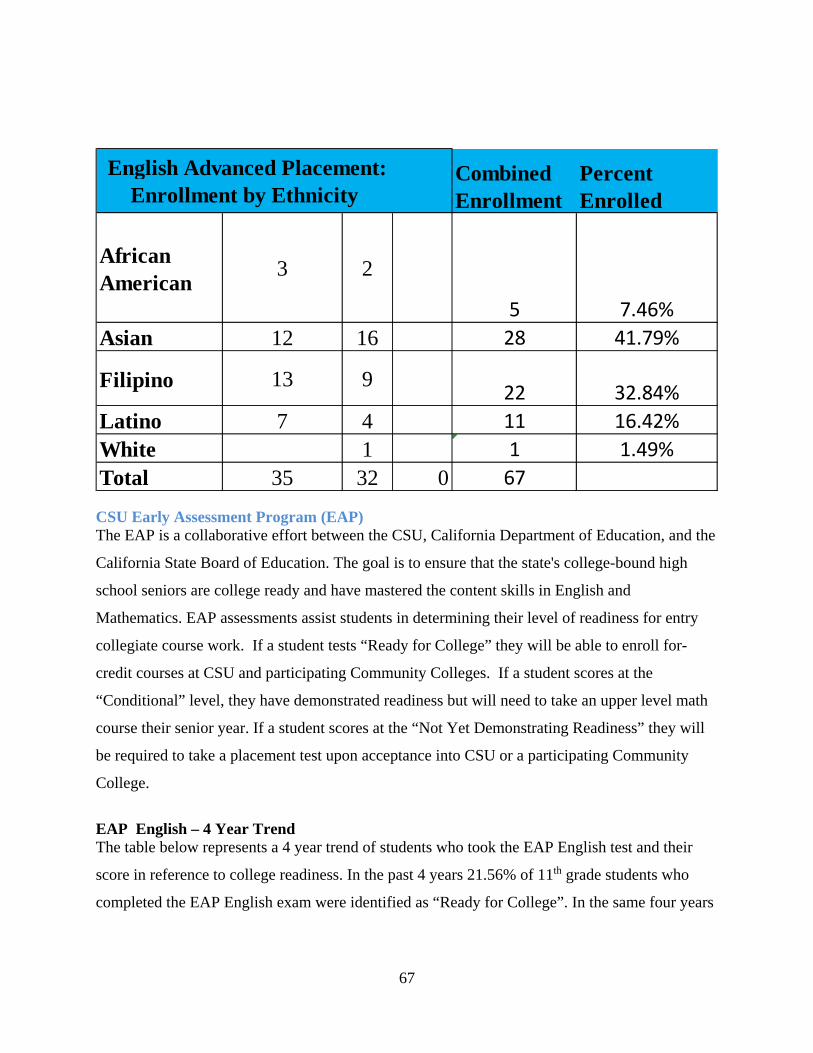
67
Combined Enrollment
Percent Enrolled
African American
3 2
5 7.46%
Asian 12 16 28 41.79%
Filipino 13 922 32.84%
Latino 7 4 11 16.42%
White 1 1 1.49%
Total 35 32 0 67
English Advanced Placement: Enrollment by Ethnicity
CSU Early Assessment Program (EAP) The EAP is a collaborative effort between the CSU, California Department of Education, and the
California State Board of Education. The goal is to ensure that the state's college-bound high
school seniors are college ready and have mastered the content skills in English and
Mathematics. EAP assessments assist students in determining their level of readiness for entry
collegiate course work. If a student tests “Ready for College” they will be able to enroll for-
credit courses at CSU and participating Community Colleges. If a student scores at the
“Conditional” level, they have demonstrated readiness but will need to take an upper level math
course their senior year. If a student scores at the “Not Yet Demonstrating Readiness” they will
be required to take a placement test upon acceptance into CSU or a participating Community
College.
EAP English – 4 Year Trend The table below represents a 4 year trend of students who took the EAP English test and their
score in reference to college readiness. In the past 4 years 21.56% of 11th grade students who
completed the EAP English exam were identified as “Ready for College”. In the same four years
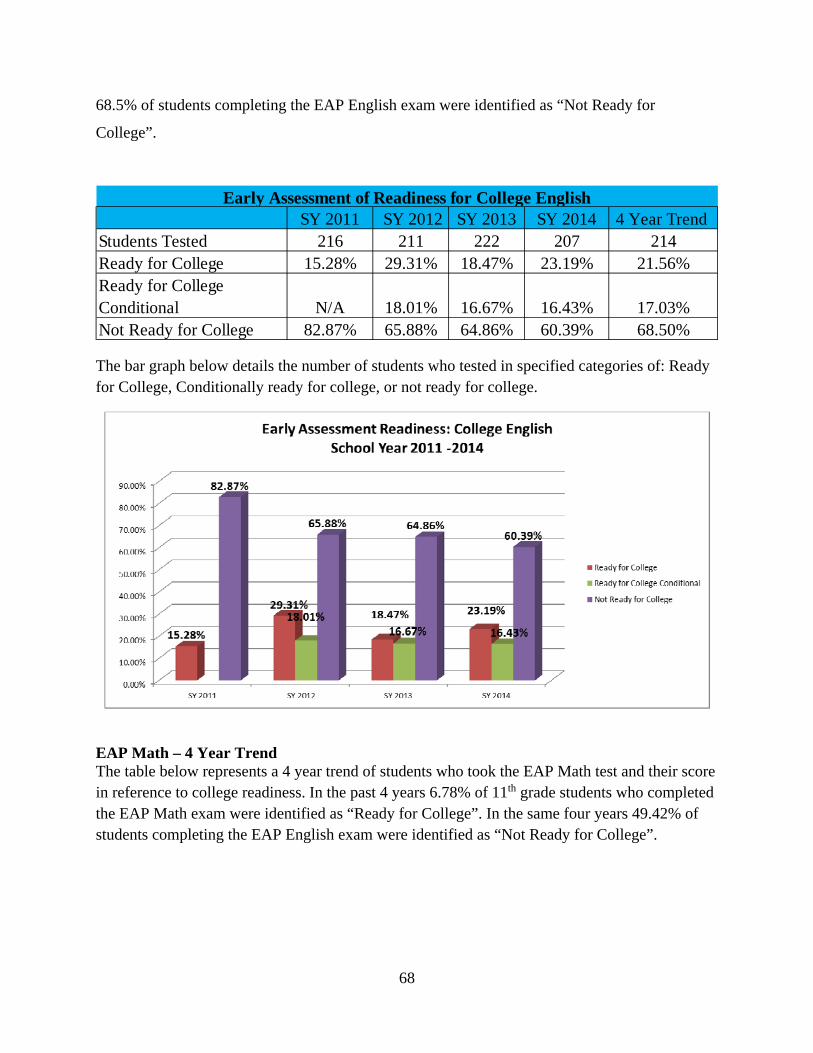
68
68.5% of students completing the EAP English exam were identified as “Not Ready for
College”.
SY 2011 SY 2012 SY 2013 SY 2014 4 Year TrendStudents Tested 216 211 222 207 214Ready for College 15.28% 29.31% 18.47% 23.19% 21.56%Ready for College Conditional N/A 18.01% 16.67% 16.43% 17.03%Not Ready for College 82.87% 65.88% 64.86% 60.39% 68.50%
Early Assessment of Readiness for College English
The bar graph below details the number of students who tested in specified categories of: Ready for College, Conditionally ready for college, or not ready for college.
EAP Math – 4 Year Trend The table below represents a 4 year trend of students who took the EAP Math test and their score in reference to college readiness. In the past 4 years 6.78% of 11th grade students who completed the EAP Math exam were identified as “Ready for College”. In the same four years 49.42% of students completing the EAP English exam were identified as “Not Ready for College”.
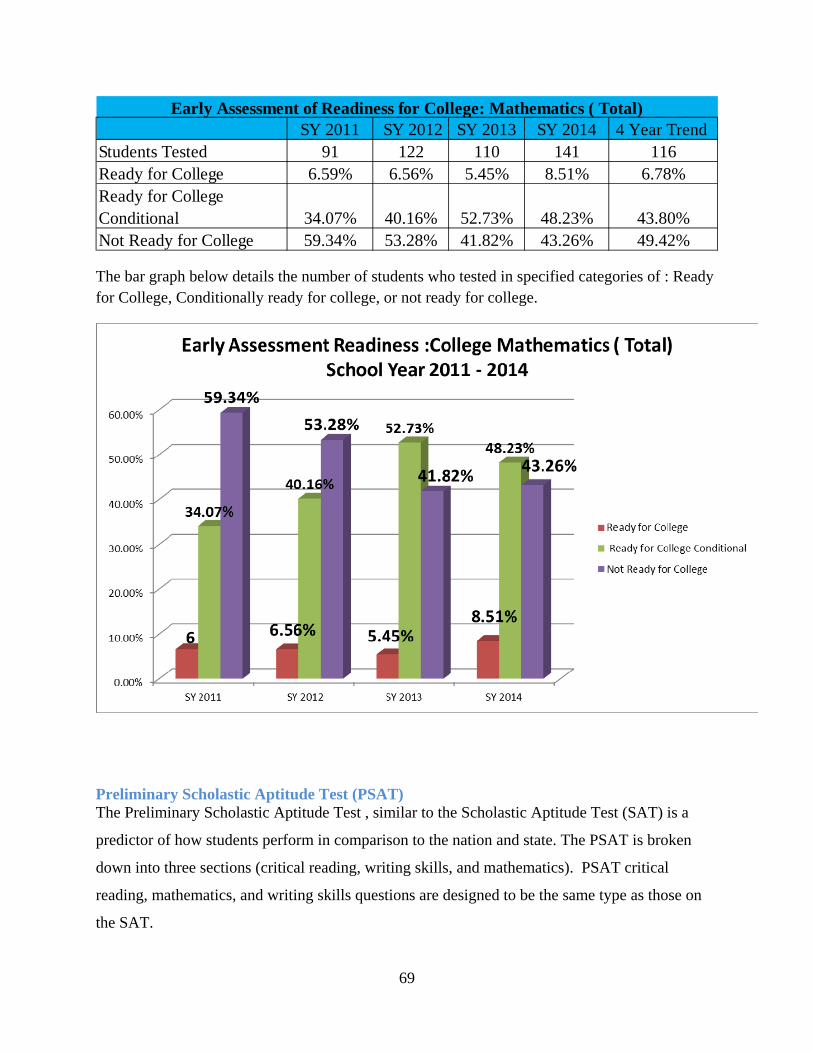
69
SY 2011 SY 2012 SY 2013 SY 2014 4 Year TrendStudents Tested 91 122 110 141 116Ready for College 6.59% 6.56% 5.45% 8.51% 6.78%Ready for College Conditional 34.07% 40.16% 52.73% 48.23% 43.80%Not Ready for College 59.34% 53.28% 41.82% 43.26% 49.42%
Early Assessment of Readiness for College: Mathematics ( Total)
The bar graph below details the number of students who tested in specified categories of : Ready for College, Conditionally ready for college, or not ready for college.
Preliminary Scholastic Aptitude Test (PSAT) The Preliminary Scholastic Aptitude Test , similar to the Scholastic Aptitude Test (SAT) is a
predictor of how students perform in comparison to the nation and state. The PSAT is broken
down into three sections (critical reading, writing skills, and mathematics). PSAT critical
reading, mathematics, and writing skills questions are designed to be the same type as those on
the SAT.
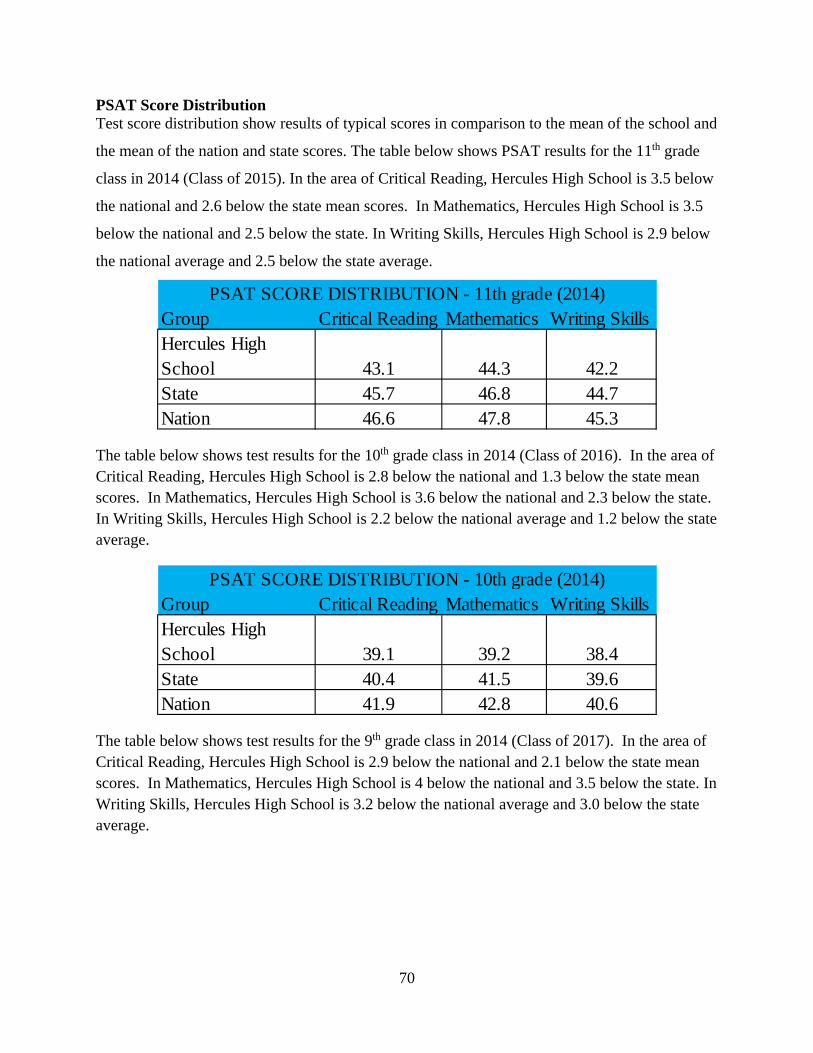
70
PSAT Score Distribution Test score distribution show results of typical scores in comparison to the mean of the school and
the mean of the nation and state scores. The table below shows PSAT results for the 11th grade
class in 2014 (Class of 2015). In the area of Critical Reading, Hercules High School is 3.5 below
the national and 2.6 below the state mean scores. In Mathematics, Hercules High School is 3.5
below the national and 2.5 below the state. In Writing Skills, Hercules High School is 2.9 below
the national average and 2.5 below the state average.
Group Critical Reading Mathematics Writing SkillsHercules High School 43.1 44.3 42.2State 45.7 46.8 44.7Nation 46.6 47.8 45.3
PSAT SCORE DISTRIBUTION - 11th grade (2014)
The table below shows test results for the 10th grade class in 2014 (Class of 2016). In the area of Critical Reading, Hercules High School is 2.8 below the national and 1.3 below the state mean scores. In Mathematics, Hercules High School is 3.6 below the national and 2.3 below the state. In Writing Skills, Hercules High School is 2.2 below the national average and 1.2 below the state average.
Group Critical Reading Mathematics Writing SkillsHercules High School 39.1 39.2 38.4State 40.4 41.5 39.6Nation 41.9 42.8 40.6
PSAT SCORE DISTRIBUTION - 10th grade (2014)
The table below shows test results for the 9th grade class in 2014 (Class of 2017). In the area of Critical Reading, Hercules High School is 2.9 below the national and 2.1 below the state mean scores. In Mathematics, Hercules High School is 4 below the national and 3.5 below the state. In Writing Skills, Hercules High School is 3.2 below the national average and 3.0 below the state average.
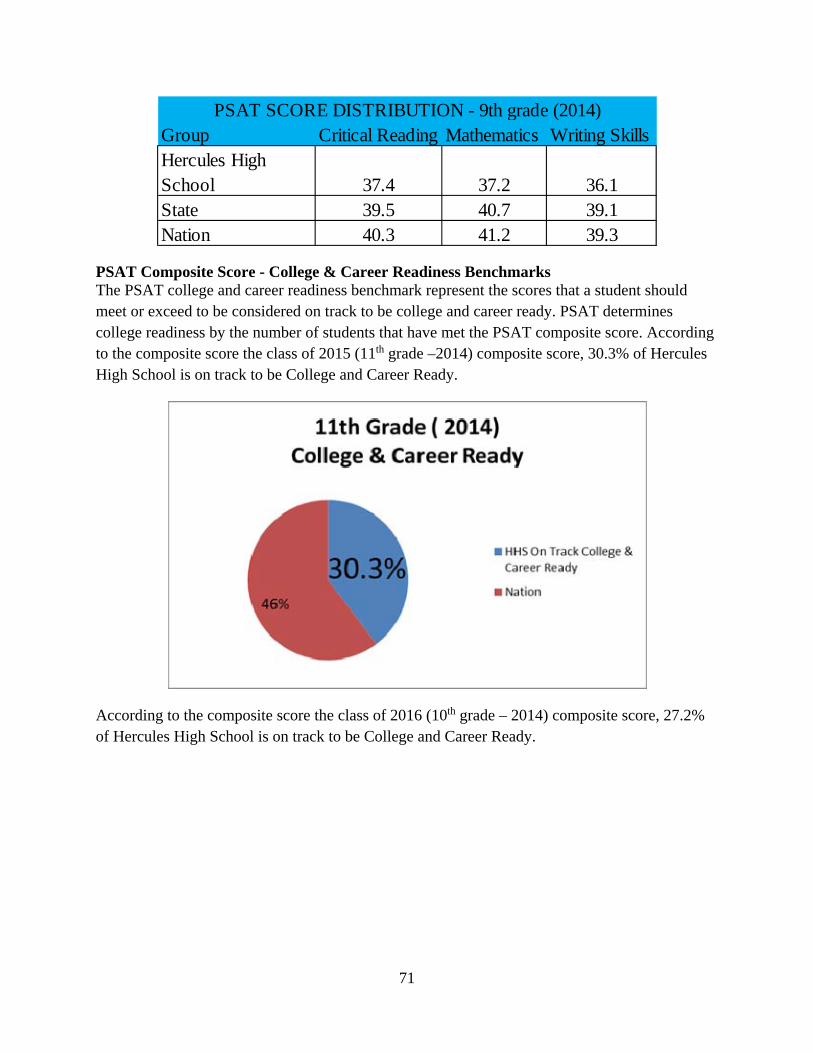
71
Group Critical Reading Mathematics Writing SkillsHercules High School 37.4 37.2 36.1State 39.5 40.7 39.1Nation 40.3 41.2 39.3
PSAT SCORE DISTRIBUTION - 9th grade (2014)
PSAT Composite Score - College & Career Readiness Benchmarks The PSAT college and career readiness benchmark represent the scores that a student should meet or exceed to be considered on track to be college and career ready. PSAT determines college readiness by the number of students that have met the PSAT composite score. According to the composite score the class of 2015 (11th grade –2014) composite score, 30.3% of Hercules High School is on track to be College and Career Ready.
According to the composite score the class of 2016 (10th grade – 2014) composite score, 27.2% of Hercules High School is on track to be College and Career Ready.
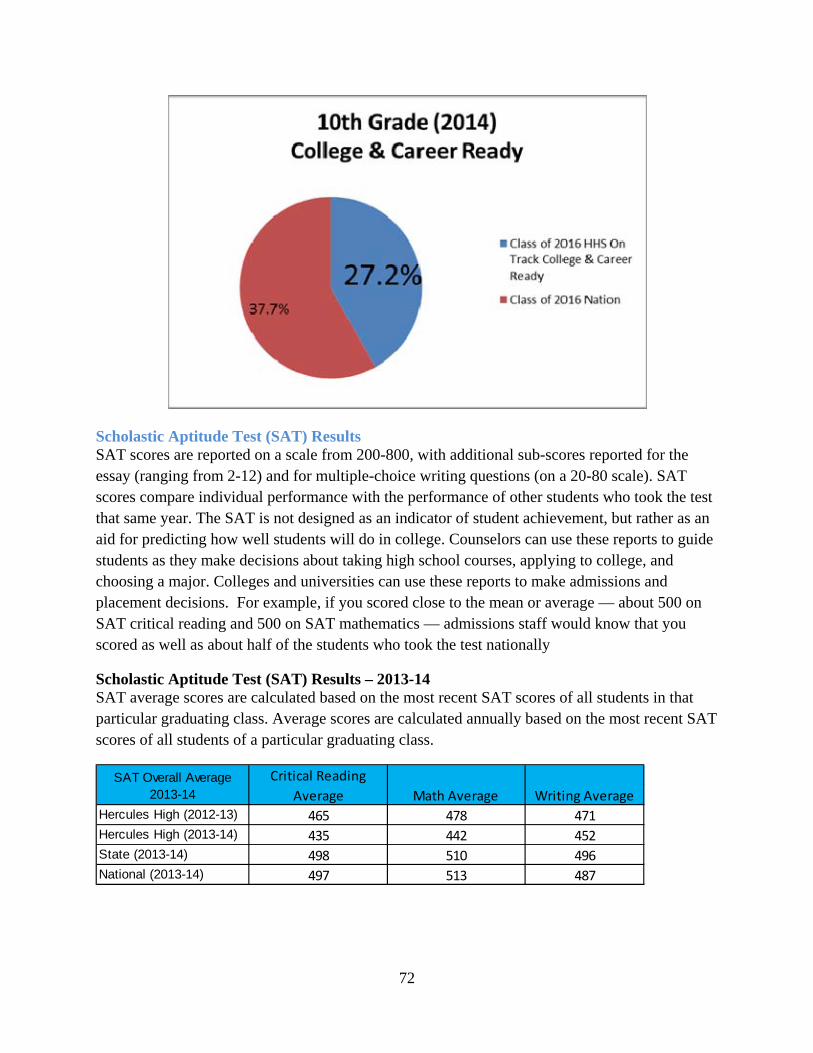
72
Scholastic Aptitude Test (SAT) Results SAT scores are reported on a scale from 200-800, with additional sub-scores reported for the essay (ranging from 2-12) and for multiple-choice writing questions (on a 20-80 scale). SAT scores compare individual performance with the performance of other students who took the test that same year. The SAT is not designed as an indicator of student achievement, but rather as an aid for predicting how well students will do in college. Counselors can use these reports to guide students as they make decisions about taking high school courses, applying to college, and choosing a major. Colleges and universities can use these reports to make admissions and placement decisions. For example, if you scored close to the mean or average — about 500 on SAT critical reading and 500 on SAT mathematics — admissions staff would know that you scored as well as about half of the students who took the test nationally
Scholastic Aptitude Test (SAT) Results – 2013-14 SAT average scores are calculated based on the most recent SAT scores of all students in that particular graduating class. Average scores are calculated annually based on the most recent SAT scores of all students of a particular graduating class.
Hercules High (2012-13) 465 478 471Hercules High (2013-14) 435 442 452State (2013-14) 498 510 496National (2013-14) 497 513 487
SAT Overall Average 2013-14
Critical Reading
Average Math Average Writing Average
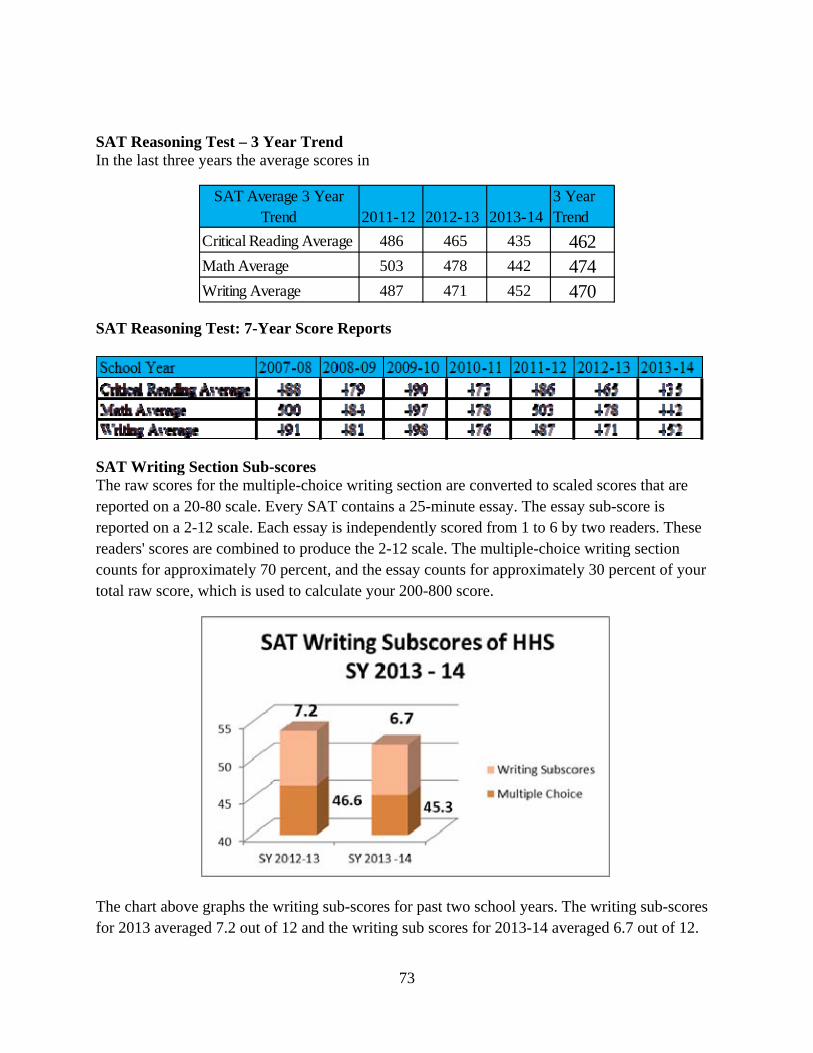
73
SAT Reasoning Test – 3 Year Trend In the last three years the average scores in
SAT Average 3 Year Trend 2011-12 2012-13 2013-14
3 Year Trend
Critical Reading Average 486 465 435 462Math Average 503 478 442 474Writing Average 487 471 452 470
SAT Reasoning Test: 7-Year Score Reports
SAT Writing Section Sub-scores The raw scores for the multiple-choice writing section are converted to scaled scores that are reported on a 20-80 scale. Every SAT contains a 25-minute essay. The essay sub-score is reported on a 2-12 scale. Each essay is independently scored from 1 to 6 by two readers. These readers' scores are combined to produce the 2-12 scale. The multiple-choice writing section counts for approximately 70 percent, and the essay counts for approximately 30 percent of your total raw score, which is used to calculate your 200-800 score.
The chart above graphs the writing sub-scores for past two school years. The writing sub-scores for 2013 averaged 7.2 out of 12 and the writing sub scores for 2013-14 averaged 6.7 out of 12.
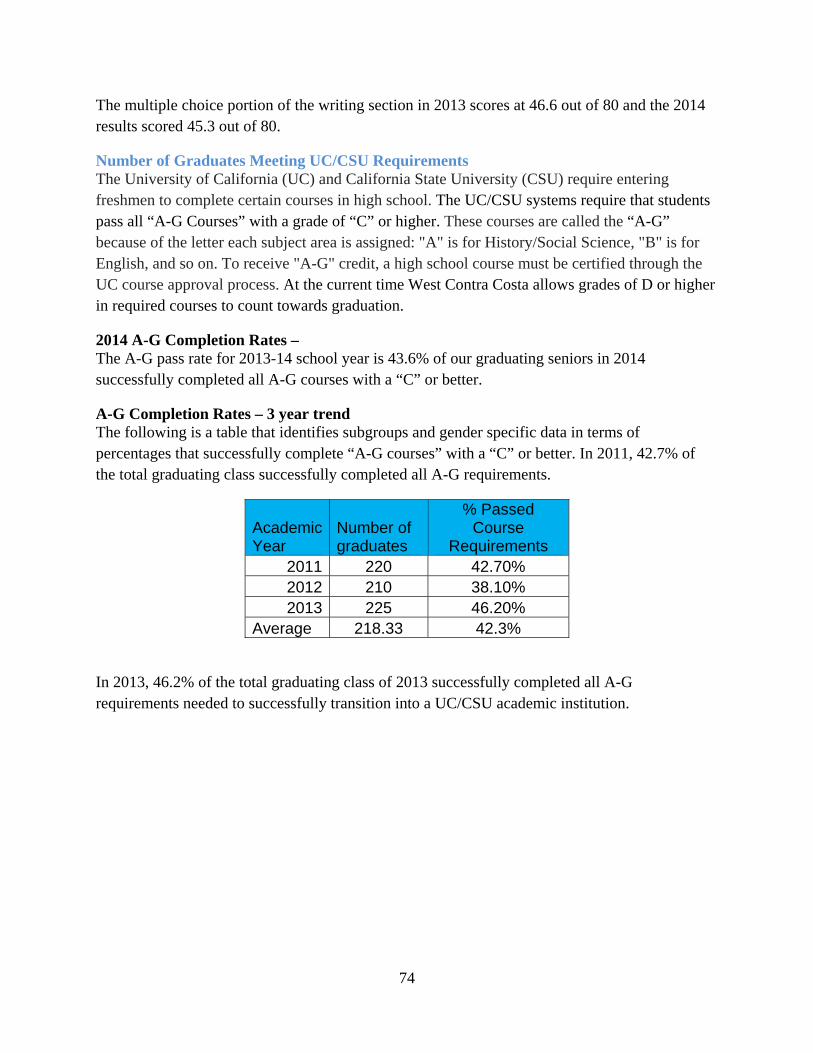
74
The multiple choice portion of the writing section in 2013 scores at 46.6 out of 80 and the 2014 results scored 45.3 out of 80.
Number of Graduates Meeting UC/CSU Requirements The University of California (UC) and California State University (CSU) require entering freshmen to complete certain courses in high school. The UC/CSU systems require that students pass all “A-G Courses” with a grade of “C” or higher. These courses are called the “A-G” because of the letter each subject area is assigned: "A" is for History/Social Science, "B" is for English, and so on. To receive "A-G" credit, a high school course must be certified through the UC course approval process. At the current time West Contra Costa allows grades of D or higher in required courses to count towards graduation.
2014 A-G Completion Rates – The A-G pass rate for 2013-14 school year is 43.6% of our graduating seniors in 2014 successfully completed all A-G courses with a “C” or better.
A-G Completion Rates – 3 year trend The following is a table that identifies subgroups and gender specific data in terms of percentages that successfully complete “A-G courses” with a “C” or better. In 2011, 42.7% of the total graduating class successfully completed all A-G requirements.
Academic Year
Number of graduates
% Passed Course
Requirements 2011 220 42.70% 2012 210 38.10% 2013 225 46.20%
Average 218.33 42.3%
In 2013, 46.2% of the total graduating class of 2013 successfully completed all A-G requirements needed to successfully transition into a UC/CSU academic institution.
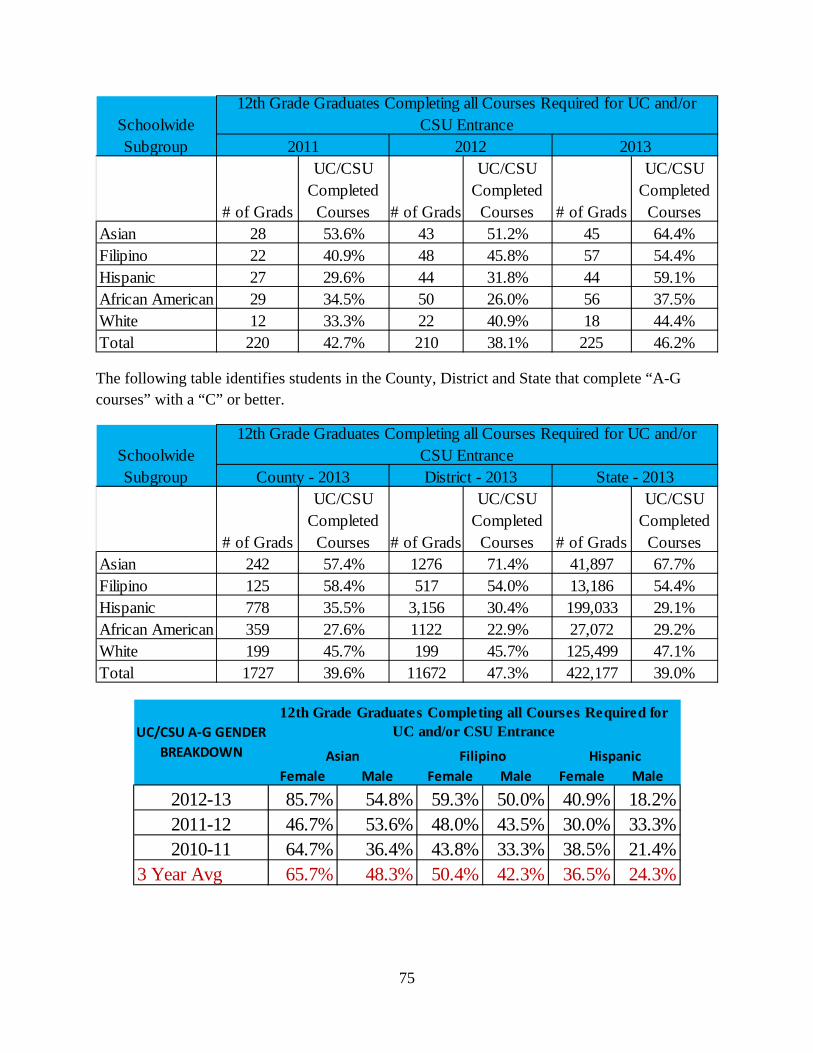
75
# of Grads
UC/CSU Completed
Courses # of Grads
UC/CSU Completed
Courses # of Grads
UC/CSU Completed
CoursesAsian 28 53.6% 43 51.2% 45 64.4%Filipino 22 40.9% 48 45.8% 57 54.4%Hispanic 27 29.6% 44 31.8% 44 59.1%African American 29 34.5% 50 26.0% 56 37.5%White 12 33.3% 22 40.9% 18 44.4%Total 220 42.7% 210 38.1% 225 46.2%
2011 20132012Schoolwide Subgroup
12th Grade Graduates Completing all Courses Required for UC and/or CSU Entrance
The following table identifies students in the County, District and State that complete “A-G courses” with a “C” or better.
# of Grads
UC/CSU Completed
Courses # of Grads
UC/CSU Completed
Courses # of Grads
UC/CSU Completed
CoursesAsian 242 57.4% 1276 71.4% 41,897 67.7%Filipino 125 58.4% 517 54.0% 13,186 54.4%Hispanic 778 35.5% 3,156 30.4% 199,033 29.1%African American 359 27.6% 1122 22.9% 27,072 29.2%White 199 45.7% 199 45.7% 125,499 47.1%Total 1727 39.6% 11672 47.3% 422,177 39.0%
County - 2013 District - 2013 State - 2013
12th Grade Graduates Completing all Courses Required for UC and/or CSU EntranceSchoolwide
Subgroup
Female Male Female Male Female Male
2012-13 85.7% 54.8% 59.3% 50.0% 40.9% 18.2%2011-12 46.7% 53.6% 48.0% 43.5% 30.0% 33.3%2010-11 64.7% 36.4% 43.8% 33.3% 38.5% 21.4%
3 Year Avg 65.7% 48.3% 50.4% 42.3% 36.5% 24.3%
12th Grade Graduates Completing all Courses Required for UC and/or CSU EntranceUC/CSU A‐G GENDER
BREAKDOWN Asian Filipino Hispanic
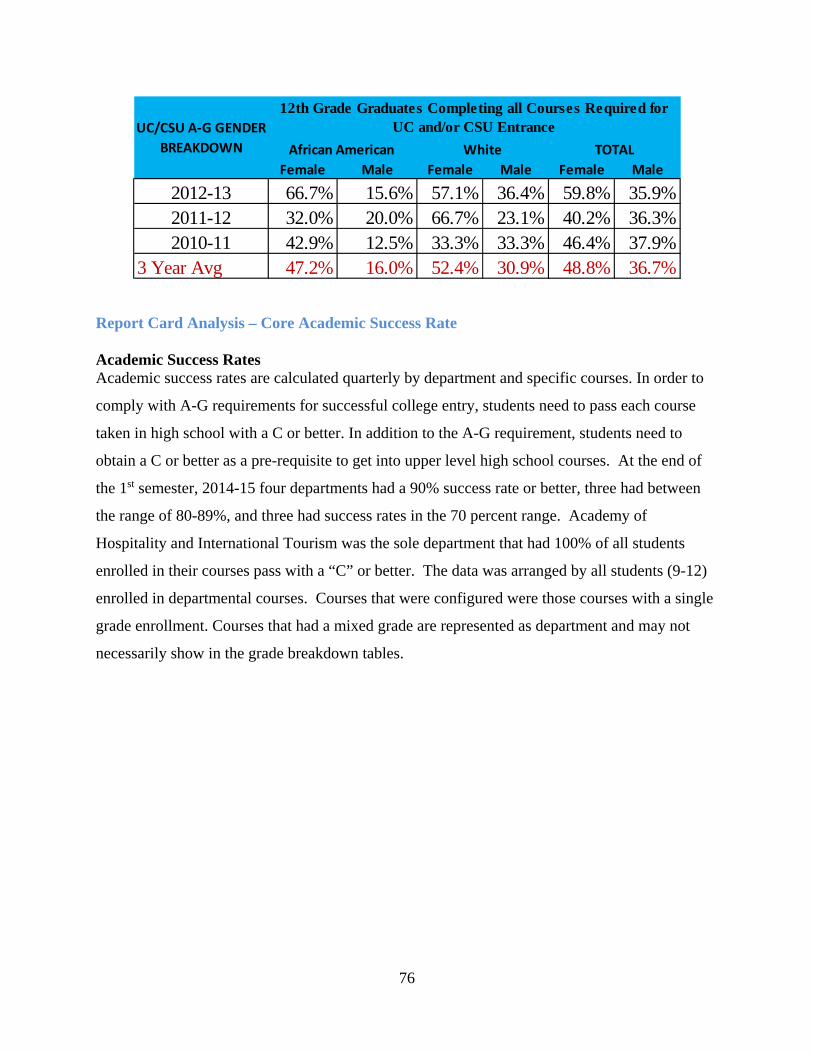
76
Female Male Female Male Female Male
2012-13 66.7% 15.6% 57.1% 36.4% 59.8% 35.9%2011-12 32.0% 20.0% 66.7% 23.1% 40.2% 36.3%2010-11 42.9% 12.5% 33.3% 33.3% 46.4% 37.9%
3 Year Avg 47.2% 16.0% 52.4% 30.9% 48.8% 36.7%
12th Grade Graduates Completing all Courses Required for UC and/or CSU EntranceUC/CSU A‐G GENDER
BREAKDOWN African American White TOTAL
Report Card Analysis – Core Academic Success Rate Academic Success Rates Academic success rates are calculated quarterly by department and specific courses. In order to
comply with A-G requirements for successful college entry, students need to pass each course
taken in high school with a C or better. In addition to the A-G requirement, students need to
obtain a C or better as a pre-requisite to get into upper level high school courses. At the end of
the 1st semester, 2014-15 four departments had a 90% success rate or better, three had between
the range of 80-89%, and three had success rates in the 70 percent range. Academy of
Hospitality and International Tourism was the sole department that had 100% of all students
enrolled in their courses pass with a “C” or better. The data was arranged by all students (9-12)
enrolled in departmental courses. Courses that were configured were those courses with a single
grade enrollment. Courses that had a mixed grade are represented as department and may not
necessarily show in the grade breakdown tables.
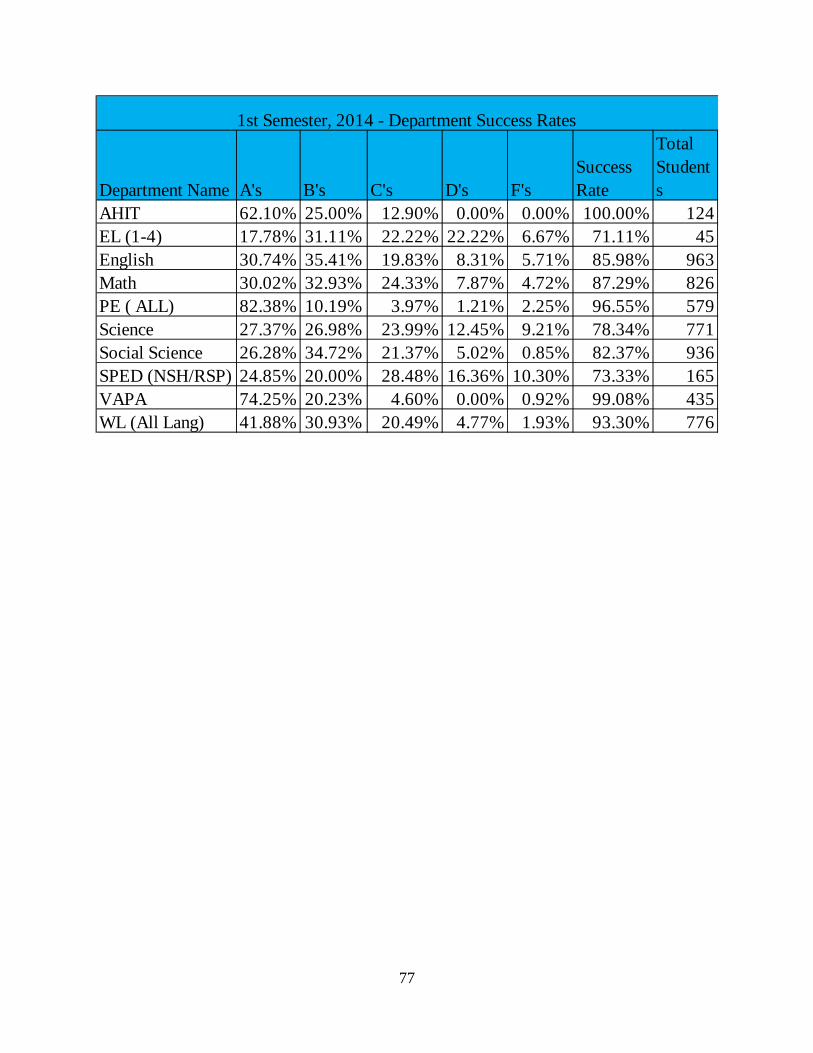
77
Department Name A's B's C's D's F'sSuccess Rate
Total Students
AHIT 62.10% 25.00% 12.90% 0.00% 0.00% 100.00% 124EL (1-4) 17.78% 31.11% 22.22% 22.22% 6.67% 71.11% 45English 30.74% 35.41% 19.83% 8.31% 5.71% 85.98% 963Math 30.02% 32.93% 24.33% 7.87% 4.72% 87.29% 826PE ( ALL) 82.38% 10.19% 3.97% 1.21% 2.25% 96.55% 579Science 27.37% 26.98% 23.99% 12.45% 9.21% 78.34% 771Social Science 26.28% 34.72% 21.37% 5.02% 0.85% 82.37% 936SPED (NSH/RSP) 24.85% 20.00% 28.48% 16.36% 10.30% 73.33% 165VAPA 74.25% 20.23% 4.60% 0.00% 0.92% 99.08% 435WL (All Lang) 41.88% 30.93% 20.49% 4.77% 1.93% 93.30% 776
1st Semester, 2014 - Department Success Rates
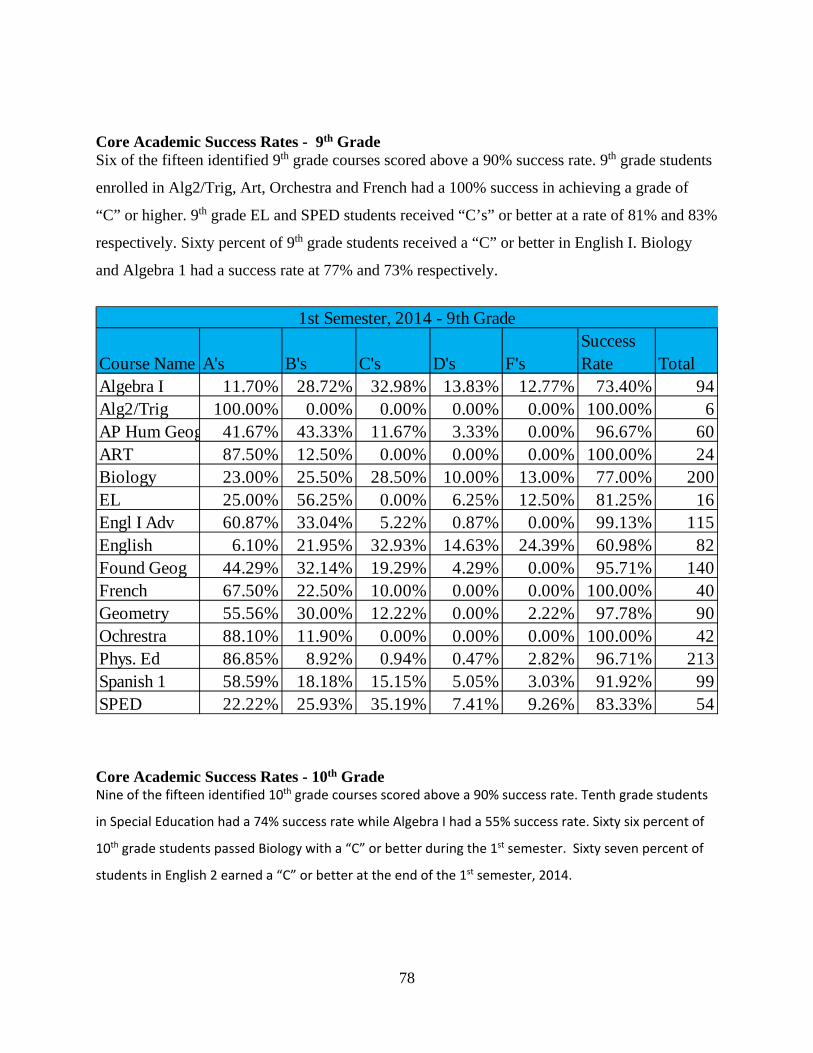
78
Core Academic Success Rates - 9th Grade Six of the fifteen identified 9th grade courses scored above a 90% success rate. 9th grade students
enrolled in Alg2/Trig, Art, Orchestra and French had a 100% success in achieving a grade of
“C” or higher. 9th grade EL and SPED students received “C’s” or better at a rate of 81% and 83%
respectively. Sixty percent of 9th grade students received a “C” or better in English I. Biology
and Algebra 1 had a success rate at 77% and 73% respectively.
Course Name A's B's C's D's F'sSuccess Rate Total
Algebra I 11.70% 28.72% 32.98% 13.83% 12.77% 73.40% 94Alg2/Trig 100.00% 0.00% 0.00% 0.00% 0.00% 100.00% 6AP Hum Geog 41.67% 43.33% 11.67% 3.33% 0.00% 96.67% 60ART 87.50% 12.50% 0.00% 0.00% 0.00% 100.00% 24Biology 23.00% 25.50% 28.50% 10.00% 13.00% 77.00% 200EL 25.00% 56.25% 0.00% 6.25% 12.50% 81.25% 16Engl I Adv 60.87% 33.04% 5.22% 0.87% 0.00% 99.13% 115English 6.10% 21.95% 32.93% 14.63% 24.39% 60.98% 82Found Geog 44.29% 32.14% 19.29% 4.29% 0.00% 95.71% 140French 67.50% 22.50% 10.00% 0.00% 0.00% 100.00% 40Geometry 55.56% 30.00% 12.22% 0.00% 2.22% 97.78% 90Ochrestra 88.10% 11.90% 0.00% 0.00% 0.00% 100.00% 42Phys. Ed 86.85% 8.92% 0.94% 0.47% 2.82% 96.71% 213Spanish 1 58.59% 18.18% 15.15% 5.05% 3.03% 91.92% 99SPED 22.22% 25.93% 35.19% 7.41% 9.26% 83.33% 54
1st Semester, 2014 - 9th Grade
Core Academic Success Rates - 10th Grade Nine of the fifteen identified 10th grade courses scored above a 90% success rate. Tenth grade students
in Special Education had a 74% success rate while Algebra I had a 55% success rate. Sixty six percent of
10th grade students passed Biology with a “C” or better during the 1st semester. Sixty seven percent of
students in English 2 earned a “C” or better at the end of the 1st semester, 2014.
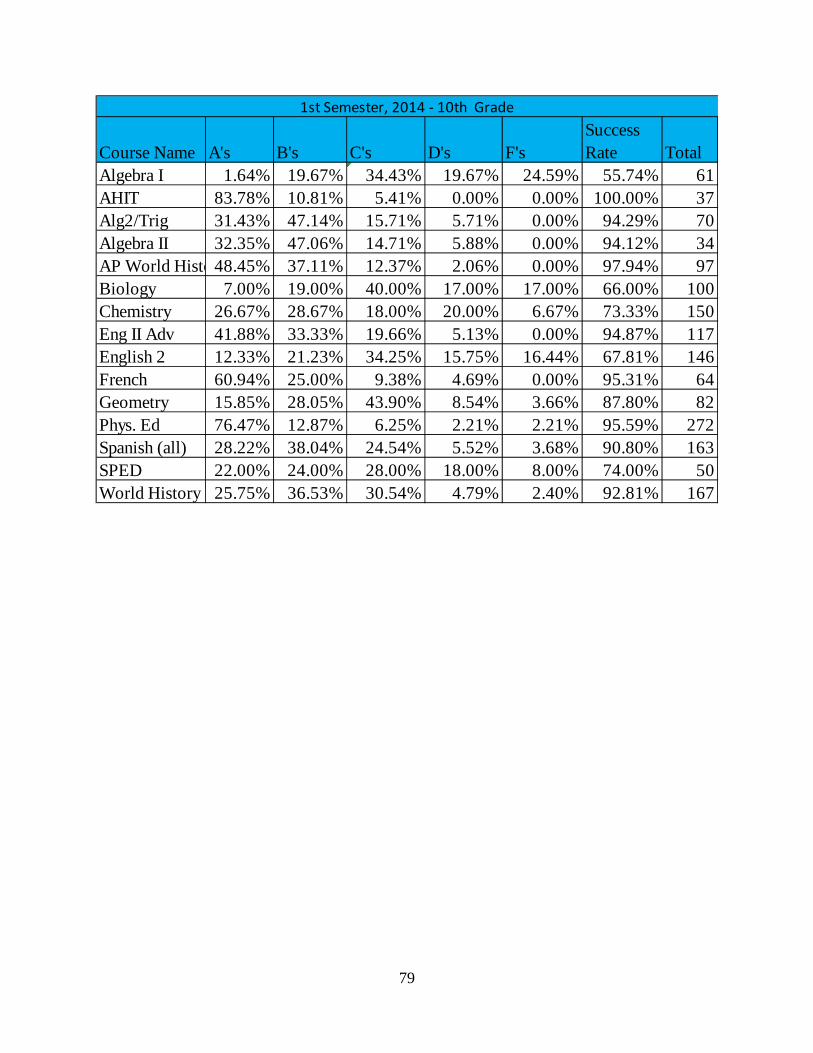
79
Course Name A's B's C's D's F'sSuccess Rate Total
Algebra I 1.64% 19.67% 34.43% 19.67% 24.59% 55.74% 61AHIT 83.78% 10.81% 5.41% 0.00% 0.00% 100.00% 37Alg2/Trig 31.43% 47.14% 15.71% 5.71% 0.00% 94.29% 70Algebra II 32.35% 47.06% 14.71% 5.88% 0.00% 94.12% 34AP World Histo48.45% 37.11% 12.37% 2.06% 0.00% 97.94% 97Biology 7.00% 19.00% 40.00% 17.00% 17.00% 66.00% 100Chemistry 26.67% 28.67% 18.00% 20.00% 6.67% 73.33% 150Eng II Adv 41.88% 33.33% 19.66% 5.13% 0.00% 94.87% 117English 2 12.33% 21.23% 34.25% 15.75% 16.44% 67.81% 146French 60.94% 25.00% 9.38% 4.69% 0.00% 95.31% 64Geometry 15.85% 28.05% 43.90% 8.54% 3.66% 87.80% 82Phys. Ed 76.47% 12.87% 6.25% 2.21% 2.21% 95.59% 272Spanish (all) 28.22% 38.04% 24.54% 5.52% 3.68% 90.80% 163SPED 22.00% 24.00% 28.00% 18.00% 8.00% 74.00% 50World History 25.75% 36.53% 30.54% 4.79% 2.40% 92.81% 167
1st Semester, 2014 ‐ 10th Grade
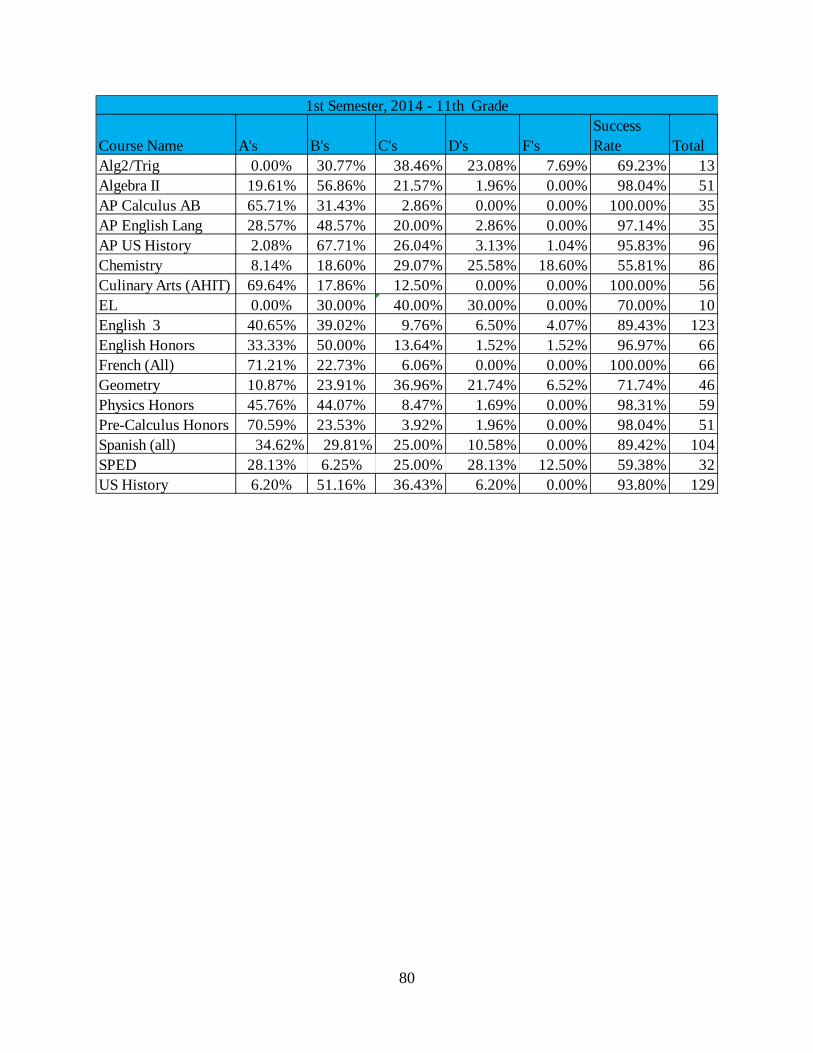
80
Course Name A's B's C's D's F'sSuccess Rate Total
Alg2/Trig 0.00% 30.77% 38.46% 23.08% 7.69% 69.23% 13Algebra II 19.61% 56.86% 21.57% 1.96% 0.00% 98.04% 51AP Calculus AB 65.71% 31.43% 2.86% 0.00% 0.00% 100.00% 35AP English Lang 28.57% 48.57% 20.00% 2.86% 0.00% 97.14% 35AP US History 2.08% 67.71% 26.04% 3.13% 1.04% 95.83% 96Chemistry 8.14% 18.60% 29.07% 25.58% 18.60% 55.81% 86Culinary Arts (AHIT) 69.64% 17.86% 12.50% 0.00% 0.00% 100.00% 56EL 0.00% 30.00% 40.00% 30.00% 0.00% 70.00% 10English 3 40.65% 39.02% 9.76% 6.50% 4.07% 89.43% 123English Honors 33.33% 50.00% 13.64% 1.52% 1.52% 96.97% 66French (All) 71.21% 22.73% 6.06% 0.00% 0.00% 100.00% 66Geometry 10.87% 23.91% 36.96% 21.74% 6.52% 71.74% 46Physics Honors 45.76% 44.07% 8.47% 1.69% 0.00% 98.31% 59Pre-Calculus Honors 70.59% 23.53% 3.92% 1.96% 0.00% 98.04% 51Spanish (all) 34.62% 29.81% 25.00% 10.58% 0.00% 89.42% 104SPED 28.13% 6.25% 25.00% 28.13% 12.50% 59.38% 32US History 6.20% 51.16% 36.43% 6.20% 0.00% 93.80% 129
1st Semester, 2014 - 11th Grade
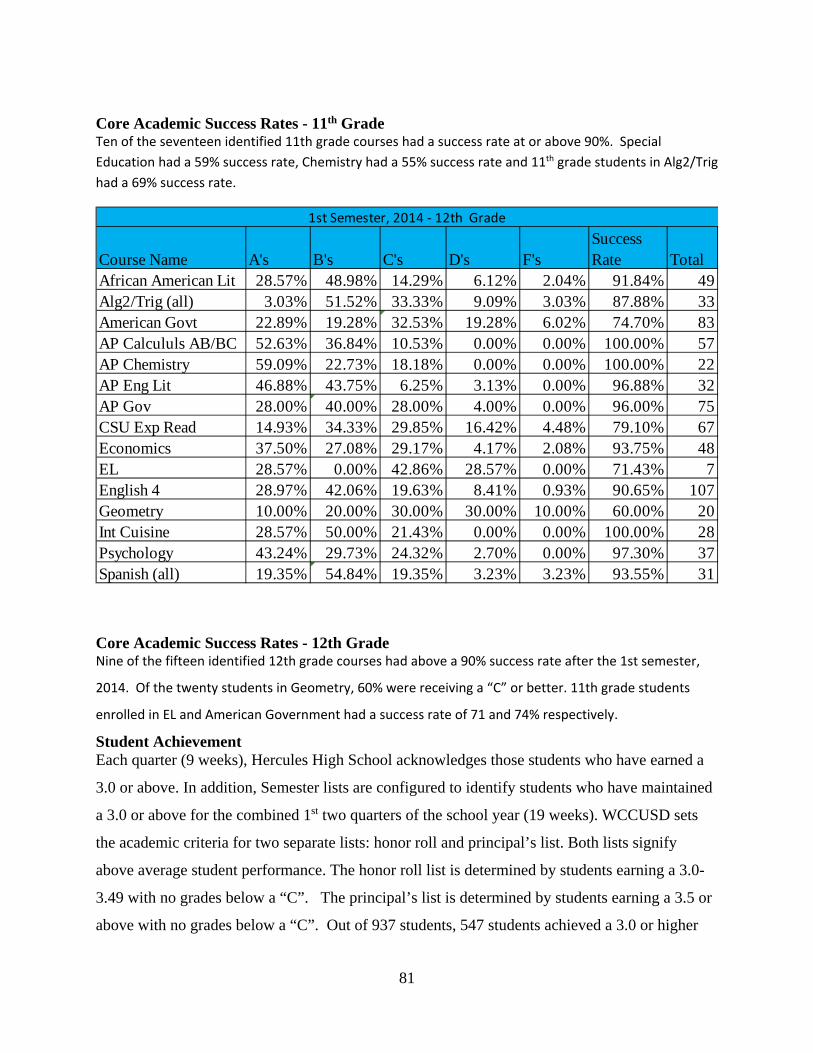
81
Core Academic Success Rates - 11th Grade Ten of the seventeen identified 11th grade courses had a success rate at or above 90%. Special
Education had a 59% success rate, Chemistry had a 55% success rate and 11th grade students in Alg2/Trig
had a 69% success rate.
Course Name A's B's C's D's F'sSuccess Rate Total
African American Lit 28.57% 48.98% 14.29% 6.12% 2.04% 91.84% 49Alg2/Trig (all) 3.03% 51.52% 33.33% 9.09% 3.03% 87.88% 33American Govt 22.89% 19.28% 32.53% 19.28% 6.02% 74.70% 83AP Calcululs AB/BC 52.63% 36.84% 10.53% 0.00% 0.00% 100.00% 57AP Chemistry 59.09% 22.73% 18.18% 0.00% 0.00% 100.00% 22AP Eng Lit 46.88% 43.75% 6.25% 3.13% 0.00% 96.88% 32AP Gov 28.00% 40.00% 28.00% 4.00% 0.00% 96.00% 75CSU Exp Read 14.93% 34.33% 29.85% 16.42% 4.48% 79.10% 67Economics 37.50% 27.08% 29.17% 4.17% 2.08% 93.75% 48EL 28.57% 0.00% 42.86% 28.57% 0.00% 71.43% 7English 4 28.97% 42.06% 19.63% 8.41% 0.93% 90.65% 107Geometry 10.00% 20.00% 30.00% 30.00% 10.00% 60.00% 20Int Cuisine 28.57% 50.00% 21.43% 0.00% 0.00% 100.00% 28Psychology 43.24% 29.73% 24.32% 2.70% 0.00% 97.30% 37Spanish (all) 19.35% 54.84% 19.35% 3.23% 3.23% 93.55% 31
1st Semester, 2014 ‐ 12th Grade
Core Academic Success Rates - 12th Grade Nine of the fifteen identified 12th grade courses had above a 90% success rate after the 1st semester,
2014. Of the twenty students in Geometry, 60% were receiving a “C” or better. 11th grade students
enrolled in EL and American Government had a success rate of 71 and 74% respectively.
Student Achievement Each quarter (9 weeks), Hercules High School acknowledges those students who have earned a
3.0 or above. In addition, Semester lists are configured to identify students who have maintained
a 3.0 or above for the combined 1st two quarters of the school year (19 weeks). WCCUSD sets
the academic criteria for two separate lists: honor roll and principal’s list. Both lists signify
above average student performance. The honor roll list is determined by students earning a 3.0-
3.49 with no grades below a “C”. The principal’s list is determined by students earning a 3.5 or
above with no grades below a “C”. Out of 937 students, 547 students achieved a 3.0 or higher
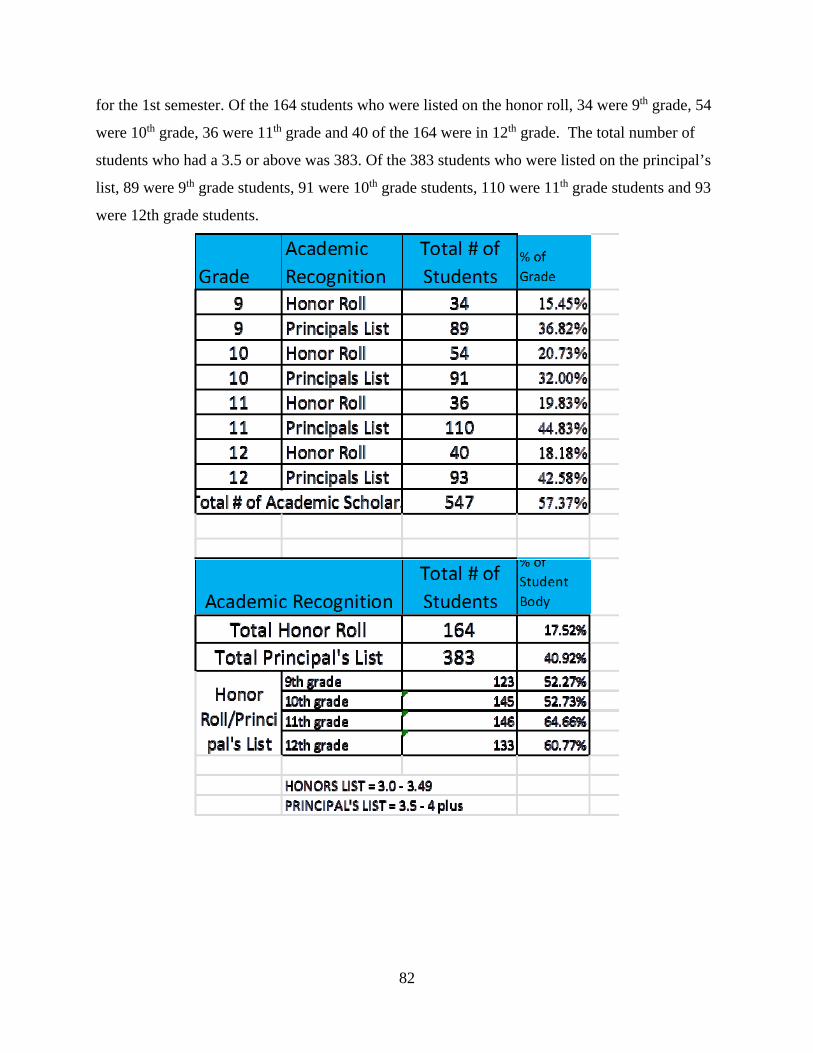
82
for the 1st semester. Of the 164 students who were listed on the honor roll, 34 were 9th grade, 54
were 10th grade, 36 were 11th grade and 40 of the 164 were in 12th grade. The total number of
students who had a 3.5 or above was 383. Of the 383 students who were listed on the principal’s
list, 89 were 9th grade students, 91 were 10th grade students, 110 were 11th grade students and 93
were 12th grade students.
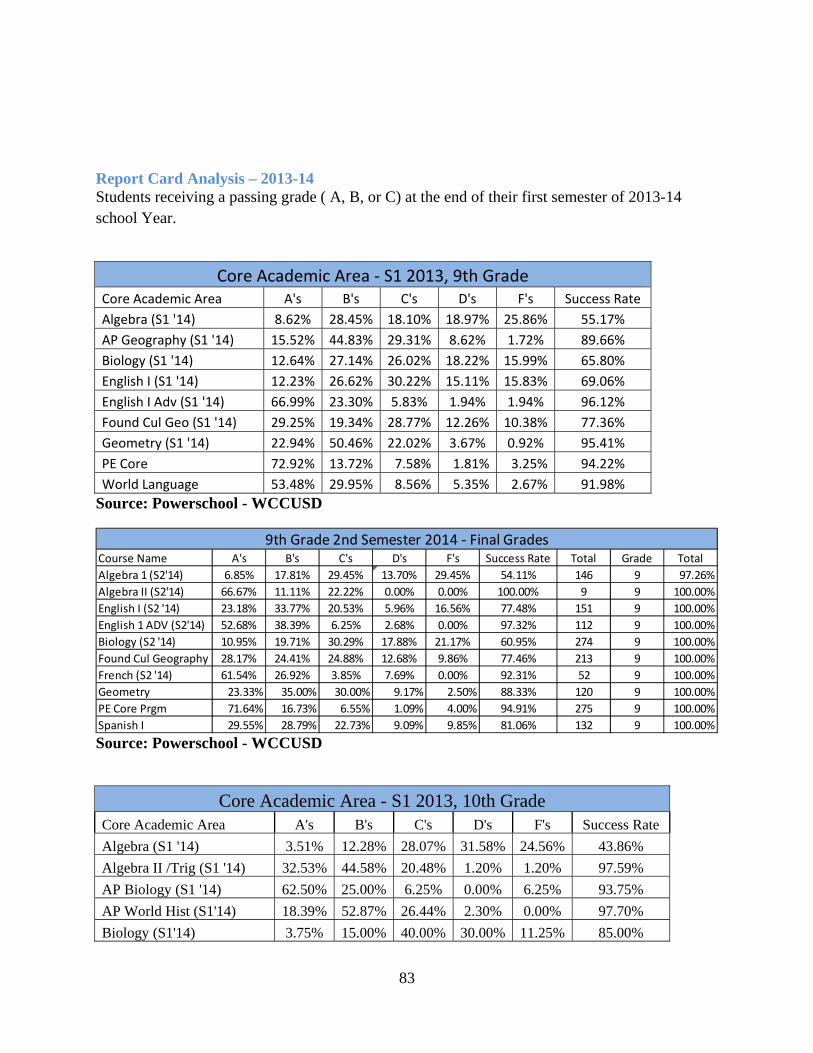
83
Report Card Analysis – 2013-14 Students receiving a passing grade ( A, B, or C) at the end of their first semester of 2013-14 school Year.
Core Academic Area ‐ S1 2013, 9th Grade Core Academic Area A's B's C's D's F's Success Rate
Algebra (S1 '14) 8.62% 28.45% 18.10% 18.97% 25.86% 55.17%
AP Geography (S1 '14) 15.52% 44.83% 29.31% 8.62% 1.72% 89.66%
Biology (S1 '14) 12.64% 27.14% 26.02% 18.22% 15.99% 65.80%
English I (S1 '14) 12.23% 26.62% 30.22% 15.11% 15.83% 69.06%
English I Adv (S1 '14) 66.99% 23.30% 5.83% 1.94% 1.94% 96.12%
Found Cul Geo (S1 '14) 29.25% 19.34% 28.77% 12.26% 10.38% 77.36%
Geometry (S1 '14) 22.94% 50.46% 22.02% 3.67% 0.92% 95.41%
PE Core 72.92% 13.72% 7.58% 1.81% 3.25% 94.22%
World Language 53.48% 29.95% 8.56% 5.35% 2.67% 91.98%
Source: Powerschool - WCCUSD
Course Name A's B's C's D's F's Success Rate Total Grade Total
Algebra 1 (S2'14) 6.85% 17.81% 29.45% 13.70% 29.45% 54.11% 146 9 97.26%
Algebra II (S2'14) 66.67% 11.11% 22.22% 0.00% 0.00% 100.00% 9 9 100.00%
English I (S2 '14) 23.18% 33.77% 20.53% 5.96% 16.56% 77.48% 151 9 100.00%
English 1 ADV (S2'14) 52.68% 38.39% 6.25% 2.68% 0.00% 97.32% 112 9 100.00%
Biology (S2 '14) 10.95% 19.71% 30.29% 17.88% 21.17% 60.95% 274 9 100.00%
Found Cul Geography 28.17% 24.41% 24.88% 12.68% 9.86% 77.46% 213 9 100.00%
French (S2 '14) 61.54% 26.92% 3.85% 7.69% 0.00% 92.31% 52 9 100.00%
Geometry 23.33% 35.00% 30.00% 9.17% 2.50% 88.33% 120 9 100.00%
PE Core Prgm 71.64% 16.73% 6.55% 1.09% 4.00% 94.91% 275 9 100.00%
Spanish I 29.55% 28.79% 22.73% 9.09% 9.85% 81.06% 132 9 100.00%
9th Grade 2nd Semester 2014 ‐ Final Grades
Source: Powerschool - WCCUSD
Core Academic Area - S1 2013, 10th Grade Core Academic Area A's B's C's D's F's Success Rate
Algebra (S1 '14) 3.51% 12.28% 28.07% 31.58% 24.56% 43.86%
Algebra II /Trig (S1 '14) 32.53% 44.58% 20.48% 1.20% 1.20% 97.59%
AP Biology (S1 '14) 62.50% 25.00% 6.25% 0.00% 6.25% 93.75%
AP World Hist (S1'14) 18.39% 52.87% 26.44% 2.30% 0.00% 97.70%
Biology (S1'14) 3.75% 15.00% 40.00% 30.00% 11.25% 85.00%
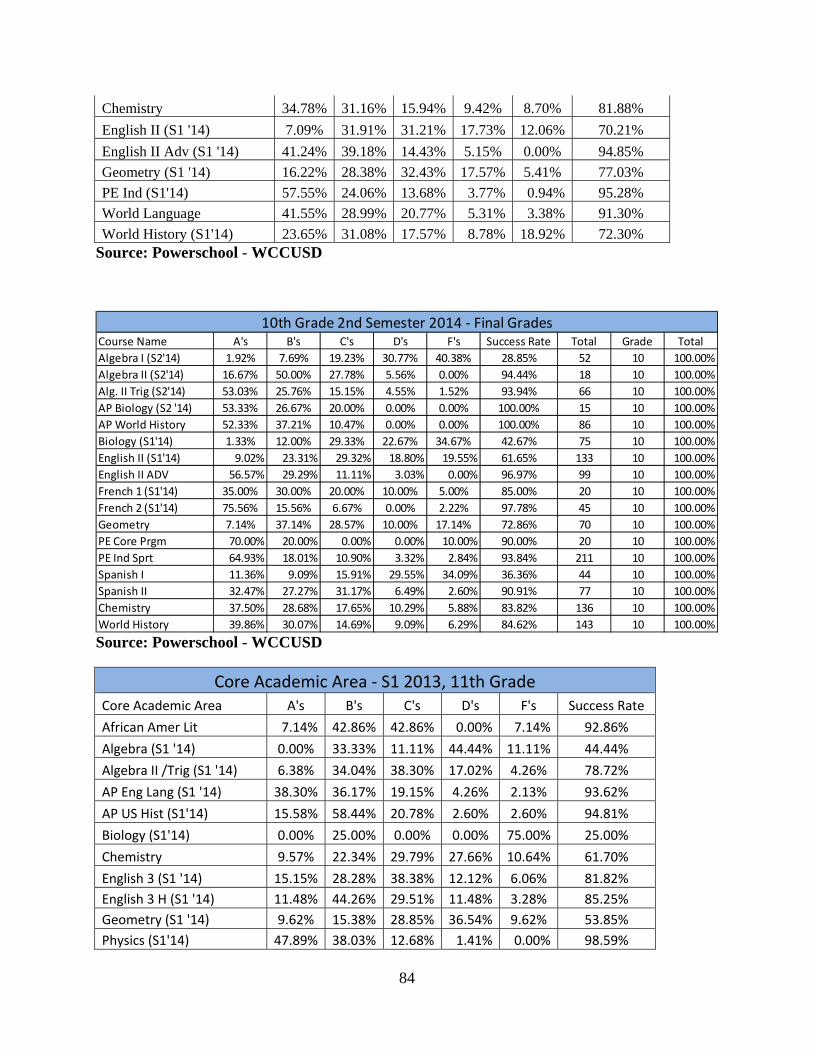
84
Chemistry 34.78% 31.16% 15.94% 9.42% 8.70% 81.88%
English II (S1 '14) 7.09% 31.91% 31.21% 17.73% 12.06% 70.21%
English II Adv (S1 '14) 41.24% 39.18% 14.43% 5.15% 0.00% 94.85%
Geometry (S1 '14) 16.22% 28.38% 32.43% 17.57% 5.41% 77.03%
PE Ind (S1'14) 57.55% 24.06% 13.68% 3.77% 0.94% 95.28%
World Language 41.55% 28.99% 20.77% 5.31% 3.38% 91.30%
World History (S1'14) 23.65% 31.08% 17.57% 8.78% 18.92% 72.30% Source: Powerschool - WCCUSD
Course Name A's B's C's D's F's Success Rate Total Grade Total
Algebra I (S2'14) 1.92% 7.69% 19.23% 30.77% 40.38% 28.85% 52 10 100.00%
Algebra II (S2'14) 16.67% 50.00% 27.78% 5.56% 0.00% 94.44% 18 10 100.00%
Alg. II Trig (S2'14) 53.03% 25.76% 15.15% 4.55% 1.52% 93.94% 66 10 100.00%
AP Biology (S2 '14) 53.33% 26.67% 20.00% 0.00% 0.00% 100.00% 15 10 100.00%
AP World History 52.33% 37.21% 10.47% 0.00% 0.00% 100.00% 86 10 100.00%
Biology (S1'14) 1.33% 12.00% 29.33% 22.67% 34.67% 42.67% 75 10 100.00%
English II (S1'14) 9.02% 23.31% 29.32% 18.80% 19.55% 61.65% 133 10 100.00%
English II ADV 56.57% 29.29% 11.11% 3.03% 0.00% 96.97% 99 10 100.00%
French 1 (S1'14) 35.00% 30.00% 20.00% 10.00% 5.00% 85.00% 20 10 100.00%
French 2 (S1'14) 75.56% 15.56% 6.67% 0.00% 2.22% 97.78% 45 10 100.00%
Geometry 7.14% 37.14% 28.57% 10.00% 17.14% 72.86% 70 10 100.00%
PE Core Prgm 70.00% 20.00% 0.00% 0.00% 10.00% 90.00% 20 10 100.00%
PE Ind Sprt 64.93% 18.01% 10.90% 3.32% 2.84% 93.84% 211 10 100.00%
Spanish I 11.36% 9.09% 15.91% 29.55% 34.09% 36.36% 44 10 100.00%
Spanish II 32.47% 27.27% 31.17% 6.49% 2.60% 90.91% 77 10 100.00%
Chemistry 37.50% 28.68% 17.65% 10.29% 5.88% 83.82% 136 10 100.00%
World History 39.86% 30.07% 14.69% 9.09% 6.29% 84.62% 143 10 100.00%
10th Grade 2nd Semester 2014 ‐ Final Grades
Source: Powerschool - WCCUSD
Core Academic Area ‐ S1 2013, 11th Grade Core Academic Area A's B's C's D's F's Success Rate
African Amer Lit 7.14% 42.86% 42.86% 0.00% 7.14% 92.86%
Algebra (S1 '14) 0.00% 33.33% 11.11% 44.44% 11.11% 44.44%
Algebra II /Trig (S1 '14) 6.38% 34.04% 38.30% 17.02% 4.26% 78.72%
AP Eng Lang (S1 '14) 38.30% 36.17% 19.15% 4.26% 2.13% 93.62%
AP US Hist (S1'14) 15.58% 58.44% 20.78% 2.60% 2.60% 94.81%
Biology (S1'14) 0.00% 25.00% 0.00% 0.00% 75.00% 25.00%
Chemistry 9.57% 22.34% 29.79% 27.66% 10.64% 61.70%
English 3 (S1 '14) 15.15% 28.28% 38.38% 12.12% 6.06% 81.82%
English 3 H (S1 '14) 11.48% 44.26% 29.51% 11.48% 3.28% 85.25%
Geometry (S1 '14) 9.62% 15.38% 28.85% 36.54% 9.62% 53.85%
Physics (S1'14) 47.89% 38.03% 12.68% 1.41% 0.00% 98.59%
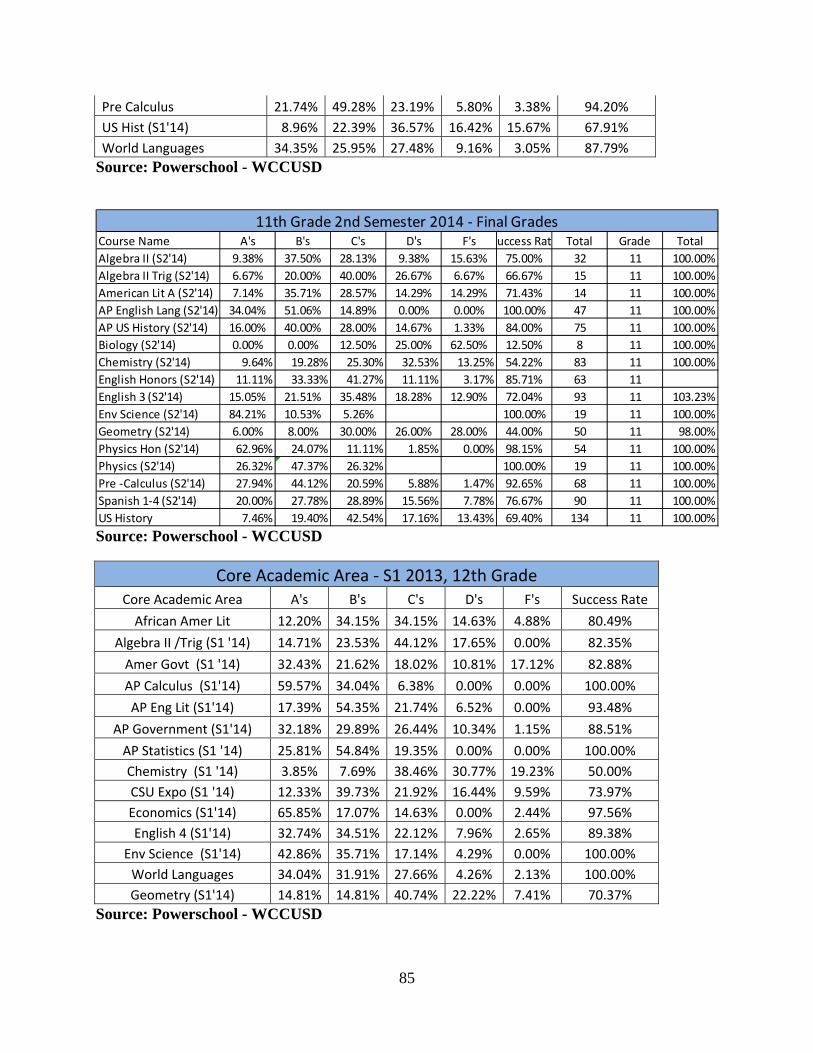
85
Pre Calculus 21.74% 49.28% 23.19% 5.80% 3.38% 94.20%
US Hist (S1'14) 8.96% 22.39% 36.57% 16.42% 15.67% 67.91%
World Languages 34.35% 25.95% 27.48% 9.16% 3.05% 87.79%
Source: Powerschool - WCCUSD
Course Name A's B's C's D's F's uccess Rat Total Grade Total
Algebra II (S2'14) 9.38% 37.50% 28.13% 9.38% 15.63% 75.00% 32 11 100.00%
Algebra II Trig (S2'14) 6.67% 20.00% 40.00% 26.67% 6.67% 66.67% 15 11 100.00%
American Lit A (S2'14) 7.14% 35.71% 28.57% 14.29% 14.29% 71.43% 14 11 100.00%
AP English Lang (S2'14) 34.04% 51.06% 14.89% 0.00% 0.00% 100.00% 47 11 100.00%
AP US History (S2'14) 16.00% 40.00% 28.00% 14.67% 1.33% 84.00% 75 11 100.00%
Biology (S2'14) 0.00% 0.00% 12.50% 25.00% 62.50% 12.50% 8 11 100.00%
Chemistry (S2'14) 9.64% 19.28% 25.30% 32.53% 13.25% 54.22% 83 11 100.00%
English Honors (S2'14) 11.11% 33.33% 41.27% 11.11% 3.17% 85.71% 63 11
English 3 (S2'14) 15.05% 21.51% 35.48% 18.28% 12.90% 72.04% 93 11 103.23%
Env Science (S2'14) 84.21% 10.53% 5.26% 100.00% 19 11 100.00%
Geometry (S2'14) 6.00% 8.00% 30.00% 26.00% 28.00% 44.00% 50 11 98.00%
Physics Hon (S2'14) 62.96% 24.07% 11.11% 1.85% 0.00% 98.15% 54 11 100.00%
Physics (S2'14) 26.32% 47.37% 26.32% 100.00% 19 11 100.00%
Pre ‐Calculus (S2'14) 27.94% 44.12% 20.59% 5.88% 1.47% 92.65% 68 11 100.00%
Spanish 1‐4 (S2'14) 20.00% 27.78% 28.89% 15.56% 7.78% 76.67% 90 11 100.00%
US History 7.46% 19.40% 42.54% 17.16% 13.43% 69.40% 134 11 100.00%
11th Grade 2nd Semester 2014 ‐ Final Grades
Source: Powerschool - WCCUSD
Core Academic Area ‐ S1 2013, 12th Grade Core Academic Area A's B's C's D's F's Success Rate
African Amer Lit 12.20% 34.15% 34.15% 14.63% 4.88% 80.49%
Algebra II /Trig (S1 '14) 14.71% 23.53% 44.12% 17.65% 0.00% 82.35%
Amer Govt (S1 '14) 32.43% 21.62% 18.02% 10.81% 17.12% 82.88%
AP Calculus (S1'14) 59.57% 34.04% 6.38% 0.00% 0.00% 100.00%
AP Eng Lit (S1'14) 17.39% 54.35% 21.74% 6.52% 0.00% 93.48%
AP Government (S1'14) 32.18% 29.89% 26.44% 10.34% 1.15% 88.51%
AP Statistics (S1 '14) 25.81% 54.84% 19.35% 0.00% 0.00% 100.00%
Chemistry (S1 '14) 3.85% 7.69% 38.46% 30.77% 19.23% 50.00%
CSU Expo (S1 '14) 12.33% 39.73% 21.92% 16.44% 9.59% 73.97%
Economics (S1'14) 65.85% 17.07% 14.63% 0.00% 2.44% 97.56%
English 4 (S1'14) 32.74% 34.51% 22.12% 7.96% 2.65% 89.38%
Env Science (S1'14) 42.86% 35.71% 17.14% 4.29% 0.00% 100.00%
World Languages 34.04% 31.91% 27.66% 4.26% 2.13% 100.00%
Geometry (S1'14) 14.81% 14.81% 40.74% 22.22% 7.41% 70.37%
Source: Powerschool - WCCUSD
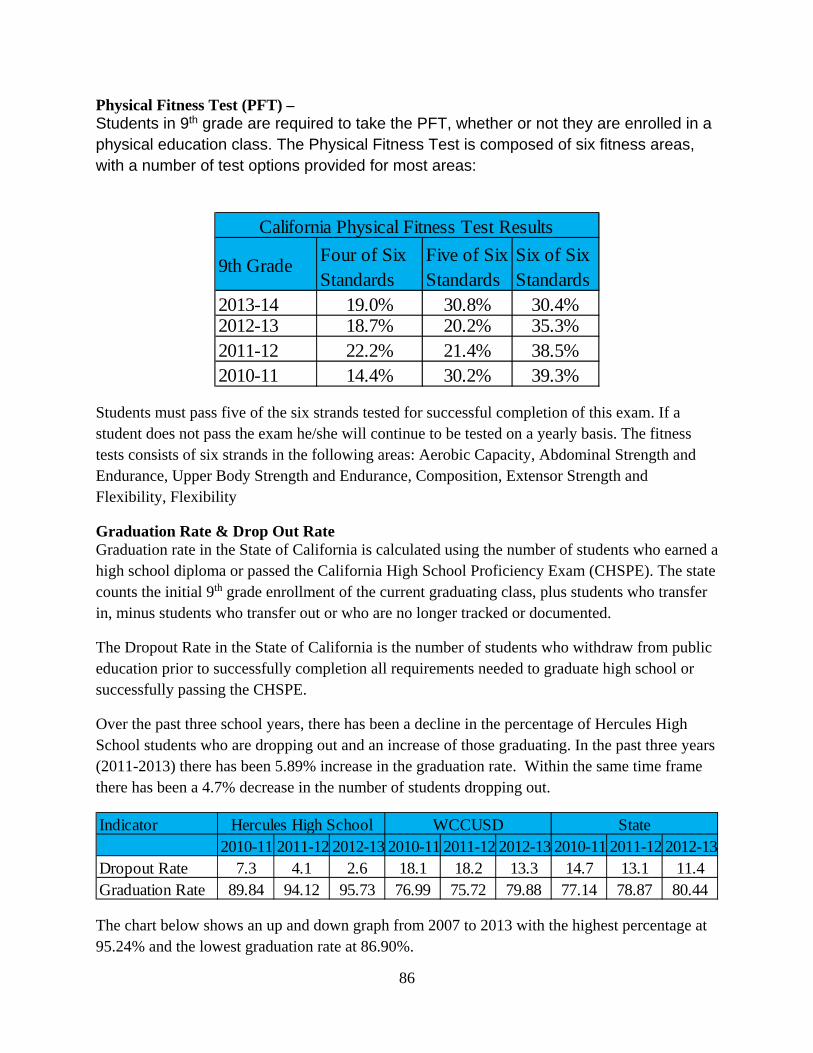
86
Physical Fitness Test (PFT) – Students in 9th grade are required to take the PFT, whether or not they are enrolled in a physical education class. The Physical Fitness Test is composed of six fitness areas, with a number of test options provided for most areas:
9th GradeFour of Six Standards
Five of Six Standards
Six of Six Standards
2013-14 19.0% 30.8% 30.4%2012-13 18.7% 20.2% 35.3%2011-12 22.2% 21.4% 38.5%2010-11 14.4% 30.2% 39.3%
California Physical Fitness Test Results
Students must pass five of the six strands tested for successful completion of this exam. If a student does not pass the exam he/she will continue to be tested on a yearly basis. The fitness tests consists of six strands in the following areas: Aerobic Capacity, Abdominal Strength and Endurance, Upper Body Strength and Endurance, Composition, Extensor Strength and Flexibility, Flexibility
Graduation Rate & Drop Out Rate Graduation rate in the State of California is calculated using the number of students who earned a high school diploma or passed the California High School Proficiency Exam (CHSPE). The state counts the initial 9th grade enrollment of the current graduating class, plus students who transfer in, minus students who transfer out or who are no longer tracked or documented.
The Dropout Rate in the State of California is the number of students who withdraw from public education prior to successfully completion all requirements needed to graduate high school or successfully passing the CHSPE.
Over the past three school years, there has been a decline in the percentage of Hercules High School students who are dropping out and an increase of those graduating. In the past three years (2011-2013) there has been 5.89% increase in the graduation rate. Within the same time frame there has been a 4.7% decrease in the number of students dropping out.
Indicator2010-11 2011-12 2012-13 2010-11 2011-12 2012-13 2010-11 2011-12 2012-13
Dropout Rate 7.3 4.1 2.6 18.1 18.2 13.3 14.7 13.1 11.4Graduation Rate 89.84 94.12 95.73 76.99 75.72 79.88 77.14 78.87 80.44
Hercules High School WCCUSD State
The chart below shows an up and down graph from 2007 to 2013 with the highest percentage at 95.24% and the lowest graduation rate at 86.90%.
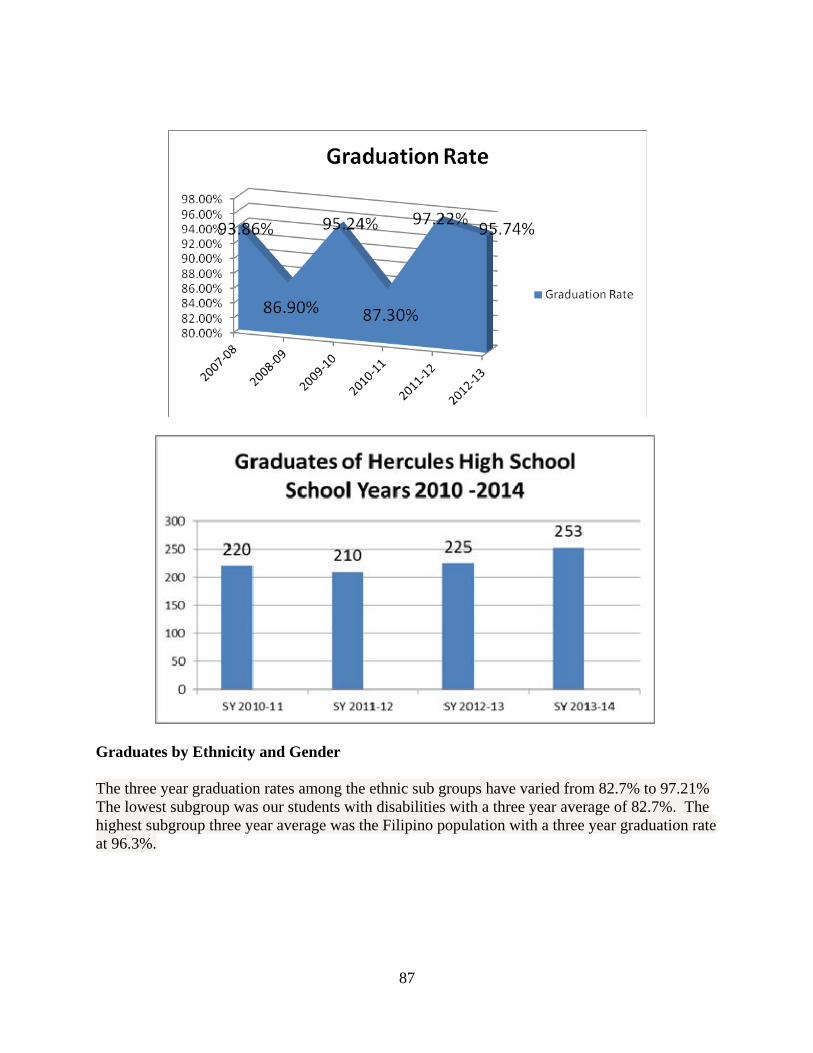
87
Graduates by Ethnicity and Gender The three year graduation rates among the ethnic sub groups have varied from 82.7% to 97.21% The lowest subgroup was our students with disabilities with a three year average of 82.7%. The highest subgroup three year average was the Filipino population with a three year graduation rate at 96.3%.
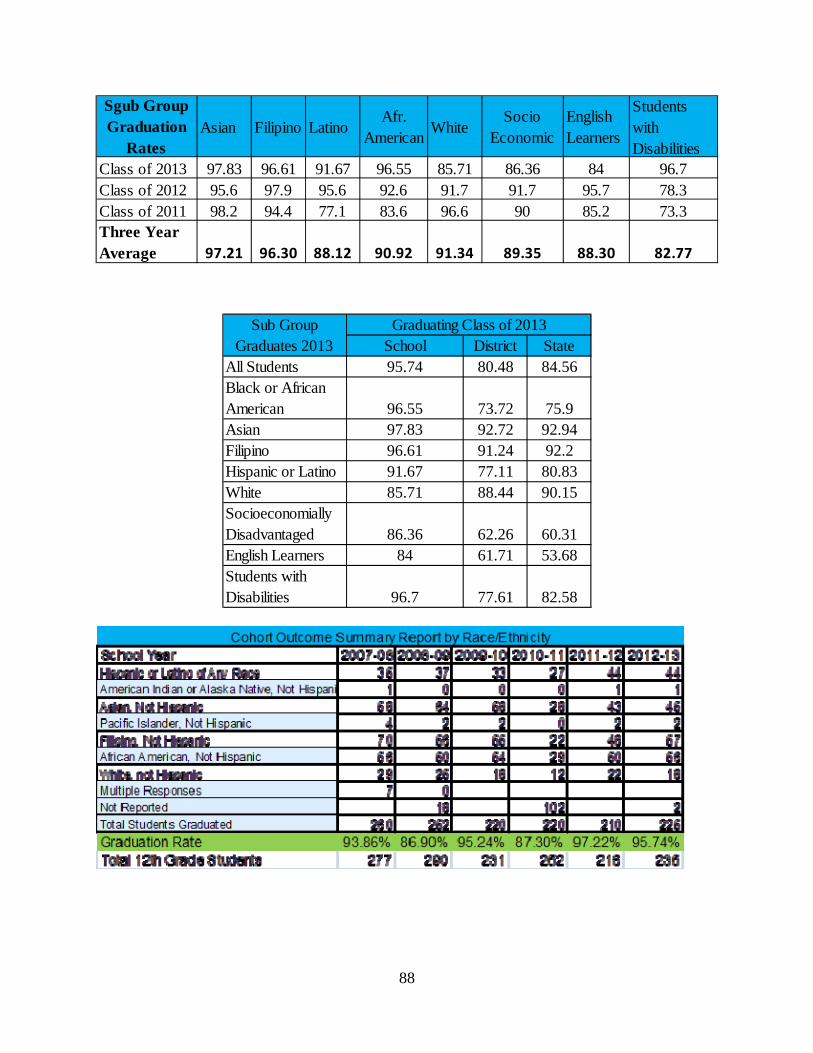
88
Class of 2013 97.83 96.61 91.67 96.55 85.71 86.36 84 96.7Class of 2012 95.6 97.9 95.6 92.6 91.7 91.7 95.7 78.3Class of 2011 98.2 94.4 77.1 83.6 96.6 90 85.2 73.3Three Year Average 97.21 96.30 88.12 90.92 91.34 89.35 88.30 82.77
Socio Economic
Sgub Group Graduation
Rates
Afr. American
Students with Disabilities
Asian Filipino Latino WhiteEnglish Learners
School District StateAll Students 95.74 80.48 84.56Black or African American 96.55 73.72 75.9Asian 97.83 92.72 92.94Filipino 96.61 91.24 92.2Hispanic or Latino 91.67 77.11 80.83White 85.71 88.44 90.15Socioeconomially Disadvantaged 86.36 62.26 60.31English Learners 84 61.71 53.68Students with Disabilities 96.7 77.61 82.58
Graduating Class of 2013Sub Group Graduates 2013
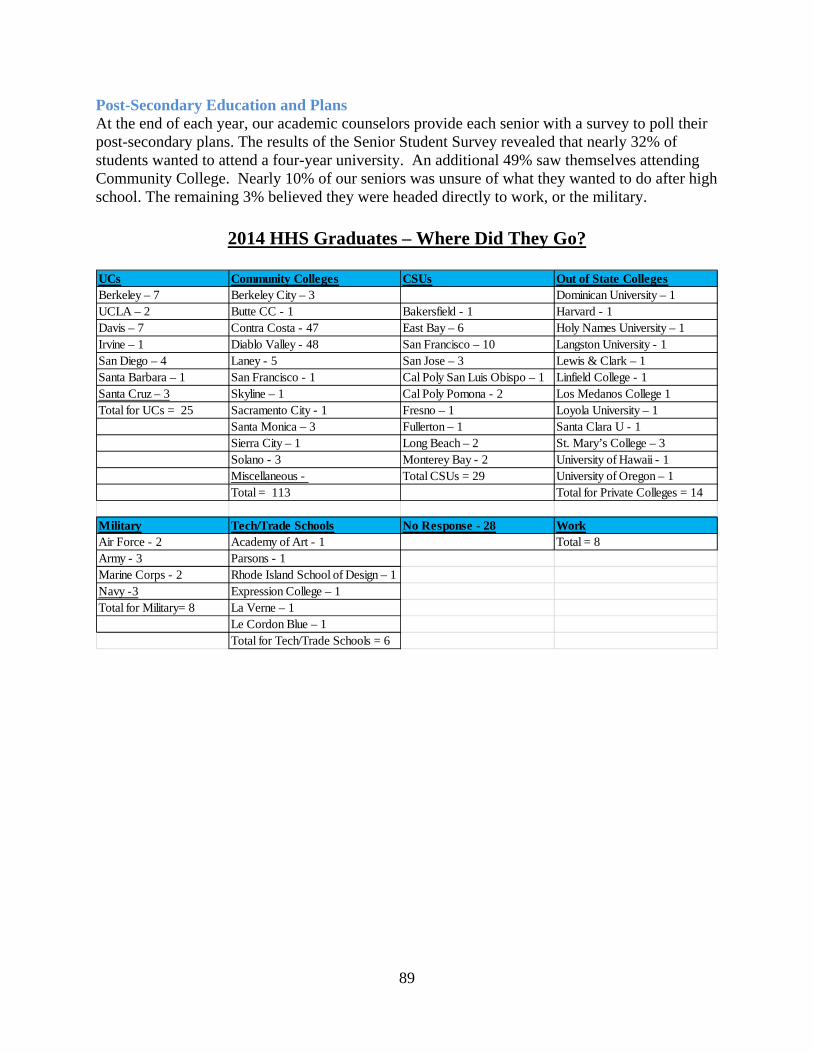
89
Post-Secondary Education and Plans At the end of each year, our academic counselors provide each senior with a survey to poll their post-secondary plans. The results of the Senior Student Survey revealed that nearly 32% of students wanted to attend a four-year university. An additional 49% saw themselves attending Community College. Nearly 10% of our seniors was unsure of what they wanted to do after high school. The remaining 3% believed they were headed directly to work, or the military.
2014 HHS Graduates – Where Did They Go?
UCs Community Colleges CSUs Out of State CollegesBerkeley – 7 Berkeley City – 3 Dominican University – 1UCLA – 2 Butte CC - 1 Bakersfield - 1 Harvard - 1Davis – 7 Contra Costa - 47 East Bay – 6 Holy Names University – 1Irvine – 1 Diablo Valley - 48 San Francisco – 10 Langston University - 1San Diego – 4 Laney - 5 San Jose – 3 Lewis & Clark – 1Santa Barbara – 1 San Francisco - 1 Cal Poly San Luis Obispo – 1 Linfield College - 1Santa Cruz – 3 Skyline – 1 Cal Poly Pomona - 2 Los Medanos College 1Total for UCs = 25 Sacramento City - 1 Fresno – 1 Loyola University – 1
Santa Monica – 3 Fullerton – 1 Santa Clara U - 1Sierra City – 1 Long Beach – 2 St. Mary’s College – 3Solano - 3 Monterey Bay - 2 University of Hawaii - 1Miscellaneous - Total CSUs = 29 University of Oregon – 1Total = 113 Total for Private Colleges = 14
Military Tech/Trade Schools No Response - 28 WorkAir Force - 2 Academy of Art - 1 Total = 8Army - 3 Parsons - 1Marine Corps - 2 Rhode Island School of Design – 1Navy -3 Expression College – 1Total for Military= 8 La Verne – 1
Le Cordon Blue – 1Total for Tech/Trade Schools = 6
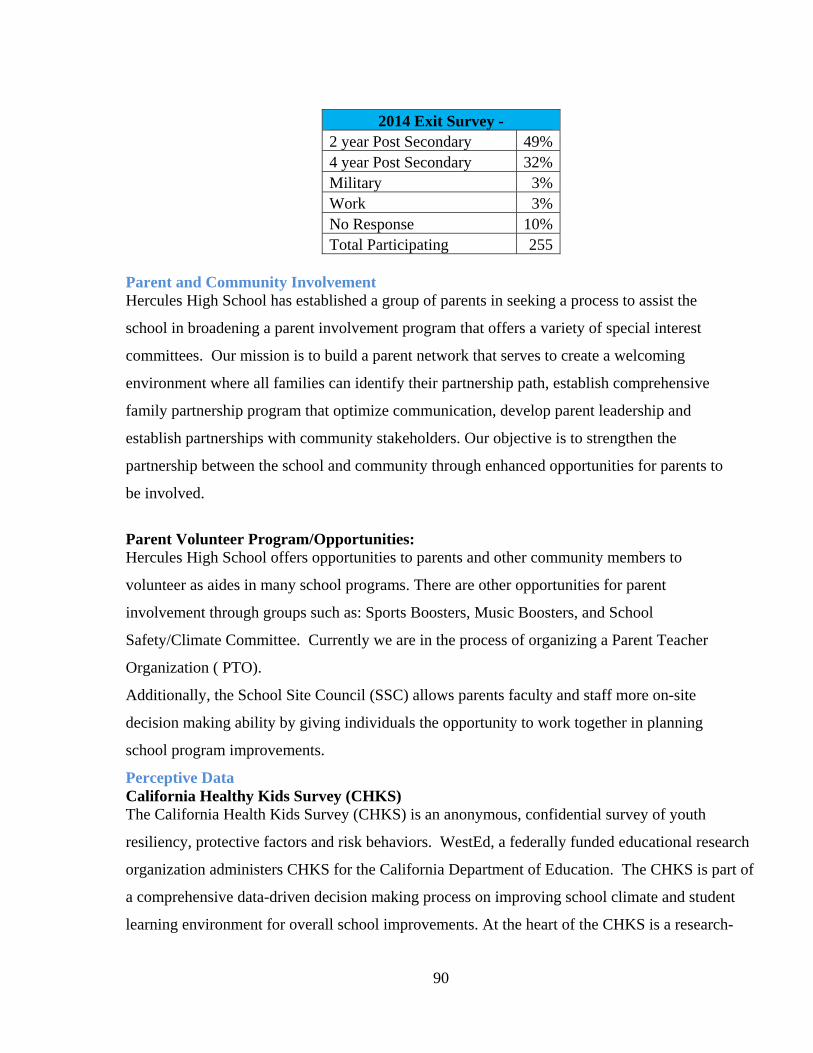
90
2014 Exit Survey - 2 year Post Secondary 49% 4 year Post Secondary 32% Military 3% Work 3% No Response 10% Total Participating 255
Parent and Community Involvement Hercules High School has established a group of parents in seeking a process to assist the
school in broadening a parent involvement program that offers a variety of special interest
committees. Our mission is to build a parent network that serves to create a welcoming
environment where all families can identify their partnership path, establish comprehensive
family partnership program that optimize communication, develop parent leadership and
establish partnerships with community stakeholders. Our objective is to strengthen the
partnership between the school and community through enhanced opportunities for parents to
be involved.
Parent Volunteer Program/Opportunities: Hercules High School offers opportunities to parents and other community members to
volunteer as aides in many school programs. There are other opportunities for parent
involvement through groups such as: Sports Boosters, Music Boosters, and School
Safety/Climate Committee. Currently we are in the process of organizing a Parent Teacher
Organization ( PTO).
Additionally, the School Site Council (SSC) allows parents faculty and staff more on-site
decision making ability by giving individuals the opportunity to work together in planning
school program improvements.
Perceptive Data California Healthy Kids Survey (CHKS) The California Health Kids Survey (CHKS) is an anonymous, confidential survey of youth
resiliency, protective factors and risk behaviors. WestEd, a federally funded educational research
organization administers CHKS for the California Department of Education. The CHKS is part of
a comprehensive data-driven decision making process on improving school climate and student
learning environment for overall school improvements. At the heart of the CHKS is a research-
91
based core module that provides valid indicators to promote student engagement and achievement,
safety, positive development, health and overall well-being. The CHKS is the nation’s largest
most comprehensive youth risk behavior and resilience data collection services. The survey is
intended to be a tool that enables schools and communities to collect and analyze data regarding
local youth health risks and behaviors, school connectedness, protective factors and school
violence. The survey is administered to 9th and 11th grade students. As defined by a WestEd
study, a positive school climate includes caring relationships between teachers and students,
physical and emotional safety, and academic and emotional supports that help students succeed.
The goal of a positive school climate is “a sense of belonging, competence and autonomy” for
both students and staff.
In 2010, the Department of Education, Office of Safe and Drug-Free Schools established a Safe
and Supportive Schools (S3) grant to support statewide measurement of conditions for learning
(known as school climate) as well as target programmatic interventions to improve those
conditions. The intent of the S3 grant is to address school safety, bullying, substance abuse,
positive relationships, student engagement, and other learning support. The CHKS results and
truancy data were used to calculate a school climate index (SCI). The SCI is a global measure of
conditions for learning based on CHKS responses and truancy incidence data. SCI scores range
from 100 to 500, with higher scores representing more positive school climate.
Over the last 4 years students have revealed that the level of support and engagement has
decreased which is measured by a 45 percent decrease (from 239 to 194) in SCI score since 2011.
SCI scores can range from 100 to 500, with higher scores representing positive change. The data
utilized to measure this domain was through the collection of student responses in the CHKS.
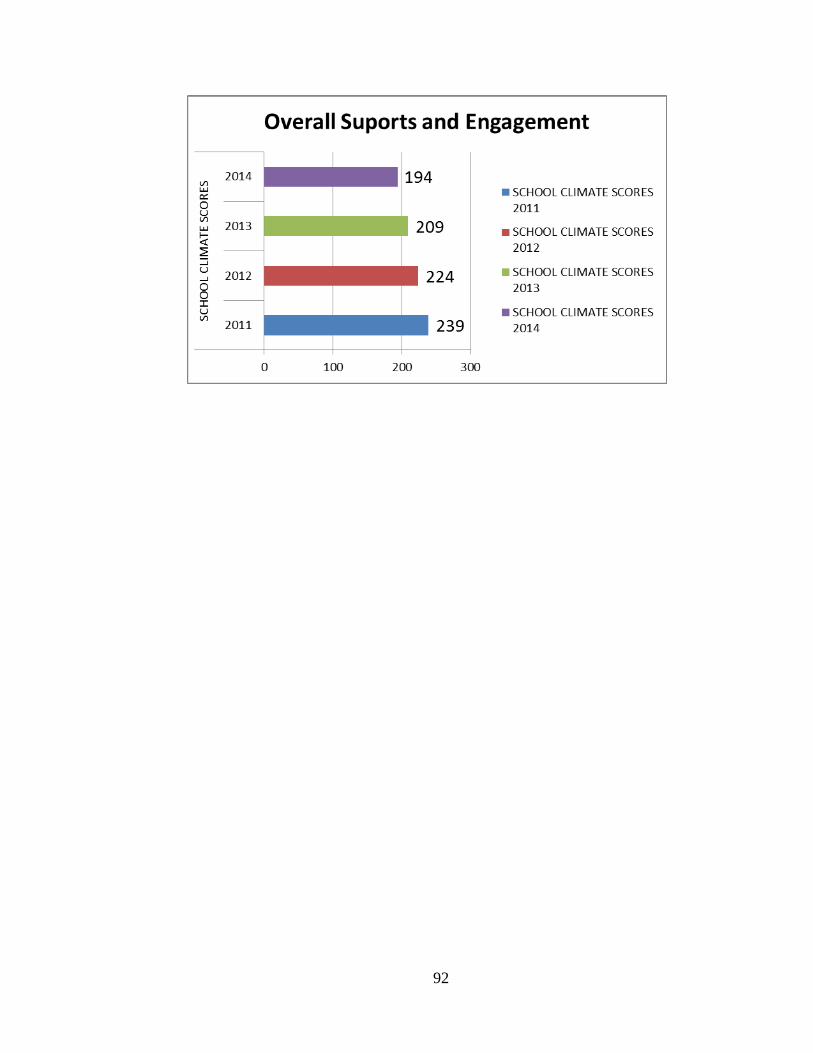
92