herbert jaeger khalid eid - compadre.org - … jaeger khalid eid quantized conductance and the...
TRANSCRIPT

PP
P
+
–Herbert Jaeger
Khalid Eid
Quantized Conductance and the Arduino Platform
for Advanced Labs
ALPhA Immersion Workshop June 24 – 26, 2013 Department of Physics
Miami University Oxford, Ohio
All Rights Reserved by the Authors Summer 2013
2 SUMMER 2013
Acknowledgements This ALPhA Laboratory Immersion goes back to Electronic Instrumentation Laboratory first produced by John W. Snider and Joseph Priest in 1988. At the time, Apple IIe computers were used along with an in-‐house built analog-‐to-‐digital converter. Computers with Intel 386 and 486 processors along with commercial data acquisition systems were introduced in 1991, and in 1999 Michael Pechan and Joseph Priest began using LabVIEW technology. During the following decade several experiments, including digital electronics were added. The use of the Arduino microcontroller was introduced by Herbert Jaeger in 2012. At about the same time Khalid Eid developed the quantized conductance experiment. In this Laboratory Immersion we are combining the subset of Electronic Instrumentation Laboratory that uses Arduino microcontrollers with the quantized conduction experiment in an attempt to use this very affordable technology to make demonstrate a quantum phenomenon and make it accessible to students as they first encounter quantum mechanics.
The Arduino Cheat Sheet (ACS) on on the inside back cover (p. 53) was created by Mark Liffiton and is based on the Arduino Language Reference1 and on Gavin Smith’s ACS version 2c. The ACS and the Arduino drawing by Fritzing.org are licensed under a Creative Commons Attribution-‐Share Alike 3.0 Unported License.2
1 http://arduino.cc/en/Reference/HomePage 2 http://creativecommons.org/licenses/by-‐sa/3.0/

SUMMER 2013 3
CONTENTS
INTRODUCTIONS: MEET ARDUINO ................................................................................................. 5
ARDUINO PROGRAMMING: DIGITAL AND ANALOG INPUT, SERIAL COMMMUNICATION VIA USB ................................................................................................................................................. 11
ARDUINO MAKES THINGS MOVE WITH A STEPPER MOTOR ............................................... 15
PULSE-‐WIDTH-‐MODULATION – ANALOG OUTPUT WITH DIGITAL MEANS ................... 19
ARDUINO CONTROLS THE TEMPERATURE ............................................................................... 27
ARDUINO SHIFTS BITS WITH A SHIFT REGISTER ................................................................... 33
DIGITAL POTENTIOMETER ............................................................................................................ 39
QUANTIZED CONDUCTANCE .......................................................................................................... 45

4 SUMMER 2013

SUMMER 2013 5
INTRODUCTIONS: MEET ARDUINO
Objectives 1. Introduce the Arduino microcontroller.
2. Get familiar with simple optical and acoustic signal outputs.
Arduino is a single board microcontroller based on the ATMEL ATmega328P chip. The chip contains the processor, 32kbytes of flash memory to store programs and variables, as well as a small amount of EEPROM and RAM memory. So in effect, it is a micro computer on a chip; this is what is commonly refered to as a microcontroller. The Arduino board contains additional circuitry that allows connection of the ATmega328-‐chip to a computer via USB interface. This enables programming and exchange of data of the Arduino with a computer. The Arduino is “open-‐source”, i.e. everything in and about the Arduino is in the public domain and accessible for all. A good source of all there is to know about Arduino and a great place to start is www.arduino.cc. You’ll find a step-‐by-‐step tutorial to Arduino at www.ladyada.net/learn/arduino/index.html.
Figure 1: The Arduino of the Boarduino variety. The ATMega328 chip contains the processor and flash memory for storing program code and data. The smaller FT232R chip handles the connection to the host computer via USB. The pins for the analog and digital I/O lines are spaced such that the Arduino can be plugged into a solderless breadboard.

6 SUMMER 2013
Programming the Arduino is done most conveniently via an integrated development environment (IDE). This is software that runs on your Windows, Macintosh, or Linux computer and lets you develop so-‐called sketches (this is what programs for the Arduino are called). The language used to program the Arduino is not unlike C or Python and is not very hard to learn. Once a sketch is written, the IDE compiles the sketch into machine code and uploads it to the microcontroller chip on the Arduino board.
The Arduino perceives its environment via sensors and transducers that can be connected to a number of analog and digital input and output ports. For example, a phototransistor can be used to measure light intensity, and a sketch that runs on the Arduino can then turn on a light should the light intensity fall below a defined value. The Arduino is also able to communicate with the host computer via USB and can send back numerical data that it computes as the sketch executes. The Arduino can also act as a stand-‐alone device without being connected to a host computer once the program is loaded. Should the Arduino lose power, it resets itself once power is restored and begins execution of the loaded sketch from the beginning. This is possible because the flash memory does not “forget” when power is disconnected.
Arduinos comes in different sizes and flavors. The particular model we are using in this workshop is known as the Boarduino (Figure 1). It has all the features of the regular Arduino but has a formfactor that allows it to be used with a breadboard of the type we are using in this lab. For simplicity we will continue to refer to the Boarduino as Arduino. Let’s tinker a bit. Start the IDE (click on the Arduino icon on your desktop), and you will see an empty sketch window (Fig. 2). There are a few buttons on the top of the window, and a message area along the bottom. The second button from the left is the “upload” button; it lets you send your sketch to the memory on the ATMega328-‐chip. Other buttons are for starting a new sketch, or loading and saving sketches. The first button on the left is the “check code” or “compile” button. It will compile a sketch and tell
Figure 2: An empty sketch window opens when you first start the Arduino IDE. The buttons on the top are for managing and uploading your sketch to the Arduino.

SUMMER 2013 7
you if there are any errors in the message area at the bottom of the window.
One valuable feature with the Arduino IDE is that it comes pre-‐loaded with a number of examples that will help you learn how to program the microcontroller. Click on File/Examples/1.Basics and select BareMinimum from the list. This shows the structure of an Arduino sketch (Fig. 3). There are two parts: (i) the setup() function and (ii) the loop() function. The setup() function is executed once and will contain all the definitions and initializations that need to happen so the sketch can run. Once the code of the setup() function has been executed, the processor begins to run the code of the loop() function. As the name implies, this code is repeated over and over, until the Arduino is turned off.
Let’s look at a code that actually does something noticeable. Click on File/Examples/ 1.Basics and select Blink from the list. This is one of most basic Arduino codes you will find. It makes an LED blink once a second. The code appearing in the IDE window should look something like this:
Figure 3: The bare minimum sketch does not do anything, but it shows the sturcute of an Arduino sketch.
8 SUMMER 2013
/* Blink Turns on an LED on for one second, then off for one second, repeatedly. This example code is in the public domain. */ void setup() { // initialize the digital pin as an output. // Pin 13 has an LED connected on most Arduino boards: pinMode(13, OUTPUT); } void loop() { digitalWrite(13, HIGH); // set the LED on delay(1000); // wait for a second digitalWrite(13, LOW); // set the LED off delay(1000); // wait for a second }
Anything in between /* and */ is ignored by the compiler; also, anything following // until the end of the line is ignored as well. So we can use these to annotate the sketch to help us understand what the code does. The setup() function has one line of code: pinMode(13, OUTPUT); here we define pin 13 as an digital output pin. It is digital, because the voltage on this pin will be either 5V or 0. 5V is called HIGH and 0 is called LOW. This is the only setup coded required, so now we go on to the loop() function. The first line, digitalWrite(13, HIGH); sets the voltage of pin 13 to +5V. Note that at the end of the command there is always a “;”, that is how we signal the IDE the end of the command. The next command is delay(1000); and tells Arduino to do nothing for 1000 ms. The next two commands is setting pin 13 to 0 and waits for 1 s. Since we are at the end of the loop() function, the sketch continues to excecute at the beginning. The effect is that as long as the Arduino is powered, it keeps blinking the LED connected to pin 13. Notice that we did not have to worry actually to connect an LED to pin 13 as there is an LED on the Arduino board which is already connected to pin 13. If you wanted to connect a second LED to, say, pin 10, then you would have to actually do this as there is no such element on the board.
Once you got your Arduino blinking, spend some time playing with this code. Try to make it blink faster or slower. Maybe just a short blink and a long pause, or vice versa. How about connecting a second LED to a different pin and then have both LEDs blink in some way. Come up with your own variation, be creative!
If you are not satisfied by just “ordinary” blinking, let’s get a bit fancier. From the basic examples, select the Fade sketch and examine it. Predict what will happen when the sketch runs, then run it. This is an example of a digital pin used as an analog output pin. Not all of the 14 digital outputs can be used this way, only pins 3, 5, 6, 9, 10, and 11. The analog output is achieved by switching the pin rapidly between 0 and 5V while varying the on-‐off time ration, a.k.a. the duty cycle. This results in an rms-‐value between 0 and 5V, effectively turning the digital output pin in a analog output.

SUMMER 2013 9
Blinking a light is one way Arduino can get your attention. Even though it is a simple action, it can be used to convey quite a bit of information. Think about Morse code. Another way to convey information is via sound. The Arduino commands tone() and noTone() can be used to produce a square-‐wave voltage with a defined frequency at a specified output pin. If a small speaker or a piezo crystal is connected to the pin, you can hear a tone. The command syntax
tone(pin, freq)
sounds a tone of frequency freq until the command noTone()is encountered. Alternatively, the command
tone(pin, freq, dur)
sounds a tone of frequency freq for duration of dur milliseconds. Connect the provided piezo buzzer to pin 5, designate this pin as an OUTPUT and write an Arduino sketch that plays the “Big Ben” chime.
Your report should include: 1. A description of at least three variations of the Blink-‐sketch. Include listings of your sketches.
2. Briefly summarize the Fade sketch, explaining how the “fading”-‐effect is achieved.
3. Your annotated sketch that produces the Big Ben chime. Describe how you went about coming up witht the notes and name your sources.

10 SUMMER 2013
SUMMER 2013 11
ARDUINO PROGRAMMING: DIGITAL AND ANALOG INPUT, SERIAL COMMMUNICATION VIA USB
Objectives 1. Get familiar with digital and analog input programming.
2. Learn the use of serial communication via USB.
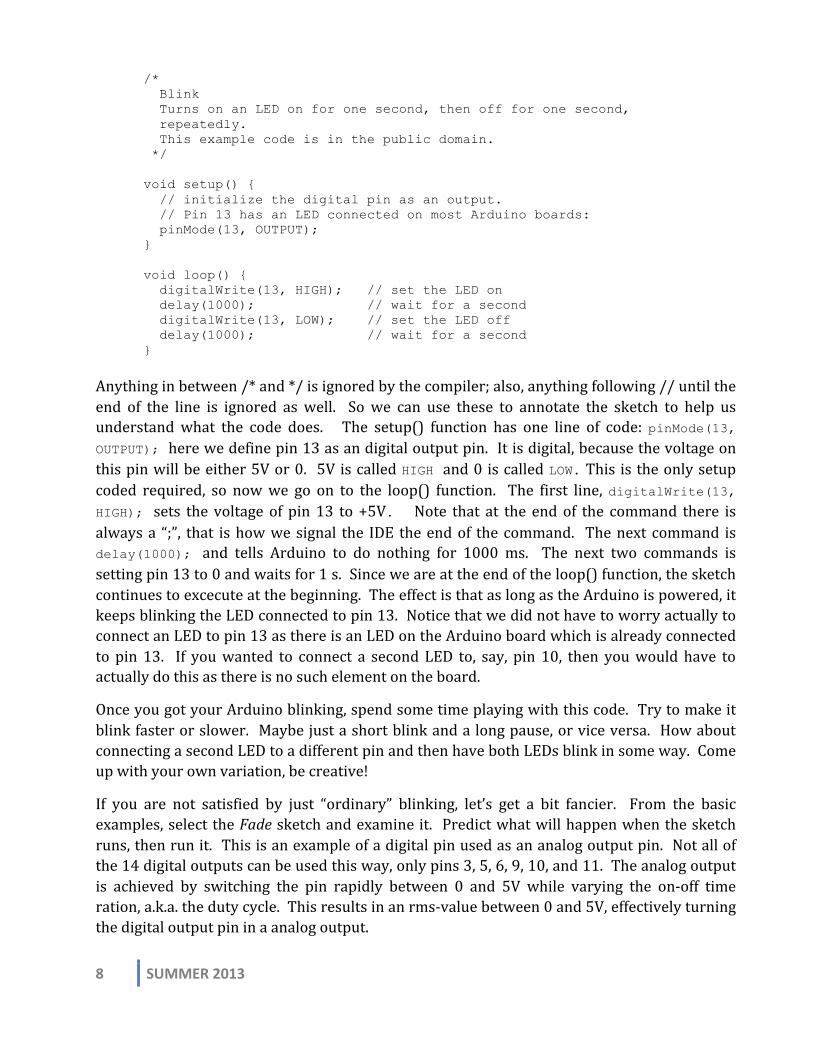
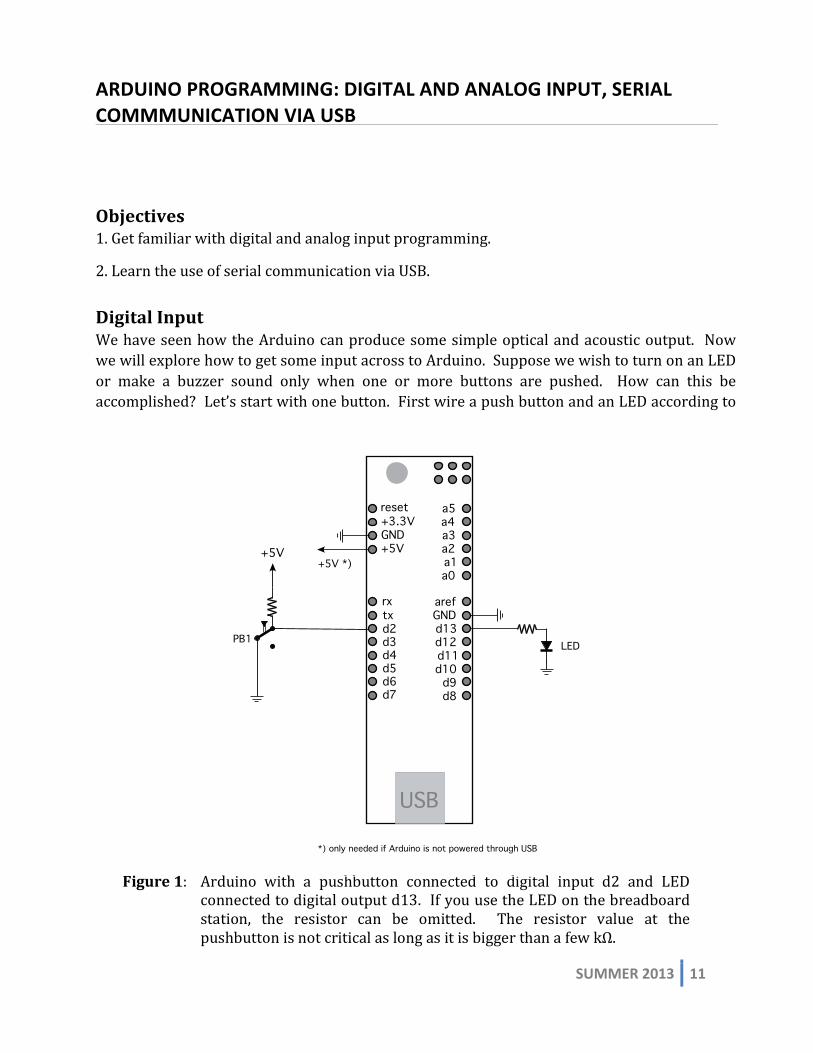
Digital Input We have seen how the Arduino can produce some simple optical and acoustic output. Now we will explore how to get some input across to Arduino. Suppose we wish to turn on an LED or make a buzzer sound only when one or more buttons are pushed. How can this be accomplished? Let’s start with one button. First wire a push button and an LED according to
Figure 1: Arduino with a pushbutton connected to digital input d2 and LED connected to digital output d13. If you use the LED on the breadboard station, the resistor can be omitted. The resistor value at the pushbutton is not critical as long as it is bigger than a few kΩ.
USB
rxtxd2d3d4d5d6d7 d8
d9d10d11d12d13
arefGND
reset+3.3VGND+5V
a0a1a2a3a4a5
+5V+5V *)
*) only needed if Arduino is not powered through USB
PB1 LED
12 SUMMER 2013
the diagram in Figure 1, then open the example sketch Button. This sketch polls the input pin 2 and turns the LED connected to pin 13 on when button connected to pin 2 is pushed. For this to work the pin to which the button is connected must be declared as INPUT. The button connects a grounded resistor to +5V (Figure 1). When the button is not pushed, pin 2 is at ground potential, and the call to function digitalRead(buttonPin) returns LOW. While the button is pushed, current flows, and the potential at the pin is at +5V, and function digitalRead(buttonPin) returns HIGH. The sketch uses the if(){} else{} structure to decide between the two states of the push button.
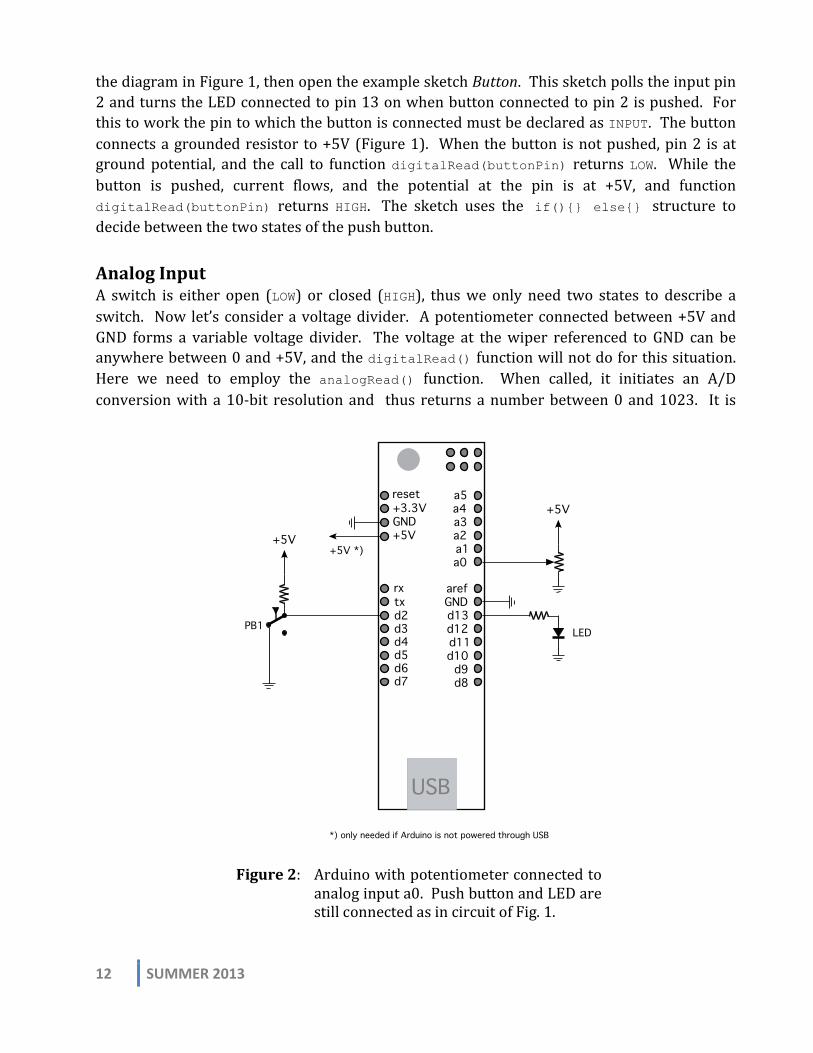
Analog Input A switch is either open (LOW) or closed (HIGH), thus we only need two states to describe a switch. Now let’s consider a voltage divider. A potentiometer connected between +5V and GND forms a variable voltage divider. The voltage at the wiper referenced to GND can be anywhere between 0 and +5V, and the digitalRead() function will not do for this situation. Here we need to employ the analogRead() function. When called, it initiates an A/D conversion with a 10-‐bit resolution and thus returns a number between 0 and 1023. It is
Figure 2: Arduino with potentiometer connected to analog input a0. Push button and LED are still connected as in circuit of Fig. 1.
USB
rxtxd2d3d4d5d6d7 d8
d9d10d11d12d13
arefGND
reset+3.3VGND+5V
a0a1a2a3a4a5
+5V+5V *)
*) only needed if Arduino is not powered through USB
PB1 LED
+5V

SUMMER 2013 13
straight forward to convert this number to the actual voltage measured:
The example sketch AnalogInput illustrates the use of the analogRead() function. Wire a 10-‐KΩ potentiometer and an LED to the Arduino as shown in Figure 2, then upload the AnalogInput sketch to the Arduino and run it. The sketch reads the voltage on the pot and then uses the result to vary the blinking rate of the LED.
Serial Communication So far we have seen simple input and output schemes involving LEDs and push buttons. What about communicating numerical results? With what we know so far, we could turn the 3 or 4 digits of the A/D result into Morse code, then blik the LED in longs and shorts to communicate the number to humans watching. Needless to say that this would be somewhat tedious and prone to errors. There is a better way, and it takes advantage of the serial communication function built in to the Arduino’s software. Serial communication breaks down data to the byte and bit level (1 byte = 8 bits; 1 bit is a binary digit), then transmits the data one bit at a time at a given rate to a computer connected to the Arduino via USB and/or digital pins 0 and 1. The Serial Monitor button on the IDE’s toolbar opens a window that displays characters sent back from Arduino. Load the example sketch AnalogReadSerial and examine it. Serial communication must be initiated in the setup() part of the sketch. The Serial.begin(9600) command starts the serial communications software and sets it up to communicate at a rate of 9600 baud (1 baud = 1 bit/s). This rate must also be entered in the Serial Monitor window of the IDE. Each time the Serial.println() command is evoked, Arduino sends the number in the argument of the function via USB to the host computer. This particular example program reads the voltage at analog pin 0 and “prints” it back to the Serial Monitor window of the IDE. An excellent tutorial on Arduino’s serial communications capabilities can be found at http://www.smacula.co.uk/2011/07/arduino-‐serial-‐communication.html.
Procedure Note: For general language and command help go to the Arduino site (www.arduino.cc) and click on the Reference link on the top of the page to see a list of available commands. You can click on any command to learn more about its syntax and use. Another good resource on the Arduino language are the included examples (File/Examples/1.Basics and others).
Develop a sketch that controls a traffic light with a pedestrian button. As long as the button is not pushed, the light will remain green (for cars) for 40 s then switch to yellow and red for 20 s (that’s when the peds can walk), then back to green and repeating the cycle. Once the button is pushed, the cycle is interrupted; after a wait-‐time of 15 s the light turns yellow and red and remains so for 30 s, during which the pedestrians call cross the street. Then the light goes back to green, following the regular cycle again.
Voltage =A/D Result
10245V

14 SUMMER 2013
Let’s say we wish to report back the status of the button in your traffic light sketch. First we have to define the rate at which we wish the Arduino to communicate. This is done by including the command Serial.begin(9600); into the setup() function. This defines the serial communication speed as 9600 baud. In the loop() function you need to include a serial print command whenever during the execution of a sketch you wish to send information back to a computer connected to the Arduina via USB. For example, in the Button sketch you would add the command Serial.println(sensorValue); after the digitalWrite(ledPin, HIGH); or digitalWrite(ledPin, LOW); command. Here sensorValue is a variable represents the state of the button. Go ahead and modify your sketch so that it begins to count down the 15 s after the button is pushed and sends the count down value via serial communication to the computer once per second. In order to tell the computer to display the serial monitor you click the Serial Monitor button on the toolbar of the IDE after you upload the sketch to the Arduino.
Once everything works as prescribed, let’s add a day & night version. The idea here is that at night there are not a great deal of pedestrians, so we can have the light sitting at green all the time until a pedestrian pushes the button. Then the same will happen as during the day. We will use the potentiometer still connected to a0 as the input device and pretend it is a photosensor. If the voltage at a0 is less than 2.5 V, we will call it night, otherwise it is daytime. So your sketch will need to read a0 with the analogRead() function; if the result is between 512 and 1023, the sketch will follow the program that you already have, and if the result is less than 512, the sketch will execute the nighttime program.
Your report should include: 1. A brief description of the Button-‐sketch from the basic examples.
2. A hard copy of your traffic light sketch with ample comments that allows anyone to follow your approach.
SUMMER 2013 15
ARDUINO MAKES THINGS MOVE WITH A STEPPER MOTOR
Objectives 1. To gain experience with digital circuit elements.
2. To utilize the stepper motor as an application of the digital control of experimental apparatus.
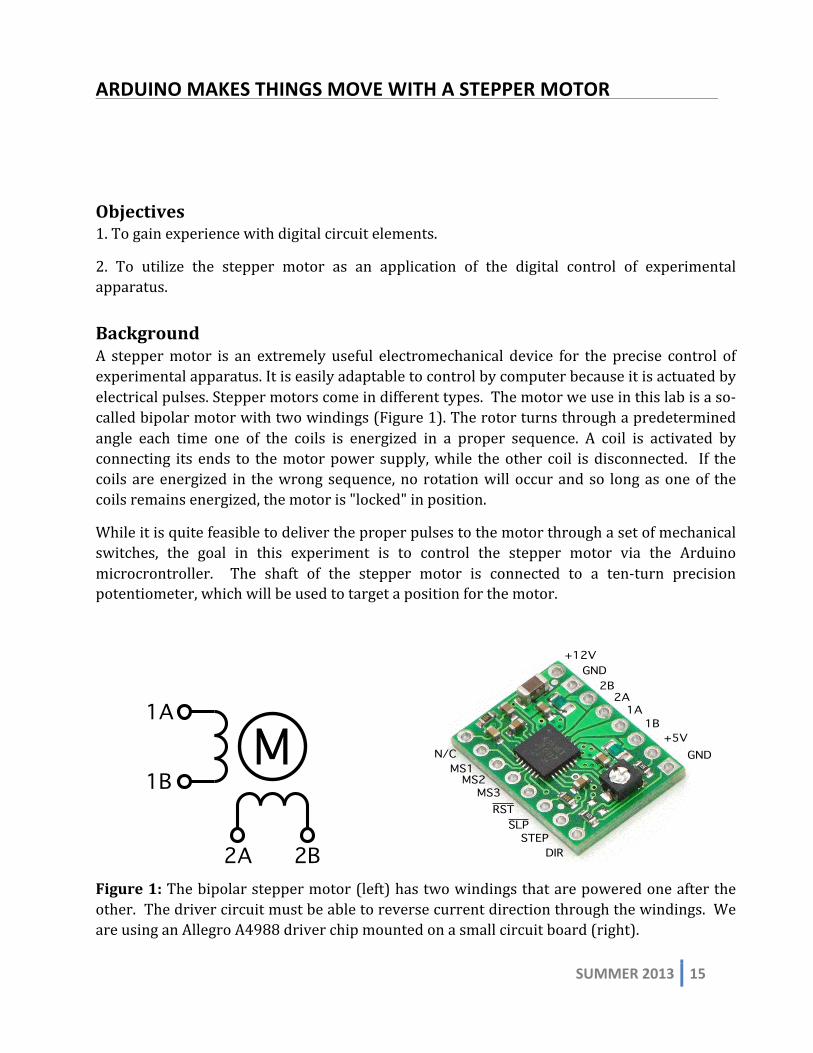
Background A stepper motor is an extremely useful electromechanical device for the precise control of experimental apparatus. It is easily adaptable to control by computer because it is actuated by electrical pulses. Stepper motors come in different types. The motor we use in this lab is a so-‐called bipolar motor with two windings (Figure 1). The rotor turns through a predetermined angle each time one of the coils is energized in a proper sequence. A coil is activated by connecting its ends to the motor power supply, while the other coil is disconnected. If the coils are energized in the wrong sequence, no rotation will occur and so long as one of the coils remains energized, the motor is "locked" in position.
While it is quite feasible to deliver the proper pulses to the motor through a set of mechanical switches, the goal in this experiment is to control the stepper motor via the Arduino microcrontroller. The shaft of the stepper motor is connected to a ten-‐turn precision potentiometer, which will be used to target a position for the motor.
Figure 1: The bipolar stepper motor (left) has two windings that are powered one after the other. The driver circuit must be able to reverse current direction through the windings. We are using an Allegro A4988 driver chip mounted on a small circuit board (right).
M1A
2A
1B
2B
2B2A
1A1B
STEPDIR
N/CMS1
MS2MS3
RSTSLP
GND
GND
+5V
+12V

16 SUMMER 2013
Figure 2: Wiring digram of the stepper motor controller board.
Rather than driving the motor directly, we will be using a controller chip, the Allegro A4988, that will initiate the proper pulse sequence to the coil leads 1A, 1B and 2A, 2B. In order to make the motor move we need to supply a rectangular pulse waveform to the STEP pin (Figure 1) and select the direction of motion by setting the DIR pin high (+5V) or low (GND). These signals will come from digitral output pins of the Arduino. Please note that there are two power pins on the controller board. The +5V and GND is to supply the logic circuits and does not require a great deal of power. The same power source that is used for the Arduino may also be used to power the controller board. The stepper motor generally uses more power, and therefore it is driven by a separate power supply. Even though this pin is labeled “+12V”, the controller can handle motor power from 8-‐35V and up to 2A current per coil.
Figure 3: Coupling the motor to the potentiometer.
2B
M1A
2A
1B
2B
2A1A1B
STEPDIR
N/CMS1MS2MS3RSTSLP
GND
GND
+5V
+12V Motor!Power
Logic!Power
Arduino
+5V
10k D13
D2A0
SUMMER 2013 17
We will us Arduino’s digital I/O pin 2 to control the direction of rotation, and digital I/O pin 13 to provide the voltage pulses to rotate the stepper motor. Figure 2 shows a schematic diagram of the connections of the controller board to motor and Arduino. Note that the reset (RST) and sleep (SLP) pins are connected. The 5V logic power can come from the same source that powers the Arduino, but the motor must be powered from the heavy-‐duty 12V power supply next to your breadboard station.
Procedure Construct the circuit as shown in Figure 2. The pot shown is the one coupled to the shaft of the stepper motor (Figure 3). Note that the four motor wires colored blue, red, green, and black are connected to pins 2B, 2A, 1A, and 1B on the controller board. If you plug in the header pins so that the wires are directed away from the circuit board you have the correct order.
Open the Arduino IDE and type in the following code:
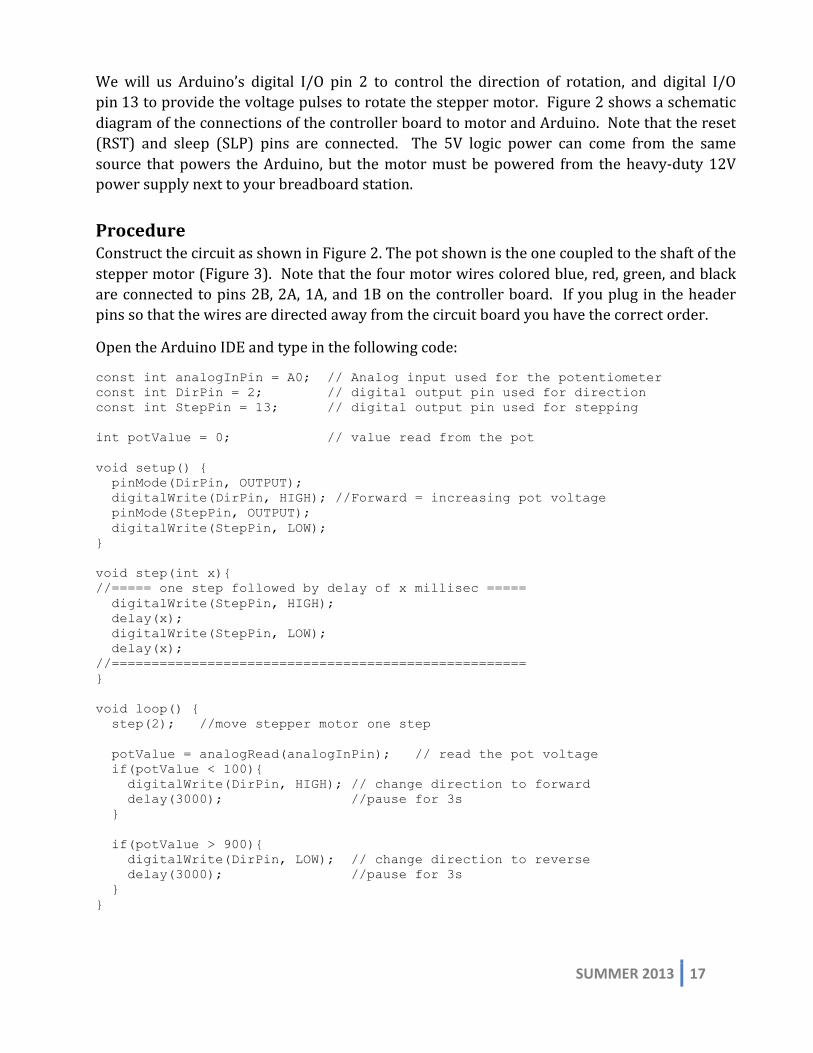
const int analogInPin = A0; // Analog input used for the potentiometer const int DirPin = 2; // digital output pin used for direction const int StepPin = 13; // digital output pin used for stepping int potValue = 0; // value read from the pot void setup() { pinMode(DirPin, OUTPUT); digitalWrite(DirPin, HIGH); //Forward = increasing pot voltage pinMode(StepPin, OUTPUT); digitalWrite(StepPin, LOW); } void step(int x){ //===== one step followed by delay of x millisec ===== digitalWrite(StepPin, HIGH); delay(x); digitalWrite(StepPin, LOW); delay(x); //==================================================== } void loop() { step(2); //move stepper motor one step potValue = analogRead(analogInPin); // read the pot voltage if(potValue < 100){ digitalWrite(DirPin, HIGH); // change direction to forward delay(3000); //pause for 3s } if(potValue > 900){ digitalWrite(DirPin, LOW); // change direction to reverse delay(3000); //pause for 3s } }
18 SUMMER 2013
The stepping pulse is generated in the function step(x); it produces one pulse sequence with a pulse period of 2x ms by setting pin 13 high for x ms followed by low for x ms. If you wish to slow down the motor just increase x in the argument of step(x). The code inside loop() simply makes a step, then checks the voltage of the pot wiper. If the digitized voltage is within the defined bounds (100…900) the motor continues. If the digitized voltage moves outside the bounds the direction is reversed and the motor continues after a 3-‐s break. Play around with the code a bit. Change the bounds and make the motor move at a slower rate. Modify the code so that the motor pot always oscillates between 3V and 4V.
Make a sketch that moves the stepper motor in one direction only while a pushbutton is pressed. Then use this sketch to determine how many steps the motor requires to turn a full revolution. You can employ the Serial.print() command to print out the number of steps performed while the button is pushed. Perform several tries and average your results and estimate the uncertainty in your result.
If time permits: Make a sketch that reads one of the pots on the breadboard station (connected to +5V and GND) and then moves the stepper motor accordingly until the pot coupled to the stepper motor shows the same voltage as the pot on the board.
Your report should include: 1. Annotated hard copy of the stepper motor sketch with the 3V (4V) lower (upper) bounds.
2. Annotated hard copy of your sketch that you used to determine the number of steps per revolution.
3. Report your result of the number of steps per revolution; include the uncertainty in your result.
4. Annotated hard copy of the voltage-‐following sketch (if time permits).
5. Suggest two possible uses for the stepper motor set up in this experiment.

SUMMER 2013 19
PULSE-‐WIDTH-‐MODULATION – ANALOG OUTPUT WITH DIGITAL MEANS
Objectives 1. Introduce pulse width modulation as a way to generate analog output with digital means
2. Use PWM to control the speed of a motor
About Pulse Width Modulation Pulse width modulation (PWM) has a number of uses; here we will focus on PWM as a way to vary the power delivered to a load. Suppose we have a load, e.g. a light bulb, and we wish to control its intensity by controlling the power applied to the light bulb. An obvious way to accomplish this is by using a voltage divider, such as the one shown in Figure 1a. The power delivered to the load RL is
Varying the value of R allows to regulate the power dissipated at the load RL. With a low value of R both VL and IL are large and most of the power supplied by the battery ends up at the load, and only a small fraction of power is dissipated by R. As R is increased, the current IL
PL = ILVL =V
R + RL
RL
R + RL
V =RLV
2
R + RL( )2
Figure 1: Controlling the power at a load with a voltage divider (a). In circuit (b) the variable resistor is replaced with a switch. This is the equivlant circuit used for PWM to control power to a load.

20 SUMMER 2013
decreases and so does VL, thus the power available at the load RL decreases, and the light bulb’s intensity decreases. The disadvantage of this circuit is that R must dissipate whatever power does not go to RL, which can be a substantial fraction of the total power supplied by the battery. The voltage divider always dissipates power, even then, and especially then, when the load requires very little of it. Another disadvantage is that power is controlled by reducing the voltage at the load, which can result in unsatisfactory performance for some loads (e.g., a motor).
Now let’s modify the voltage divider as shown in Figure 1b. We replace the variable resistor R with a switch. Think of the switch as a variable resistor with two possible values. When the switch is open, R → ∞, and with the switch closed, R → 0. In the open position no power is dissipated since there is no current flow. When the switch is closed, no power is disspated at the switch as it has nearly zero resistance, and all the power arrives at the load. Thus only the load is powered, and whenever the load is not powered, the circuit uses no power at all. In practice the switching is done with a transistor or other semiconductor component instead of a mechanical switch. The advantage is that no moving parts are required and switching frequencies can be much higher than would be possible with a mechanical switch.
The variation of the power at RL is accomplished not by decreaseing the voltage, but by varying the time the power is on vs. off. Consider the pulse train of Figure 2. The waveform is high (or +5V) for the first half of a period and low (or zero) for the second half. One says the pulse train has a duty cycle of 50%, where the duty cycle is defined as the ratio of the time the pulse is high to the period of the waveform. The instantaneous power at the load is
but averaged over time the power delivered to the load is
PL t( ) = ILVL =V 2 t( )RL
PL t( ) =1T
V 2 t( )0
T
∫ dt
RL
=dcV
2
RL
Figure 2: A pulse waveform with a duty cycle of 50%. The duty cycle is defined as the ratio of the time the pulse is high to the pulse period.
SUMMER 2013 21
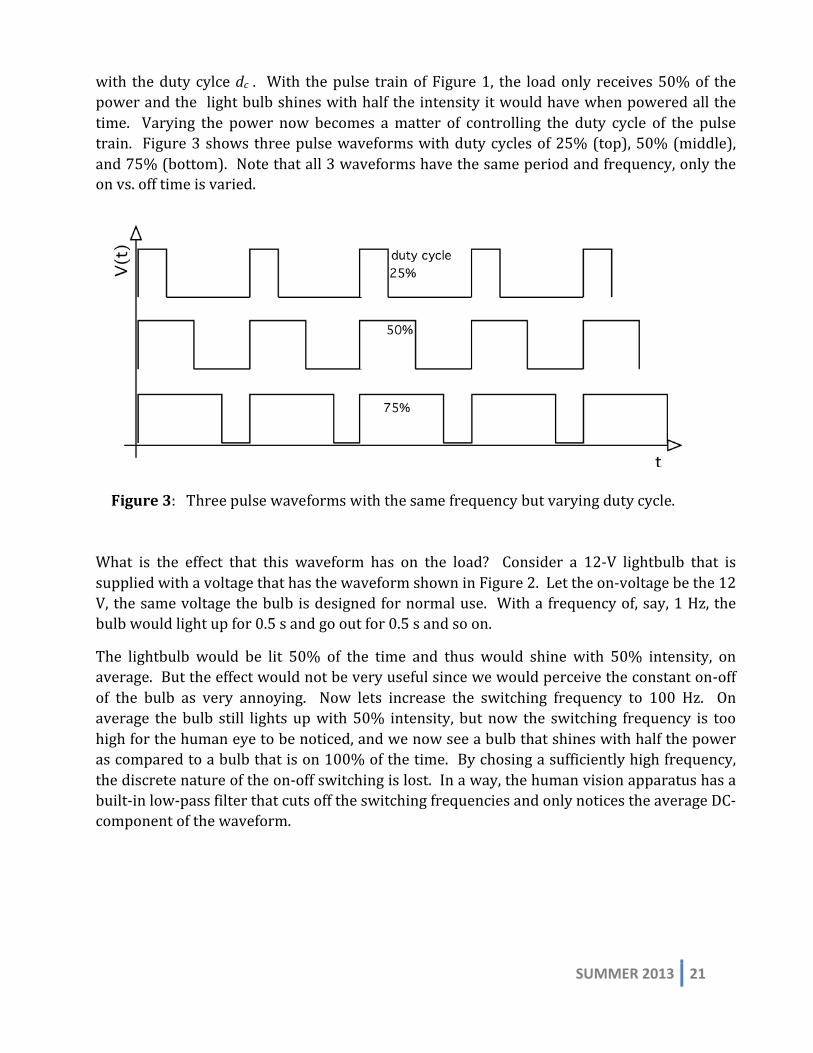
with the duty cylce dc . With the pulse train of Figure 1, the load only receives 50% of the power and the light bulb shines with half the intensity it would have when powered all the time. Varying the power now becomes a matter of controlling the duty cycle of the pulse train. Figure 3 shows three pulse waveforms with duty cycles of 25% (top), 50% (middle), and 75% (bottom). Note that all 3 waveforms have the same period and frequency, only the on vs. off time is varied.
What is the effect that this waveform has on the load? Consider a 12-‐V lightbulb that is supplied with a voltage that has the waveform shown in Figure 2. Let the on-‐voltage be the 12 V, the same voltage the bulb is designed for normal use. With a frequency of, say, 1 Hz, the bulb would light up for 0.5 s and go out for 0.5 s and so on.
The lightbulb would be lit 50% of the time and thus would shine with 50% intensity, on average. But the effect would not be very useful since we would perceive the constant on-‐off of the bulb as very annoying. Now lets increase the switching frequency to 100 Hz. On average the bulb still lights up with 50% intensity, but now the switching frequency is too high for the human eye to be noticed, and we now see a bulb that shines with half the power as compared to a bulb that is on 100% of the time. By chosing a sufficiently high frequency, the discrete nature of the on-‐off switching is lost. In a way, the human vision apparatus has a built-‐in low-‐pass filter that cuts off the switching frequencies and only notices the average DC-‐component of the waveform.
Figure 3: Three pulse waveforms with the same frequency but varying duty cycle.
22 SUMMER 2013
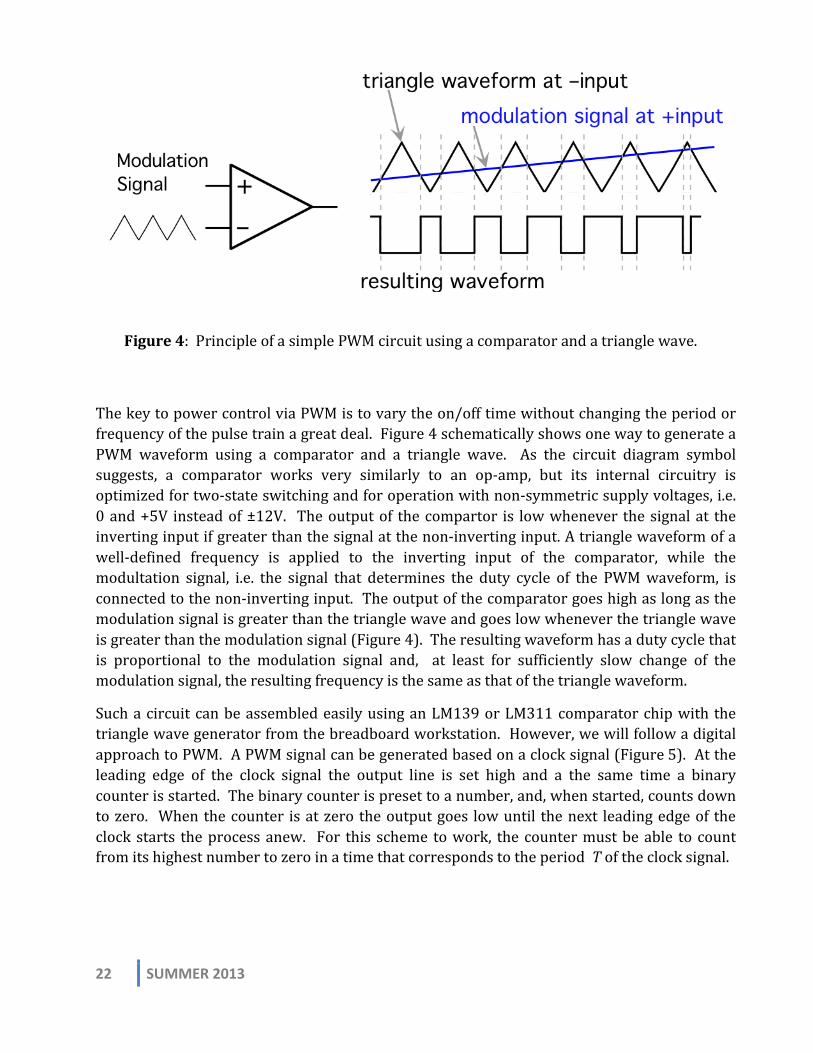
The key to power control via PWM is to vary the on/off time without changing the period or frequency of the pulse train a great deal. Figure 4 schematically shows one way to generate a PWM waveform using a comparator and a triangle wave. As the circuit diagram symbol suggests, a comparator works very similarly to an op-‐amp, but its internal circuitry is optimized for two-‐state switching and for operation with non-‐symmetric supply voltages, i.e. 0 and +5V instead of ±12V. The output of the compartor is low whenever the signal at the inverting input if greater than the signal at the non-‐inverting input. A triangle waveform of a well-‐defined frequency is applied to the inverting input of the comparator, while the modultation signal, i.e. the signal that determines the duty cycle of the PWM waveform, is connected to the non-‐inverting input. The output of the comparator goes high as long as the modulation signal is greater than the triangle wave and goes low whenever the triangle wave is greater than the modulation signal (Figure 4). The resulting waveform has a duty cycle that is proportional to the modulation signal and, at least for sufficiently slow change of the modulation signal, the resulting frequency is the same as that of the triangle waveform.
Such a circuit can be assembled easily using an LM139 or LM311 comparator chip with the triangle wave generator from the breadboard workstation. However, we will follow a digital approach to PWM. A PWM signal can be generated based on a clock signal (Figure 5). At the leading edge of the clock signal the output line is set high and a the same time a binary counter is started. The binary counter is preset to a number, and, when started, counts down to zero. When the counter is at zero the output goes low until the next leading edge of the clock starts the process anew. For this scheme to work, the counter must be able to count from its highest number to zero in a time that corresponds to the period T of the clock signal.
Figure 4: Principle of a simple PWM circuit using a comparator and a triangle wave.

SUMMER 2013 23
Let’s assume the clock runs at a frequency of 1 kHz, and the counter is an 8-‐bit binary counter, so that its highest number is 255. In order to count down to zero during a clock period of T = 1 ms the counter must count every 1 ms/256 = 3.91 μs. To generate a PWM signal with a duty cycle of 70%, the counter must be preset to 179, because it will take 3.91 μs × 179 = 700 μs, and dc = 700/1000 =70%.
Procedure The digital approach to PWM is easy to implement in a microcontroller such as the Aduino, because there are usually a number of counters that are used internally for all kinds of timing routines, e.g., to determine times for the functions delay() and delayMicroseconds(). The latter function waits for a specified amount of microseconds and be used to generate a PWM signal with specified duty cycle. Enter the following sketch into the IDE
void setup() { pinMode(13, OUTPUT); //set pin 13 (i.e. built-in LED) as output. int dc = 70; //duty cycle = 70% int hi_time = dc * 10; // time in micro sec to set pulse high // based on a clock frequency of 1 kHz } void loop() { digitalWrite(13, HIGH); delayMicroseconds(hi_time); digitalWrite(13, LOW); delayMicroseconds(1000 – hi_time); }
upload it to the Arduino, and run it. Observe the built-‐in LED, then examine the output pin with an oscilloscope. Change the duty cycle in the sketch and observe how the pulse train changes as a result.
Figure 5: A digitally generated PWM signal using a clock pulse and a binary counter.

24 SUMMER 2013
Verify that the PWM signal’s frequency is 1 kHz, then modify the frequency in the sketch above. By trial-‐and-‐error find the frequency for which your eye is no longer cheated, and you begin to see the on/off switching of the LED.
The sketch you just examined is a somewhat “pedestrian” approach to PWM, however it serves to illustrate the concept. For normal use it is much easier to accomplish what the sketch above does. Arduino is engineered so that the digtal lines 3, 5, 6, 9, 10, 11 have built-‐in PWM capabilities. All it takes is a call of the analogWrite()function. To see how it works examine the basic example sketch Fade. Before you upload it to the Arduino, connect an LED to the digital output d9 as shown in Figure 6. Then upload the sketch and watch the LED fading in and out gradually. Examine the sketch; the command analogWrite(9,brightness) makes the LED light up. Note that it is not just HIGH or LOW in the analogWrite() function. brightness is an integer variable and can have values between 0 and 255.3 Slow down the sketch so you can see better what is going on. Change the delay(30) statement to delay(2000). This will pause the sketch for 2 s (instead of 30 ms) each time the loop executes. Connect the multimeter to pin d9 and GND and measure the output voltage of the
3 Since the value must be between 0 and 255, we could define this variable to be of type byte. The byte data type requires less storage space than the integer data type.
Figure 6: Arduino with LED connected to digital output d9. The 1-‐kΩ resistor limits the current through the LED to a safe value.

SUMMER 2013 25
digital line d9 as the sketch continue to run. As the LED gets brighter, the voltage increases, and vice versa. Connect an oscilloscope to the digital line d9 to examine the waveform.
You should see a rectangular waveform switching between 0 and 5 V. As the sketch repeats through the loop() function, the high-‐time increases or decreases at the expense of the low-‐time, while the period of the waveform remains nearly constant. Determine the frequency of the PWM signal and compare it with your finding above. You are stuck with the frequency the Arduinio designer selected. If you wish to use a different frequency, you must write your own code, e.g. such as the sketch you examined two pages earlier, or a somewhat more eleaborate approach as is described at http://www.arduino.cc/ playground/Main/PWMallPins; the advantage of this code is that it can be used with any of the digital pins.
Here is a programming challenge for you if time permits. Write a sketch that turns an LED on to full intensity when a push button is pressed. When the button is pressed again, the LED continues to be lit, but now with only 2/3 of the full intensity. Another button press, and the intensity is reduced to 1/3 of the full intensity. One more button press, and the LED is turned off.
Your report should include: 1. A brief description of the fade-‐sketch from the basic examples.
2. A drawing of the PWM waveform for a duty cycle of 20% and 80% as it is produced with of the analogWrite()function.
2. A hard copy of your 3-‐intensity LED sketch with ample comments that allows anyone to follow your approach.

26 SUMMER 2013
SUMMER 2013 27
ARDUINO CONTROLS THE TEMPERATURE
Objectives 1. To construct an electronic thermometer using a thermistor as the sensor and the Arduino as the microcontroller.
2. To use the thermistor thermometer as the feedback element in a temperature controller.
Background The resistance of a metal wire changes with temperature. Knowing how the resistance changes with temperature, the wire can be used to measure temperature by relating temperature to resistance. Platinum wire is particularly useful as a temperature-‐sensitive element in a thermometer because it is very stable and has a high melting point of around 1770˚C. However, thermometers made from metals have the disadvantage of being rather insensitive. For example, the resistance of a platinum wire changes by about 30% for a 100˚C temperature change.
The resistance of a semiconductor such as the silicon used in a solid state diode or a transistor changes appreciably, even with small temperature changes. For this reason, semiconductors make sensitive temperature sensors. A device employing a semiconducting material as a temperature sensor is called a thermistor. The resistance of a commercial thermistor may change by a factor of 100 if its temperature changes by 100˚C.
From theoretical considerations and experience it is known that the resistance Rthermistor of a thermistor is related to the absoulte temperature, T, by
(1)
where A and B are constants characteristic of a given thermistor. The circuit shown in Figure 1 is used to relate the thermistor resistance to a voltage for the Arduino microcontroller. The voltage at the output of the first op-‐amp is related to the potentiometer voltage by
(2)
Rthermistor = A eBT
Vout = −RthermistorR
Vpot

28 SUMMER 2013
Figure 1: Circuit diagram for the thermistor.
Since the Arduino’s analog input can only handle postive voltages, Vpot must be a negative voltage. The exact value of Vpot will depend on the termistor resistance and your choice of the value for R. For a given choice of R and a constant adjustment of the pot output voltage is proportional to the thermistor resistance, Rthermistor in the op-‐amp’s feedback. Here the op-‐amp functions as an ohmmeter. The second op-‐amp acts as a voltage follower and is used to avoid loading the analog input of the Arduino.
The resistance of the thermistor decreases as temperature increases. Accordingly, the magnitude of the output voltage of the circuit decreases as temperature increases. In this exercise we are interested in temperatures between room temperature and 100˚C. If we choose R equal to the thermistor resistance at room temperature then the magnitude of the output at temperatures above room temperature will always be less than Vpot.
The thermistor resistance is given by R = AeB/T and the output voltage is proportional to the thermistor resistance. Accordingly, the output voltage can be written
(3)
The constants C and B must be determined by calibration. Then the absolute temperature can be calculated upon measuring Vout .
Calibration of the thermistor thermometer Quality control in the manufacture of thermistors is such that all thermistors of a given type will not have the same values of C and B. It is up to the user to determine C and B experimen-‐tally. In principle, two measurements of voltage and temperature suffice to determine C and B. A more satisfactory technique is to record measurements of voltage and temperature in the temperature range of interest and fit the theoretical expression to the data. Fitting is greatly
–+
R
–+
Rthermistor–12V
10kArduino !Analog Input
Vout = CeBT

SUMMER 2013 29
simplified if the data are described by a straight line relationship. A graph of Vout versus T for the thermistor function is not a straight line but we can "linearize" the exponential relationship between Vo and T by taking the natural logarithm of both sides of the equation
(4)
Performing measurements of Vout and T and plotting lnVout versus 1T will produce a straight
line with slope B and intercept lnC. You will use the linear regression function of Excel to determine slope and intercept.
The thermistor is sealed in the bottom of a tube about 1/4" in diameter and 10" long. Electrical connections are made to the thermistor by flexible leads entering the open end of the tube. Connect the thermistor to the circuit as shown in Figure 1. Choose R and Vpot to produce an output voltage between 4 and 5 V at room temperature. Since the resistance of the thermistor decreases with increasing temperature, this will be the maximum voltage. In this exercise you will be using a temperature range from room temperature (about 20˚C) to about 100˚C. Before you connect the output ot the Arduino test your circuit by touching the thermistor. As it warms up the output voltage of your circuit should drop.
After you convinced yourself that your circuit works the next step is to calibrate the thermistor by determining the relationship between voltage and temperature. Place a thermometer and the thermistor probe into a beaker of water and place the beaker on a hot plate. Make a series of measurements of temperature and output voltage, Vout, from room temperature to the boiling point of water. It is very important to stir the water during the calibration, and to have the thermistor and thermometer tied together so you actually know that thermistor and thermometer are exposed to the same temperature. Record the measurements in a spreadsheet as you proceed. In the spreadsheet, plot ln Vout versus 1/T , where T is the absolute temperature. Perform a linear fit to the data and record the slope and intercept; you will need this for the temperature controller in the next part.
Temperature Controller Suppose you had a jar of water on a stove, a thermometer to measure the water temperature, and wanted to maintain the temperature at 60 ± 2˚C. You would turn the stove on, watch the thermometer, and shut it off when the temperature reads between 58 and 62˚C. When the water cools and the temperature falls below 60˚C, you would turn the stove on. In this exercise a microcontroller (the Arduino) will “watch” the temperature via the thermistor and will turn a heater on or off in order to maintain a constant water temperature.
lnVout = lnC +BT

30 SUMMER 2013
Figure 2: The switch circuit for the temperature controller. Component diagram (top) and equivalent circuit diagram (bottom). The components inside the dashed box are in the blue box with the outlet on your lab station.
The actual switching is done by a relay. A relay is an electromechanical switch that is operated by applying a small voltage to the input terminals. A current flows through a coil and attracts an iron lever which in turn closes an electrical switch. We will be using a similar device called a solid-‐state relay; it performs the same action, but entirely without any moving parts, just via semiconductor electronics.4 The solid-‐state relay has two terminals to which the voltage is applied and two terminals that constitute the switch. For example, when 3 to 5 V is applied to the input the switch is ON, i.e. the “switch contacts” are closed. If 0 to 0.5 V is
Digital!Output
Immersion! Heater
Solid-State!Relay
to 120VAC!Power Outlet
If digital output = LOW switch is open!If digital output = HIGH switch is closed
to Arduino! GND! !Digital!Output
AC Power!120 VAC
Immersion !Heater
Solid-State Relay
Switched!Power!Outlet

SUMMER 2013 31
applied the switch is OFF, i.e. the “switch contacts” are open. The control voltage is DC, so the polarity of the applied voltage matters greatly. Figure 2 shows the switch circuitry. With the circuit in Figure 1 still connected to the Arduino, we now have to connect the digital output of the Arduino to the switch circuit of Figure 2. The the digital output goes to the red terminal and the Arduino’s ground goes to the black terminal. When the output goes HIGH, the relay switch closes and turns on the immersion heater. When the digital output goes LOW, the switch opens and the immersion heater is turned off.
Next you need to program a sketch to have the Arduino monitor the thermistor and decide if the relay switch needs to be on or off. Here are the steps to you to program:
o Read a pot via analog input (the setpoint) o Read the thermistor via analog input (the water temperature) o Compare setpoint Tset and actual temperature T o If T < Tset set digital output HIGH o If T > Tset set digital output LOW o Repeat
As part of the sketch you will need to convert the output voltage to an actual temperature. It is for this step that you will need the calibration constants C and B from the previous section.
Now that you have all your ducks in a row, it is time to see if your temperature controller works as advertised. Plug the immersion heater into the switched outlet (the one in the blue box on your lab station), and place thermistor and immersion heater in a beaker of water. Be careful that the thermistor does not touch the heater directly. You also need to add the thermometer so you can see if the controller maintains the correct temperature. Once the relay turns the heater on, the temperature will rise. When it reaches the setpoint temperature the controller will turn the heater off. Be patient, it will take some time for the water temperature to react to the heater. After 10-‐20 minutes you should have some sort of equilibrium. Carefully observe and note how high and low the temperature gets as the controller cycles on and off.

32 SUMMER 2013
Your report should include 1. A hard copy of the spreadsheet showing the experimental data and the linear regression analysis.
2. A plot of the calibration data and the "best fit" straight line.
3. A discussion of the interface electronics.
4. A block diagram of how the software works in the temperature controlling process.
5. A discussion of the performance of the system as a temperature controller.
6. Make a suggestion how you can improve the controller so that a tighter temperature range is obtained.

SUMMER 2013 33
ARDUINO SHIFTS BITS WITH A SHIFT REGISTER
Objectives To gain experience with digital electronics by accessing a shift register via the Arduino microcontroller.
Background A register is computer lingo for a data storage device, usually limited to a few bits, e.g. 8-‐bit (1 byte) or 16-‐bit (2 bytes). A shift register is a data storage device for which the data to be stored is “shifted” into the register one bit at a time. Why is it important to load the register this way? Consider an example. Suppose you wish to control a display consisting of 8 LEDs via an Arduino program. You will have to string wires from each of eight digital output ports of the Arduino to the LEDs and one wire back for the ground connection (Figure 1). This is a lot of wiring, not to mention using up 8 of the 12 available output ports. Enter the shift register. The eight outputs of the shift register are connected to the 8 LEDs as before, however the shift register is located in close proximity of the LEDs, and wiring the LEDs to the register chip becomes trivial. To control the shift register we only require a connection of two digital output ports to the shift register, plus a power and a ground line. This is a typical situation for which shift registers are used. The USB standard also uses “shifting” or serial data transmission and as a result requires only 4 wires (2 data lines, +5V and GND). Compare this with an obsolete centronics printer cable: 24 wires were required to connect a printer to a computer. Maybe this illustrates why parallel printer interfaces are no longer used these days.
Figure 1: The benefit of using a shift register for data transmission. (a) 8 LEDs controlled by an Arduino via 8 digital output ports requires 9 wires from the Arduino to the LEDs. (b) Using a shift register reduces the same job to 4 wires and 2 digital output ports.
USB
rxtxd2d3d4d5d6d7 d8
d9d10d11d12d13
arefGND
reset+3.3VGND+5V
a0a1a2a3a4a5
+5V
8 LEDs
8-bit Shift!Register
Ground
ClockData
(b)
+5V
USB
rxtxd2d3d4d5d6d7 d8
d9d10d11d12d13
arefGND
reset+3.3VGND+5V
a0a1a2a3a4a5
+5V
8 LEDs
(a)

34 SUMMER 2013
In this exercise, you will learn how an 8-‐bit shift register is used to store an 8-‐bit binary number. We will use the Arduino to move the binary number to the shift register. First we will write our own software to accomplish this, then we will simplify matters by utilizing the shiftOut() function which is a built-‐in Arduino function.
Let’s begin by looking at the shift register chip, the SN74LS164. The internal circuit diagram is shown schematically in Figure 2. The chip belongs to the TTL family SN74XXX and thus is powered by +5V via pin 14 and GND on pin 7. The shift register consists of 8 flip-‐flops, each of which will store or “memorize” one bit. Each flip-‐flop has a clear input, all of which are tied together into the CLEAR-‐line4, which when set low (i.e. connected to ground) sets all flip-‐flop outputs to logical zero. There are two serial inputs, A and B. One input must be logical high for the other input to affect the state of the first flip-‐flop upon the low-‐to-‐high transition of the clock pulse. Upon further clock transitons the output of the A-‐flip-‐flop is shifted over to the B-‐flip-‐flop, and so on. In order to shift a byte into the shift register, the byte must be applied to either input A or B, while the other input is kept high. Since each flip-‐flop has its own output line, this type of register is refered to as “serial in and parallel out”. Figure 3 illustrates the process; you see that it will take 8 clock cycles to move a byte into the register. The clock frequency determines how fast the shifting (i.e. serial loading process) is accomplished. A typical clock rate for serial transmissions is 9600 baud (1 baud = 1 bit/s). At that rate it will take a little more than 0.10 ms for each bit shift or a total of 0.83 ms per byte. Note that the byte is shifted into the shift register with the least significant bit (LSB) first. After each clock
4 The bar across CLEAR means that this is a low-active input, i.e. it must be set low to perform its function.
Figure 2: Type SN74LS164 shift register circuit (top) and the pin assignment (bottom).
Figure 3: The 8-‐bit number 1101 0010 is moved into the shift register one bit at a time. It will take 8 clock cycles to accomplish the task. Note that the first bit shifted is the least significan bit (LSB).
Figure 3: The 8-‐bit number 1101 0010 is moved into the shift register one bit at a time. It will take 8 clock cycles to accomplish the task. Note that the first bit shifted is the least significan bit (LSB).
1 2 3 4 5 6 7
891011121314
GND
Vcc
A B
CLK
Q A QB QC QD
QGQH QF QE CLR
74LS164
R
S
CLK
CLRR
S
CLK
CLRR
S
CLK
CLRR
S
CLK
CLRR
S
CLK
CLRR
S
CLK
CLRR
S
CLK
CLRR
S
CLK
CLR
CLOCK
AB
SERIAL!INPUTS
CLEAR
Q A QB QC QD QG QHQFQE
8 Shift Register Outputs Q to QA H

SUMMER 2013 35
cycle the bit moves one bit to the “right” until after 8 clock cycles the bit arrives at its proper place.
The object of this laboratory exercise is to use the Arduino to produce a binary representation of an 8-‐bit number and to produce a sequence of clock pulses for the SN74164 shift register. The number representation and the clock pulses will be connected to the shift register in order to store the number. The shift register outputs QA through QH will be connected to LEDs serving as indicators for the logic state. Logical 1 (high) on an output will cause the red LED to light, while logical 0 (low) will result in the green LED to light.
Connect the shift register SN74164 to the Arduino as shown in Figure 4. When connecting pins 3-‐6 and 10-‐13 make sure you keep to the same order. QA is the most significant bit (MSB) and QH is the LSB. The A-‐input (pin 1) and the CLR-‐input (pin 9) must be maintained at logical high and thus are connected to +5V.
Figure 3: The 8-‐bit number 1101 0010 is moved into the shift register one bit at a time. It will take 8 clock cycles to accomplish the task. Note that the first bit shifted is the least significan bit (LSB).

36 SUMMER 2013
Open the sketch Shift_Register1.ino on your desktop and upload it to the Arduino. When the sketch begins to run you should see your LEDs lighting up periodically as they stand for the binary represention of the numbers 0 to 255. Now let’s examine the sketch. The key is the sub function shiftByte( ):
Figure 4: Schematic diagram of shift register connected to the Arduino. Pins 3-‐6 and 10-‐13 are connected to the LED display in the upper right of the breadboard station
SUMMER 2013 37
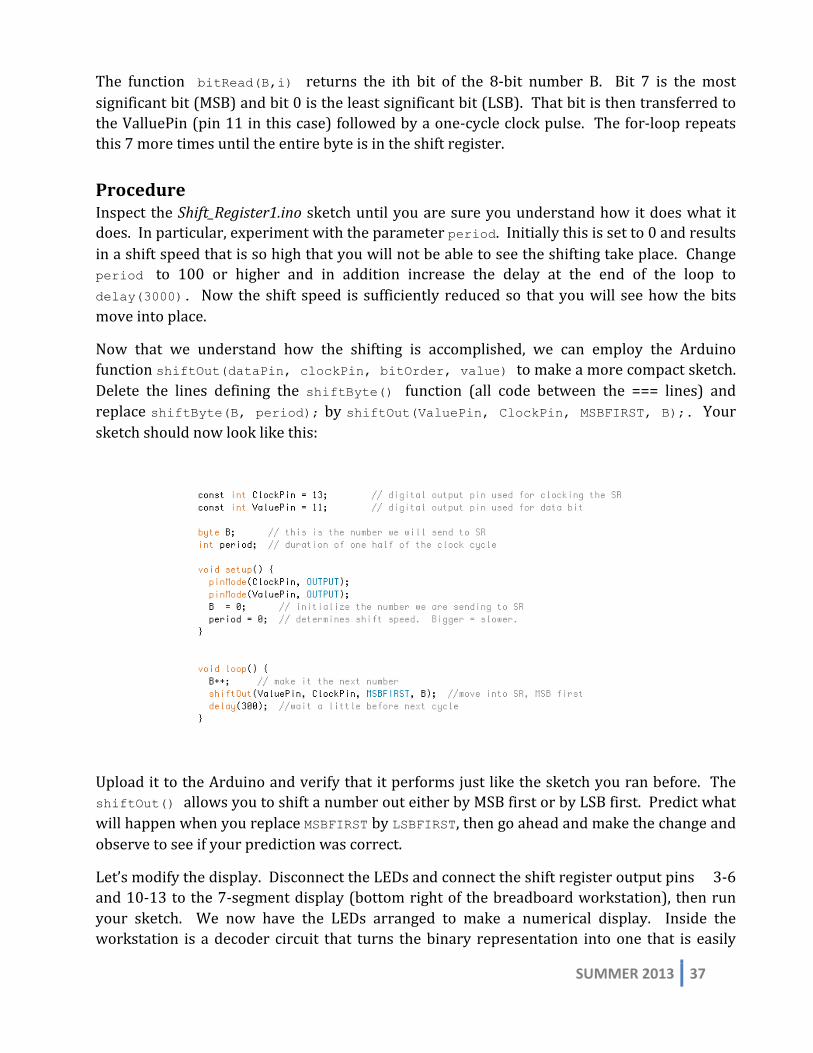
The function bitRead(B,i) returns the ith bit of the 8-‐bit number B. Bit 7 is the most significant bit (MSB) and bit 0 is the least significant bit (LSB). That bit is then transferred to the ValluePin (pin 11 in this case) followed by a one-‐cycle clock pulse. The for-‐loop repeats this 7 more times until the entire byte is in the shift register.
Procedure Inspect the Shift_Register1.ino sketch until you are sure you understand how it does what it does. In particular, experiment with the parameter period. Initially this is set to 0 and results in a shift speed that is so high that you will not be able to see the shifting take place. Change period to 100 or higher and in addition increase the delay at the end of the loop to delay(3000). Now the shift speed is sufficiently reduced so that you will see how the bits move into place.
Now that we understand how the shifting is accomplished, we can employ the Arduino function shiftOut(dataPin, clockPin, bitOrder, value) to make a more compact sketch. Delete the lines defining the shiftByte() function (all code between the === lines) and replace shiftByte(B, period); by shiftOut(ValuePin, ClockPin, MSBFIRST, B);. Your sketch should now look like this:
Upload it to the Arduino and verify that it performs just like the sketch you ran before. The shiftOut() allows you to shift a number out either by MSB first or by LSB first. Predict what will happen when you replace MSBFIRST by LSBFIRST, then go ahead and make the change and observe to see if your prediction was correct.
Let’s modify the display. Disconnect the LEDs and connect the shift register output pins 3-‐6 and 10-‐13 to the 7-‐segment display (bottom right of the breadboard workstation), then run your sketch. We now have the LEDs arranged to make a numerical display. Inside the workstation is a decoder circuit that turns the binary representation into one that is easily

38 SUMMER 2013
recognize by human observers. But there is flaw; periodically the display goes dark. If it were not for those annoying interruptions, it would behave like a counter or stop watch. Modify your sketch so that it behaves like a counter that counts from 00 to 99 continuously!
If time permits: Create a “thermometer” display for the output voltage of a potentiometer conneted to +5V and GND. For an output voltage of 5V all LEDs light up; for 2.5 V only 4 LEDs will be lit, and for less than 0.6 V none of the LEDs will light up. One approach to accomplish this is to modify Shift_Register1.ino so it displays the “right” values of B for the given potentiometer voltage.
Your report should include: 1. A brief description of how the Shift_Register1.ino sketch is moving an 8-‐bit number into the shift register. Be sure to include the effect the parameter period has on the appearance of the display. 2. Describe what you observe when you replace MSBFIRST by LSBFIRST in the shiftOut() function. 3. Describe what you did to modify the LED display sketch so it works with the 7-‐segment display to count up from 00 to 99. 4. A hard copy of your thermometer display sketch with sufficient annotations that anyone will be able to follow.

SUMMER 2013 39
DIGITAL POTENTIOMETER
Objectives 1. To understand the operation of a digital potentiometer.
2. Use an Arduino to communicatre with a digital potentiomenter via Serial Periphery Interface.
Background During the course of this workshop, you have worked with potentiometers whose resistance depended on the angular position of a shaft or the linear position of a slider. The exercise today involves a potentiometer whose resistance is controlled digitally. The potentiometer to be used is a Type MCP41010. It is integrated into an 8-‐pin DIP package (Fig. 1).
An 8-‐bit binary number entered serially into the DATA connection (pin 3) determines the resistance between pins 5 and 6 (or 6 and 7). For binary numbers ranging from 0 to 255, the resistance will vary from 0 to 10K.
Figure 1: Pin connections for the MCP41010 digital pot. is the so-‐called “chip select” and needs to be set low to be active. SCK is the serial clock that is used to move data wired to the DATA input into a shift register.
12
34 5
67
8 +5V
GND
DATA
SCK
CS
CS

40 SUMMER 2013
Achieving a desired resistance involves the following steps: 1. In the idle state both the (chip select) and SCK (serial clock) are set HIGH (a.k.a. logical 1 or +5V). To activate the chip is set LOW (a.k.a. logical 0, or ground potential). The SCK is set LOW also so it is ready to clock in the data.
2. An 8-‐bit COMMAND byte is entered serially into the DATA line with the MSB (most-‐signifianct bit) entered first. Each bit is clocked into the shift register in the chip by a pulse on SCK as SCK transitions from LOW to HIGH, i.e. on the rising edge of a clock pulse. The COMMAND byte sets up the chip for the desired operation. For the digital pot at hand the 8-‐bit COMMAND byte is 00010001 (= 17 decimal equivalent).
3. An 8-‐bit DATA byte is entered serially after the COMMAND byte with the MSB entered first. Each bit is clocked into a shift register by a pulse on SCK on the LOW to HIGH transition. The value of the DATA byte is determined by the desired resistance.
4. The operation ends by setting both the line and the SCK line to HIGH.
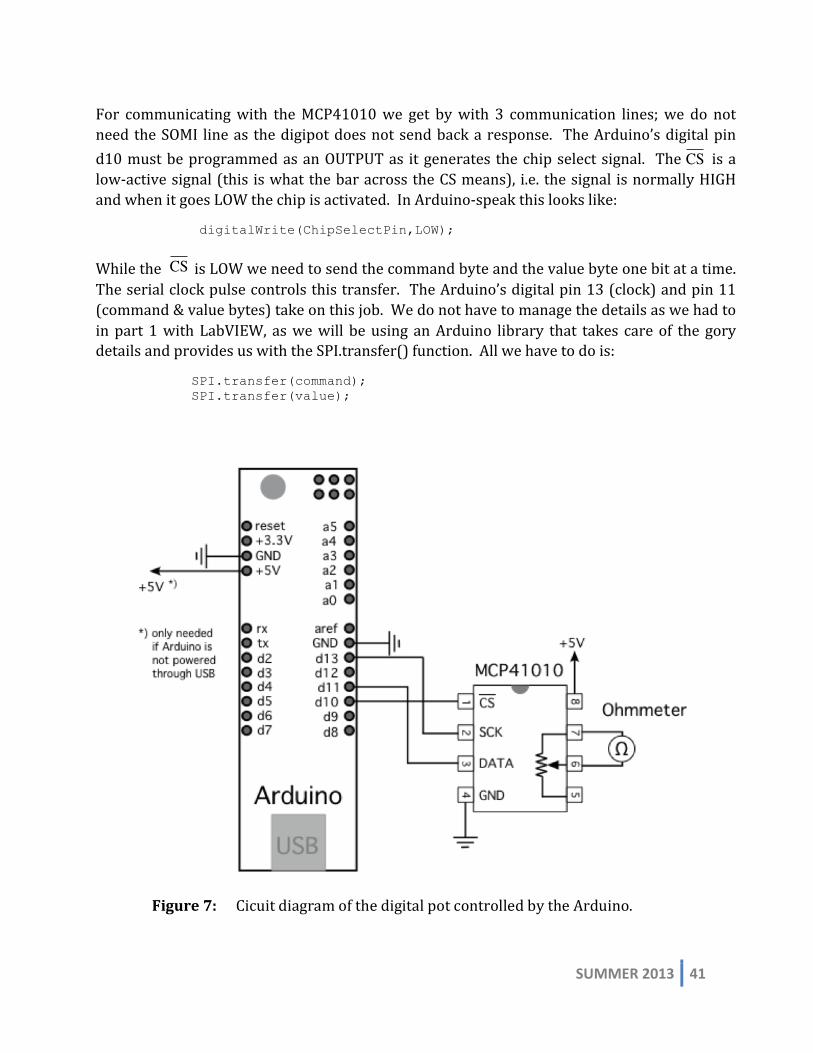
Procedure: Using Arduino to Address the Digital Pot Connect the digital pot chip MCP41010 to the Arduino as shown in Figure 7. If you plan to power the Arduino via the USB cable you will not need to connect the +5V to the forth pin on the top/left, but both ground connections on the Arduino are required. The Ohmmeter will be used to verify that the resistance of the digipot changes according to the code that is transmitted from the Arduino to the MCP41010.
The MCP41010 chip is compatible with the SPI-‐protocol. SPI stands for “Serial Peripheral Interface” and is pronounced “spy” or “ess-‐pee-‐eye”. SPI is a serial communication standard first introduce by Motorola. It allows a controller device (the master) to communicate bi-‐directionally with one or several peripheral devices (the slave(s)). In general 4 communication lines are required:
SCK Serial clock generated by the master CS Chip select to activate a specific peripheral device MOSI “Master out – slave in” for data transmission from controller to peripheral SOMI “Slave out – master in” for response form the peripheral
CSCS
CS
SUMMER 2013 41
For communicating with the MCP41010 we get by with 3 communication lines; we do not need the SOMI line as the digipot does not send back a response. The Arduino’s digital pin d10 must be programmed as an OUTPUT as it generates the chip select signal. The is a low-‐active signal (this is what the bar across the CS means), i.e. the signal is normally HIGH and when it goes LOW the chip is activated. In Arduino-‐speak this looks like:
digitalWrite(ChipSelectPin,LOW);
While the is LOW we need to send the command byte and the value byte one bit at a time. The serial clock pulse controls this transfer. The Arduino’s digital pin 13 (clock) and pin 11 (command & value bytes) take on this job. We do not have to manage the details as we had to in part 1 with LabVIEW, as we will be using an Arduino library that takes care of the gory details and provides us with the SPI.transfer() function. All we have to do is:
SPI.transfer(command); SPI.transfer(value);
CS
CS
Figure 7: Cicuit diagram of the digital pot controlled by the Arduino.
42 SUMMER 2013
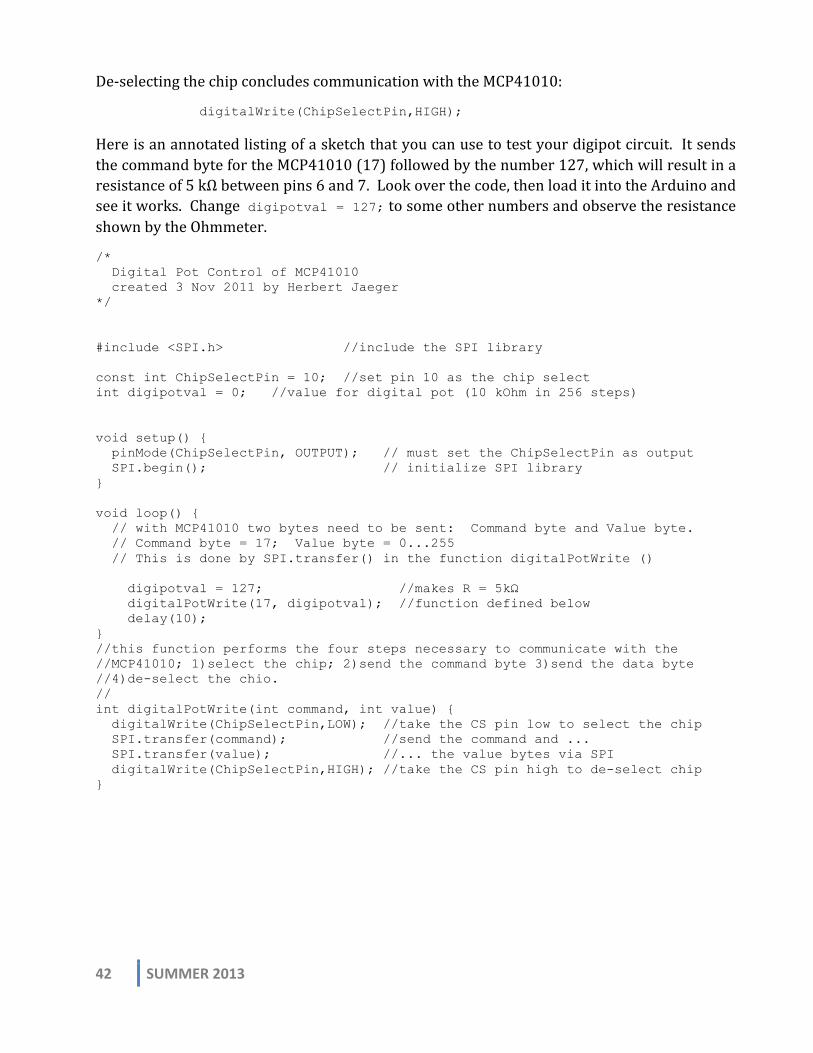
De-‐selecting the chip concludes communication with the MCP41010:
digitalWrite(ChipSelectPin,HIGH);
Here is an annotated listing of a sketch that you can use to test your digipot circuit. It sends the command byte for the MCP41010 (17) followed by the number 127, which will result in a resistance of 5 kΩ between pins 6 and 7. Look over the code, then load it into the Arduino and see it works. Change digipotval = 127; to some other numbers and observe the resistance shown by the Ohmmeter.
/* Digital Pot Control of MCP41010 created 3 Nov 2011 by Herbert Jaeger */ #include <SPI.h> //include the SPI library const int ChipSelectPin = 10; //set pin 10 as the chip select int digipotval = 0; //value for digital pot (10 kOhm in 256 steps) void setup() { pinMode(ChipSelectPin, OUTPUT); // must set the ChipSelectPin as output SPI.begin(); // initialize SPI library } void loop() { // with MCP41010 two bytes need to be sent: Command byte and Value byte. // Command byte = 17; Value byte = 0...255 // This is done by SPI.transfer() in the function digitalPotWrite () digipotval = 127; //makes R = 5kΩ digitalPotWrite(17, digipotval); //function defined below delay(10); } //this function performs the four steps necessary to communicate with the //MCP41010; 1)select the chip; 2)send the command byte 3)send the data byte //4)de-select the chio. // int digitalPotWrite(int command, int value) { digitalWrite(ChipSelectPin,LOW); //take the CS pin low to select the chip SPI.transfer(command); //send the command and ... SPI.transfer(value); //... the value bytes via SPI digitalWrite(ChipSelectPin,HIGH); //take the CS pin high to de-select chip }

SUMMER 2013 43
Now let’s put this digipot to some use. Modify your cicuit according to Figure 8. The capacitor is connected to +5V via the digital pot. The positive plate of the capacitor is connected to analog input line a5, so that the capacitor voltage can be measured. The capacitor will begin to charge as soon as the circuit is powered up. A push button connects the capacitor to ground and, when pushed, discharges the capacitor. Use this circuit to measure the capacitor voltage as a function of time beginning when the push button is pushed. Stop the measurement when the voltage reaches 4.99 V. Indicate the end of the measurement by turning on an LED. Each time the button is pressed the LED is turned off and a new measurement begins with a different R of the digipot. The voltage and time data pairs are sent back via the serial monitor. Here are some code elements that you will need as you assemble your sketch. We’ll need the SPI library
#include <SPI.h>
We need two time variables. t0 is the time when the measurement begins, and time is the time since the measurement began.
unsigned long t0; // initial time when measurement begins unsigned long time; // time during measurement
Figure 8: Diagram of the capacitor charging circuit.

44 SUMMER 2013
Time is established by the millis() function. This function returns the number of milliseconds since the current program started. At the beginning of the measurement time is captured in t0
t0 = millis();
The actual time during a measurement then is
time = millis() - t0;
The serial monitor function allows to send numerical data back to the host computer via USB. It is very similar to the print statement in C or Python.
Serial.print("\t digipot = "); Serial.print(digipot); Serial.print("\t time = "); Serial.print(time); Serial.print("\t volt ="); Serial.println(volt);
Assemble your sketch and run it. After you have done at least 5 measurements (i.e. five different R-‐values), select the window content of the serial monitor window (Ctrl-‐A) and copy it (Ctrl-‐C) and paste it into an empty spreadsheet (Ctrl-‐V). Once you have the data in a spreadsheet, perform a semi-‐log plot of your data to determine the resistance that was use to charge the capacitor. Compare the resistor values with the values based on the digipot codes that you used in your sketch.
Your report should include 1. An annotated hard copy of your sketch performing the charging measurements.
2. A hard copy of the spreadsheet showing the measurements and analysis.
3. A discussion of the results.
SUMMER 2013 45
QUANTIZED CONDUCTANCE
Objectives 1. To demonstrate the emergence of quantized conductance as a gold wire is broken and unbroken and to find the value of the quantized conductance from experimental data.
2. To link the shape of the conductance curve with the correspondence principle.
3. To understand the size scales at which different scattering phenomena occur in solids.
Overview of Quantized Conductance Setup This mechanically-‐controlled break junction (MCBJ) setup uses a spring steel sheet as a bending beam and a micrometer to stretch a 99.99% purity, 3.5”-‐long and 75µm-‐wide gold wire with atomic displacement accuracy. The BM-‐11.16 Vernier Micrometer has a resolution of about 1µm and is rotated manually by attaching it to a plastic disc of radius 5”. The 1095 Blue Tempered Spring Steel sheet is a little over 3” long, 0.5” wide, and 0.008” in thickness. The barrel of the micrometer passes through a hole in an aluminum housing block and is secured by a set screw. When fully retracted, the micrometer head is flush with the aluminum block. Two stops are placed 3” apart, centered on the hole for the micrometer head. These conductive stops are electrically insulated from the main aluminum block by a length of plastic tubing. These stops are positioned so that there is 4mm of distance between the fully retracted micrometer head and the plane of the stops. The sample is placed in this space, and the micrometer head is advanced to make contact with the sample. With the barrel of the micrometer secured in place, the tip can be extended and retracted by rotating the thimble. As the tip extends, it presses into the middle of the spring steel sheet. This bends the spring steel outwards against the two stops, producing the desired bending motion. If the sample is particularly long, as it bends the ends of the spring steel sheet may contact the aluminum block. This is prevented by cutting two clearance notches on either side of the block. Fig. 1 shows the setup used in this experiment.
Since the spring steel sheet is conductive, we need to paste a cigarette paper on it, and then attach the gold wire using two droplets of Double/Bubble insulating epoxy with a narrow gap between them as shown in Fig. 1c). The gold wires will be already attached to the bending beam before the lab starts. After the epoxy hardens, we use a sharp blade to cut a shallow notch in the gold wire. The blade is also used to cut a groove in the epoxy if the two droplets merge together. Fig. 1d) is a scanning electron microscope image of the partly cut wire and the two epoxy drops.

46 SUMMER 2013
When turning the plastic disk and micrometer, the wire stretches extremely slowly with a reduction factor (f) given by: 𝑓 = 3 !"
!! , where y is the distance between the two epoxy drops, s
the thickness of the spring steel sheet and the insulating film, and u is the separation between the two stopping edges. We estimate f ~ 2 x 10-‐5 (corresponding to a mechanical reduction of 50,000), which gives atomic scale motion, when multiplied by the micrometer resolution of 1µm. The huge reduction in the bending beam is the key to achieve atomic scale motion and to eliminate the effect of external vibrations on the experiment. The current through the constriction is produced by connecting the wire in series to an external resistor of 100KΩ and a 1.5V battery. As the wire is pulled, the voltage across it is measured repeatedly at a high rate (10,000 samples per second) using a National Instruments data acquisition (DAQ) unit and a simple LabVIEW program. The circuit diagram and the LabVIEW program used to collect the data are shown in Fig. 2.
Experimental Procedure I. We will start the Monday afternoon session with a 10 to 15 minute talk to go over the
experiments and their possible pedagogical uses, followed by preparing the quantized conductance samples, as these need to cure for approx. 20 hours.
II. The first experimental work is to prepare the gold wires that are attached to the ‘insulating’ bending beam (shown in Fig. 1(c)) as follows: 1- Use a shear cutter to cut 3 or 4 sheets of springy steel to a length of 3”. 2- Mix the two components of a small bag of ‘Extra Peel Strength’ Double/Bubble
epoxy, and then divide that into five smaller amounts for each colleague to have enough to prepare their samples.
3- Use scissors to cut two to three ¼”-wide sheets from a cigarette paper (cut along the long side of the cigarette paper).
4- Spread 3 to 5 small drops of epoxy along the middle of the springy steel (roughly along the long axis that goes through the center of the sheet).
5- Lay a ¼” cigarette paper piece over the springy steel and smooth it out by gently pressing with your fingertips. Prepare three of these ‘bending beam assemblies’.
6- Cut three 75-micrometer Gold wire to a length of ~3.5”. 7- To attach a gold wire on a cigarette-paper-covered spring steel sheet: Gently stretch
the wire with your hands to make it less ‘wrinkly’. Place the gold wire over the attached cigarette paper such that the middle of the wire roughly sits on the middle of the bending beam.
8- Use a pair of tweezers to gently press on the wire to keep it in place and use your dominant hand to place a drop of the mixed epoxy just to the side of the middle section of the wire.
9- Place a second epoxy drop about 0.5mm away from the first drop such that the gap is at the center of the wire.
10- If the two drops are still far, use a thin tip (like a general lab wire) to pull the droplets closer together. If the droplets are too close then pull them away.

SUMMER 2013 47
Fig. 1. Pictures of the MCBJ setup. a) The MCBJ assembly showing the pin of the micrometer, the bending beam, the stops and the wire. No solder is needed to connect the ends of the gold wire to the stops. b) The experimental setup showing the plastic disk used to rotate the micrometer, the battery and wires, as well as the bending beam. c) A gold wire mounted on a sheet of spring steel and a quarter dollar coin is placed next to it for visual comparison. The two epoxy drops are seen in the middle. d) Scanning electron microscope image of the wire and the two drops. The wire is partially cut in the middle to create a week point in it.
11- Use the width of the gold wire (75µm) as a reference to determine the width of the gap between the two drops. Try to eventually make the gap 3 to 5 times the width of the wire.
12- Each colleague will make about three of these bending beams and wires. 13- Leave the epoxy to set overnight in order for the droplets to harden. 14- Make one extra bending beam/gold wire sample with a few drops of epoxy placed
in pairs just like above. This wire will be used for practicing the partial cutting the next day.
III. Examining and Assembling the Electrical Circuit and Head Assembly (Fig. 1(a),(b))
1- Take one of the experimental setups and dis-assemble it then assemble it completely. 2- Make sure to remove the micrometer from the head assembly and then put it back in
order to see how it is designed. 3- Feel free to remove the solder on the 100 kΩ resistors and other wires, if you prefer
to assemble and wire them from scratch yourself.

48 SUMMER 2013
Tuesday morning: Arduino basics; Tuesday afternoon: More Quantized Conductance I- Partial Cutting of Gold Wires. We will start by partly cutting the gold wires at the
midpoint between the two epoxy drops. Yet, before that we will practice cutting the wire that had the multiple epoxy drops on it. 1- Place the wire with the multiple epoxy drops under the microscope and focus on one
of the gaps. Press down on the bending beam next to the gap in order to make sure that the microscope is focused when the beam is pushed down.
2- Use a fresh X-acto knife and try to partly cut the wire. Start by making a shallow cut, and then make it progressively deeper in order to practice the technique. Try the same between other pairs of epoxy drops on the same ‘sacrificial’ gold wire. Use the area of the X-acto knife blade closest to the tip while cutting the wire.
3- If the epoxy drops merged together overnight, use the X-acto knife to separate them. 4- You are now ready to partially cut the mid-section of the gold wire in the real
devices. Only cut one wire at this time. 5- You are now ready to use the already-cut gold wire in a real measurement.
II- First LabVIEW Measurements of Resistance
1- Place the bending beam and partially cut gold wire into the setup as shown in Fig.1 such that the back of the bending beam is facing the micrometer tip.
2- Make sure that the battery is in place and the setup is ready. 3- Open LabVIEW software and build a small VI comprised of a DAQ assistant that
takes one voltage measurement (sample) on demand and outputs it to a waveform graph or chart. The DAQ assistant and graph should be placed inside a while loop with a stop button that can be clicked by the operator to stop the program. This LabVIEW program is sufficient to tell if our sample is promising or is already bad.
Fig. 2. a) A simple electrical circuit is used to measure the conductance of the gold wire and b) a very basic LabVIEW program monitors and records the data

SUMMER 2013 49
4- Two examples of bad samples are when the gold wire might be completely broken (i.e. severed) or never breaks even with bending the beam to the maximum micrometer travel available. The ‘damage’ is irreversible in the first case (most of the time). If the wire never breaks, then take the sample again to the microscope and try to cut a little deeper into the gold wire.
5- If the wire is broken then all the voltage from the battery will be on the gold wire and the DAQ assistant will measure a voltage of about 1.5V. If the gold wire is connected, its resistance will be negligible compared to the 100kΩ resistor and the voltage across the gold wire will be close to zero.
6- A good wire/bending beam will demonstrate a voltage that abruptly goes from zero to 1.5V as the micrometer is rotated in and out.
7- Make sure the LabVIEW program is running, and then advance the micrometer tip by rotating the plastic wheel counterclockwise.
8- The voltage across the wire will initially be about 1.5V if the gold wire is not making good electrical contact with the metallic ‘stopping poles). As the micrometer tip moves forward pushing the beam against the stops, electrical contact will be established with the wire and the voltage will drop to zero. Finally, after the micrometer pushes the beam bending it further, the gold wire eventually breaks and the voltage jumps promptly to ~1.5V. You can now rotate the micrometer clockwise and counterclockwise multiple times to get the wire to break and reconnect.
9- After checking that the sample is ‘promising’ for further measurement, we will do the same procedure in order to partially cut the gold wires in the two remaining samples that you made yesterday.
10- Modify the LabVIEW program as shown in Fig. 2(b). The new part of the program lets the DAQ assistant collect a large number of voltage readings ~60,000 to 100,000 at a fast rate of 10,000 points per second, and then displays them in a graph. During the time of data collection, there is no real-time info on the breaking/reconnection status of the wire. One has to ‘blindly’ rotate the micrometer back and forth and hope to get at least a couple of events of breaking and reconnecting of the gold wire.
11- Zoom in on each of these areas and search for any quantized conductance steps. As the constriction stretches, its diameter shrinks and the voltage across the wire rises continuously because the wire resistance increases with decreasing diameter. When the constriction diameter becomes comparable to the de Broglie wavelength of the electrons (the Fermi wavelength), the voltage displays discrete steps rather than a smooth increase. Since the wire is connected in series to the external resistor of
100kΩ, the voltage across the constriction is: 𝑉! = 𝐼𝑅! =!!
!!!!!"#𝑅! and the
conductance is:

50 SUMMER 2013
𝐺 = !!!!!!!!!"#
(1)
Here, VB is the battery voltage, Rext is the external resistor, and Rw is the resistance of the wire (i.e. the constriction). To determine which steps correspond to an actual quantized conductance channel, Equation (1) can then be combined with:
𝐺! = 2 !!
!𝑛 (2)
12- Use Equs. 1 and 2 to modify an Excel sheet of the data such that it displays the
number of quantized channels on the y-axis, instead of voltage.
13- While the LabVIEW program and the analysis above are quite simple, it can be confusing when trying to determine which conductance steps correspond to which channel (i.e. quantum) number (n). Instead, modify the LabVIEW program to build in the results of Equ.s (1) and (2) and plot (n) directly on the Y-axis of the LabVIEW graph.
14- This is the simplest way to ‘read’ the results of a particular run.
15- You might need to collect several sets of data in order to get satisfactory quantization results, as the steps do not occur in every run. Also, feel free to change the sample if it does not give good results.
16- One can simply take a snapshot of the screen using “print screen” in order to insert the results into a report, or better save the data as an Excel sheet for further processing.
Wednesday Morning We will run the Quantized Conductance experiment using LabVIEW with a programmable piezo-crystal and also using Arduino with a stepper motor anda manually driven piezo-crystal.
I) LabVIEW and a programmable piezo-crystal A ‘Piezo Jena’ Piezo-crystal system will be used to collect a large number of data.
1- Change the head of the setup to incorporate the piezo-crystal and its electronics and attach the micrometer to the setup.
2- The setup come programmed to work with LabVIEW. We will run both that program and the program for data collection at the same time.

SUMMER 2013 51
3- Manually rotate the micrometer to break and reconnect the gold wire several times, and then stop as close as possible to the ‘breaking point’.
4- Run the Piezo Jena software and change the frequency to 0.1Hz and the amplitude to 10%. These parameters define the frequency at which the crystal oscillates between contracted and extended position and the percent of full extension distance, respectively. You can also open a display that shows the status of the crystal (how extended it is). Pick a triangular wave for the crystal. Try to change the frequency and the amplitude and see what effect they have.
5- This setup can be used to collect a large number of data points and to ‘build’ a histogram that shows the quantization and helps get rid of random noise. Yet, the main limitation is the total number of data points that can be collected at any given run.
II) Arduino, a stepper motor, and an otherwise manually-driven piezo-crystal. Arduino will be used to run a stepper motor, which in turn is attached to a 10-cycle rotation potentiometer and eight 9-V batteries to apply a variable voltage on a piezo-crystal in order to break and reconnect the gold wire. This is quite similar to the previous setup, yet is simpler and is less costly. This particular system seems to introduce too much noise at its current status but is quite insightful from a pedagogical point of view.
References 1. Modern Physics textbook by Tippler and Llewellyn Chapter 10, sections 10.2 (Classical
conduction), 10.4 (Quantum Theory of Conduction), 10.6 (Band theory of solids). 2. R. Tolley, A. Silvidi, C. Little, K.F. Eid, Amer. J. Phys. 81, 14 (2013)

52 SUMMER 2013