henderson european focus trust plc report for the half
TRANSCRIPT
Company Number: 00427958
HENDERSON EUROPEAN FOCUS TRUST PLC
Report for the half-year ended 31 March 2021
(unaudited)
www.hendersoneuropeanfocus.com

LEGAL ENTITY IDENTIFIER: 213800GS89AL1DK3IN50
HENDERSON EUROPEAN FOCUS TRUST PLC
Unaudited results for the half-year ended 31 March 2021
Investment objective The Company seeks to maximise total return (a combination of income and capital growth) from a portfolio of stocks listed in Europe.
Performance highlights • Net asset value (“NAV”) per ordinary share total return1 (with dividends reinvested) of 13.6% compared to the
benchmark2 return of 11.9%• Share price3 total return (with dividends reinvested) of 17.2%• Interim dividend of 9.60p per share declared (2020: 9.60p)
Total return performance to 31 March 2021 (with dividends reinvested)
6 months
%
1 year
%
3 years
%
5 years
%
10 years
%
NAV1 13.6 42.3 34.8 76.4 194.1
Benchmark index2 11.9 34.9 27.3 69.7 114.4
Average AIC sector NAV4 12.0 41.6 34.1 80.0 165.3
Share price3 17.2 50.3 23.4 71.8 198.3
Average AIC sector share price4 15.5 48.5 34.3 82.6 181.3
1 Net asset value (“NAV”) total return per ordinary share (with dividends reinvested) 2 FTSE World Europe ex UK Index on a total return basis in Sterling terms 3 Share price total return (with dividends reinvested) using mid-market closing price 4 Association of Investment Companies (“AIC”) Europe sector of eight companies
Sources: Morningstar Direct, Refinitiv Datastream and Janus Henderson
Financial highlights
At 31 March 2021
(unaudited)
At 30 September 2020
(audited)
Shareholders’ funds
Net assets £345.3m £308.2m
NAV per ordinary share 1,615.00p 1,441.20p
Share price 1,455.00p 1,260.00p
Gearing at period end 0.2% 0.6%
Half-year ended
31 March 2021
(unaudited)
Year ended
30 September 2020
(audited)
Total return to equity shareholders
Revenue return after taxation (£’000)
Capital return after taxation (£’000)
1,924 5,184
39,798 12,146
Total return 41,722 17,330
Total return per ordinary share
Revenue 9.00p 24.13p
Capital 186.12p 56.54p
Total return 195.12p 80.67p
Page 2 of 15

INTERIM MANAGEMENT REPORT
CHAIR’S STATEMENT
With the rapid authorisation of a number of effective vaccines, markets the world over have responded positively to renewed optimism in recent months on all fronts: social, economic and financial. Continental Europe has been no exception even though, as well publicised, the vaccine roll-out programme has been slower than in other major economies. The good news is that the economic data is coming through stronger than expected and the feared sharp recession has been relatively short lived, with the retail consumer in particular expected to be surprisingly resilient as job losses have been below expectations and support measures substantial. Expectations of inflation, however, remain in low positive territory with the first grants and loans from last year’s landmark €750bn spending package expected to be made by the EU Commission this summer. Trading updates coming from corporates are generally more upbeat than anticipated and European stock markets have responded positively.
Performance In the six months to 31 March 2021, the Company’s NAV total return per ordinary share rose by 13.6% to 1,615 pence, compared to an increase of 11.9% in the Company’s benchmark, the FTSE World Europe ex UK index. The Company’s share price total return rose by 17.2% to 1,455 pence, as the discount narrowed from 12.6% at 30 September 2020 to 9.9% at 31 March 2021. Gearing remains at the lower end of its range at just under 0.2% of net assets at the period end and so performance was largely achieved through active investing – further detail of which is in our Fund Managers’ Report.
Revenue and dividend A maintained interim dividend of 9.6 pence per ordinary share (2020: 9.6 pence) will be paid on 25 June 2021 to shareholders on the register on 4 June 2021. The shares will be marked ex-dividend on 3 June 2021.
Future Board changes We are well underway in a process to recruit a new Board member. Having undertaken both our annual Board evaluation and held a strategy session in the first calendar quarter of 2021, the Board has decided that broadening its membership would be beneficial and we expect to make an announcement in the relatively near future. The Board is using external consultants in finding suitable candidates for our succession.
Outlook Looking forward, we think there are many reasons to be optimistic about the prospects for continental European companies. After a decade of austerity, the EU Commission response to the pandemic has clearly had to change: unprecedented fiscal and monetary support measures, allied to encouraging corporate news has underpinned a recovery in markets. Valuations are high but not excessive, certainly in the context of the US stock valuations, and whilst some inflation is forecast it is not high enough to derail average equity valuations although those at the ‘growthier’ end of the style spectrum may well come in for more scrutiny.
We expect this market environment to suit the Company as our ‘all-weather’ approach avoids ascribing rigid labels of ‘value’ or ‘growth’ to our investment style. This has allowed the emphasis within the portfolio to change from 12 months ago: having had an economic recovery bias led by industrials in summer 2020, the portfolio now favours a bias towards beneficiaries of the much anticipated ‘re-opening’ of economies, led by the consumer.
Finally, investors are realising that many European companies are the leading the way in providing solutions for many of the challenges we face in providing for a more sustainable future and are rightly starting to pay more attention to the changes underway. The Company’s investment process – as we described more fully in the Annual Report – is very much focused on identifying and responding to that change.
Vicky Hastings Chair 26 May 2021
Page 3 of 15
FUND MANAGERS’ REPORT In writing this report twelve months ago, we found ourselves in the eye of the Covid-19 storm and its first devastating wave of infections. One year later and, courtesy of the wonders of human ingenuity, we can see and feel the beginning of the end of a period which has dealt the severest of challenges. Of course, financial markets, by their very nature, anticipate economic and financial developments. In this respect the past six – indeed twelve – months have been no exception. In the Company’s most recent Annual Report to the year ended 30 September 2020, we described, in some detail, how we seek to commit capital on behalf of shareholders. Hopefully, our overriding belief in pragmatism, shone from that report. It is exactly this characteristic of open-mindedness that, we believe, has been a requisite since the moment Covid-19 struck. Indeed, a glance at the graphic in the half-year update underscores this point: as equity markets have ‘broadened out’, beyond the narrow leadership of ‘growth’ stocks, your Company has continued to prosper: a demonstration of our mantra; that we should never be dictated to or constrained by an investing ‘style’. The two charts shown in the update for the six months ended 31 March 2021 illustrate graphically this return to favour of ‘value’ stocks, particularly over the previous six months. Shortly after the pandemic came to the shores of Europe, we identified the ingredients that would lead to a V-shaped recovery in the industrial world. In a nutshell, those ingredients included naturally occurring lows in the corporate inventory and capital expenditure cycles. The pandemic served to aggravate those lows, driving them yet deeper. Then came the quite extraordinary monetary stimulus from central banks worldwide, followed, to varying degrees, by fiscal expansion. The resultant recovery in demand for industrial goods, as factories and construction sites quickly reopened, has played to our strategy. Then, as calendar 2020 drew to a close and Europe was suffering from a second wave of infections, we drew succour from the unequivocally excellent vaccine data. This encouraged us to strengthen our view that a second V-shape is likely: this time in the consumer sphere. During the six-month period under review, we tilted the portfolio towards the consumer discretionary sector. Notwithstanding, at times, hysterical media and political rhetoric concerning vaccine rollouts, vaccine efficacy and even vaccine nationalism, we have resolutely trusted the data. Thus, we have not been swayed in building the portfolio’s positions in stocks we consider strong reopening beneficiaries. Prime examples include Adidas, Amadeus, Carlsberg, Daimler, Essilor Luxottica, Inditex, Mowi, Ryanair and Stellantis. The Company’s optimistic positioning for the ‘reopening’ can be illuminated through that familiar, but temporarily elusive, modern ritual: the summer holiday. It is quite likely that you will unwittingly book your flights and accommodation using the Amadeus Global Distribution System. You may well fly to your destination with Ryanair, or a different airline on an Airbus A320 jet. A new holiday wardrobe might include clothes from Zara, Ray-Ban sunglasses and La Roche-Posay sun cream. In doing so, you have generated sales for Inditex, Essilor Luxottica and L’Oreal respectively. You may dine in a restaurant supplied with salmon from Mowi and beverages from Carlsberg. The desire to travel, consume and experience is the common denominator. Our belief is that this desire will be expressed with renewed fervour. The Company’s current investment positioning, then, can be summed up fairly simply: it is one which seeks to benefit from what we believe will be a happy confluence: an army of immunised consumers, armed with exceptionally high savings ratios. After a year or more of being unnaturally confined, the consumer is a coiled spring, ready to live life again. If we are right that not even a bungling European Union can prevent that, we can look forward to its powerful effects on our portfolio companies. John Bennett and Tom O’Hara Fund Managers 26 May 2021
Page 4 of 15

Portfolio information as at 31 March 2021
Company Sector Country of listing
Valuation £'000
% of portfolio
LafargeHolcim Construction & Materials Switzerland 24,849 7.2
UPM-Kymmene Forestry & Paper Finland 19,279 5.6
ASML Technology Hardware & Equipment Netherlands 14,499 4.2
Nestlé Food Producers Switzerland 12,562 3.6
ASR Nederland Nonlife Insurance Netherlands 12,003 3.5
Tessenderlo Chemicals Belgium 11,595 3.3
LVMH Moet Hennessy Louis Vuitton
Personal Goods France 10,779 3.1
Roche Pharmaceuticals & Biotechnology Switzerland 9,350 2.7
Lundin Energy Oil, Gas & Coal Sweden 9,022 2.6
AKZO Nobel Chemicals Netherlands 9,014 2.6 ----------- ------------
10 largest 132,952 38.4 ----------- ------------
Signify Electronic & Electrical Equipment Netherlands 8,627 2.5
Sanofi Pharmaceuticals & Biotechnology France 8,505 2.5
Nordea Bank Banks Finland 8,320 2.4
STMicroelectronics Technology Hardware & Equipment France 8,207 2.4
Dometic Leisure Goods Sweden 7,906 2.3
BNP Paribas Banks France 7,732 2.2
Carlsberg Beverages Denmark 7,615 2.2
Autoliv Automobiles & Parts Sweden 7,600 2.2
Novartis Pharmaceuticals & Biotechnology Switzerland 7,473 2.2
Essilor Luxottica Health Care Equipment & Services France 7,413 2.1
----------- ------------
20 largest 212,350 61.4 ----------- ------------
Mowi Food Producers Norway 7,289 2.1
Saint-Gobain Construction & Materials France 7,209 2.1
Deutsche Boerse Financial Services Germany 7,063 2.0
Airbus Aerospace & Defence France 6,799 1.9
Interpump Industrial Engineering Italy 6,770 1.9
Nokian Renkaat Automobiles & Parts Finland 6,769 1.9
Stellantis Automobiles & Parts Netherlands 6,104 1.8
Inditex General Retailers Spain 6,079 1.8
Daimler Automobiles & Parts Germany 5,748 1.7
ArcelorMittal Industrial Metals & Mining Netherlands 5,676 1.6
------------ ------------
30 largest 277,856 80.2 ------------ ------------
Novo-Nordisk Pharmaceuticals & Biotechnology Denmark 5,492 1.6 Adidas Personal Goods Germany 5,404 1.6 L’Oreal Personal Goods France 5,384 1.6 Amadeus Software & Computer Services Spain 5,261 1.5 Enel Electricity Italy 5,247 1.5 Infineon Technology Hardware & Equipment Germany 5,116 1.5 KBC Banks Belgium 5,056 1.5 Engie Gas Water & Multiutilities France 4,522 1.3 Linde Chemicals Germany 4,345 1.3 Schneider Electric Electronic & Electrical Equipment France 3,984 1.2
40 largest ------------ 327,667 -----------
------------- 94.8
------------
Page 5 of 15

Company Sector Country of listing
Valuation £'000
% of portfolio
Bayer Pharmaceuticals & Biotechnology Germany 3,932 1.1 Metso Industrial Engineering Finland 3,828 1.1 Subsea 7 Oil, Gas & Coal Norway 3,582 1.0 Ryanair Travel & Leisure Ireland 3,538 1.0 Volvo Industrial Transportation Sweden 3,379 1.0
------------ ------------
Total investments at fair value 345,926 100.0
======= =======
Country of listing (as a percentage of the portfolio excluding cash)
31 March 2021
%
31 March 2020
%
France 20.4 9.1 Netherlands 16.2 14.3 Switzerland 15.7 19.8 Finland 11.0 7.7 Germany 9.1 18.4 Sweden 8.1 11.3 Belgium 4.8 2.6 Denmark 3.8 4.8 Italy 3.5 3.4 Spain 3.3 4.2 Norway 3.1 1.4 Ireland 1.0 - Portugal - 1.7 United Kingdom - 1.3
100.0 100.0
Sector exposure (as a percentage of the portfolio excluding cash)
31 March 2021
%
31 March 2020
%
Consumer discretionary 18.9 12.0 Industrials 18.9 21.0 Basic materials 14.4 10.5 Health Care 12.2 20.9 Financials 11.6 5.2 Technology 9.6 12.1 Consumer staples 8.0 8.9 Energy 3.6 1.7 Utilities 2.8 5.0 Telecommunications - 2.7
100.0 100.0
Page 6 of 15

PRINCIPAL RISKS AND UNCERTAINTIES The principal risks and uncertainties associated with the Company’s business can be divided into the following main areas:
• Market
• Investment performance
• Business strategy and market rating
• Gearing
• Operational
• Regulatory and reporting
Information on these risks and how they are managed is given in the Annual Report for the year ended 30 September 2020. In the view of the Board, these principal risks and uncertainties at the year-end remain and are as applicable to the remaining six months of the financial year as they were to the six months under review. There are a number of risks stemming from the Covid-19 pandemic and the uncertainty that this has created in global markets, both economically and politically, that may impact the operation of the Company, as referenced in the Chair’s Statement. The Fund Managers will continue to review carefully the composition of the Company's portfolio and be proactive in taking investment decisions where necessary. Janus Henderson (the “Manager”) and the Company’s other third-party service providers remain fully operational and have implemented appropriate business continuity plans to ensure that there has been no change in service while the majority of staff are working from home. RELATED-PARTY TRANSACTIONS The Company’s transactions with related parties in the period under review were with the directors and the Manager. There have been no material transactions between the Company and its directors during the period other than amounts paid to them in respect of expenses and remuneration for which there were no outstanding amounts payable at the period end. In relation to the provision of services by the Manager, other than fees payable by the Company in the ordinary course of business and the facilitation of marketing activities with third parties, there have been no transactions with the Manager affecting the financial position of the Company during the period under review. STATEMENT OF DIRECTORS’ RESPONSIBILITIES The directors (as listed in note 13) confirm that, to the best of their knowledge: (a) the condensed financial statements for the half-year ended 31 March 2021 have been prepared in accordance
with FRS 104 Interim Financial Reporting, and give a true and fair view of the assets, liabilities, financial position and profit or loss of the Company;
(b) the Interim Management Report and condensed financial statements include a fair review of the information
required by Disclosure Guidance and Transparency Rule 4.2.7R (indication of important events during the first six months and description of principal risks and uncertainties for the remaining six months of the year); and
(c) the Interim Management Report includes a fair review of the information required by the Disclosure Guidance
and Transparency Rule 4.2.8R (disclosure of related-party transactions and changes therein). For and on behalf of the Board Vicky Hastings Chair 26 May 2021
Page 7 of 15

CONDENSED INCOME STATEMENT
(Unaudited)
Half-year ended
31 March 2021
(Unaudited)
Half-year ended
31 March 2020
(Audited)
Year ended
30 September 2020
Revenue return £’000
Capital return £’000
Total return £’000
Revenue return £’000
Capital return £’000
Total return £’000
Revenue return £’000
Capital return £’000
Total return £’000
Gains/(losses) on investments held at fair value through profit or loss - 40,694 40,694 - (45,235) (45,235) - 15,146 15,146 Exchange gain/(loss) on currency transactions - 9 9 - (377) (377) - (1,301) (1,301)
Income from investments (note 2) 2,723 - 2,723 1,819 - 1,819 6,864 - 6,864
Other income - - - 11 - 11 14 - 14
Gross revenue and capital gains/(losses) 2,723 40,703 43,426 1,830 (45,612) (43,782) 6,878 13,845 20,723
Management fees (note 6) (271) (813) (1,084) (226) (679) (905) (471) (1,414) (1,885)
Other fees and expenses (284) - (284) (256) - (256) (506) - (506)
Net return/(loss) before finance costs and taxation 2,168 39,890 42,058 1,348 (46,291) (44,943) 5,901 12,431 18,332
Finance costs (36) (92) (128) (47) (123) (170) (105) (285) (390)
Net return/(loss) before taxation 2,132 39,798 41,930 1,301 (46,414) (45,113) 5,796 12,146 17,942
Taxation on net return (208) - (208) (217) - (217) (612) - (612)
Net return/(loss) after taxation 1,924 39,798 41,722 1,084 (46,414) (45,330) 5,184 12,146 17,330
Return/(loss) per ordinary share (note 3) 9.00p 186.12p 195.12p 5.04p (215.90p) (210.86p) 24.13p 56.54p 80.67p
The total columns of this statement represent the Income Statement of the Company prepared in accordance with FRS 104. The revenue return and capital return columns are supplementary to this and are prepared under guidance published by the Association of Investment Companies. All revenue and capital items in the above statement derive from continuing operations. The Company had no recognised gains or losses other than those disclosed in the Income Statement and the Statement of Changes in Equity. The accompanying notes are an integral part of the condensed financial statements.
Page 8 of 15

CONDENSED STATEMENT OF CHANGES IN EQUITY
Half-year ended
31 March 2021 (Unaudited)
Called-up
share
capital
£’000
Special
distributable
reserve
£’000
Share premium account
£’000
Merger reserve
£’000
Capital redemption
reserve
£’000
Capital reserve
£’000
Revenue reserve
£’000
Total
shareholders’ funds
£’000
At 30 September 2020 10,819 25,846 41,995 61,344 9,421 148,714 10,027 308,166
Net return after taxation - - - - - 39,798 1,924 41,722
Ordinary dividend paid - - - - - - (4,640) (4,640)
Unclaimed dividends over 12 years old - - - - - - 81 81
At 31 March 2021 10,819 25,846 41,995 61,344 9,421 188,512 7,392 345,329
Half-year ended
31 March 2020 (Unaudited)
Called-up
share
capital
£’000
Special
distributable
reserve
£’000
Share premium account
£’000
Merger reserve
£’000
Capital redemption
reserve
£’000
Capital reserve
£’000
Revenue reserve
£’000
Total
shareholders’ funds
£’000
At 30 September 2019 10,819 25,846 41,995 61,344 9,421 138,013 11,572 299,010
Net (loss)/return after taxation - - - - - (46,414)
1,084 (45,330)
Ordinary dividend paid - - - - - - (4,665) (4,665)
At 31 March 2020 10,819 25,846 41,995 61,344 9,421 91,599 7,991 249,015
Year ended
30 September 2020
(Audited)
Called-up
share
capital
£’000
Special
distributable
reserve
£’000
Share premium account
£’000
Merger reserve
£’000
Capital redemption
reserve
£’000
Capital reserve
£’000
Revenue reserve
£’000
Total
shareholders’ funds
£’000
At 30 September 2019 10,819 25,846 41,995 61,344 9,421 138,013 11,572 299,010
Net return after taxation - - - - - 12,146 5,184 17,330
Buyback of ordinary shares for treasury - - - - - (1,.445) - (1,445)
Ordinary dividend paid - - - - - - (6,729) (6,729)
At 30 September 2020 10,819 25,846 41,995 61,344 9,421 148,714 10,027 308,166
The accompanying notes are an integral part of the condensed financial statements.
Page 9 of 15

CONDENSED STATEMENT OF FINANCIAL POSITION
(Unaudited)
31 March
2021
£'000
(Unaudited)
31 March
2020
£'000
(Audited)
30 September
2020
£'000
Fixed assets
Investments held at fair value through profit or loss 345,926 254,160 309,882
Current assets
Debtors 3,948 11,038 5,898
Cash at bank 55 18,174 34,345
4,003 29,212 40,243
Creditors: amounts falling due within one year (4,600) (34,357) (41,959)
Net current liabilities (597) (5,145) (1,716)
Net assets 345,329 249,015 308,166
Capital and reserves
Called-up share capital 10,819 10,819 10,819
Special distributable reserve 25,846 25,846 25,846
Share premium account 41,995 41,995 41,995
Merger reserve 61,344 61,344 61,344
Capital redemption reserve 9,421 9,421 9,421
Capital reserve 188,512 91,599 148,714
Revenue reserve 7,392 7,991 10,027
Total shareholders’ funds 345,329 249,015 308,166
Net asset value per ordinary share (note 5) 1,615.00p 1,158.30p 1,441.20p
The accompanying notes are an integral part of the condensed financial statements.
Page 10 of 15

CONDENSED CASH FLOW STATEMENT
The accompanying notes are an integral part of these financial statements
(Unaudited)
Half-year ended
31 March 2021
£'000
(Unaudited)
Half-year ended
31 March 2020
£'000
(Audited)
Year ended 30 September
2020
£'000
Cash flows from operating activities
Net return/(loss) before taxation 41,930 (45,113) 17,942
Add back: finance costs 128 170 390
(Gains)/losses on investments held at fair value through profit or loss (40,694) 45,235 (15,146)
(Gains)/losses on foreign exchange (9) 377 1,301
Taxation paid (264) (172) (802)
(Increase)/decrease in debtors (1,068) 25 (10)
(Decrease)/increase in creditors (405) (565) 338
Net cash (outflow)/inflow from operating activities (382) (43) 4,013
Cash flows from investing activities
Sales of investments held at fair value through profit or loss 194,731 116,268 261,275
Purchases of investments held at fair value through profit or loss (190,990) (114,808) (245,374)
Net cash inflow from investing activities 3,741 1,460 15,901
Cash flows from financing activities
Buyback of shares for treasury - - (1,445)
Equity dividends paid (net of refund of unclaimed distributions) (4,559) (4,665) (6,729)
(Repayment)/drawdown of bank overdraft (32,921) 10,147 12,448
Interest paid (178) (155) (349)
Net cash (outflow)/inflow from financing activities (37,658) 5,327 3,925
Net (decrease)/increase in cash and cash equivalents (34,299) 6,744 23,839
Cash and cash equivalents at beginning of period 34,345 11,807 11,807
Gains/(losses) foreign exchange 9 (377) (1,301)
Cash and cash equivalents at end of period 55 18,174 34,345
Comprising:
Cash at bank 55 18,174 34,345
Page 11 of 15

Notes to the condensed financial statements 1. Accounting policies The condensed set of financial statements has been prepared in accordance with FRS 104, Interim Financial
Reporting, FRS 102, the Financial Reporting Standard applicable in the UK and Republic of Ireland and the Statement of Recommended Practice for "Financial Statements of Investment Trust Companies and Venture Capital Trusts", which was updated by the Association of Investment Companies in October 2019. For the period under review the Company's accounting policies have not varied from those described in the Annual Report for the year ended 30 September 2020. The condensed set of financial statements has been neither audited nor reviewed by the Company's auditor.
2. Income from investments
(Unaudited) Half-year ended
31 March 2021
£’000
(Unaudited) Half-year ended
31 March 2020 £’000
(Audited)
Year ended 30 September
2020 £’000
Listed investments:
Overseas dividends 2,723 1,712 6,730
UK dividends - 107 134
2,723 1,819 6,864
3. Return/(loss) per ordinary share (Unaudited)
Half-year ended 31 March 2021
£’000
(Unaudited) Half-year ended 31 March 2020
£’000
(Audited) Year ended
30 September 2020 £’000
The return per ordinary share is based on the following figures:
Net revenue return 1,924 1,084 5,184
Net capital return/(loss) 39,798 (46,414) 12,146
Net total return/(loss) 41,722 (45,330) 17,330
Weighted average number of ordinary shares in issue for each period 21,382,578 21,498,261 21,480,288
Revenue return per ordinary share 9.00p 5.04p 24.13p
Capital return/(loss) per ordinary share 186.12p (215.90)p 56.54p
Total return/(loss) per ordinary share 195.12p (210.86)p 80.67p
The Company has no securities in issue that could dilute the return per ordinary share. Therefore, the basic and diluted returns per share are the same.
4. Called-up share capital At 31 March 2021, there were 21,638,991 shares in issue, of which 256,413 were held in treasury. During the
half-year period ended 31 March 2021, no shares were issued or repurchased (half-year ended 31 March 2020: no shares issued or repurchased, year ended 30 September 2020: 115,683 shares repurchased at a cost of £1,445,000). No shares have been issued or repurchased since 31 March 2021. As at 26 May 2021, 21,382,578 shares were entitled to a dividend.
5. Net asset value per ordinary share – basic and diluted The net asset value per ordinary share is based on the 21,382,578 ordinary shares in issue (excluding treasury
shares) at 31 March 2021 (half-year ended 31 March 2020: 21,498,261, year ended 30 September 2020: 21,382,578).
6. Management fees Henderson Investment Funds Limited (“HIFL”) is appointed to act as the Company’s alternative investment
fund manager. HIFL delegates investment management services to Henderson Global Investors Limited (“HGIL”). References to Janus Henderson or the Manager within these results refer to the services provided by both HIFL and HGIL.
Page 12 of 15
Management fees are charged in accordance with the terms of the management agreement. The Manager receives a fee of 0.65% per annum of net assets up to £300m and 0.55% of net assets above £300m. Any holdings in funds managed by Janus Henderson are excluded from the calculation of the management fee. There is no performance fee. Management fees and finance costs are allocated 25% to revenue and 75% to capital in the Condensed Income Statement.
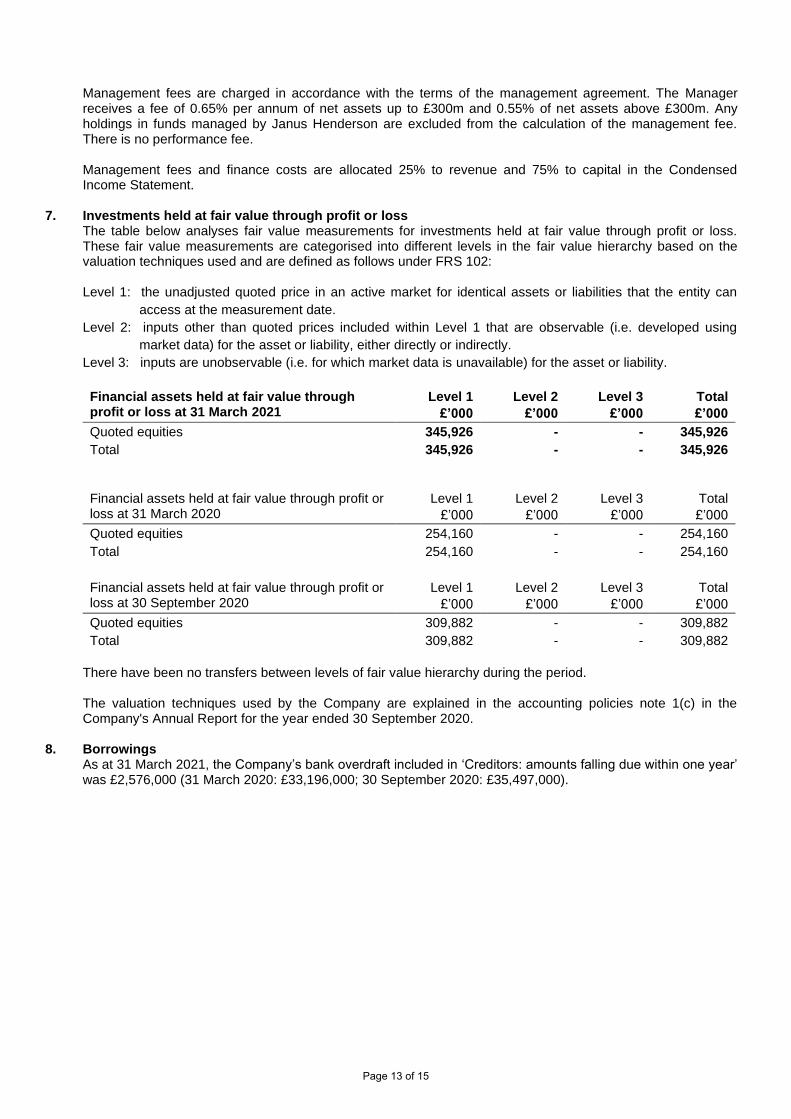
7. Investments held at fair value through profit or loss The table below analyses fair value measurements for investments held at fair value through profit or loss.
These fair value measurements are categorised into different levels in the fair value hierarchy based on the valuation techniques used and are defined as follows under FRS 102: Level 1: the unadjusted quoted price in an active market for identical assets or liabilities that the entity can
access at the measurement date.
Level 2: inputs other than quoted prices included within Level 1 that are observable (i.e. developed using
market data) for the asset or liability, either directly or indirectly.
Level 3: inputs are unobservable (i.e. for which market data is unavailable) for the asset or liability.
Financial assets held at fair value through profit or loss at 31 March 2021
Level 1
£’000
Level 2
£’000
Level 3
£’000
Total
£’000
Quoted equities 345,926 - - 345,926
Total 345,926 - - 345,926
Financial assets held at fair value through profit or loss at 31 March 2020
Level 1
£’000
Level 2
£’000
Level 3
£’000
Total
£’000
Quoted equities 254,160 - - 254,160
Total 254,160 - - 254,160
Financial assets held at fair value through profit or loss at 30 September 2020
Level 1
£’000
Level 2
£’000
Level 3
£’000
Total
£’000
Quoted equities 309,882 - - 309,882
Total 309,882 - - 309,882
There have been no transfers between levels of fair value hierarchy during the period.
The valuation techniques used by the Company are explained in the accounting policies note 1(c) in the Company's Annual Report for the year ended 30 September 2020.
8. Borrowings As at 31 March 2021, the Company’s bank overdraft included in ‘Creditors: amounts falling due within one year’
was £2,576,000 (31 March 2020: £33,196,000; 30 September 2020: £35,497,000).
Page 13 of 15
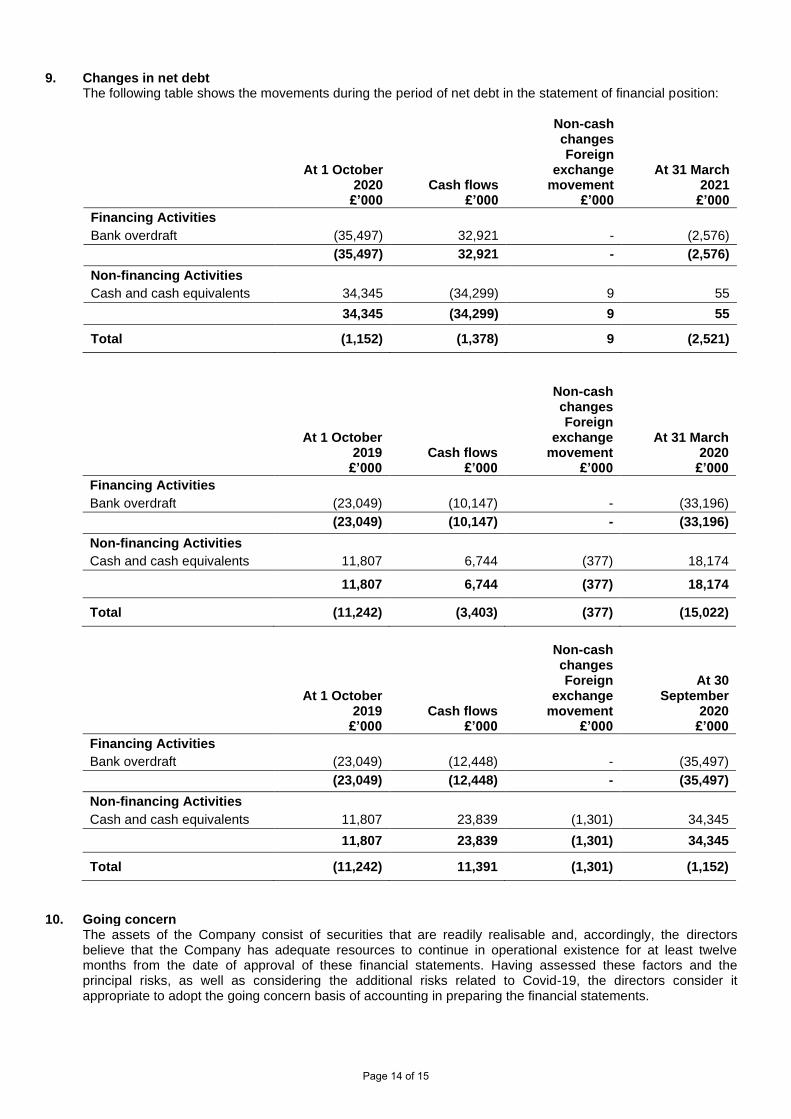
9. Changes in net debt The following table shows the movements during the period of net debt in the statement of financial position:
At 1 October 2020
£’000 Cash flows
£’000
Non-cash changes Foreign
exchange movement
£’000
At 31 March 2021
£’000
Financing Activities
Bank overdraft (35,497) 32,921 - (2,576)
(35,497) 32,921 - (2,576)
Non-financing Activities
Cash and cash equivalents 34,345 (34,299) 9 55
34,345 (34,299) 9 55
Total (1,152) (1,378) 9 (2,521)
At 1 October 2019
£’000 Cash flows
£’000
Non-cash changes Foreign
exchange movement
£’000
At 31 March 2020
£’000
Financing Activities
Bank overdraft (23,049) (10,147) - (33,196)
(23,049) (10,147) - (33,196)
Non-financing Activities
Cash and cash equivalents 11,807 6,744 (377) 18,174
11,807 6,744 (377) 18,174
Total (11,242) (3,403) (377) (15,022)
At 1 October 2019
£’000 Cash flows
£’000
Non-cash changes Foreign
exchange movement
£’000
At 30 September
2020 £’000
Financing Activities
Bank overdraft (23,049) (12,448) - (35,497)
(23,049) (12,448) - (35,497)
Non-financing Activities
Cash and cash equivalents 11,807 23,839 (1,301) 34,345
11,807 23,839 (1,301) 34,345
Total (11,242) 11,391 (1,301) (1,152)
10. Going concern The assets of the Company consist of securities that are readily realisable and, accordingly, the directors
believe that the Company has adequate resources to continue in operational existence for at least twelve months from the date of approval of these financial statements. Having assessed these factors and the principal risks, as well as considering the additional risks related to Covid-19, the directors consider it appropriate to adopt the going concern basis of accounting in preparing the financial statements.
Page 14 of 15

11. Dividends The directors have declared an interim dividend of 9.60p per ordinary share (2020: 9.60p), payable on 25 June
2021 to shareholders on the register on 4 June 2021. The shares will be quoted ex-dividend on 3 June 2021. Based on the 21,382,578 ordinary shares in issue (excluding treasury shares) as at 26 May 2021, the cost of this dividend will be £2,053,000 (2020 interim dividend: £2,064,000).
12. Comparative information The financial information contained in this half-year report does not constitute statutory accounts as defined in
section 434 of the Companies Act 2006. The financial information for the half-years ended 31 March 2021 and 31 March 2020 has not been audited or reviewed by the Company's auditor. The figures and financial information for the year ended 30 September 2020 are an extract based on the latest published accounts and do not constitute statutory accounts for that year. Those accounts have been delivered to the Registrar of Companies and included the Independent Auditor’s Report which was unqualified and did not contain a statement under either s498(2) or s498(3) Companies Act 2006. A glossary of terms and details of alternative performance measures can be found in the Annual Report for the year ended 30 September 2020.
13. General information Company status
Henderson European Focus Trust plc is registered in England and Wales (no. 00427958), has its registered office at 201 Bishopsgate, London EC2M 3AE and is listed on the London Stock Exchange. SEDOL/ISIN: 0526885/GB0005268858 London Stock Exchange (“TIDM”) code: HEFT Global Intermediary Identification Number (“GIIN”): THMNPN.99999.SL.826 Legal Entity Identifier (“LEI”) number: 213800GS89AL1DK3IN50
Directors and secretary The directors of the Company are Vicky Hastings (Chair), Eliza Dungworth (Chair of the Audit and Risk Committee) and Robin Archibald (Senior Independent Director). The corporate secretary is Henderson Secretarial Services Limited.
Website Details of the Company’s share price and net asset value, together with general information about the Company, monthly factsheets and data, copies of announcements, reports and details of general meetings can be found at www.hendersoneuropeanfocus.com.
14. Half-year report The half-year report will shortly be available on the Company’s website or from the Company’s registered
office. An abbreviated version, the 'Update', will be posted to shareholders in June 2021. The Update will also be posted on the Company’s website, and hard copies will be available from the Company's registered office.
Page 15 of 15