henderson, david james (2010) response of pierced fixed
TRANSCRIPT
This file is part of the following reference:
Henderson, David James (2010) Response of pierced fixed metal roof cladding to fluctuating wind loads.
PhD thesis, James Cook University.
Access to this file is available from:
http://eprints.jcu.edu.au/12173
8. References
Ali, H. M., and Senseny, P. E. (2003). "Models for standing seam roofs." Journal of Wind Engineering and Industrial Aerodynamics, 91(12-15), 1689-1702.
Amzallag, C., Gerey, J. P., Robert, J. L., and Bahuaud, J. (1994). "Standardization of the Rainflow Counting Method for Fatigue Analysis." International Journal of Fatigue, 16(4), 287-293.
Baskaran, A., and Chen, Y. (1998). "Wind load cycle development for evaluating mechanically attached single-ply roofs." Journal of Wind Engineering and Industrial Aerodynamics, 77-8, 83-96.
BCA. (2006). "Building Code of Australia." A. B. C. Board, ed., ABCB. BCA. (2007). "Building Code of Australia." A. B. C. Board, ed., ABCB, Canberra. Beaumont, M. (2009). "Engineering the windstorm risks - Impacts on frequency and
severity." Beyond PML: Frequency vs. Severity, Aon Benfield Australia Limited, Sydney.
Beck, V. (1975). "Appraisal of roof cladding under dynamic wind loading – Cyclone Tracy Darwin 1974: Appendix 4." Report on Cyclone Tracy – Effect on buildings – Dec 1974, G. Walker, ed., Australian Dept of Housing and Construction.
Beck, V., and Stevens, L. (1979). "Wind loading failures of corrugated roof cladding." Civil Engineering Transactions, I.E. Aust.
BHP. (1992). "The making of iron and steel, 7th ed." BHP Steel Group, Melbourne Vic, Australia.
Birnbaum, Z. W., and Saunders, S. C. (1968). "A Probabilistic Interpretation of Miner's Rule." SIAM Journal on Applied Mathematics, 16(3), 637-652.
Boughton, G. (1988). "Relationship between overload and load factors in cyclic testing of light gauge metal components." Workshop on review of TR440, NBTC.
Broberg, K. B. (1995). "Critical review of some methods in nonlinear fracture mechanics." Engineering Fracture Mechanics, 50(2), 157-164.
Capitano, C. (1987). "Fatigue characteristics of wind loading on low-rise buildings," James Cook University of North Queensland, Townsville.
Cheung, J. C. K., Holmes, J. D., Melbourne, W. H., Lakshmanan, N., and Bowditch, P. (1997). "Pressures on a 1/10 scale model of the Texas Tech Building." Journal of Wind Engineering and Industrial Aerodynamics, p 529-538, , Progress in Bluff Body Aerodynamics, 69-71.
Cochran, L. S., and Cermak, J. E. (1992). "Full- and model-scale cladding pressures on the Texas Tech University experiemental building." Journal of Wind Engineering and Industrial Aerodynamics, 43, 11.
Cook, N. (1990). The designer’s guide to wind loading of building structures, Part 2 Static structures, BRE, England.
Cook, N., Keevil, A., and Stobart, R. (1988). "BRERWULF – The big bad wolf " Journal of Wind Engineering and Industrial Aerodynamics, 29, 109-118.
Davenport, A. G. (1961). "The application of statistical concepts to the wind loading of structures." Proc. Institution of Civil Engineers, 449-472.
Gilbertson, L. G., Doehring, T. C., Livesay, G. A., Rudy, T. W., Kang, J. D., and Woo, S. L. Y. (1999). "Improvement of Accuracy in a High-Capacity, Six Degree-of-freedom Load Cell: Application to Robotic Testing of Musculoskeletal Joints." Annals of Biomedical Engineering, 27(6), 839-843.
Page 164 of 207
Ginger, J. D. (2001). "Characteristics of wind loads on roof cladding and fixings." Wind and Structures, 4(1), 73-84.
Ginger, J. D., and Henderson, D. J. (2003). "Wind loads on roof cladding and fixings." 10th Australian Wind Engineering Workshop, Sydney.
Ginger, J. D., Henderson, D. J., Leitch, C. J., and Boughton, G. N. (2007). "Tropical Cyclone Larry: Estimation of wind field and assessment of building damage." Australian Journal of Structural Engineering, 7(3), 209-224.
Ginger, J. D., Holmes, J. D., and Kopp, G. A. (2008). "Effect of building volume and opening size on fluctuating internal pressure." Wind and Structures, 11(5), 15.
Halpern_Glick_Pty_Ltd. (1975). "Investigation of the Performance of Larger Buildings During Cyclone Tracy: Appendix 2." Report on Cyclone Tracy – Effect on buildings – Dec 1974, G. Walker, ed., Australian Dept of Housing and Construction.
Harper, B. (2009). "SEA wind field model output for Cyclone Tracy." p. communication, ed., Townsville.
Harper, B. A. (2010). "Modelling the Tracy storm surge – implications for storm structure and intensity estimation." Australian Meteorological and Oceanographic Journal, Submitted.
Harper, B. A., and Holland, G. J. (1999). "An updated parametric model of the tropical cyclone." Proc. 23rd Conf. Hurricanes and Tropical Meteorology, American Meteorological Society, Dallas, Texas.
Harper, B. A., Kepert, J. D., and Ginger, J. D. (2008). "Guidelines for converting between various wind averaging periods in tropical cyclone conditions." World Meteorological Organization.
Henderson, D. J. (2006). "Roof components subjected to cyclonic wind loading." International wind loading workshop - Course notes, Cyclone Testing Station, JCU, Townsville.
Henderson, D. J., Ginger, J., Leitch, C., Boughton, G., and Falck, D. (2006). "Tropical Cyclone Larry – Damage to buildings in the Innisfail area." TR51, James Cook University, Townsville.
Henderson, D. J., and Ginger, J. D. (2005). "Fatigue failure of roof components subjected to wind loading." Australian Structural Engineering Conference, Newcastle.
Henderson, D. J., and Ginger, J. D. (2007). "Vulnerability model of an Australian high-set house subjected to cyclonic wind loading." Wind and Structures, 10(3), 16.
Henderson, D. J., and Ginger, J. D. (2008). "Role of building codes and construction standards in windstorm disaster mitigation." Australian Journal of Emergency Management, 23(2), 7.
Henderson, D. J., and Harper, B. (2003). "Development of a Cyclone Wind Damage Model for use in Cairns, Townsville and Mackay." Queensland Government, Brisbane.
Henderson, D. J., Reardon, G. F., and Ginger, J. D. (2001). "Performance of light gauge metal roof cladding subjected to cyclonic wind loading." 9th Australian Wind Engineering Workshop, Townsville.
Hibbitt, Karlsson, and Sorensen. (2000). ABAQUS User's manual, HKS Inc, USA. Ho, T. C. E., Davenport, A. G., and Surry, D. (1995). "Characteristic pressure distribution
shapes and load repetitions for the wind loading of low building roof panels." Journal of Wind Engineering and Industrial Aerodynamics, 57(2-3), 261-279.
Ho, T. C. E., and Surry, D. (2000). "Factory Mutual - High resolution pressure measurements on roof panels." BLWTL-SS11-2000, UWO, London, Ontario.
Page 165 of 207
Ho, T. C. E., Surry, D., Morish, D., and Kopp, G. A. (2005). "The UWO contribution to the NIST aerodynamic database for wind loads on low buildings: Part 1. Archiving format and basic aerodynamic data." J. Wind Eng Ind. Aerodyn, 93, 30.
Holmes, J. D. (2002). "Fatigue life under along-wind loading - closed-form solutions." Engineering Structures, 24(1), 109-114.
Holmes, J. D. (2007). Wind loading of structures, Taylor & Francis, London. Hussain, K. (1997). "Short fatigue crack behaviour and analytical models: A review."
Engineering Fracture Mechanics, 58(4), 327-354. Jancauskas, E. D., Mahendran, M., and Walker, G. R. (1994). "Computer-Simulation of
the Fatigue Behaviour of Roof Cladding During the Passage of a Tropical Cyclone." Journal of Wind Engineering and Industrial Aerodynamics, 51(2), 215-227.
Kopp, G. A., Morrison, M. J., Iizumi, E., Henderson, D., and Hong, H. P. (2010). "The ‘Three Little Pigs’ Project: Hurricane Risk Mitigation by Integrated Wind Tunnel and Full-Scale Laboratory Tests." ASCE Natural Hazards Review, Accepted for publication 2010.
Kopp, G. A., Oh, J. H., and Inculet, D. R. (2008). "Wind-induced internal pressures in houses." Journal of Structural Engineering-ASCE, 134(7), 1129-1138.
Kumar, K. S. (2000). "Prediction of wind-induced fatigue on claddings of low buildings." Computers & Structures, 75(1), 31-44.
Kumar, K. S., and Stathopoulos, T. (1998). "Fatigue analysis of roof cladding under simulated wind loading." Journal of Wind Engineering and Industrial Aerodynamics, 77-8, 171-183.
Leicester, R. L., and Reardon, G. F. (1976). "A statistical analysis of the structural damage by Cyclone Tracy." Civil Engineering Transactions, I. E. Aust, 18(2), 4.
Leitch, C. J., Ginger, J. D., and Henderson, D. J. (2007). "Vulnerability of metal-clad sheds in cyclonic regions." 12 Int. Conf. Wind Engineering, Cairns, Australia.
Li, W. Z., and Siegmund, T. (2002). "An analysis of crack growth in thin-sheet metal via a cohesive zone model." Engineering Fracture Mechanics, 69(18), 2073-2093.
Madayag, A. (1969). Metal Fatigue: Theory and design, Wiley & Sons, New York. Mahaarachchi, D. (2003). "Behaviour and design of steel cladding systems subject to pull-
through failures," Queensland University of Technology, Brisbane. Mahaarachchi, D., and Mahendran, M. (2004). "Finite element analysis and design of
crest-fixed trapezoidal steel claddings with wide pans subject to pull-through failures." Engineering Structures, 26(11), 1547-1559.
Mahendran, M. (1989). "Fatigue behaviour of corrugated roofing under cyclic wind loading." TR 35, Cyclone Testing Station, JCU.
Mahendran, M. (1990). "Fatigue behaviour of corrugated roofing under cyclic wind loading." Civil Engineering Transactions, I. E. Aust.
Mahendran, M. (1993). "Simulation of Cyclonic Wind Forces on Roof Claddings by Random Block Load Testing." TR 38, Cyclone Testing Station, JCU, Townsville.
Mahendran, M. (1994). "Behaviour and Design of Crest-Fixed Profiled Steel Roof Claddings under Wind Uplift." Engineering Structures, 16(5), 368-376.
Mahendran, M. (1995). "Towards an Appropriate Fatigue Loading Sequence for Roof Claddings in Cyclone Prone Areas." Engineering Structures, 17(7), 476-484.
Mahendran, M., and Mahaarachchi, D. (2004). "Splitting failures in trapezoidal steel roof cladding." Journal of Performance of Constructed Facilities, 18(1), 4-11.
Melbourne, W. (1977). "Loading cycles for simulation of wind loading." Experimental Building Station Workshop.
Page 166 of 207
Morgan, J., and Beck, V. (1977). "Failure of sheet metal roofing under repeated wind loading." Civil Engineering Transactions, I. E. Aust.
Morrison, M., and Kopp, G. (2010). "Analysis of Wind-Induced Clip Loads on Standing Seam Metal Roofs." Journal of Structural Engineering, 136(3).
Oh, J.-H., Kopp, G. A., and Inculet, D. R. (2007). "The UWO contribution to the NIST aerodynamic database for wind loads on low buildings: Part 3. Internal pressures." J. Wind Eng Ind. Aerodyn, 95, 24.
Parsons, A. (1976). "Practical Development from static and cyclic load testing of steel claddings." Metal structures conference.
Pielke, R. A., Jr., and Pielke, R. A., Sr. (1997). Hurricanes : their nature and impacts on society, Wiley, New York.
Reardon, G., Henderson, D., and Ginger, J. (1999). "A structural assessment of the effects of Cyclone Vance on houses in Exmouth WA." TR48, James Cook University, Townsville.
Rogers, C. A., and Hancock, G. J. (1997). "Ductility of G550 sheet steels in tension." Journal of Structural Engineering-Asce, 123(12), 1586-1594.
Rogers, C. A., and Hancock, G. J. (2001). "Fracture toughness of G550 sheet steels subjected to tension." Journal of Constructional Steel Research, 57(1), 71-89.
Rooke, D. P., and Cartwright, D. J. (1976). Compendium of stress intensity factors, Ministry of Defence, London, UK.
Schafer, B. W., and Pekoz, T. (1998). "Computational modelling of cold-formed steel: characterizing geometric imperfections and residual stresses." Journal of Constructional Steel Research, 47(3), 193-210.
Schroeder, J., Edwards, B., and Giammanco, I. (2009). "Observed tropical cyclone wind flow characteristics." Wind and Structures, 12(4), 349.
SEA. (2005). "Darwin TCWC Northern Region Storm Tide Prediction System - System Development Technical Report." Systems Engineering Australia, Brisbane.
SEA. (2006). "Darwin Storm Tide Mapping Study 2006." Systems Engineering Australia Pty Ltd.
Seccombe, C., Carne, S., and Martin, B. (1996). "Improvements in system evaluation under static and cyclic wind loads." 1996 National Engineering Conference, I.E. Aust., Darwin.
Singh, H. (2008). "Fatigue failure of high strength steel sheet," B. Eng, JCU, Townsville. Sinno, R. R., Surry, D., Fowler, S., and Ho, T. C. E. (2003). "Testing of metal roofing
systems under simulated realistic wind Loads." 11th International conference on wind engineering, Texas Tech University, Texas, 1065-1072.
Smith, R. N. L. (1991). Basic fracture mechanics, Butterworth-Heinemenn, Oxford. St. Pierre, L. M., Kopp, G. A., Surry, D., and Ho, T. C. E. (2005). "The UWO contribution
to the NIST aerodynamic database for wind loads on low buildings: Part 2. Comparison of data with wind load provisions." J. Wind Eng Ind. Aerodyn, 93, 28.
Standards-Australia. (1992). "AS1562.1 Design and installation of sheet roof and wall cladding Part1:Metal." Standards Australia, Sydney, NSW.
Standards-Australia. (1993). "AS1397 Steel sheet and strip: Hot-dipped zinc-coated or aluminium/zinc coated." Standards Australia, Sydney, NSW.
Standards-Australia. (2002a). "AS/NZS1170.0:2002 Structural design actions Part 0: General principles." Standards Australia, Sydney, NSW.
Standards-Australia. (2002b). "AS/NZS1170.2:2002 Structural design actions Part 2: Wind actions." AS/NZS1170.2:2002, Standards Australia, Sydney NSW, Australia.
Page 167 of 207
Standards-Australia. (2005). "AS1391 Metallic materials: Tensile testing at ambient temperature." Standards Australia, Sydney, NSW.
Standards-Australia. (2006). "AS4055 Wind Loads for Housing." Standards Australia, Sydney, NSW.
Stramit. (2006). "Stramit Corrugated: Roof and Wall cladding." Stramit Building Products, Sydney.
Surry, D., Ho, T. C. E., and Lythe, G. R. (1999). "Simulation requirements for roof wind loads near the corners of low buildings with low-slope roofs." ASCE Structures Congress, ASCE, New Orleans.
Surry, D., Sinno, R. R., Nail, B., Ho, T. C. E., Farquhar, S., and Kopp, G. A. (2007). "Structurally effective static wind loads for roof panels." Journal of Structural Engineering-Asce, 133(6), 871-885.
Tada, T., Paris, P., and Irwin, G. (2000). The stress analysis of cracks handbook, Professional Engineering Publishing Limited, London.
TR440. (1978). "Guidelines for the testing and evaluation of products for cyclone-prone areas." TR440, Experimental Building Station, Dept of Construction.
Trewin, B. (2006). "Improvements to the Australian tropical cyclone data set." 7th Australain Tropical Cyclone Coastal Impacts Program Workshop, Bureau of Meteorology, Cairns.
Walker, G. (1975). "Report on Cyclone Tracy – Effect on buildings – Dec 1974." Australian Dept of Housing and Construction.
Walker, G. (2009). "Comparison of the Impacts of Cyclone Tracy and the Newcastle Earthquake on the Australian Building and Insurance Industries." Australian Earthquake Engineering Conference, Australian Earthquake Engineering Society, Newcastle.
Xu, Y. (1992). "Behaviour of different profiled roofing sheets subject to wind uplift." TR 37, Cyclone Testing Station, JCU, Townsville.
Xu, Y. (1993). "Wind Induced Fatigue Loading on Roof Cladding of Low-Rise Buildings." TR41, James Cook University, Townsville.
Xu, Y. L. (1995a). "Determination of Wind-Induced Fatigue Loading on Roof Cladding." Journal of Engineering Mechanics-ASCE, 121(9), 956-963.
Xu, Y. L. (1995b). "Fatigue Performance of Screw-Fastened Light-Gauge-Steel Roofing Sheets." Journal of Structural Engineering-ASCE, 121(3), 389-398.
Xu, Y. L. (1997). "Fatigue damage estimation of metal roof cladding subject to wind loading." Journal of Wind Engineering and Industrial Aerodynamics, 72(1-3), 379-388.
Xu, Y. L., and Reardon, G. F. (1993). "Test of Screw Fastened Profiled Roofing Sheets Subject to Simulated Wind Uplift." Engineering Structures, 15(6), 423-430.
Xu, Y. L., and Reardon, G. F. (1998). "Variations of wind pressure on hip roofs with roof pitch." Journal of Wind Engineering and Industrial Aerodynamics, 73, 17.
Xu, Y. L., Reardon, G. F., Mahlberg, J. L., and Henderson, D. J. (1996). "Comparison of wind pressure and fatigue damage to hip and gable roof claddings." TR43, James Cook University, Townsville.
Xu, Y. L., and Teng, J. G. (1994). "Local Plastic Failure of Light Gauge Steel Roofing Sheets - Finite-Element Analysis Versus Experiment." Journal of Constructional Steel Research, 30(2), 125-150.
Page 168 of 207
Page 169 of 207
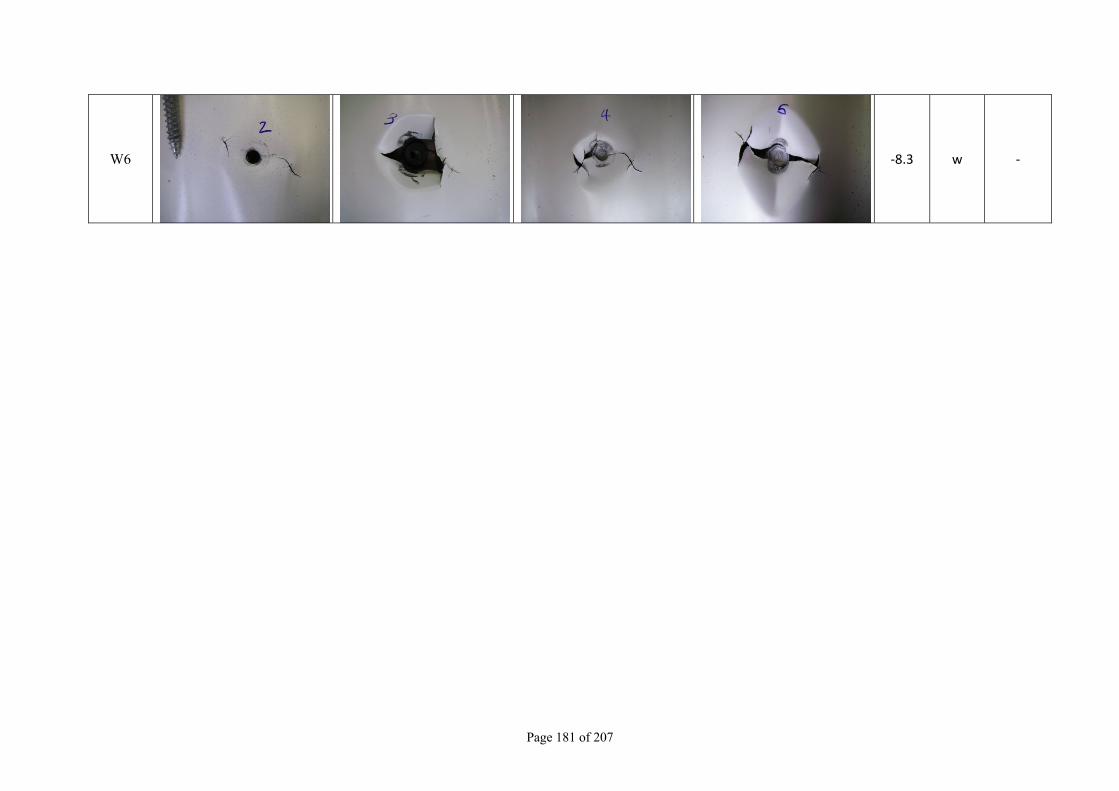
Appendix A. Air-chamber trials
Figures show the cracking and deformation of cladding adjacent to the fixings at the completion of
the cyclic and simulated wind trials. For the cyclic trials the order is not chronological but is in
increasing magnitude of Pmin and then R. Note that the variation in colour of the cladding is due to
the varying light levels (e.g., flash, ambient light, or fluorescent lighting).
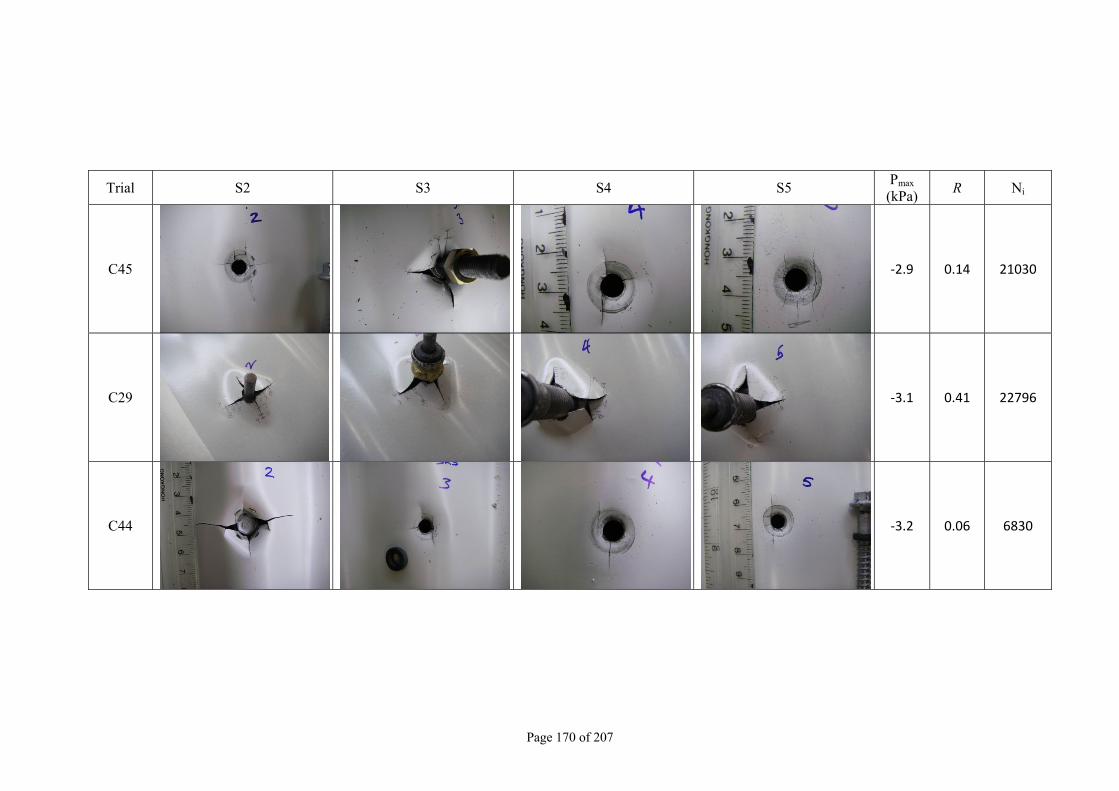
Trial S2 S3 S4 S5 Pmax
(kPa) R Ni
C45 ‐2.9 0.14 21030
C29 ‐3.1 0.41 22796
C44 ‐3.2 0.06 6830
Page 170 of 207
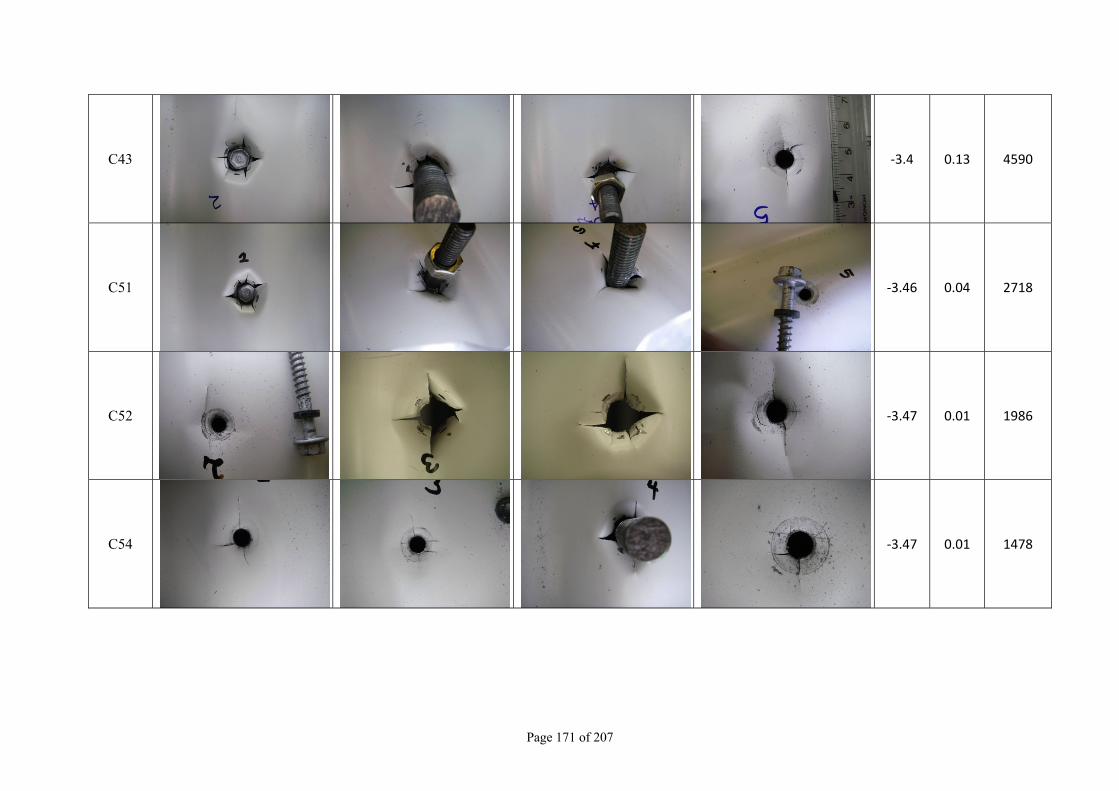
C43 ‐3.4 0.13 4590
C51 ‐3.46 0.04 2718
C52 ‐3.47 0.01 1986
C54 ‐3.47 0.01 1478
Page 171 of 207
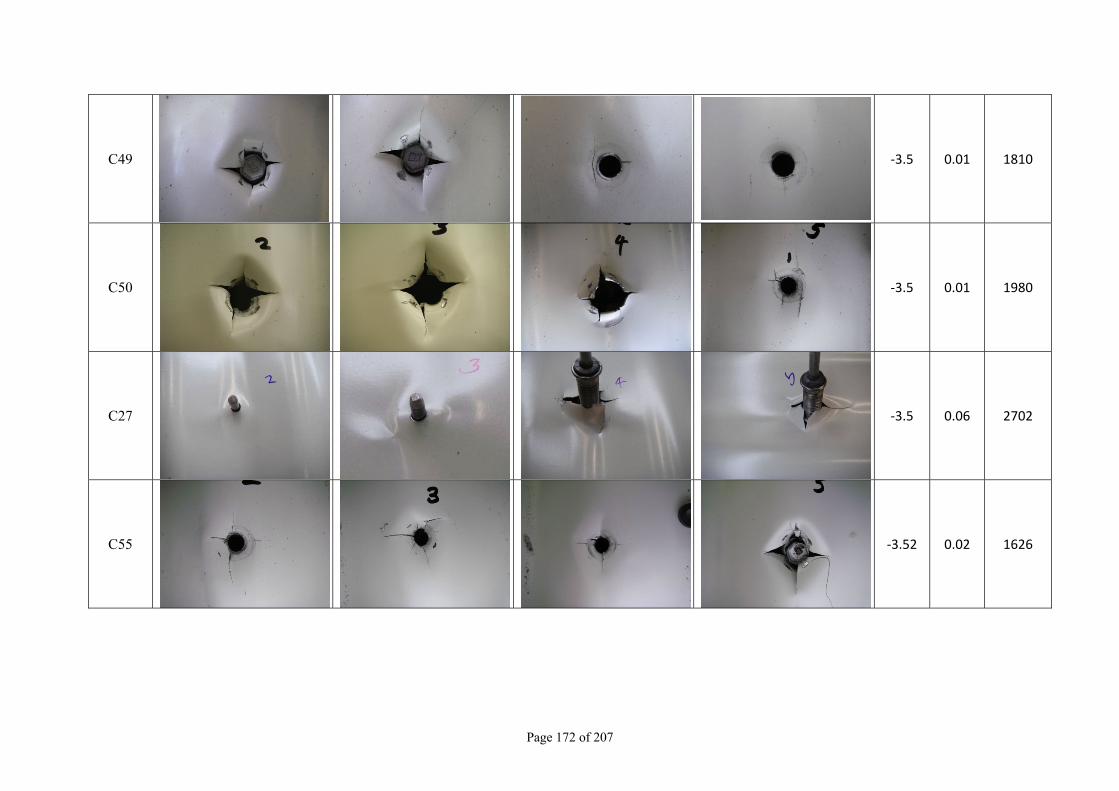
C49 ‐3.5 0.01 1810
C50 ‐3.5 0.01 1980
C27 ‐3.5 0.06 2702
C55 ‐3.52 0.02 1626
Page 172 of 207
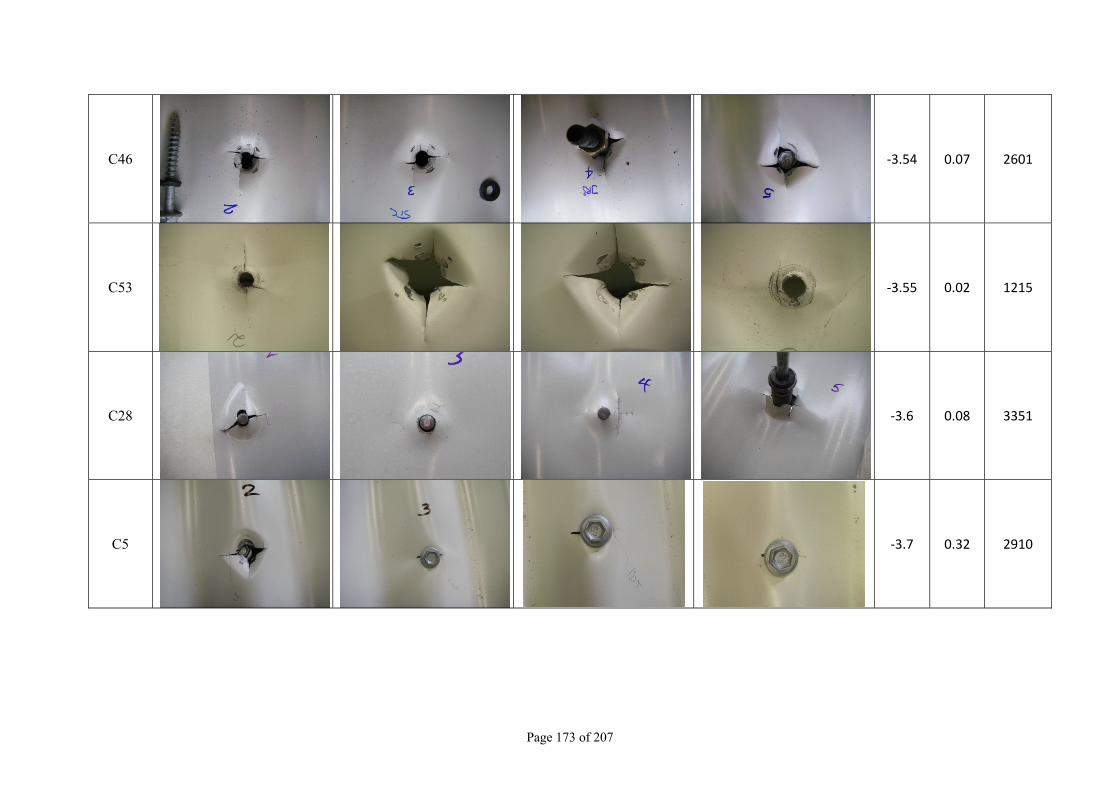
C46 ‐3.54 0.07 2601
C53 ‐3.55 0.02 1215
C28 ‐3.6 0.08 3351
C5
‐3.7 0.32 2910
Page 173 of 207
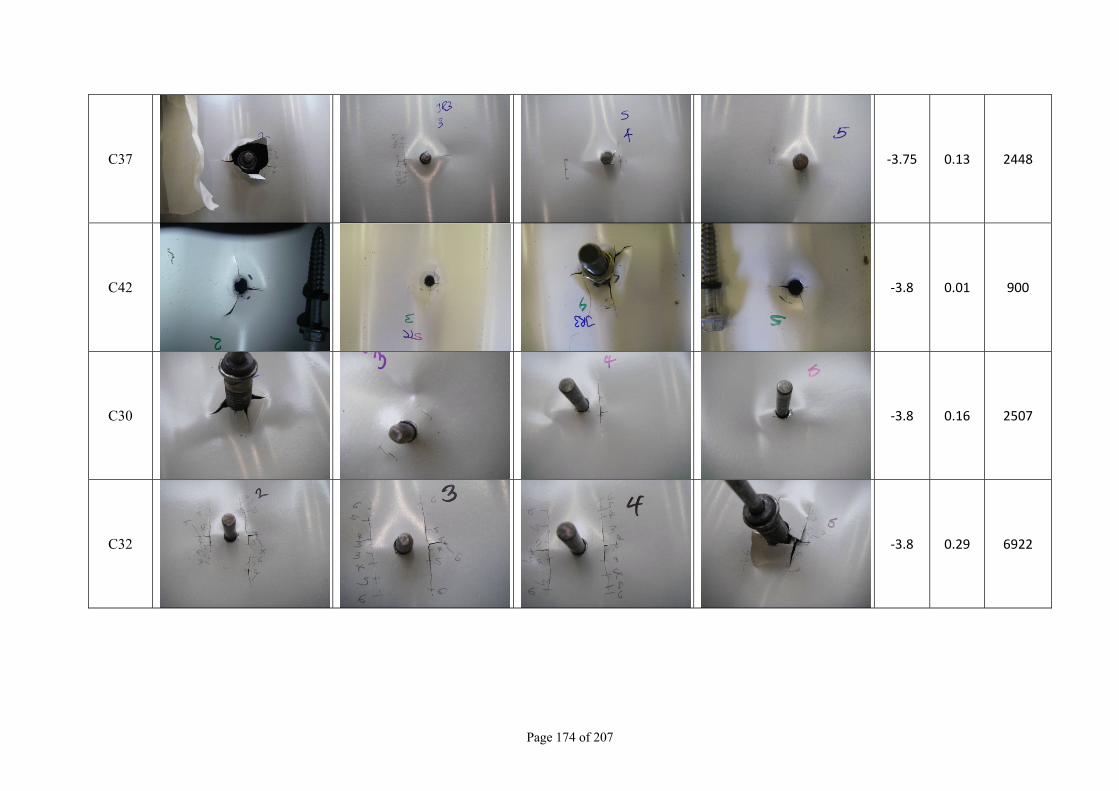
C37 ‐3.75 0.13 2448
C42 ‐3.8 0.01 900
C30 ‐3.8 0.16 2507
C32 ‐3.8 0.29 6922
Page 174 of 207
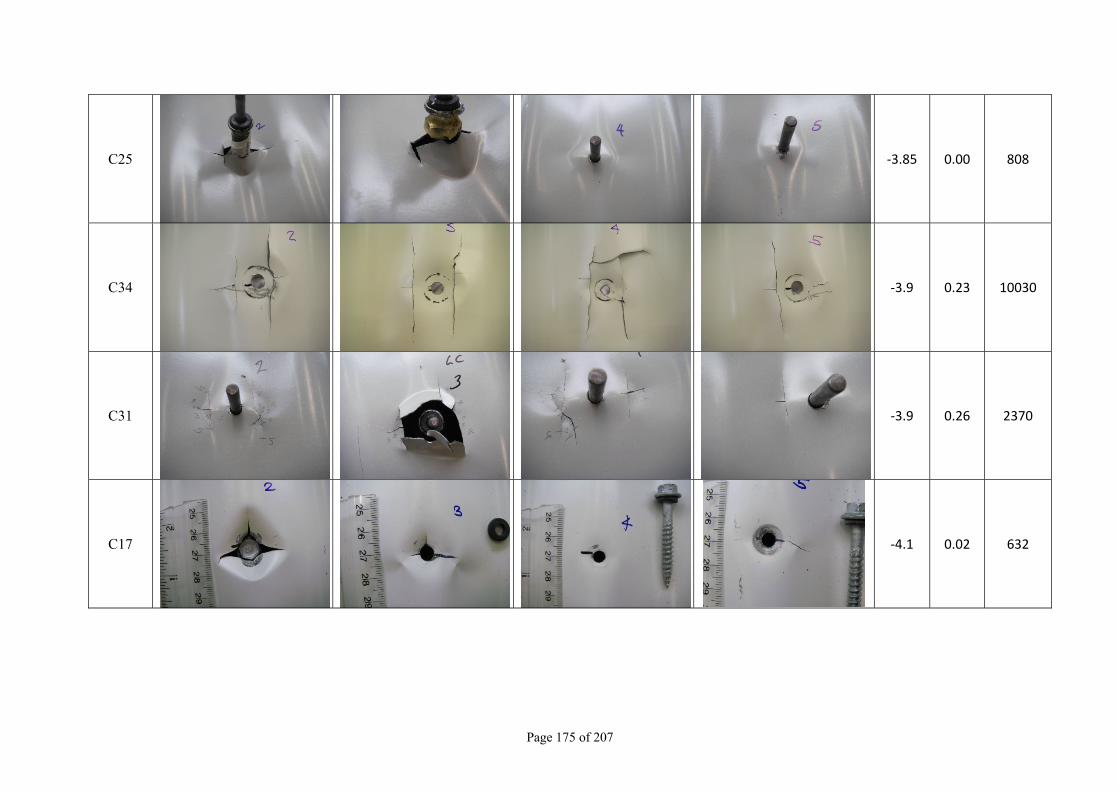
C25 ‐3.85 0.00 808
C34 ‐3.9 0.23 10030
C31 ‐3.9 0.26 2370
C17
‐4.1 0.02 632
Page 175 of 207
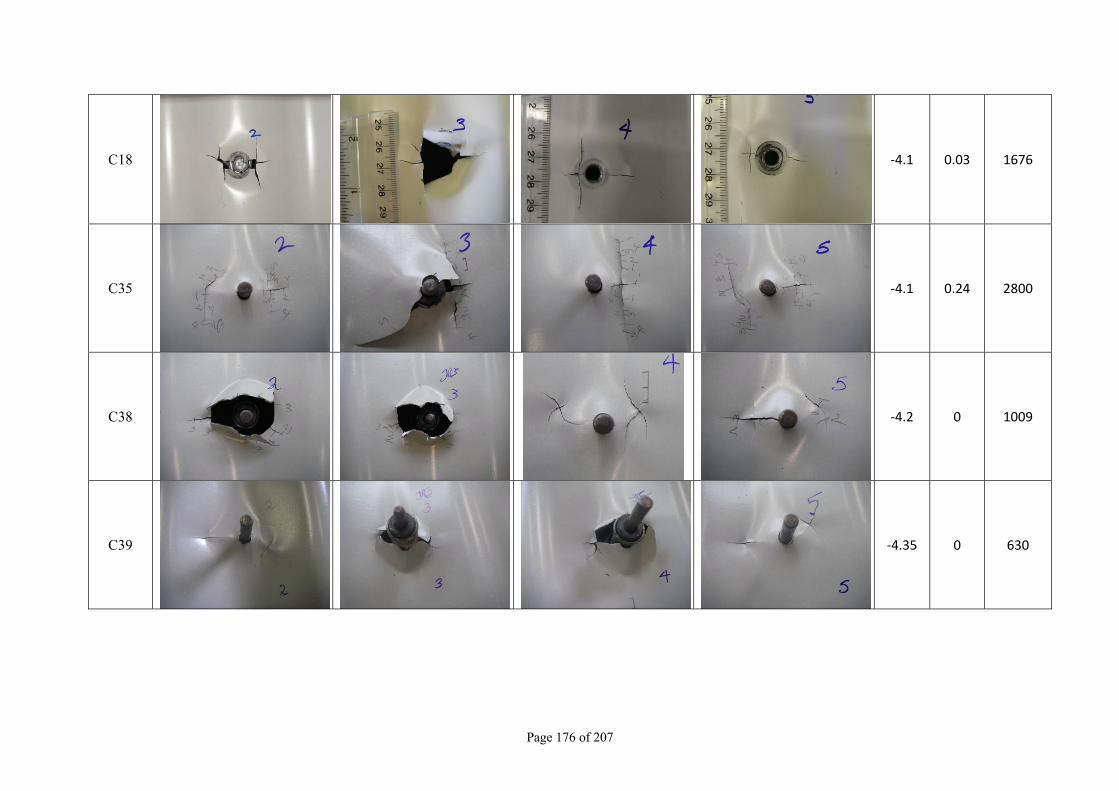
C18 ‐4.1 0.03 1676
C35 ‐4.1 0.24 2800
C38
‐4.2 0 1009
C39 ‐4.35 0 630
Page 176 of 207
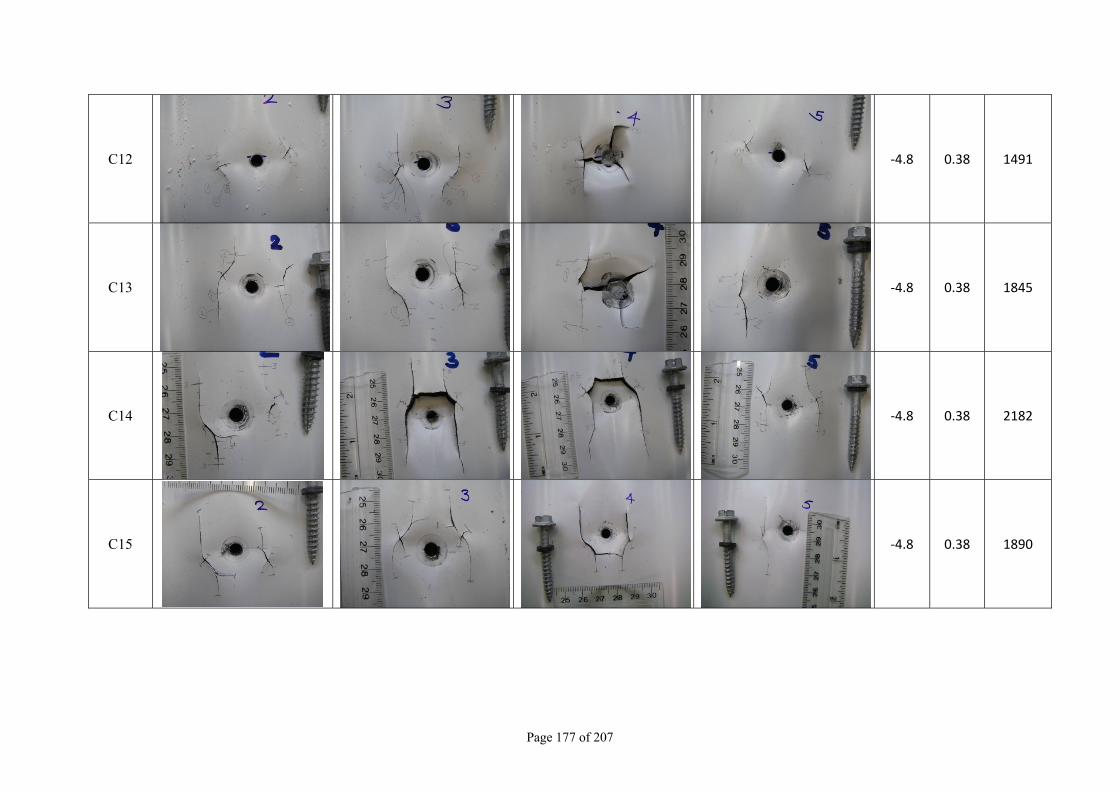
C12 ‐4.8 0.38 1491
C13 ‐4.8 0.38 1845
C14
‐4.8 0.38 2182
C15
‐4.8 0.38 1890
Page 177 of 207
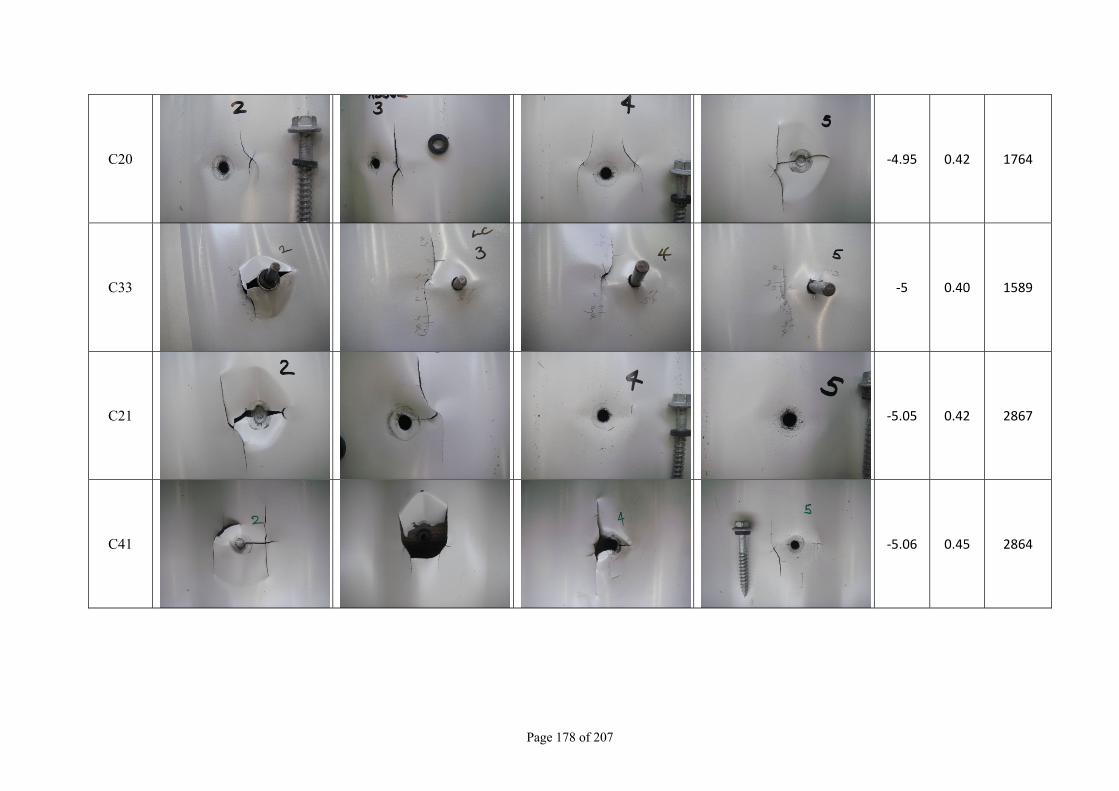
C20 ‐4.95 0.42 1764
C33 ‐5 0.40 1589
C21 ‐5.05 0.42 2867
C41 ‐5.06 0.45 2864
Page 178 of 207
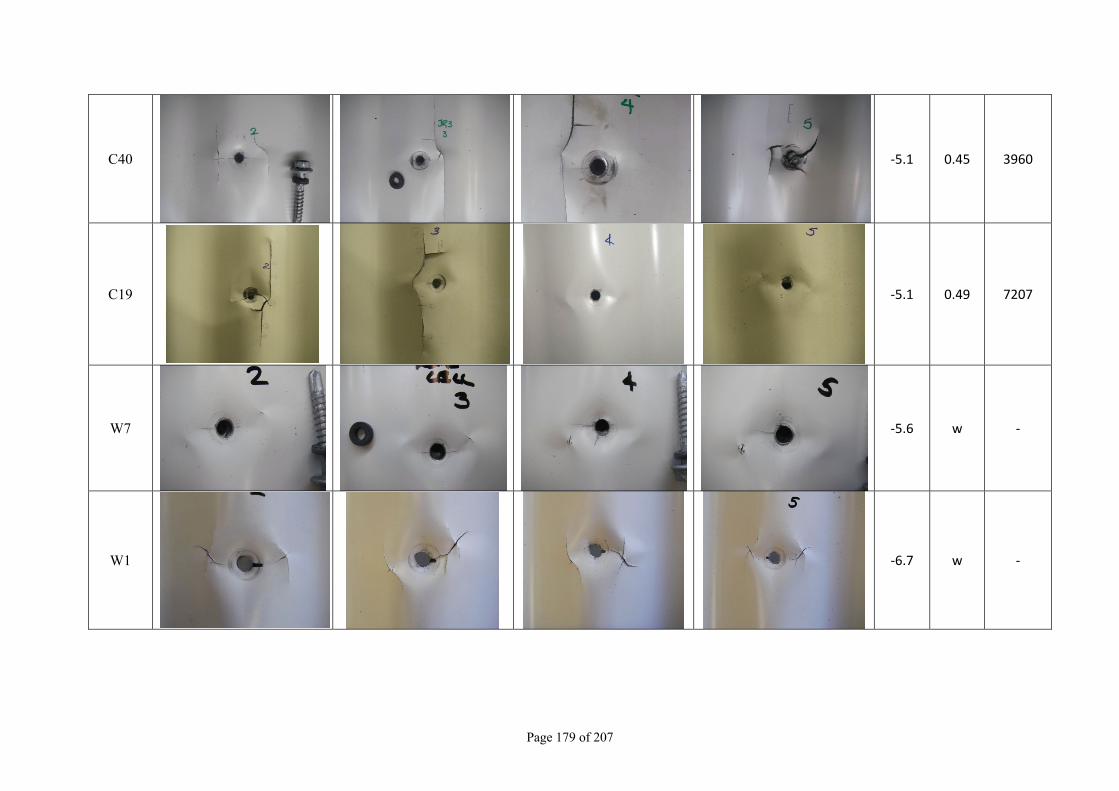
C40 ‐5.1 0.45 3960
C19
‐5.1 0.49 7207
W7
‐5.6 w ‐
W1
‐6.7 w ‐
Page 179 of 207
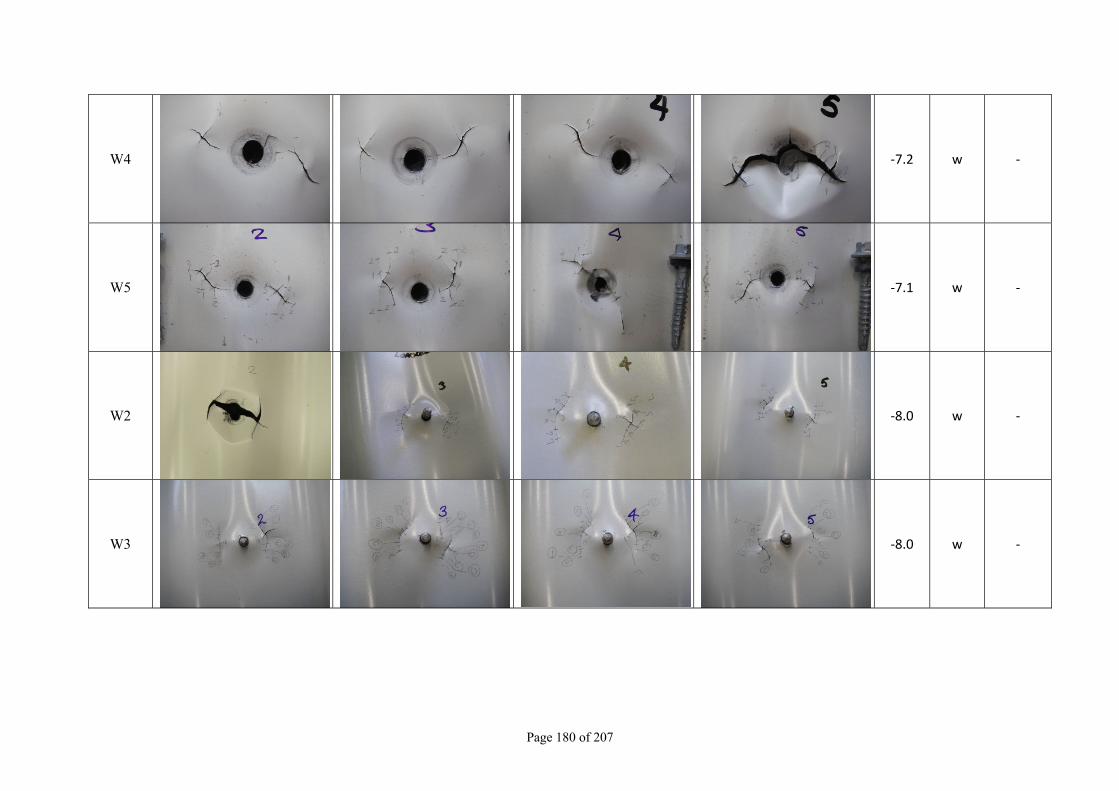
W4 ‐7.2 w ‐
W5 ‐7.1 w ‐
W2 ‐8.0 w ‐
W3 ‐8.0 w ‐
Page 180 of 207
Page 181 of 207
‐ W6 ‐8.3 w
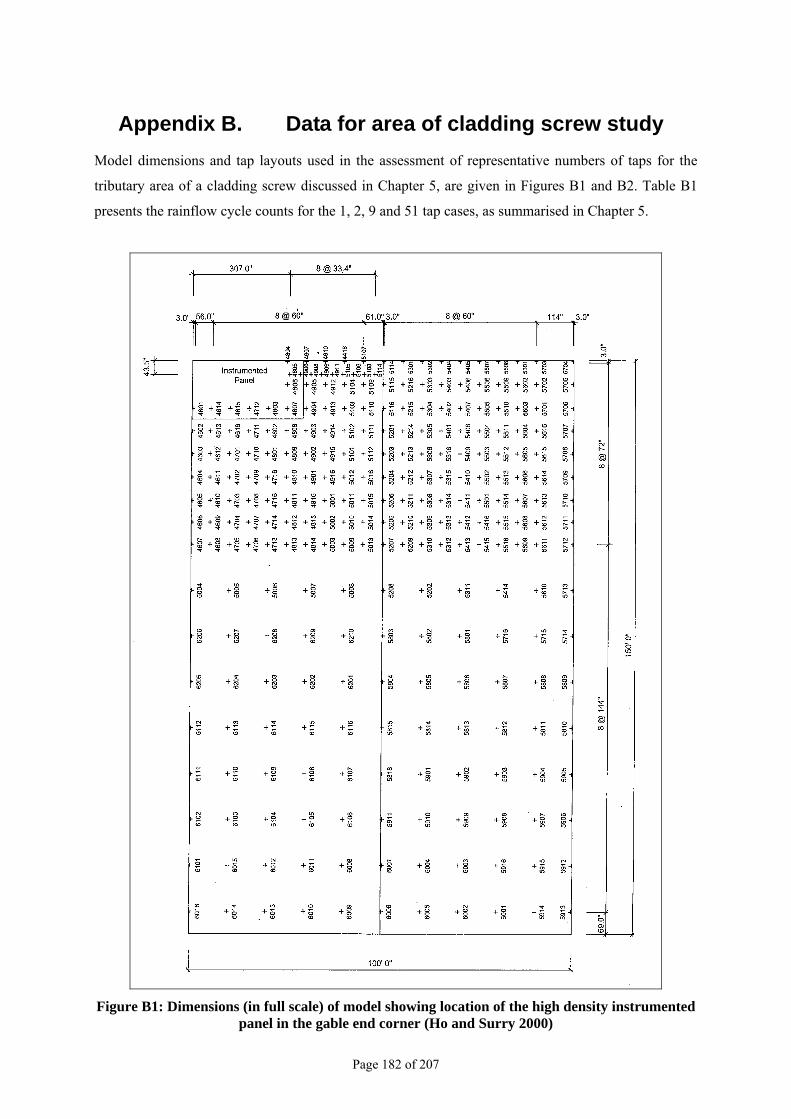
Appendix B. Data for area of cladding screw study
Model dimensions and tap layouts used in the assessment of representative numbers of taps for the
tributary area of a cladding screw discussed in Chapter 5, are given in Figures B1 and B2. Table B1
presents the rainflow cycle counts for the 1, 2, 9 and 51 tap cases, as summarised in Chapter 5.
Figure B1: Dimensions (in full scale) of model showing location of the high density instrumented panel in the gable end corner (Ho and Surry 2000)
Page 182 of 207
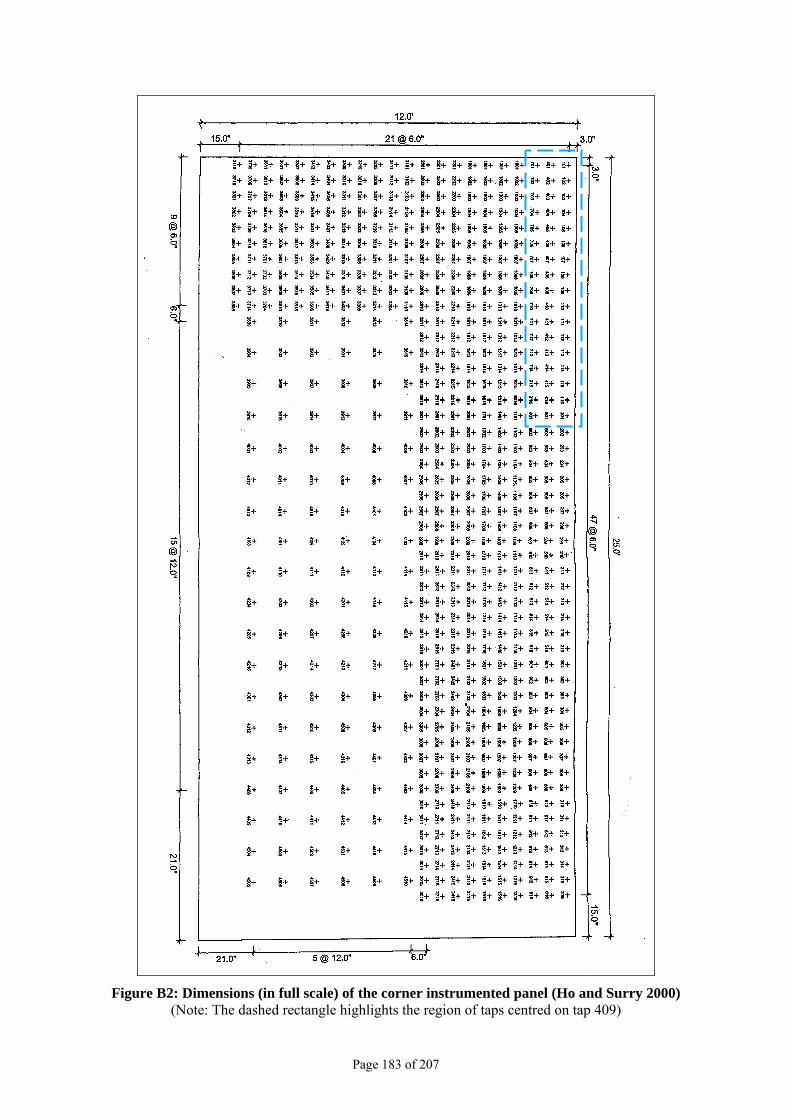
Figure B2: Dimensions (in full scale) of the corner instrumented panel (Ho and Surry 2000) (Note: The dashed rectangle highlights the region of taps centred on tap 409)
Page 183 of 207
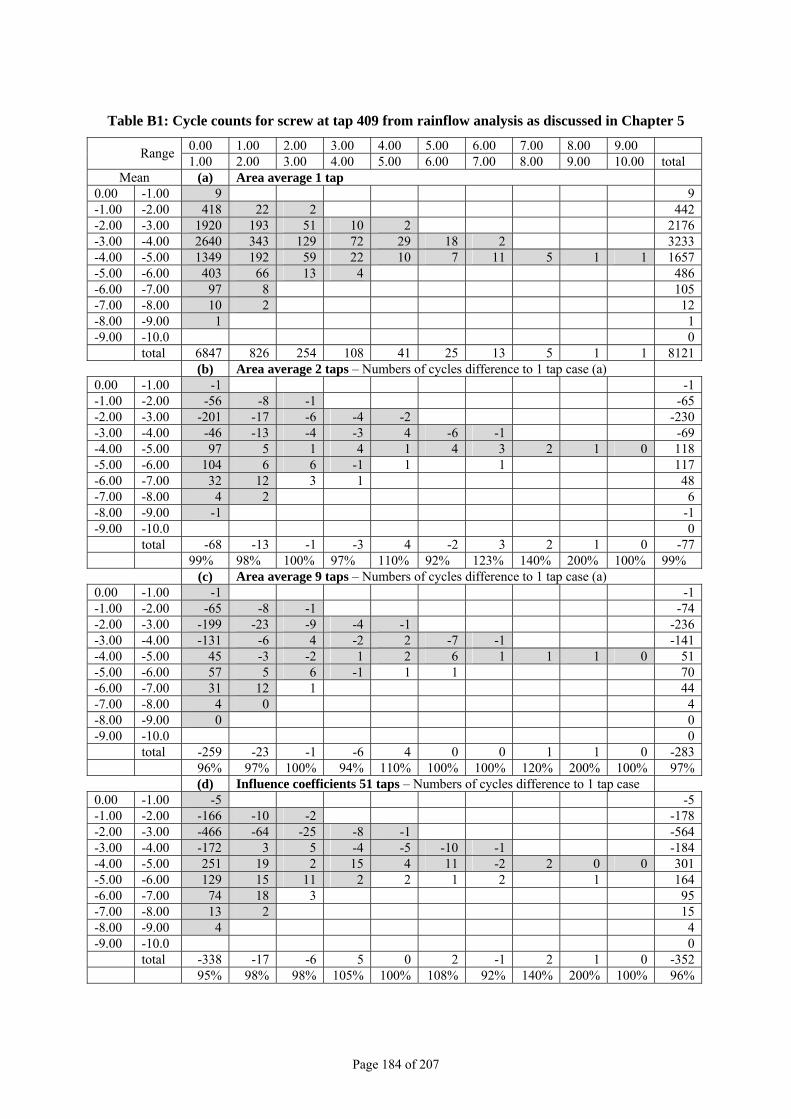
Table B1: Cycle counts for screw at tap 409 from rainflow analysis as discussed in Chapter 5
0.00 1.00 2.00 3.00 4.00 5.00 6.00 7.00 8.00 9.00 Range
1.00 2.00 3.00 4.00 5.00 6.00 7.00 8.00 9.00 10.00 total Mean (a) Area average 1 tap
0.00 -1.00 9 9 -1.00 -2.00 418 22 2 442 -2.00 -3.00 1920 193 51 10 2 2176 -3.00 -4.00 2640 343 129 72 29 18 2 3233 -4.00 -5.00 1349 192 59 22 10 7 11 5 1 1 1657 -5.00 -6.00 403 66 13 4 486 -6.00 -7.00 97 8 105 -7.00 -8.00 10 2 12 -8.00 -9.00 1 1 -9.00 -10.0 0 total 6847 826 254 108 41 25 13 5 1 1 8121 (b) Area average 2 taps – Numbers of cycles difference to 1 tap case (a) 0.00 -1.00 -1 -1 -1.00 -2.00 -56 -8 -1 -65 -2.00 -3.00 -201 -17 -6 -4 -2 -230 -3.00 -4.00 -46 -13 -4 -3 4 -6 -1 -69 -4.00 -5.00 97 5 1 4 1 4 3 2 1 0 118 -5.00 -6.00 104 6 6 -1 1 1 117 -6.00 -7.00 32 12 3 1 48 -7.00 -8.00 4 2 6 -8.00 -9.00 -1 -1 -9.00 -10.0 0 total -68 -13 -1 -3 4 -2 3 2 1 0 -77 99% 98% 100% 97% 110% 92% 123% 140% 200% 100% 99% (c) Area average 9 taps – Numbers of cycles difference to 1 tap case (a) 0.00 -1.00 -1 -1 -1.00 -2.00 -65 -8 -1 -74 -2.00 -3.00 -199 -23 -9 -4 -1 -236 -3.00 -4.00 -131 -6 4 -2 2 -7 -1 -141 -4.00 -5.00 45 -3 -2 1 2 6 1 1 1 0 51 -5.00 -6.00 57 5 6 -1 1 1 70 -6.00 -7.00 31 12 1 44 -7.00 -8.00 4 0 4 -8.00 -9.00 0 0 -9.00 -10.0 0 total -259 -23 -1 -6 4 0 0 1 1 0 -283 96% 97% 100% 94% 110% 100% 100% 120% 200% 100% 97% (d) Influence coefficients 51 taps – Numbers of cycles difference to 1 tap case 0.00 -1.00 -5 -5 -1.00 -2.00 -166 -10 -2 -178 -2.00 -3.00 -466 -64 -25 -8 -1 -564 -3.00 -4.00 -172 3 5 -4 -5 -10 -1 -184 -4.00 -5.00 251 19 2 15 4 11 -2 2 0 0 301 -5.00 -6.00 129 15 11 2 2 1 2 1 164 -6.00 -7.00 74 18 3 95 -7.00 -8.00 13 2 15 -8.00 -9.00 4 4 -9.00 -10.0 0 total -338 -17 -6 5 0 2 -1 2 1 0 -352 95% 98% 98% 105% 100% 108% 92% 140% 200% 100% 96%
Page 184 of 207
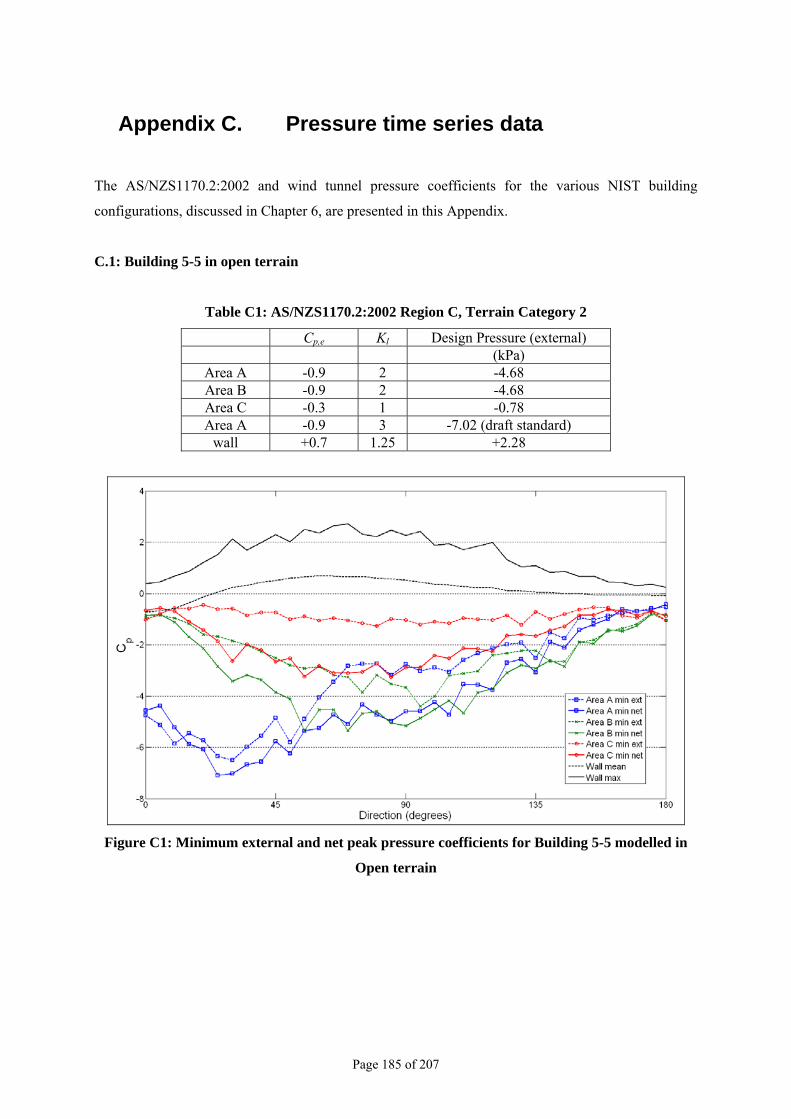
Appendix C. Pressure time series data
The AS/NZS1170.2:2002 and wind tunnel pressure coefficients for the various NIST building
configurations, discussed in Chapter 6, are presented in this Appendix.
C.1: Building 5-5 in open terrain
Table C1: AS/NZS1170.2:2002 Region C, Terrain Category 2
Cp,e Kl Design Pressure (external) (kPa)
Area A -0.9 2 -4.68 Area B -0.9 2 -4.68 Area C -0.3 1 -0.78 Area A -0.9 3 -7.02 (draft standard)
wall +0.7 1.25 +2.28
Figure C1: Minimum external and net peak pressure coefficients for Building 5-5 modelled in
Open terrain
Page 185 of 207
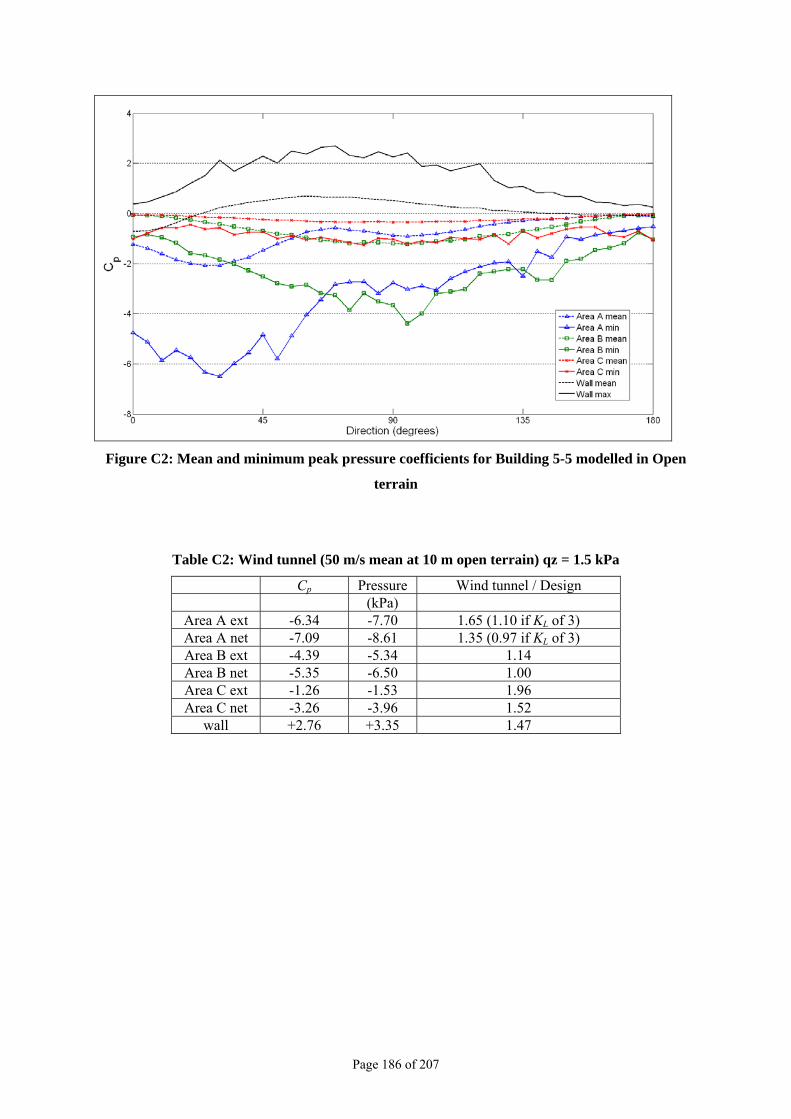
Figure C2: Mean and minimum peak pressure coefficients for Building 5-5 modelled in Open
terrain
Table C2: Wind tunnel (50 m/s mean at 10 m open terrain) qz = 1.5 kPa
Cp Pressure Wind tunnel / Design (kPa)
Area A ext -6.34 -7.70 1.65 (1.10 if KL of 3) Area A net -7.09 -8.61 1.35 (0.97 if KL of 3) Area B ext -4.39 -5.34 1.14 Area B net -5.35 -6.50 1.00 Area C ext -1.26 -1.53 1.96 Area C net -3.26 -3.96 1.52
wall +2.76 +3.35 1.47
Page 186 of 207
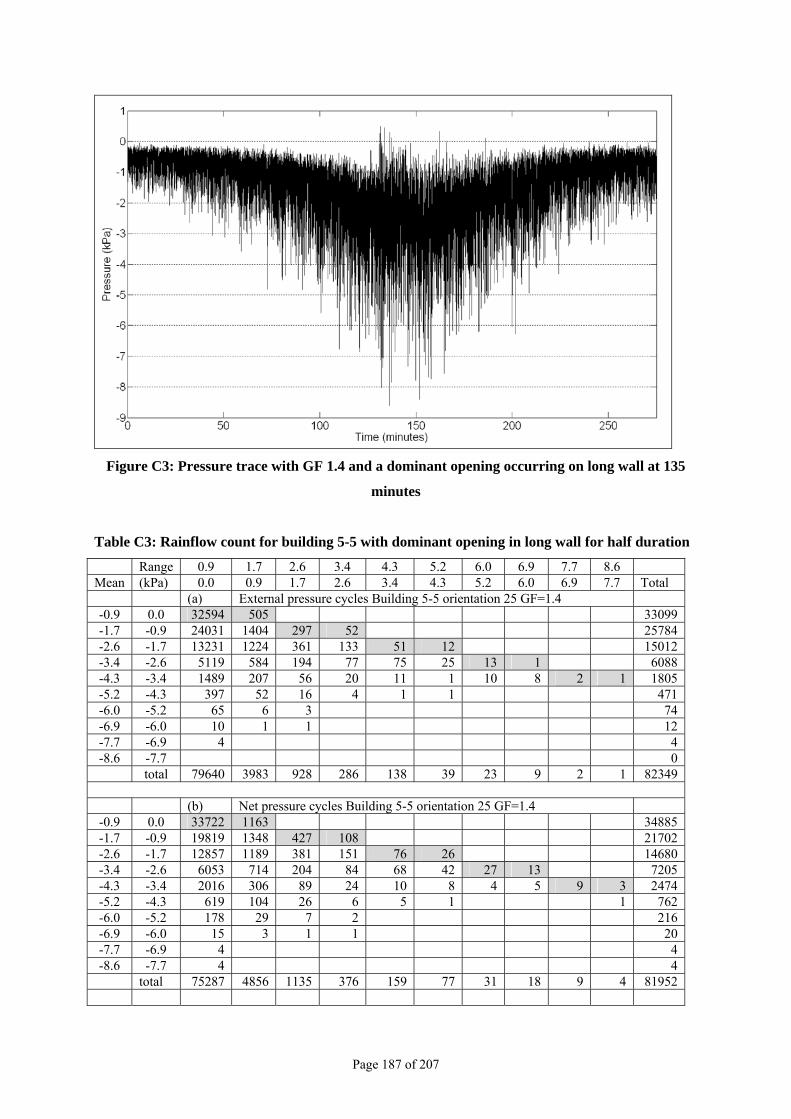
Figure C3: Pressure trace with GF 1.4 and a dominant opening occurring on long wall at 135
minutes
Table C3: Rainflow count for building 5-5 with dominant opening in long wall for half duration
Range 0.9 1.7 2.6 3.4 4.3 5.2 6.0 6.9 7.7 8.6 Mean (kPa) 0.0 0.9 1.7 2.6 3.4 4.3 5.2 6.0 6.9 7.7 Total (a) External pressure cycles Building 5-5 orientation 25 GF=1.4 -0.9 0.0 32594 505 33099 -1.7 -0.9 24031 1404 297 52 25784 -2.6 -1.7 13231 1224 361 133 51 12 15012 -3.4 -2.6 5119 584 194 77 75 25 13 1 6088 -4.3 -3.4 1489 207 56 20 11 1 10 8 2 1 1805 -5.2 -4.3 397 52 16 4 1 1 471 -6.0 -5.2 65 6 3 74 -6.9 -6.0 10 1 1 12 -7.7 -6.9 4 4 -8.6 -7.7 0
total 79640 3983 928 286 138 39 23 9 2 1 82349 (b) Net pressure cycles Building 5-5 orientation 25 GF=1.4
-0.9 0.0 33722 1163 34885 -1.7 -0.9 19819 1348 427 108 21702 -2.6 -1.7 12857 1189 381 151 76 26 14680 -3.4 -2.6 6053 714 204 84 68 42 27 13 7205 -4.3 -3.4 2016 306 89 24 10 8 4 5 9 3 2474 -5.2 -4.3 619 104 26 6 5 1 1 762 -6.0 -5.2 178 29 7 2 216 -6.9 -6.0 15 3 1 1 20 -7.7 -6.9 4 4 -8.6 -7.7 4 4
total 75287 4856 1135 376 159 77 31 18 9 4 81952
Page 187 of 207
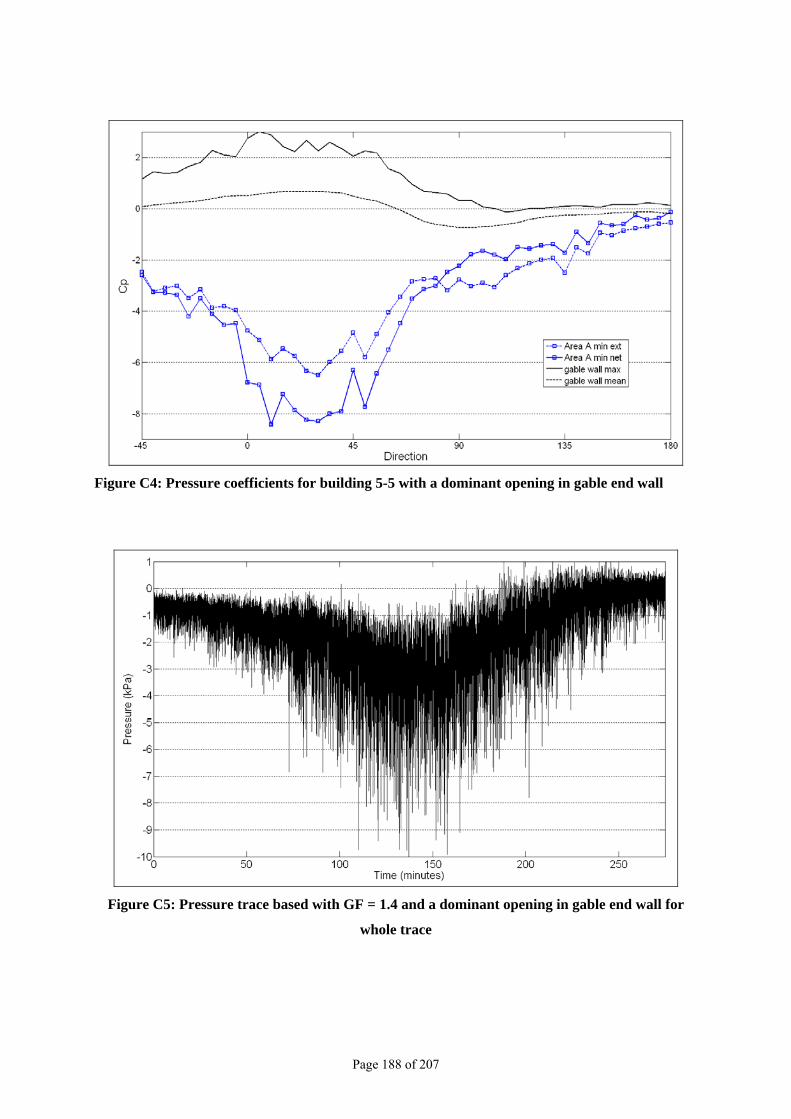
Figure C4: Pressure coefficients for building 5-5 with a dominant opening in gable end wall
Figure C5: Pressure trace based with GF = 1.4 and a dominant opening in gable end wall for
whole trace
Page 188 of 207
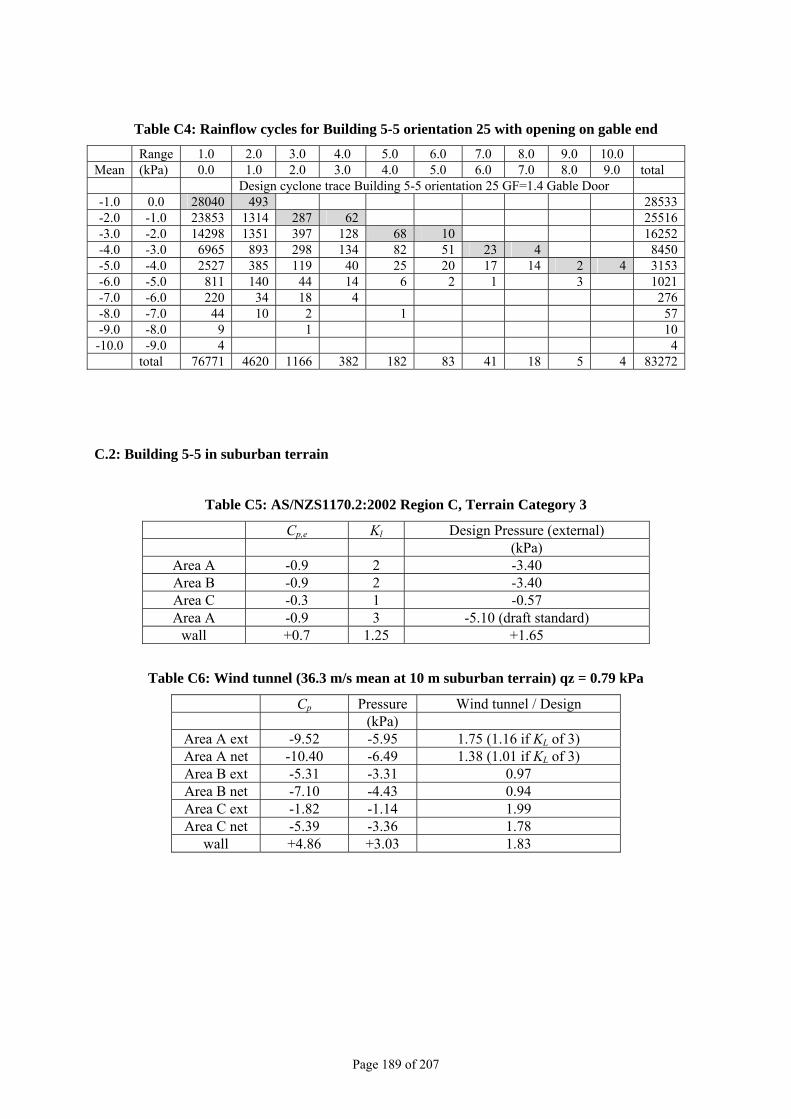
Table C4: Rainflow cycles for Building 5-5 orientation 25 with opening on gable end
Range 1.0 2.0 3.0 4.0 5.0 6.0 7.0 8.0 9.0 10.0 Mean (kPa) 0.0 1.0 2.0 3.0 4.0 5.0 6.0 7.0 8.0 9.0 total Design cyclone trace Building 5-5 orientation 25 GF=1.4 Gable Door -1.0 0.0 28040 493 28533 -2.0 -1.0 23853 1314 287 62 25516 -3.0 -2.0 14298 1351 397 128 68 10 16252 -4.0 -3.0 6965 893 298 134 82 51 23 4 8450 -5.0 -4.0 2527 385 119 40 25 20 17 14 2 4 3153 -6.0 -5.0 811 140 44 14 6 2 1 3 1021 -7.0 -6.0 220 34 18 4 276 -8.0 -7.0 44 10 2 1 57 -9.0 -8.0 9 1 10
-10.0 -9.0 4 4 total 76771 4620 1166 382 182 83 41 18 5 4 83272
C.2: Building 5-5 in suburban terrain
Table C5: AS/NZS1170.2:2002 Region C, Terrain Category 3
Cp,e Kl Design Pressure (external) (kPa)
Area A -0.9 2 -3.40 Area B -0.9 2 -3.40 Area C -0.3 1 -0.57 Area A -0.9 3 -5.10 (draft standard)
wall +0.7 1.25 +1.65
Table C6: Wind tunnel (36.3 m/s mean at 10 m suburban terrain) qz = 0.79 kPa
Cp Pressure Wind tunnel / Design (kPa)
Area A ext -9.52 -5.95 1.75 (1.16 if KL of 3) Area A net -10.40 -6.49 1.38 (1.01 if KL of 3) Area B ext -5.31 -3.31 0.97 Area B net -7.10 -4.43 0.94 Area C ext -1.82 -1.14 1.99 Area C net -5.39 -3.36 1.78
wall +4.86 +3.03 1.83
Page 189 of 207
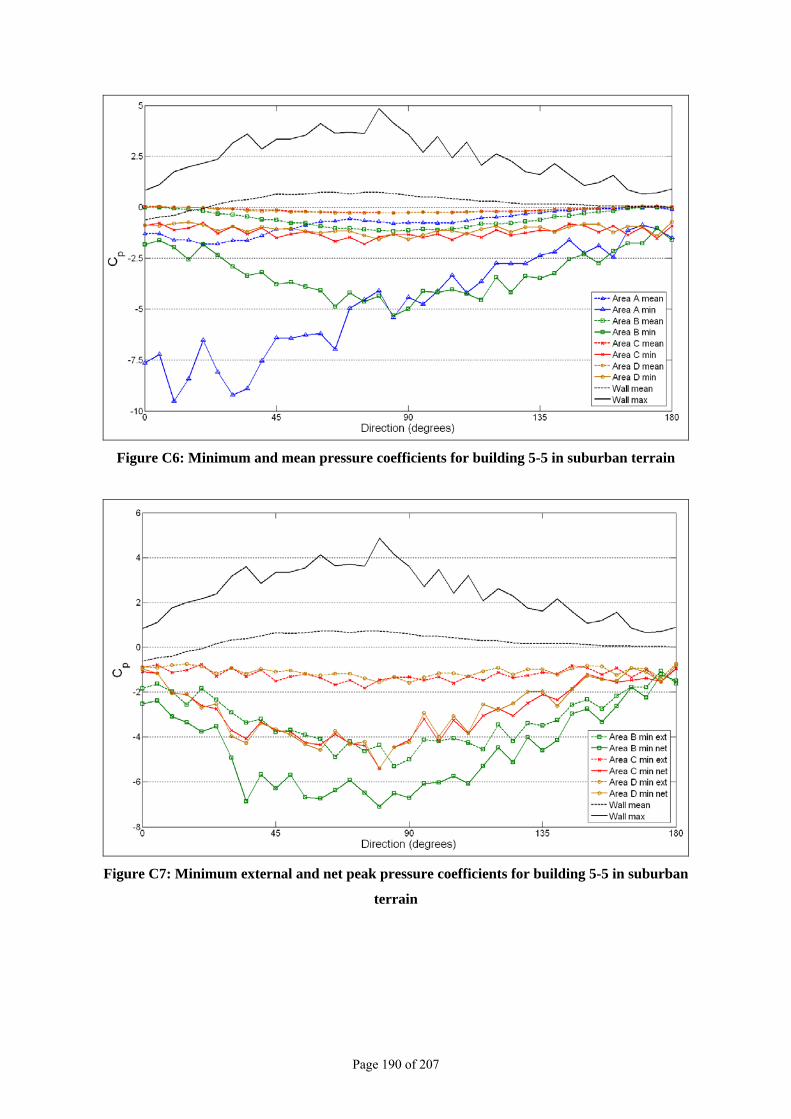
Figure C6: Minimum and mean pressure coefficients for building 5-5 in suburban terrain
Figure C7: Minimum external and net peak pressure coefficients for building 5-5 in suburban
terrain
Page 190 of 207
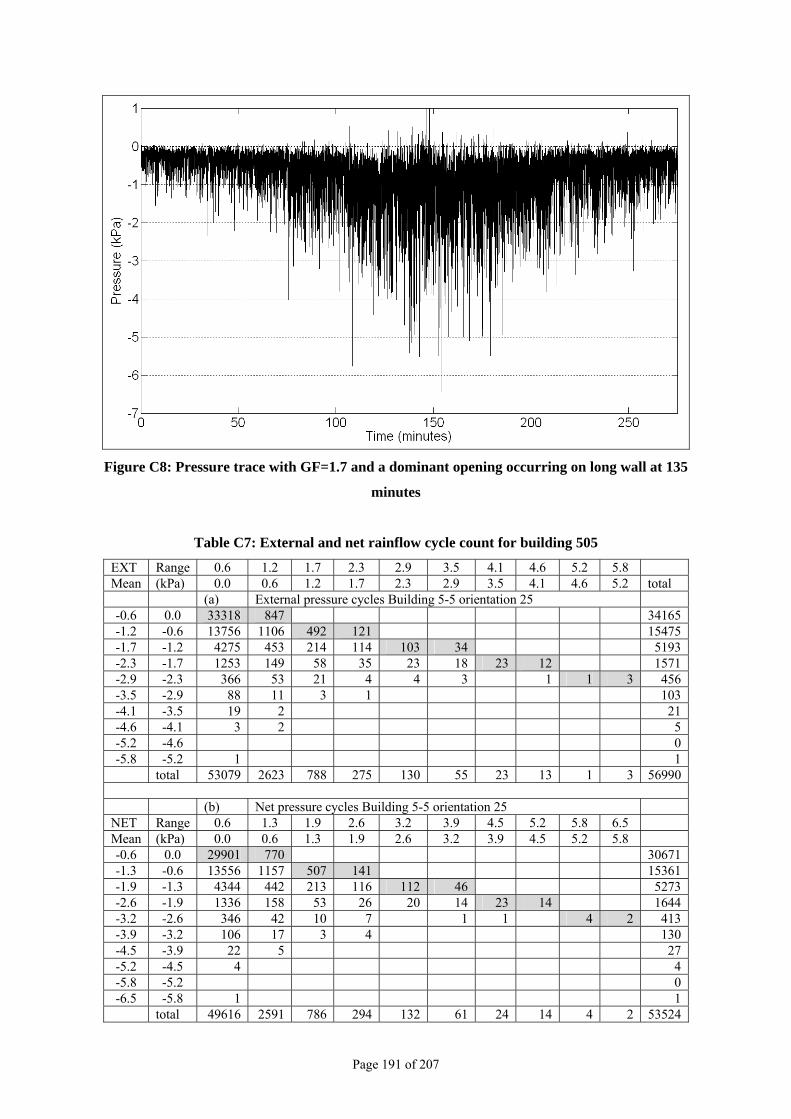
Figure C8: Pressure trace with GF=1.7 and a dominant opening occurring on long wall at 135
minutes
Table C7: External and net rainflow cycle count for building 505
EXT Range 0.6 1.2 1.7 2.3 2.9 3.5 4.1 4.6 5.2 5.8 Mean (kPa) 0.0 0.6 1.2 1.7 2.3 2.9 3.5 4.1 4.6 5.2 total (a) External pressure cycles Building 5-5 orientation 25 -0.6 0.0 33318 847 34165 -1.2 -0.6 13756 1106 492 121 15475 -1.7 -1.2 4275 453 214 114 103 34 5193 -2.3 -1.7 1253 149 58 35 23 18 23 12 1571 -2.9 -2.3 366 53 21 4 4 3 1 1 3 456 -3.5 -2.9 88 11 3 1 103 -4.1 -3.5 19 2 21 -4.6 -4.1 3 2 5 -5.2 -4.6 0 -5.8 -5.2 1 1
total 53079 2623 788 275 130 55 23 13 1 3 56990 (b) Net pressure cycles Building 5-5 orientation 25 NET Range 0.6 1.3 1.9 2.6 3.2 3.9 4.5 5.2 5.8 6.5 Mean (kPa) 0.0 0.6 1.3 1.9 2.6 3.2 3.9 4.5 5.2 5.8 -0.6 0.0 29901 770 30671 -1.3 -0.6 13556 1157 507 141 15361 -1.9 -1.3 4344 442 213 116 112 46 5273 -2.6 -1.9 1336 158 53 26 20 14 23 14 1644 -3.2 -2.6 346 42 10 7 1 1 4 2 413 -3.9 -3.2 106 17 3 4 130 -4.5 -3.9 22 5 27 -5.2 -4.5 4 4 -5.8 -5.2 0 -6.5 -5.8 1 1
total 49616 2591 786 294 132 61 24 14 4 2 53524
Page 191 of 207
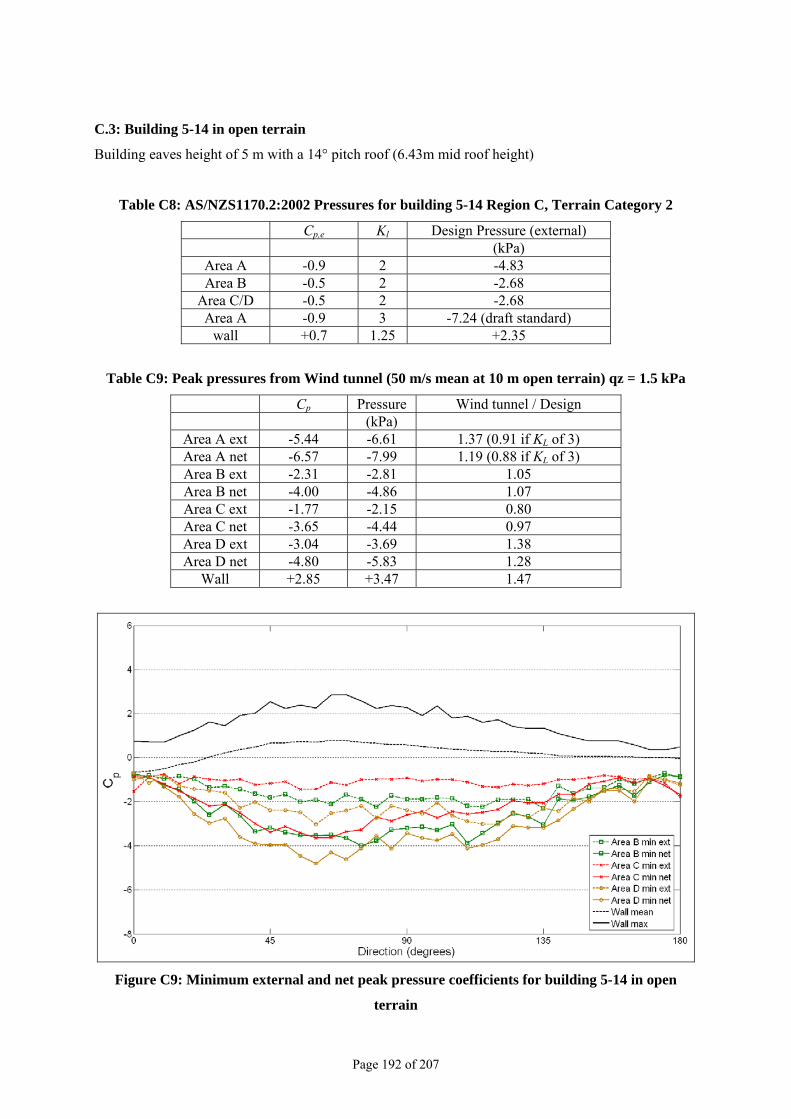
C.3: Building 5-14 in open terrain
Building eaves height of 5 m with a 14° pitch roof (6.43m mid roof height)
Table C8: AS/NZS1170.2:2002 Pressures for building 5-14 Region C, Terrain Category 2
Cp,e Kl Design Pressure (external) (kPa)
Area A -0.9 2 -4.83 Area B -0.5 2 -2.68
Area C/D -0.5 2 -2.68 Area A -0.9 3 -7.24 (draft standard)
wall +0.7 1.25 +2.35
Table C9: Peak pressures from Wind tunnel (50 m/s mean at 10 m open terrain) qz = 1.5 kPa
Cp Pressure Wind tunnel / Design (kPa)
Area A ext -5.44 -6.61 1.37 (0.91 if KL of 3) Area A net -6.57 -7.99 1.19 (0.88 if KL of 3) Area B ext -2.31 -2.81 1.05 Area B net -4.00 -4.86 1.07 Area C ext -1.77 -2.15 0.80 Area C net -3.65 -4.44 0.97 Area D ext -3.04 -3.69 1.38 Area D net -4.80 -5.83 1.28
Wall +2.85 +3.47 1.47
Figure C9: Minimum external and net peak pressure coefficients for building 5-14 in open
terrain
Page 192 of 207
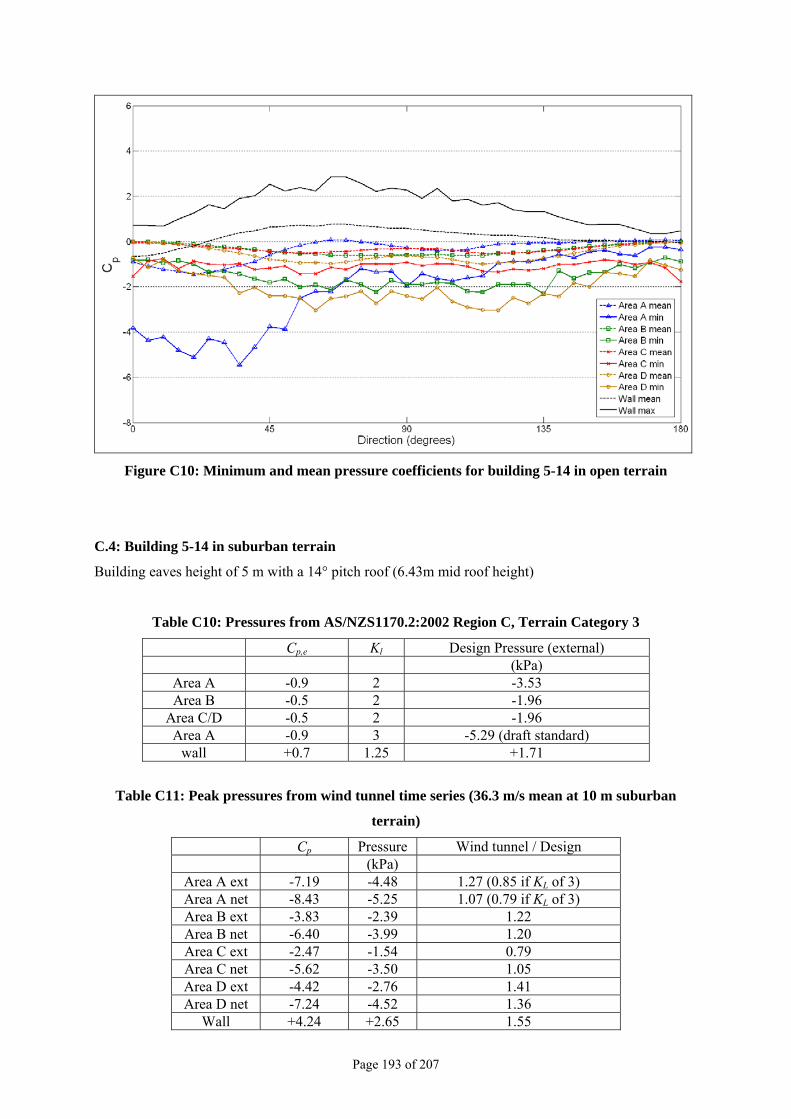
Figure C10: Minimum and mean pressure coefficients for building 5-14 in open terrain
C.4: Building 5-14 in suburban terrain
Building eaves height of 5 m with a 14° pitch roof (6.43m mid roof height)
Table C10: Pressures from AS/NZS1170.2:2002 Region C, Terrain Category 3
Cp,e Kl Design Pressure (external) (kPa)
Area A -0.9 2 -3.53 Area B -0.5 2 -1.96
Area C/D -0.5 2 -1.96 Area A -0.9 3 -5.29 (draft standard)
wall +0.7 1.25 +1.71
Table C11: Peak pressures from wind tunnel time series (36.3 m/s mean at 10 m suburban
terrain)
Cp Pressure Wind tunnel / Design (kPa)
Area A ext -7.19 -4.48 1.27 (0.85 if KL of 3) Area A net -8.43 -5.25 1.07 (0.79 if KL of 3) Area B ext -3.83 -2.39 1.22 Area B net -6.40 -3.99 1.20 Area C ext -2.47 -1.54 0.79 Area C net -5.62 -3.50 1.05 Area D ext -4.42 -2.76 1.41 Area D net -7.24 -4.52 1.36
Wall +4.24 +2.65 1.55
Page 193 of 207
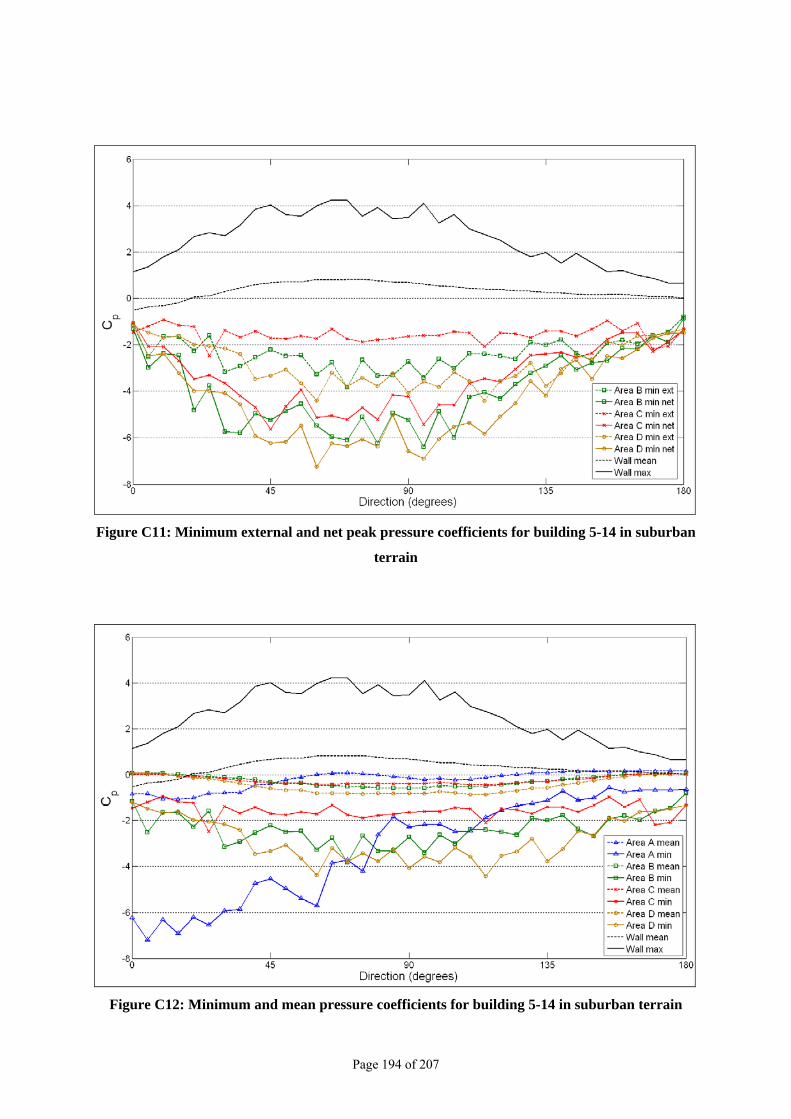
Figure C11: Minimum external and net peak pressure coefficients for building 5-14 in suburban
terrain
Figure C12: Minimum and mean pressure coefficients for building 5-14 in suburban terrain
Page 194 of 207
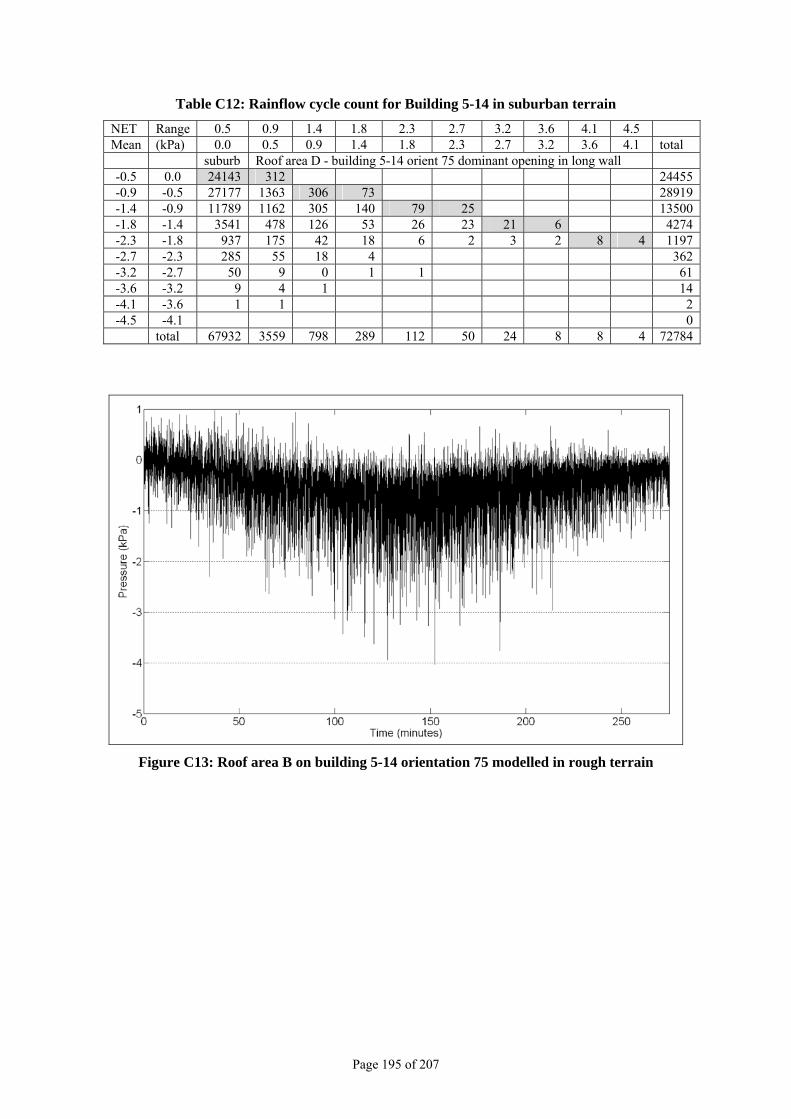
Table C12: Rainflow cycle count for Building 5-14 in suburban terrain
NET Range 0.5 0.9 1.4 1.8 2.3 2.7 3.2 3.6 4.1 4.5 Mean (kPa) 0.0 0.5 0.9 1.4 1.8 2.3 2.7 3.2 3.6 4.1 total suburb Roof area D - building 5-14 orient 75 dominant opening in long wall -0.5 0.0 24143 312 24455 -0.9 -0.5 27177 1363 306 73 28919 -1.4 -0.9 11789 1162 305 140 79 25 13500 -1.8 -1.4 3541 478 126 53 26 23 21 6 4274 -2.3 -1.8 937 175 42 18 6 2 3 2 8 4 1197 -2.7 -2.3 285 55 18 4 362 -3.2 -2.7 50 9 0 1 1 61 -3.6 -3.2 9 4 1 14 -4.1 -3.6 1 1 2 -4.5 -4.1 0
total 67932 3559 798 289 112 50 24 8 8 4 72784
Figure C13: Roof area B on building 5-14 orientation 75 modelled in rough terrain
Page 195 of 207
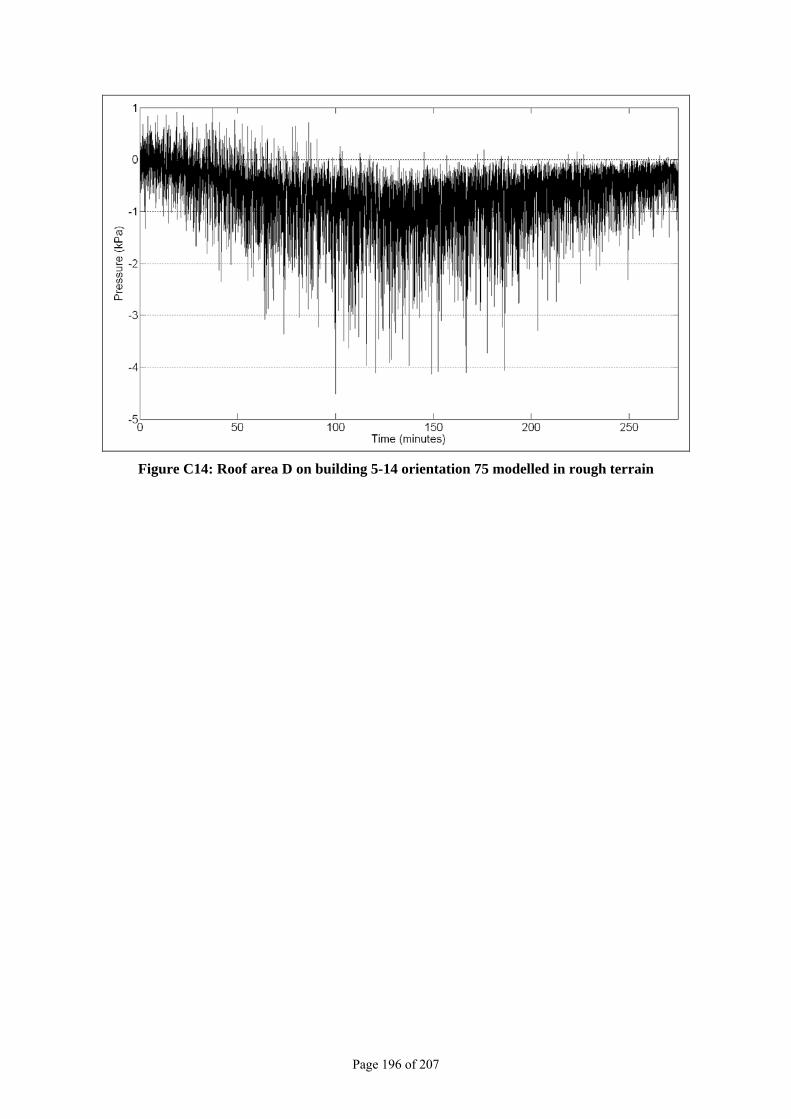
Figure C14: Roof area D on building 5-14 orientation 75 modelled in rough terrain
Page 196 of 207
Appendix D. Generated pressure traces based on
actual cyclone events
D.1 Cyclone Tracy D.1.1 Darwin
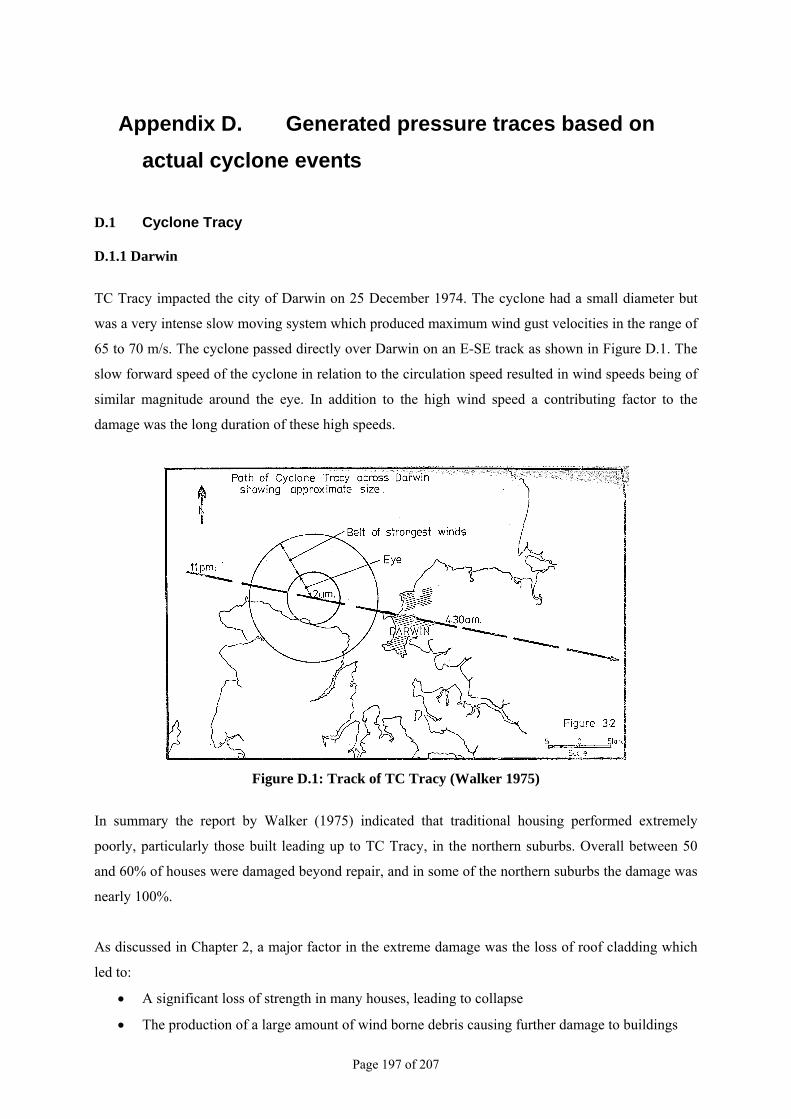
TC Tracy impacted the city of Darwin on 25 December 1974. The cyclone had a small diameter but
was a very intense slow moving system which produced maximum wind gust velocities in the range of
65 to 70 m/s. The cyclone passed directly over Darwin on an E-SE track as shown in Figure D.1. The
slow forward speed of the cyclone in relation to the circulation speed resulted in wind speeds being of
similar magnitude around the eye. In addition to the high wind speed a contributing factor to the
damage was the long duration of these high speeds.
Figure D.1: Track of TC Tracy (Walker 1975)
In summary the report by Walker (1975) indicated that traditional housing performed extremely
poorly, particularly those built leading up to TC Tracy, in the northern suburbs. Overall between 50
and 60% of houses were damaged beyond repair, and in some of the northern suburbs the damage was
nearly 100%.
As discussed in Chapter 2, a major factor in the extreme damage was the loss of roof cladding which
led to:
A significant loss of strength in many houses, leading to collapse
The production of a large amount of wind borne debris causing further damage to buildings
Page 197 of 207
D.1.2 Wind speed and direction
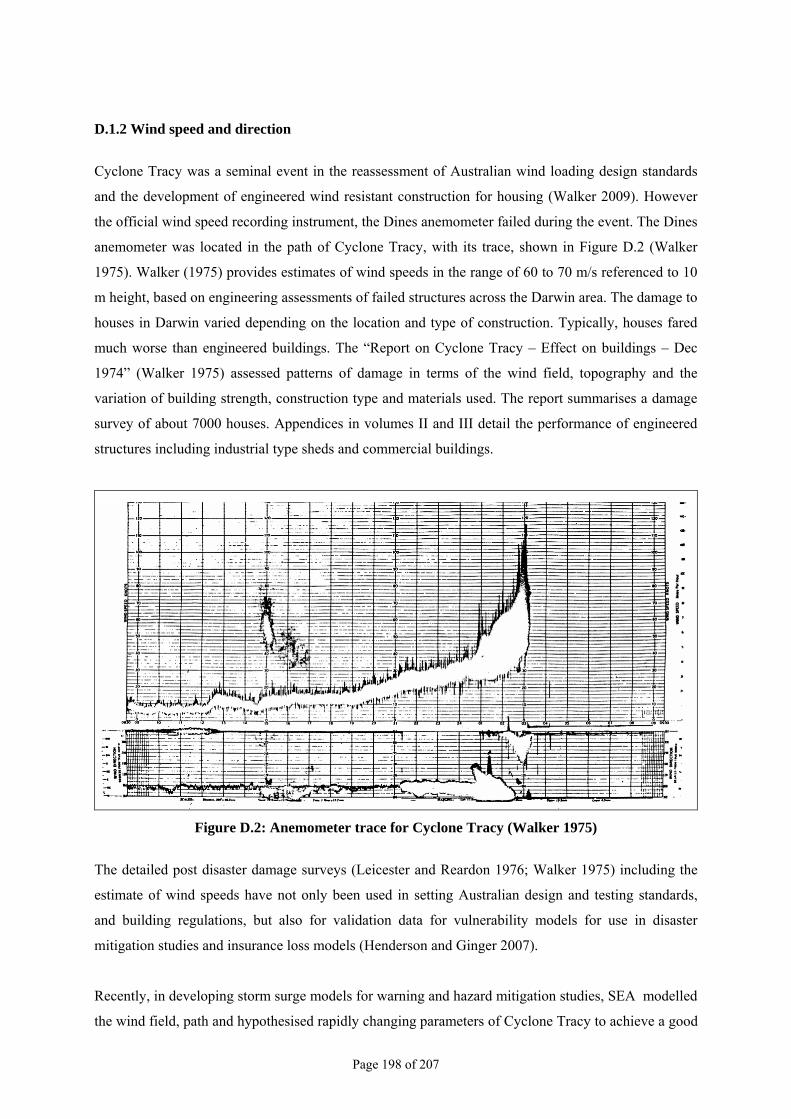
Cyclone Tracy was a seminal event in the reassessment of Australian wind loading design standards
and the development of engineered wind resistant construction for housing (Walker 2009). However
the official wind speed recording instrument, the Dines anemometer failed during the event. The Dines
anemometer was located in the path of Cyclone Tracy, with its trace, shown in Figure D.2 (Walker
1975). Walker (1975) provides estimates of wind speeds in the range of 60 to 70 m/s referenced to 10
m height, based on engineering assessments of failed structures across the Darwin area. The damage to
houses in Darwin varied depending on the location and type of construction. Typically, houses fared
much worse than engineered buildings. The “Report on Cyclone Tracy – Effect on buildings – Dec
1974” (Walker 1975) assessed patterns of damage in terms of the wind field, topography and the
variation of building strength, construction type and materials used. The report summarises a damage
survey of about 7000 houses. Appendices in volumes II and III detail the performance of engineered
structures including industrial type sheds and commercial buildings.
Figure D.2: Anemometer trace for Cyclone Tracy (Walker 1975)
The detailed post disaster damage surveys (Leicester and Reardon 1976; Walker 1975) including the
estimate of wind speeds have not only been used in setting Australian design and testing standards,
and building regulations, but also for validation data for vulnerability models for use in disaster
mitigation studies and insurance loss models (Henderson and Ginger 2007).
Recently, in developing storm surge models for warning and hazard mitigation studies, SEA modelled
the wind field, path and hypothesised rapidly changing parameters of Cyclone Tracy to achieve a good
Page 198 of 207
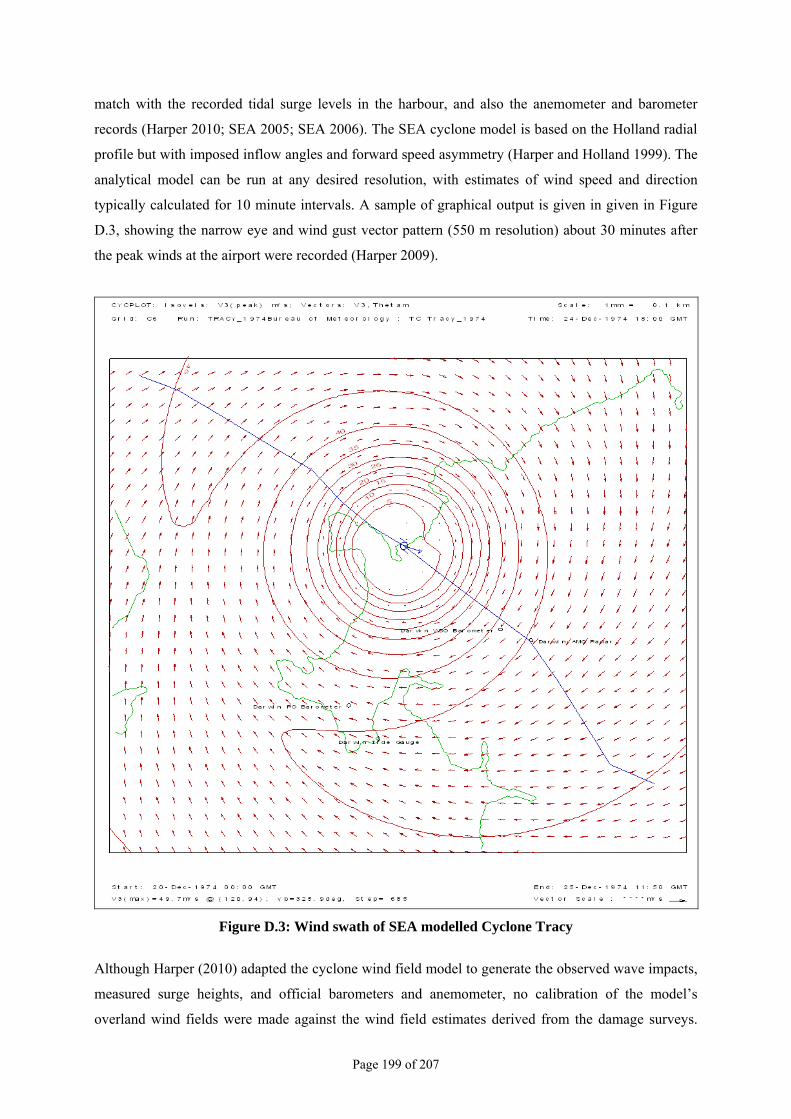
match with the recorded tidal surge levels in the harbour, and also the anemometer and barometer
records (Harper 2010; SEA 2005; SEA 2006). The SEA cyclone model is based on the Holland radial
profile but with imposed inflow angles and forward speed asymmetry (Harper and Holland 1999). The
analytical model can be run at any desired resolution, with estimates of wind speed and direction
typically calculated for 10 minute intervals. A sample of graphical output is given in given in Figure
D.3, showing the narrow eye and wind gust vector pattern (550 m resolution) about 30 minutes after
the peak winds at the airport were recorded (Harper 2009).
Figure D.3: Wind swath of SEA modelled Cyclone Tracy
Although Harper (2010) adapted the cyclone wind field model to generate the observed wave impacts,
measured surge heights, and official barometers and anemometer, no calibration of the model’s
overland wind fields were made against the wind field estimates derived from the damage surveys.
Page 199 of 207
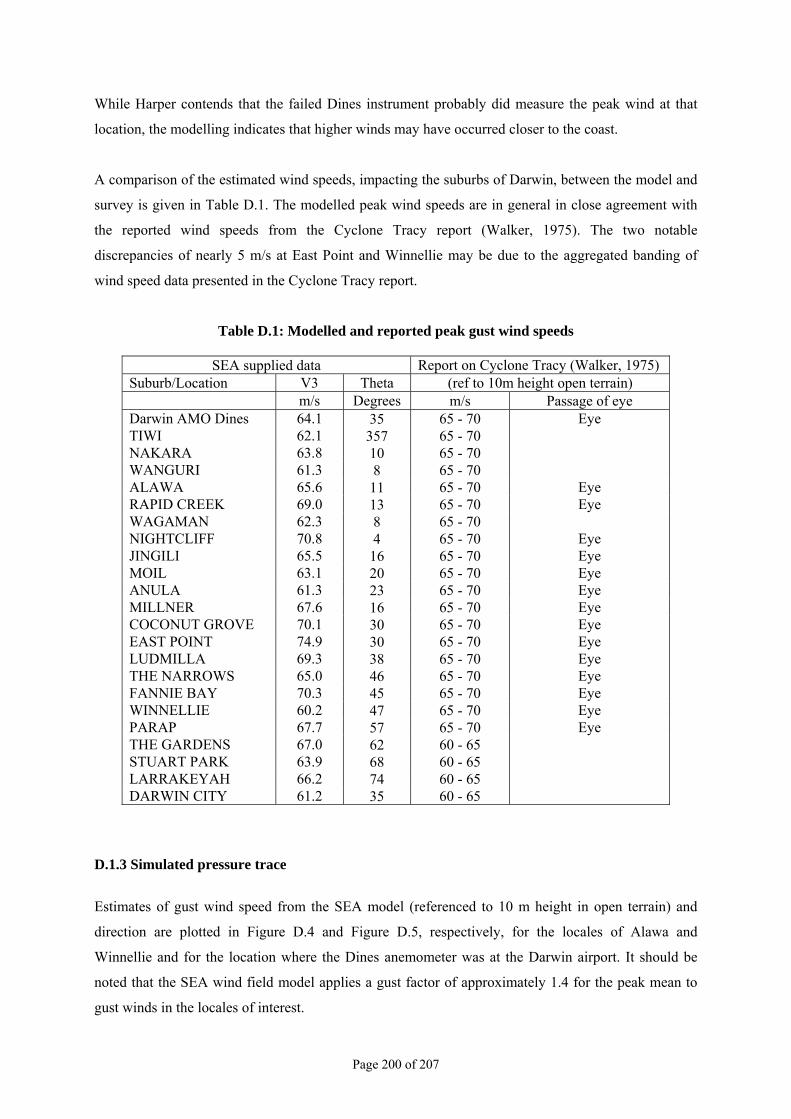
While Harper contends that the failed Dines instrument probably did measure the peak wind at that
location, the modelling indicates that higher winds may have occurred closer to the coast.
A comparison of the estimated wind speeds, impacting the suburbs of Darwin, between the model and
survey is given in Table D.1. The modelled peak wind speeds are in general in close agreement with
the reported wind speeds from the Cyclone Tracy report (Walker, 1975). The two notable
discrepancies of nearly 5 m/s at East Point and Winnellie may be due to the aggregated banding of
wind speed data presented in the Cyclone Tracy report.
Table D.1: Modelled and reported peak gust wind speeds
SEA supplied data Report on Cyclone Tracy (Walker, 1975) Suburb/Location V3 Theta (ref to 10m height open terrain) m/s Degrees m/s Passage of eye Darwin AMO Dines 64.1 35 65 - 70 Eye TIWI 62.1 357 65 - 70 NAKARA 63.8 10 65 - 70 WANGURI 61.3 8 65 - 70 ALAWA 65.6 11 65 - 70 Eye RAPID CREEK 69.0 13 65 - 70 Eye WAGAMAN 62.3 8 65 - 70 NIGHTCLIFF 70.8 4 65 - 70 Eye JINGILI 65.5 16 65 - 70 Eye MOIL 63.1 20 65 - 70 Eye ANULA 61.3 23 65 - 70 Eye MILLNER 67.6 16 65 - 70 Eye COCONUT GROVE 70.1 30 65 - 70 Eye EAST POINT 74.9 30 65 - 70 Eye LUDMILLA 69.3 38 65 - 70 Eye THE NARROWS 65.0 46 65 - 70 Eye FANNIE BAY 70.3 45 65 - 70 Eye WINNELLIE 60.2 47 65 - 70 Eye PARAP 67.7 57 65 - 70 Eye THE GARDENS 67.0 62 60 - 65 STUART PARK 63.9 68 60 - 65 LARRAKEYAH 66.2 74 60 - 65 DARWIN CITY 61.2 35 60 - 65
D.1.3 Simulated pressure trace
Estimates of gust wind speed from the SEA model (referenced to 10 m height in open terrain) and
direction are plotted in Figure D.4 and Figure D.5, respectively, for the locales of Alawa and
Winnellie and for the location where the Dines anemometer was at the Darwin airport. It should be
noted that the SEA wind field model applies a gust factor of approximately 1.4 for the peak mean to
gust winds in the locales of interest.
Page 200 of 207
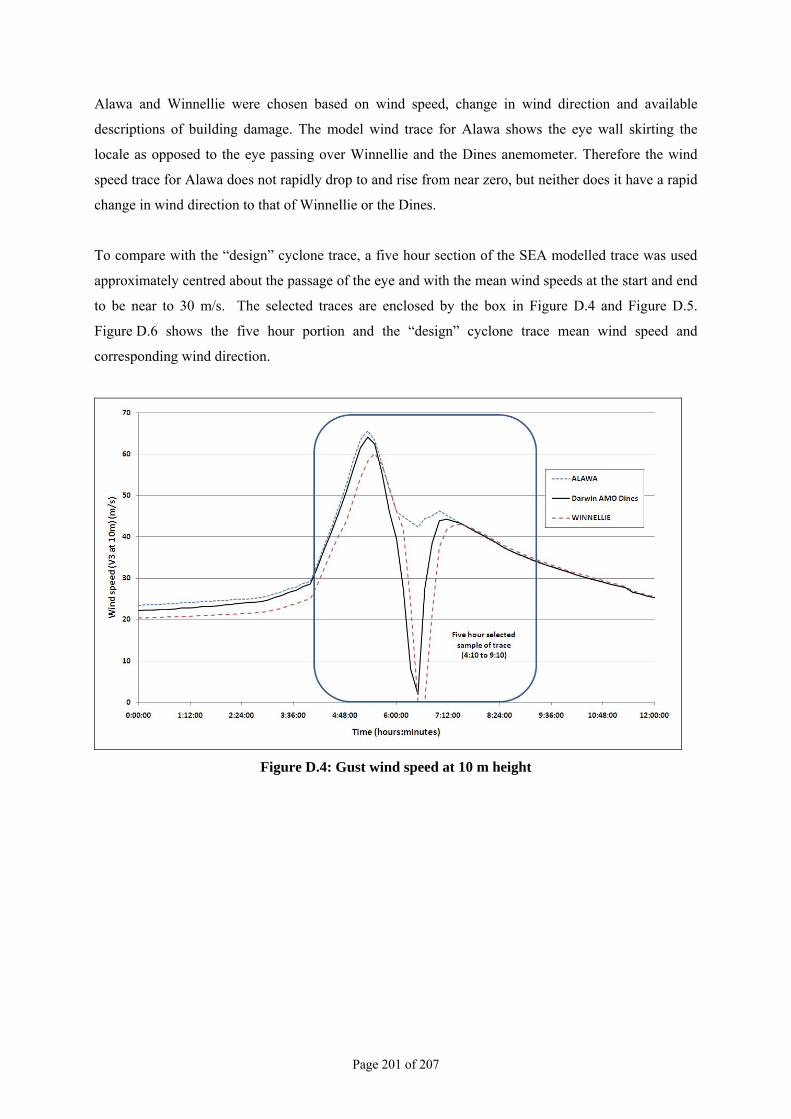
Alawa and Winnellie were chosen based on wind speed, change in wind direction and available
descriptions of building damage. The model wind trace for Alawa shows the eye wall skirting the
locale as opposed to the eye passing over Winnellie and the Dines anemometer. Therefore the wind
speed trace for Alawa does not rapidly drop to and rise from near zero, but neither does it have a rapid
change in wind direction to that of Winnellie or the Dines.
To compare with the “design” cyclone trace, a five hour section of the SEA modelled trace was used
approximately centred about the passage of the eye and with the mean wind speeds at the start and end
to be near to 30 m/s. The selected traces are enclosed by the box in Figure D.4 and Figure D.5.
Figure D.6 shows the five hour portion and the “design” cyclone trace mean wind speed and
corresponding wind direction.
Figure D.4: Gust wind speed at 10 m height
Page 201 of 207
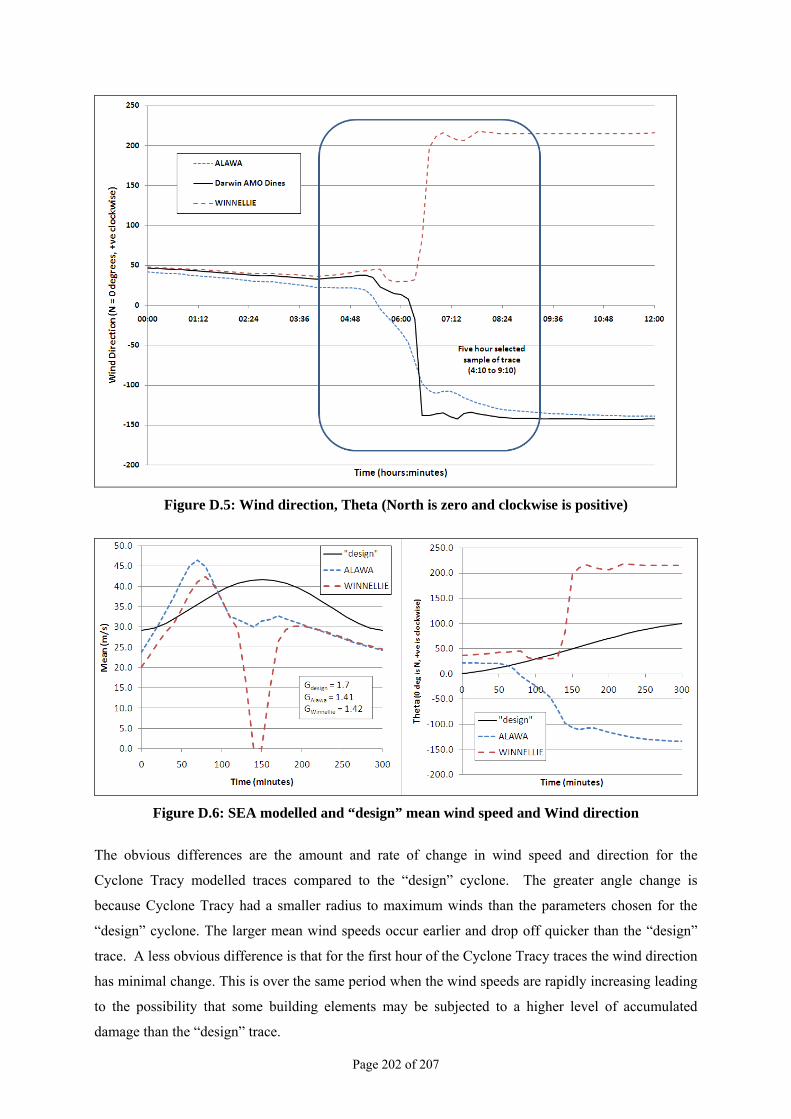
Figure D.5: Wind direction, Theta (North is zero and clockwise is positive)
Figure D.6: SEA modelled and “design” mean wind speed and Wind direction
The obvious differences are the amount and rate of change in wind speed and direction for the
Cyclone Tracy modelled traces compared to the “design” cyclone. The greater angle change is
because Cyclone Tracy had a smaller radius to maximum winds than the parameters chosen for the
“design” cyclone. The larger mean wind speeds occur earlier and drop off quicker than the “design”
trace. A less obvious difference is that for the first hour of the Cyclone Tracy traces the wind direction
has minimal change. This is over the same period when the wind speeds are rapidly increasing leading
to the possibility that some building elements may be subjected to a higher level of accumulated
damage than the “design” trace.
Page 202 of 207
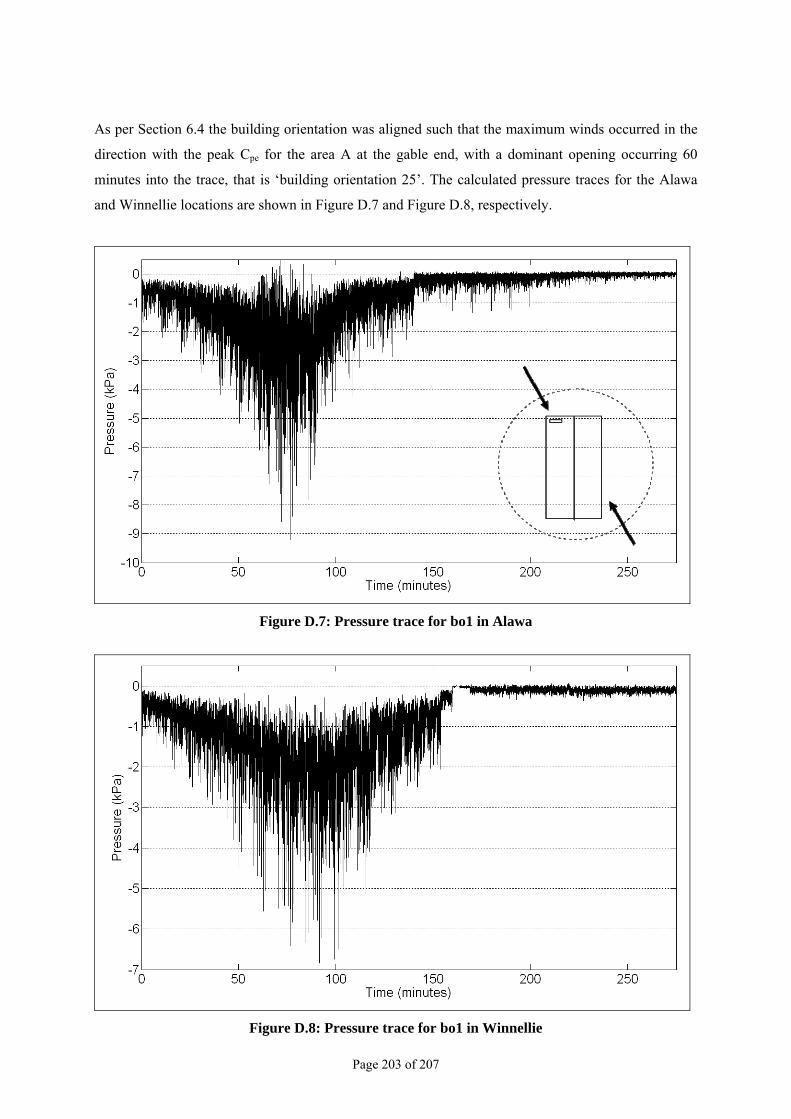
As per Section 6.4 the building orientation was aligned such that the maximum winds occurred in the
direction with the peak Cpe for the area A at the gable end, with a dominant opening occurring 60
minutes into the trace, that is ‘building orientation 25’. The calculated pressure traces for the Alawa
and Winnellie locations are shown in Figure D.7 and Figure D.8, respectively.
Figure D.7: Pressure trace for bo1 in Alawa
Figure D.8: Pressure trace for bo1 in Winnellie
Page 203 of 207
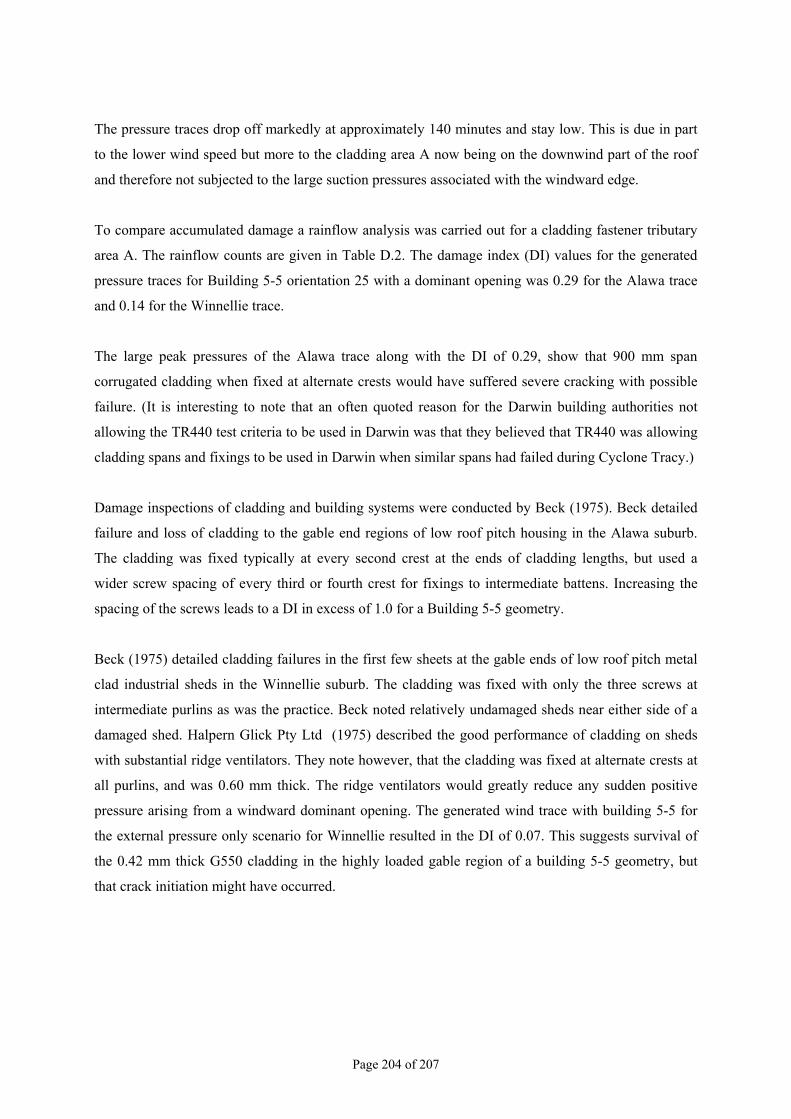
The pressure traces drop off markedly at approximately 140 minutes and stay low. This is due in part
to the lower wind speed but more to the cladding area A now being on the downwind part of the roof
and therefore not subjected to the large suction pressures associated with the windward edge.
To compare accumulated damage a rainflow analysis was carried out for a cladding fastener tributary
area A. The rainflow counts are given in Table D.2. The damage index (DI) values for the generated
pressure traces for Building 5-5 orientation 25 with a dominant opening was 0.29 for the Alawa trace
and 0.14 for the Winnellie trace.
The large peak pressures of the Alawa trace along with the DI of 0.29, show that 900 mm span
corrugated cladding when fixed at alternate crests would have suffered severe cracking with possible
failure. (It is interesting to note that an often quoted reason for the Darwin building authorities not
allowing the TR440 test criteria to be used in Darwin was that they believed that TR440 was allowing
cladding spans and fixings to be used in Darwin when similar spans had failed during Cyclone Tracy.)
Damage inspections of cladding and building systems were conducted by Beck (1975). Beck detailed
failure and loss of cladding to the gable end regions of low roof pitch housing in the Alawa suburb.
The cladding was fixed typically at every second crest at the ends of cladding lengths, but used a
wider screw spacing of every third or fourth crest for fixings to intermediate battens. Increasing the
spacing of the screws leads to a DI in excess of 1.0 for a Building 5-5 geometry.
Beck (1975) detailed cladding failures in the first few sheets at the gable ends of low roof pitch metal
clad industrial sheds in the Winnellie suburb. The cladding was fixed with only the three screws at
intermediate purlins as was the practice. Beck noted relatively undamaged sheds near either side of a
damaged shed. Halpern Glick Pty Ltd (1975) described the good performance of cladding on sheds
with substantial ridge ventilators. They note however, that the cladding was fixed at alternate crests at
all purlins, and was 0.60 mm thick. The ridge ventilators would greatly reduce any sudden positive
pressure arising from a windward dominant opening. The generated wind trace with building 5-5 for
the external pressure only scenario for Winnellie resulted in the DI of 0.07. This suggests survival of
the 0.42 mm thick G550 cladding in the highly loaded gable region of a building 5-5 geometry, but
that crack initiation might have occurred.
Page 204 of 207
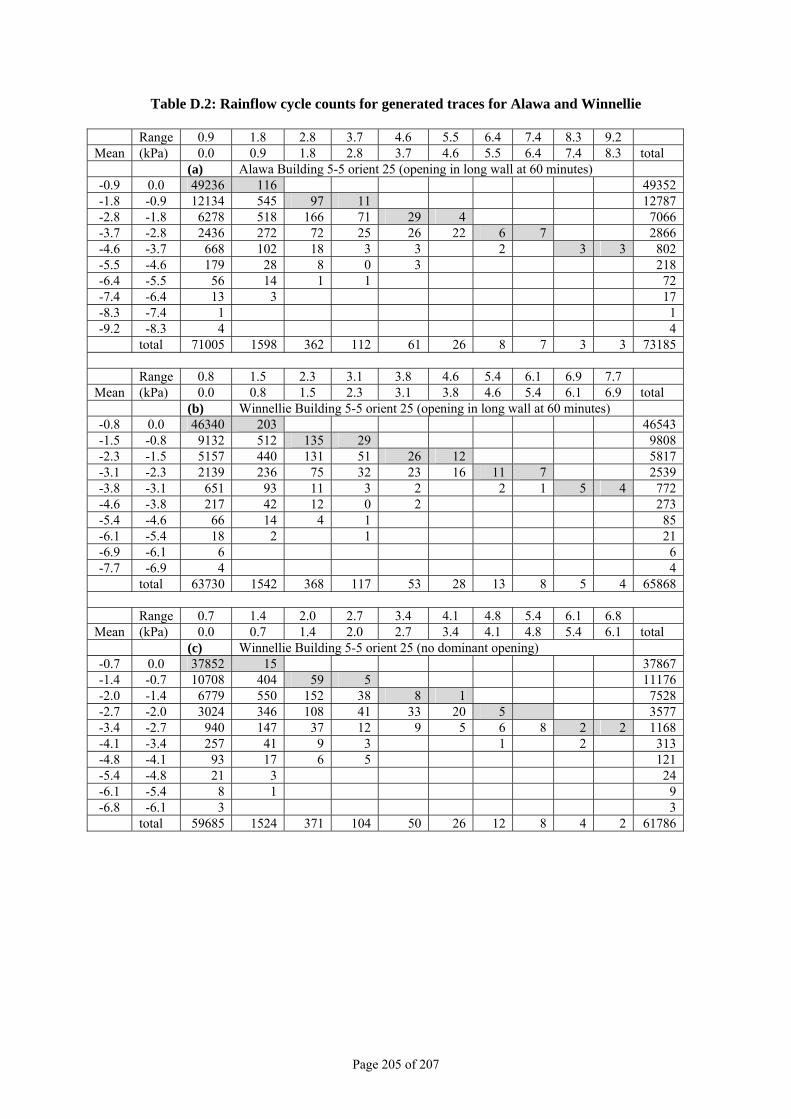
Table D.2: Rainflow cycle counts for generated traces for Alawa and Winnellie Range 0.9 1.8 2.8 3.7 4.6 5.5 6.4 7.4 8.3 9.2 Mean (kPa) 0.0 0.9 1.8 2.8 3.7 4.6 5.5 6.4 7.4 8.3 total (a) Alawa Building 5-5 orient 25 (opening in long wall at 60 minutes) -0.9 0.0 49236 116 49352 -1.8 -0.9 12134 545 97 11 12787 -2.8 -1.8 6278 518 166 71 29 4 7066 -3.7 -2.8 2436 272 72 25 26 22 6 7 2866 -4.6 -3.7 668 102 18 3 3 2 3 3 802 -5.5 -4.6 179 28 8 0 3 218 -6.4 -5.5 56 14 1 1 72 -7.4 -6.4 13 3 17 -8.3 -7.4 1 1 -9.2 -8.3 4 4
total 71005 1598 362 112 61 26 8 7 3 3 73185 Range 0.8 1.5 2.3 3.1 3.8 4.6 5.4 6.1 6.9 7.7 Mean (kPa) 0.0 0.8 1.5 2.3 3.1 3.8 4.6 5.4 6.1 6.9 total (b) Winnellie Building 5-5 orient 25 (opening in long wall at 60 minutes) -0.8 0.0 46340 203 46543 -1.5 -0.8 9132 512 135 29 9808 -2.3 -1.5 5157 440 131 51 26 12 5817 -3.1 -2.3 2139 236 75 32 23 16 11 7 2539 -3.8 -3.1 651 93 11 3 2 2 1 5 4 772 -4.6 -3.8 217 42 12 0 2 273 -5.4 -4.6 66 14 4 1 85 -6.1 -5.4 18 2 1 21 -6.9 -6.1 6 6 -7.7 -6.9 4 4
total 63730 1542 368 117 53 28 13 8 5 4 65868 Range 0.7 1.4 2.0 2.7 3.4 4.1 4.8 5.4 6.1 6.8 Mean (kPa) 0.0 0.7 1.4 2.0 2.7 3.4 4.1 4.8 5.4 6.1 total (c) Winnellie Building 5-5 orient 25 (no dominant opening) -0.7 0.0 37852 15 37867 -1.4 -0.7 10708 404 59 5 11176 -2.0 -1.4 6779 550 152 38 8 1 7528 -2.7 -2.0 3024 346 108 41 33 20 5 3577 -3.4 -2.7 940 147 37 12 9 5 6 8 2 2 1168 -4.1 -3.4 257 41 9 3 1 2 313 -4.8 -4.1 93 17 6 5 121 -5.4 -4.8 21 3 24 -6.1 -5.4 8 1 9 -6.8 -6.1 3 3
total 59685 1524 371 104 50 26 12 8 4 2 61786
Page 205 of 207
D.2 Cyclone Vance
In 1999, Cyclone Vance hit Exmouth in Western Australia, with wind speeds up to 70m/s, similar to
those estimated from Cyclone Tracy. The maximum winds from Cyclone Vance did not pass over
Exmouth, as its track was to the east of the town. Section 6.1 details the track and wind speed record
of the cyclone.
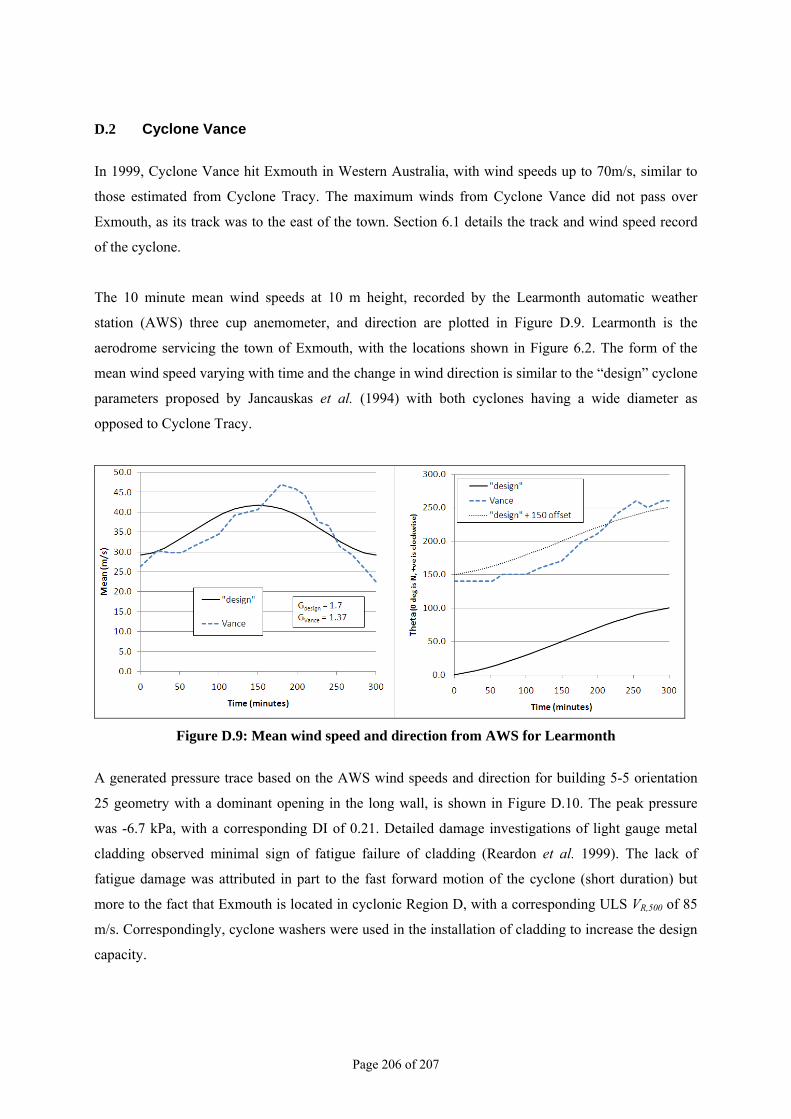
The 10 minute mean wind speeds at 10 m height, recorded by the Learmonth automatic weather
station (AWS) three cup anemometer, and direction are plotted in Figure D.9. Learmonth is the
aerodrome servicing the town of Exmouth, with the locations shown in Figure 6.2. The form of the
mean wind speed varying with time and the change in wind direction is similar to the “design” cyclone
parameters proposed by Jancauskas et al. (1994) with both cyclones having a wide diameter as
opposed to Cyclone Tracy.
Figure D.9: Mean wind speed and direction from AWS for Learmonth
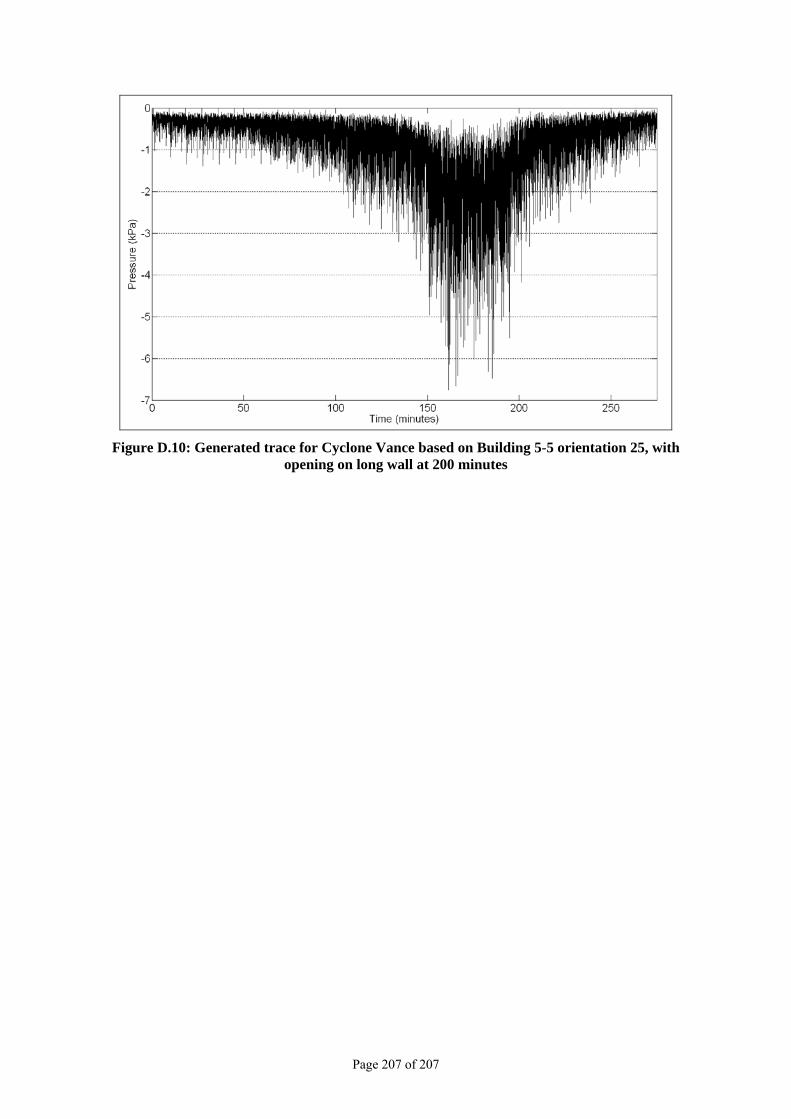
A generated pressure trace based on the AWS wind speeds and direction for building 5-5 orientation
25 geometry with a dominant opening in the long wall, is shown in Figure D.10. The peak pressure
was -6.7 kPa, with a corresponding DI of 0.21. Detailed damage investigations of light gauge metal
cladding observed minimal sign of fatigue failure of cladding (Reardon et al. 1999). The lack of
fatigue damage was attributed in part to the fast forward motion of the cyclone (short duration) but
more to the fact that Exmouth is located in cyclonic Region D, with a corresponding ULS VR,500 of 85
m/s. Correspondingly, cyclone washers were used in the installation of cladding to increase the design
capacity.
Page 206 of 207
Page 207 of 207
Figure D.10: Generated trace for Cyclone Vance based on Building 5-5 orientation 25, with opening on long wall at 200 minutes