hemina skin rebuilding and reconditioning therapy ... · ichthyosis vulgaris by offering a package...
TRANSCRIPT

Hemina Skin Rebuilding and
Reconditioning Therapy: Treating Ichthyosis & Xerosis
Heyde Lopez Monica Sanders
Erin Sposato
Business Report March 2005
Executive Summary
The proposal of a package of moisturizers for treatment of ichthyosis vulgaris has been shown to be unprofitable because of high ingredient cost. The package consists of three separate products which function differently but collectively to treat a common skin disorder. The equipment cost and FCI are $0.0765 million and $0.42 million, respectively. The TCI for the project is $0.499 million. Utilities and operating labor costs are $0.004 million and $0.240 million. Total annual product cost (TPC) is entirely dependent on raw material cost due to the extremely high cost of one particular ingredient, ceramide. The optimum formulation gives a TPC of $58 million/yr while a formulation of decreased raw material cost formulation gives $14 million/yr. These costs give a NPW of -$219 million and -$26 million for the optimum formulation and decreased raw material cost formulation, respectively, if sold at $50/package. When the package is sold at $90/package, the decreased raw material cost formulation has a positive NPW of $1.5 million. Even sold at the higher price, profit decreases per year.
The package exists as a process in that there are steps to follow to reach the desired
objective. A Pre-Shower Lotion is introduced to shed the dead skin layers that characterized the disorder. A Shower Gel is then offered to replace naturally-occurring components of the skin that are known to absorb water, both from the inside of the body and from the outside environment. The last product, an After-Shower Lotion, restores the lipid barrier present in the skin that works to hold moisture in the skin. Using these products in succession creates a system of restoration that will provide the consumer relief from the symptoms of the disorder.
Hemina, Inc. is a small development company that has pledged to improve the
physical state of ichthyosis patients nationwide. Experienced members of management have worked to create the ideal formulation of the package that will give hope to patients suffering with dry, scaly skin. The company intends on using consumer feedback and research to further develop the package. The package will be sold locally at $90/package, although lower prices were considered. Once the product is perfected, Hemina, Inc. expects to sell the formulation to a large company for nationwide sales.
The formulation was created based on extensive understanding of the structure and
function of the skin and its components. A diffusion model of chemicals into the skin was used to determine the relationship between the concentrations of a chemical that reaches the inner layers of the skin with the concentration that is applied. Active ingredients were chosen based on the desired function of the product. Complementary ingredients were added to give physical properties that are important when creating a consumer product. The manufacturing process was designed based on the phase properties of the ingredients. Cost analysis was then preformed to asses the product.
Business Plan March 2005 1

TABLE OF CONTENTS 1. Introduction ................................................................................................................... 4
1.1 Objectives ................................................................................................................. 4 1.2 Future........................................................................................................................ 4
2. The Product .................................................................................................................. 4 2.1 Skin Background...................................................................................................... 5 2.2 Ichthyosis Vulgaris .................................................................................................. 5 2.3 Current Treatment of Ichthyosis Vulgaris ............................................................. 6 2.4 Package Proposal..................................................................................................... 6
2.4.1 Package Ingredients .................................................................................................. 7 2.4.2 FDA Regulations.................................................................................................... 8
3. Marketing ...................................................................................................................... 9 3.1 Target Audience....................................................................................................... 9 3.2 Distribution and Advertising .................................................................................. 9
4. Manufacturing ............................................................................................................. 10 4.1 Equipment and PFD ............................................................................................. 10 4.2 Delivery Systems .................................................................................................... 12
4.2.1 Liposomes .................................................................................................................... 12 4.2.2 Microemulsion....................................................................................................... 12
5. Economic Analysis ..................................................................................................... 14 5.1 Determination of Demand .................................................................................... 15 5.2 Market Trends ....................................................................................................... 15 5.3 Raw Material Costs................................................................................................ 15
5.3.1 Optimal Formulation ............................................................................................. 16 5.3.2 Decreased Raw Material Cost Formulation ................................................................ 16
5.4 Product Pricing ...................................................................................................... 17 5.4.1 Optimal Formulation ............................................................................................. 18 5.4.2 Decreased Raw Material Cost Formulation ................................................................ 19
5.5 Capital Investment ................................................................................................ 19 5.6 Utilities Cost........................................................................................................... 19 5.7 Operating Labor Costs .......................................................................................... 20 5.8 Annual Total Product Cost ................................................................................... 20
5.8.1 Optimal Formulation ............................................................................................. 20 5.8.2 Decreased Raw Material Cost Formulation ................................................................ 21
5.9 Cost Evaluation...................................................................................................... 21 5.9.1 Optimal Formulation ............................................................................................. 22 5.9.2 Decreased Raw Material Cost Formulation ................................................................ 23
5.10 Risk ....................................................................................................................... 27

TABLE OF FIGURES Table 1: Pre-Shower Lotion Ingredients and Compositions……………..…………………….…......7 Table 2: Shower Gel Ingredients and Compositions…..……………………………………….……8 Table 3: After-Shower Lotion Ingredients and Compositions……………………………………….8 Figure 1: Process PFD……………………………………………………………………………..10 Table 4. Equipment Cost…………………………………………………………………………..11 Figure 2. Formation of Lipid Delivery Vehicle……………………………………………………..13 Table 5: Pre-Shower Production Timeline with Ingredients in Weight Percentage…………………14 Table 6: Raw Material Cost per Product for Optimal Formulation…………………………..……..16 Table 7: Pre-Shower Lotion Ingredients and Compositions with Decreased Raw Material Cost
Formulation……………………………………………………………………......................16 Table 8: Shower Gel Ingredients and Compositions with Decreased Raw Material Cost
Formulation………………………………………………………………………………...17 Table 9: After-Shower Lotion Ingredients and Compositions with Decreased Raw Material Cost
Formulation………………………………………………………………………………...17 Table 10: Raw Material Cost per Product with Decreased Raw Material Cost
Formulation….........................................................................................................................................17 Table 11: Competition Prices Compared to Hemina……………………………………………....18 Table 12: Product Value with Optimal Formulation………………………………………………19 Table 13: Product Value with Decreased Raw Material Cost Formulation…………………..............19 Table 14: Utilities Cost…………………………………………………………………………….20 Table 15: Total Product Cost without Depreciation of Optimal Formulation……………………...21 Table 16: Total Product Cost without Depreciation of Decreased Raw Material Cost
Formulation………………………………………………………………………….............21 Table 17: Capital Investment Cost (million $)………………………………………………............22 Table 18: 3-Year MACRS Depreciation in million $...................................................................................22 Table 19: Annual Costs & Profits of Optimal Formulation at $50/Package ($ million)……………23 Table 20: Annual Costs & Profits of Decreased Raw Material Costs Formulation at $50/Package ($
million)……………………………………………………………………………………...24 Table 21: Annual Costs & Profits of Decreased Raw Material Costs Formulation at $90/Package
($ million)…………………………………………………………………………………....25 Figure 3: Profit Comparison of the Formulations with a Selling Price of $50/Package…………….25 Figure 4: Cash Flow Comparison of the Formulations with a Selling Price of $50/Package................26 Figure 5: Profit Comparison of the Formulations with a Selling Price of $90/Package…………….26 Figure 6: Cash Flow Comparison of the Formulations with a Selling Price of $90/Package………..27 Table 22: Percent Total Cost of Components in Pre-Shower Lotion………………………………28 Table 23: Percent Total Cost of Components in Shower Gel………………………………………28 Table 24: Percent Total Cost of Components in After-Shower Lotion……………………………..29 Table 25: Development of Scenarios in Ammonium Lactate………………………………………29 Figure 7: Risk Analysis of Pre-Shower Active Ingredient Ammonium Lactate……………………..30 Table 26: Best Scenario for Ammonium Lactate…………………………………………………...30 Table 27: Best Scenario for Pre-Shower Lotion……………………………………………………31
Business Plan March 2005 3
1. Introduction
Hemina, Inc. is a small development company working to improve products in the
skin care industry. Currently, there are three members of management working to develop
the products and processes. All three members are chemical engineering graduates from the
University of Oklahoma. These members have used their experience and knowledge to
improve products in the skin care industry. Expansion is expected to fulfill needs in areas of
marketing, research, and production.
1.1 Objectives
Hemina, Inc. is committed to improving symptomatic conditions for patients with
ichthyosis vulgaris by offering a package of moisturizing treatments. These patients incur
significant amounts of discomfort from the incurable disorder. Current treatments are
limited in their functions and we intend to set our product apart from others by offering a
system of treatments, that when employed, will restore the patient’s skin to a more natural
and balanced state.
1.2 Future
Future plans include further development of the package. The package is still in
preliminary stages and more research and testing must be undertaken in order to best
accommodate the consumer. Hemina, Inc. intends to use local sales of the protocol as
funding and as a source of consumer preference information. Once the product is
perfected, after approximately 5 years, Hemina, Inc. intends to sell the final product to a
larger company, which will then introduce it into the national market.
2. The Product
The product is a package designed as a process of treatment for patients suffering
from the hereditary skin disorder, ichthyosis vulgaris. Patients suffering from this disorder
experience mild to severe scaling of the skin due to buildup of dead skin layers on the
surface of the skin. Current treatment of this disorder involves symptomatic management as
there is currently no cure for the disorder. Our package consists of three individual
products: a pre-shower lotion, a shower gel, and an after shower lotion. Each individual
Business Plan March 2005 4

product performs separate tasks that will collectively restore the damaged skin to a more
balanced state. The design is focused on active ingredient function and consumer aesthetics.
The combination of the three products is intended to improve skin conditions above and
beyond other current products on the ichthyosis market.
2.1 Skin Background
The skin is the largest organ of the body. It exists as a barrier to prevent water loss,
along with many other roles such as protection, regulation of body temperature, wound
repair, and perception of sensations. Hydration of the skin is very important and is
governed by three factors:
- Desquamation – the shedding of the top layer of dead skin cells. This is a
natural process that occurs constantly in normal skin and usually goes unnoticed
because such small amounts are sloughing at a given time
- Natural Moisturizing Factors (NMF) – components normally present in the cells
of the top layer of the skin. These components retain water inside the cells and
intercellular space.
- Lipid barrier – the lipid barrier is a complex matrix that exists in the intercellular
space in the top layer of the skin. The hydrophobic barrier prevents water from
diffusing out into the environment.
2.2 Ichthyosis Vulgaris
Ichthyosis vulgaris is one of many forms of the family of ichthyotic disorders. These
disorders are characterized by dry, scaly skin. They are primarily hereditary disorders that
currently have no cure. Ichthyosis vulgaris is caused by a genetic defect in the expression of
a protein that is the precursor to NMF components of the skin that absorb moisture in the
skin. Without these NMF components, the skin is not as capable of retaining moisture
which leads to poor hydration. Poor hydration leads to the buildup of dead skin layers on
the surface of the skin which crack and form clumps that come off as scales.
Business Plan March 2005 5
2.3 Current Treatment of Ichthyosis Vulgaris
Treatments for ichthyoses are symptomatic treatments that work to rehydrate the
skin. Many of these treatments exist as topically applied moisturizers. It is recommended to
use occlusive moisturizers directly after bathing to “seal in” the moisture obtained from the
bath. Many occlusive agents such as petroleum jelly are recommended to coat the skin and
prevent water loss. The best occlusive agents are in the form of ointments. The drawback
of this treatment is that occlusive moisturizers tend to be thick and greasy. Greasy lotions
are inconvenient to the patient because they cannot be applied and left on the skin without
causing problems like staining clothing. Other ingredients of moisturizers hold water to
themselves and diffuse into the skin, consequently rehydrating the skin. Ingredients such as
urea, ammonium lactate, sodium lactate, sorbitol, pyrrolidone carboxylic acid, and propylene
glycol function in this manner. There are many lotions on the market that use one of these
as an active ingredient in high concentration. Keratolytic agents, such as lactic acid, salicylic
acid, and propylene glycol, are also currently being used in moisturizers to help the shedding
of dead skin cells. It is important when using keratolytic agents, to pay close attention to the
concentration, as high concentrations cause irritation.
2.4 Package Proposal
In order to effectively restore the skin, we have proposed a system of moisturizers
incorporating knowledge of the components of the skin and their function with
understanding of how water diffuses through the skin. There are three individual products
included in the package. Since the products are designed to be cosmetics, the FDA does not
regulate the development of the package. Certain ingredients such as alpha hydroxy acids
are limited by their concentration amounts.
1. Pre-Shower Lotion – a lotion that promotes shedding of the scaly, dead skin
2. Shower Gel – a gel that cleanses as well as adds water absorbing components
called natural moisturizing factors (NMF) that exist abundantly in normal skin.
Ichthyotic skin lacks NMF which causes a reduced level of hydration.
3. After-Shower Lotion – a lotion that is meant to replace the barrier lipids, thereby
restoring the matrix so that the skin can retain the water that it absorbs into the
skin. There are also actives that are intended to hydrate and smooth the skin.
Business Plan March 2005 6

With this package, a process is developed that will better restore the skin to a
balanced state. The dead skin that has built up will first be loosened and removed with the
pre-shower lotion. Some form of scrubbing tool (i.e. loofah, pumice stone) will be
recommended to facilitate removal of these cells. Then actives in the shower gel replace the
NMF enhancing the ability of the skin to absorb water. The after-shower lotion contains
actives that replace barrier lipids, restoring the matrix that prevents water loss. Also the
after-shower leaves the skin smooth and soft, which is aesthetically pleasing to the
consumer.
2.4.1 Package Ingredients
The package consists of one 16 oz Pre-Shower Lotion, one 20 oz Shower Gel, and
one 16 oz After-Shower Lotion. The following tables represent the formulations that were
designed to achieve the best results. Table 1, 2, and 3 represent the percentage of each
ingredient in the Pre-Shower Lotion, Shower Gel and After-Shower Lotion, respectively. Table 1: Pre-Shower Lotion Ingredients and Compositions
Material Weight % in Pre-Shower Lotion Deionized Water 60
Ammonium Lactate 10 Retinyl Palmitate (Vitamin A Palmitate) 5
Jojoba Oil 8 Cetyl Alcohol 2.9
Phenoxyethanol 0.196 Octyldodecanol 5.9
Maleic Acid 0.004 PEG 8
Business Plan March 2005 7
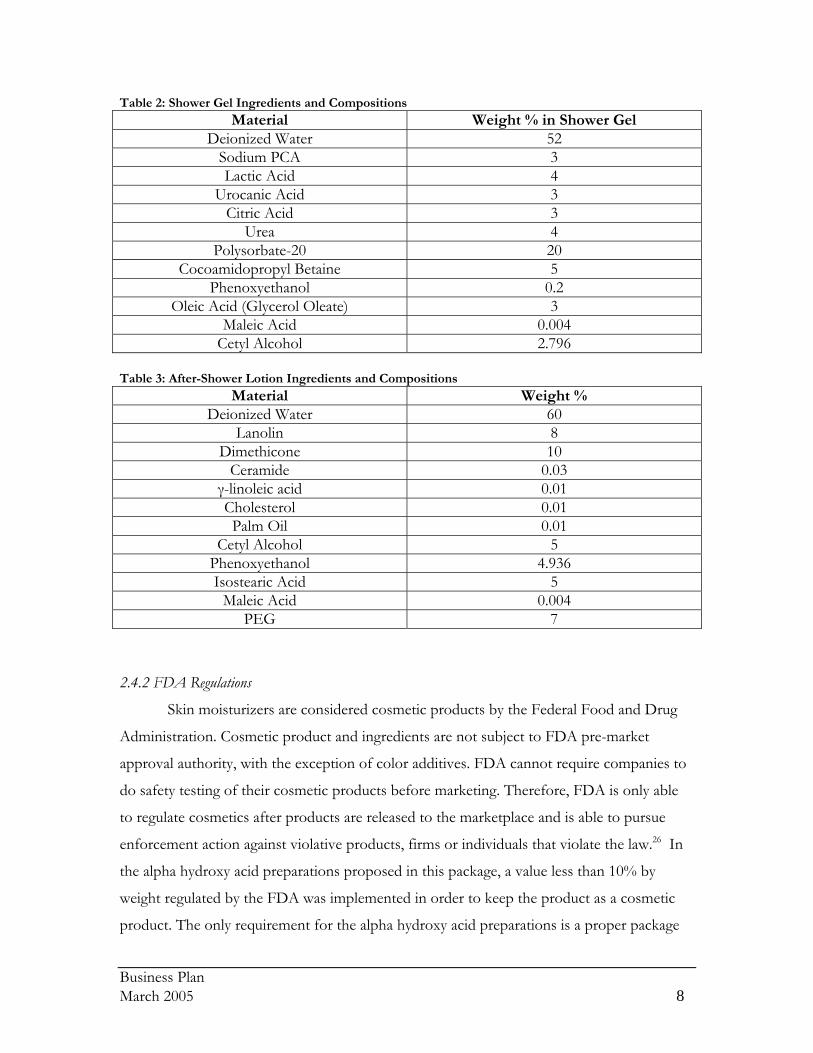
Table 2: Shower Gel Ingredients and Compositions Material Weight % in Shower Gel
Deionized Water 52 Sodium PCA 3 Lactic Acid 4
Urocanic Acid 3 Citric Acid 3
Urea 4 Polysorbate-20 20
Cocoamidopropyl Betaine 5 Phenoxyethanol 0.2
Oleic Acid (Glycerol Oleate) 3 Maleic Acid 0.004
Cetyl Alcohol 2.796 Table 3: After-Shower Lotion Ingredients and Compositions
Material Weight % Deionized Water 60
Lanolin 8 Dimethicone 10
Ceramide 0.03 γ-linoleic acid 0.01 Cholesterol 0.01 Palm Oil 0.01
Cetyl Alcohol 5 Phenoxyethanol 4.936 Isostearic Acid 5
Maleic Acid 0.004 PEG 7
2.4.2 FDA Regulations
Skin moisturizers are considered cosmetic products by the Federal Food and Drug
Administration. Cosmetic product and ingredients are not subject to FDA pre-market
approval authority, with the exception of color additives. FDA cannot require companies to
do safety testing of their cosmetic products before marketing. Therefore, FDA is only able
to regulate cosmetics after products are released to the marketplace and is able to pursue
enforcement action against violative products, firms or individuals that violate the law.26 In
the alpha hydroxy acid preparations proposed in this package, a value less than 10% by
weight regulated by the FDA was implemented in order to keep the product as a cosmetic
product. The only requirement for the alpha hydroxy acid preparations is a proper package
Business Plan March 2005 8

labeling.39 Proper labeling implies that the product ingredients must be listed sequentially in
the order of highest concentration without reporting the actual concentrations. FDA does
not have the authority to require manufacturers to register their cosmetic establishments, file
data on ingredients, or report cosmetic-related injuries after the product has been marketed.
However, companies are encouraged to register their establishments and file Cosmetic
Product Ingredient Statements with FDA's Voluntary Cosmetic Registration Program
(VCRP).26
3. Marketing
Marketing a product such as this one is a difficult task as there are hundreds of
treatments out there that are already being used. Also, we are immediately concerned with
marketing a trial product with intentions of changing the formulation based on consumer
preferences and cost analysis. Special tactics must be employed to market the product as a
work-in-progress.
3.1 Target Audience
Hemina, Inc. has an overall target objective to obtain 15% of the national market for
patients affected with ichthyosis vulgaris which currently equals approximately 150,000
people. To reach this goal, Hemina, Inc.’s initial target audience is to provide products and
services to the Central Midwest which includes Oklahoma, Texas, Arkansas, Missouri and
Kansas. This is the audience that we will target while developing the final product. We will
use consumer feedback and research to aid in this development. With the assumption that
the Central Midwest represents 10% of the total market of ichthyosis vulgaris affected
individuals, the initial target audience is about 15,000 people.
3.2 Distribution and Advertising
To introduce our product to our audience, free samples of each product will be
distributed to patients on registration lists for ichthyosis organizations such as The National
Registry for Ichthyosis and Related Disorders and The Foundation for Ichthyosis and
Related Skin Types. The products will also be advertised on the websites for ichthyosis and
skin disease related websites. It is impractical to use conventional forms of advertising such
Business Plan March 2005 9
as magazines and commercials since our production is low and we are still developing the
product.
4. Manufacturing
The manufacturing of cosmetic lotions is a simple process. The process involves
simple equipment and batch mixing procedures. There are two phases involved in the
production of lotions and gels: aqueous and oil phase. The process involves heating and
mixing the two phases separately and then combining the two phases into one batch.
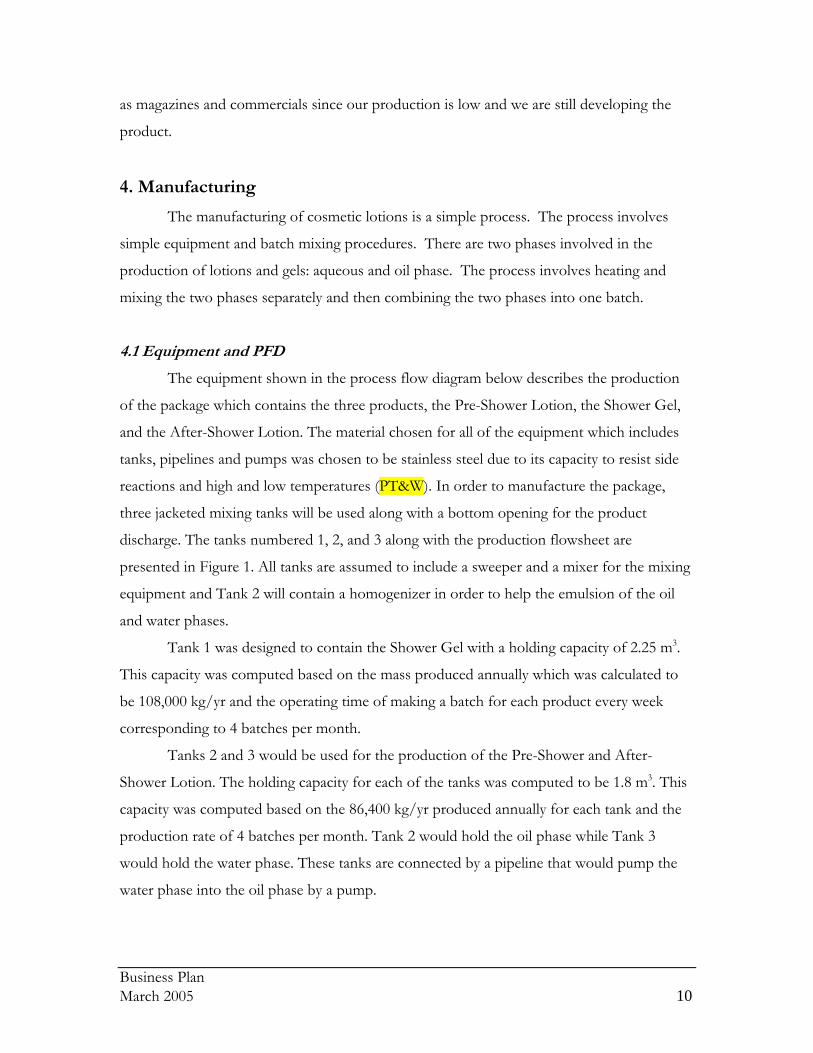
4.1 Equipment and PFD
The equipment shown in the process flow diagram below describes the production
of the package which contains the three products, the Pre-Shower Lotion, the Shower Gel,
and the After-Shower Lotion. The material chosen for all of the equipment which includes
tanks, pipelines and pumps was chosen to be stainless steel due to its capacity to resist side
reactions and high and low temperatures (PT&W). In order to manufacture the package,
three jacketed mixing tanks will be used along with a bottom opening for the product
discharge. The tanks numbered 1, 2, and 3 along with the production flowsheet are
presented in Figure 1. All tanks are assumed to include a sweeper and a mixer for the mixing
equipment and Tank 2 will contain a homogenizer in order to help the emulsion of the oil
and water phases.
Tank 1 was designed to contain the Shower Gel with a holding capacity of 2.25 m3.
This capacity was computed based on the mass produced annually which was calculated to
be 108,000 kg/yr and the operating time of making a batch for each product every week
corresponding to 4 batches per month.
Tanks 2 and 3 would be used for the production of the Pre-Shower and After-
Shower Lotion. The holding capacity for each of the tanks was computed to be 1.8 m3. This
capacity was computed based on the 86,400 kg/yr produced annually for each tank and the
production rate of 4 batches per month. Tank 2 would hold the oil phase while Tank 3
would hold the water phase. These tanks are connected by a pipeline that would pump the
water phase into the oil phase by a pump.
Business Plan March 2005 10

Figure 1: Process PFD
Additional equipment includes a colloid mill to decrease the particle size, a bath
sonicator to produce the liposomes, a homogenizer to assist in the emulsion and a pump to
push the product through the colloid mill. Table 19 summarizes the equipment costs.
Table 4. Equipment Cost
Equipment Cost ($) Tank 1: Shower Gel 15,800
Tank 2: Lotion 14,000 Tank 3: Lotion 14,000
Colloid Mill 15,000 Bath Sonicator 800 Homogenizer 11,500
2 Pumps 5,500 Total Equipment Cost $76,500
Business Plan March 2005 11
4.2 Delivery Systems
To enhance the diffusion of the active ingredients through the skin, delivery systems
are used. Many delivery system technologies are currently available. Two of these systems
were chosen after extensive analysis of these available systems, liposomes and
microemulsions.
4.2.1 Liposomes
The liposome delivery system was chosen since it is simpler and cheaper to
manufacture in the industry. The key elements in the production of liposomes according to
the innovative process by the department of physics and DEAS at the University of
Harvard, include the organic continuous phase coating, the sonicator and the colloid mill.57
On the other hand, technologies as the spheres and capsules require extra filtering material
as well as more specialized ingredients when making the vehicle that would increase the total
product cost. In the package proposed, the colloid mill setting would be adjusted to obtain a
particle size of 0.5nm which would use the microemulsion technology. A multiple emulsion
was not chosen since the number of ingredients in the formulation is insufficient to divide
the oil and water phases in more phases. The nanoemulsion technology was not chosen
since the equipment to reach the desired particle size would be very expensive to buy.
Today several techniques are being used in how to manufacture liposomes. Some of
these include reverse evaporation, sonication, swelling and electro-swelling. For the project,
the innovative procedure proposed by Sophiet Pautot and David A. Weizt from the
department of physics and DEAS at the University of Harvard was chosen. This new
process called the engineering large unilamellar vesicles with high encapsulation yield
proposes an inverted emulsion along with general emulsification techniques as implementing
a colloid mill and sonicator into the process.
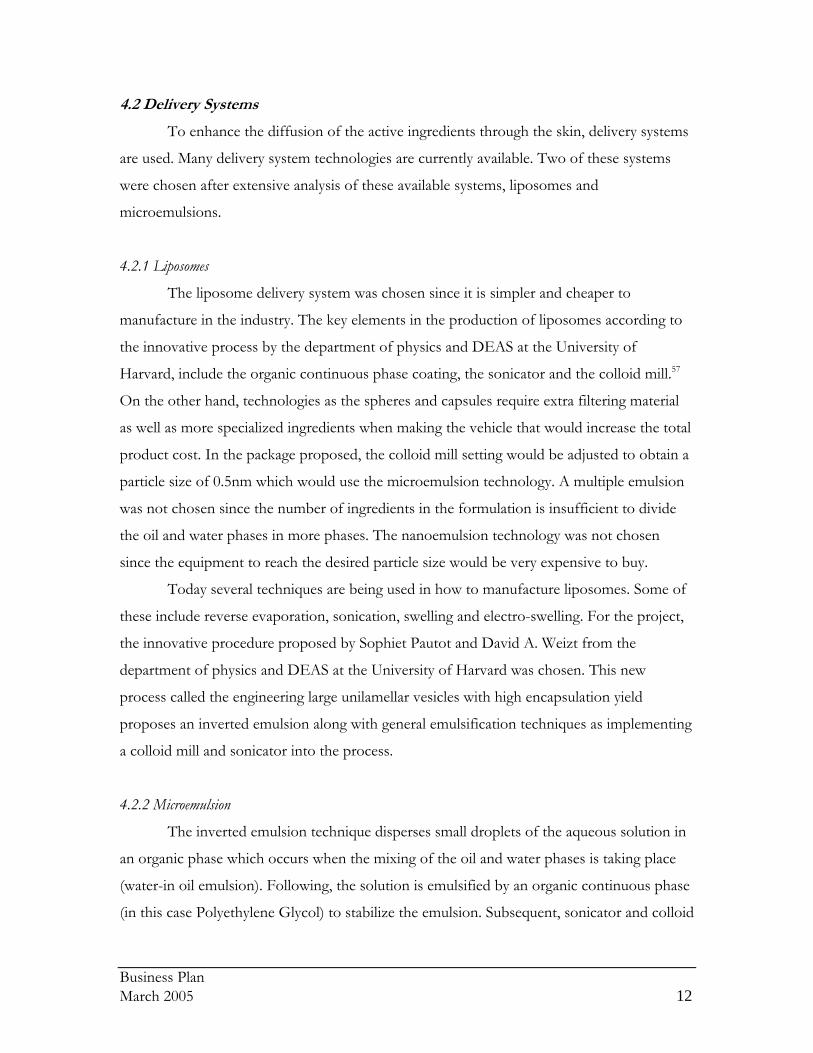
4.2.2 Microemulsion
The inverted emulsion technique disperses small droplets of the aqueous solution in
an organic phase which occurs when the mixing of the oil and water phases is taking place
(water-in oil emulsion). Following, the solution is emulsified by an organic continuous phase
(in this case Polyethylene Glycol) to stabilize the emulsion. Subsequent, sonicator and colloid
Business Plan March 2005 12
mill apparatus are used to control the size of the emulsion and the encapsulation yield of the
active ingredient. Finally, to complete the bilayer of the liposome, the inverted emulsion
droplets are allowed to settle across the surfactant layer between the oil and water phases
following to the completion of the second lipid bilayer.57
Figure 2: Formation of Lipid Delivery Vehicle57
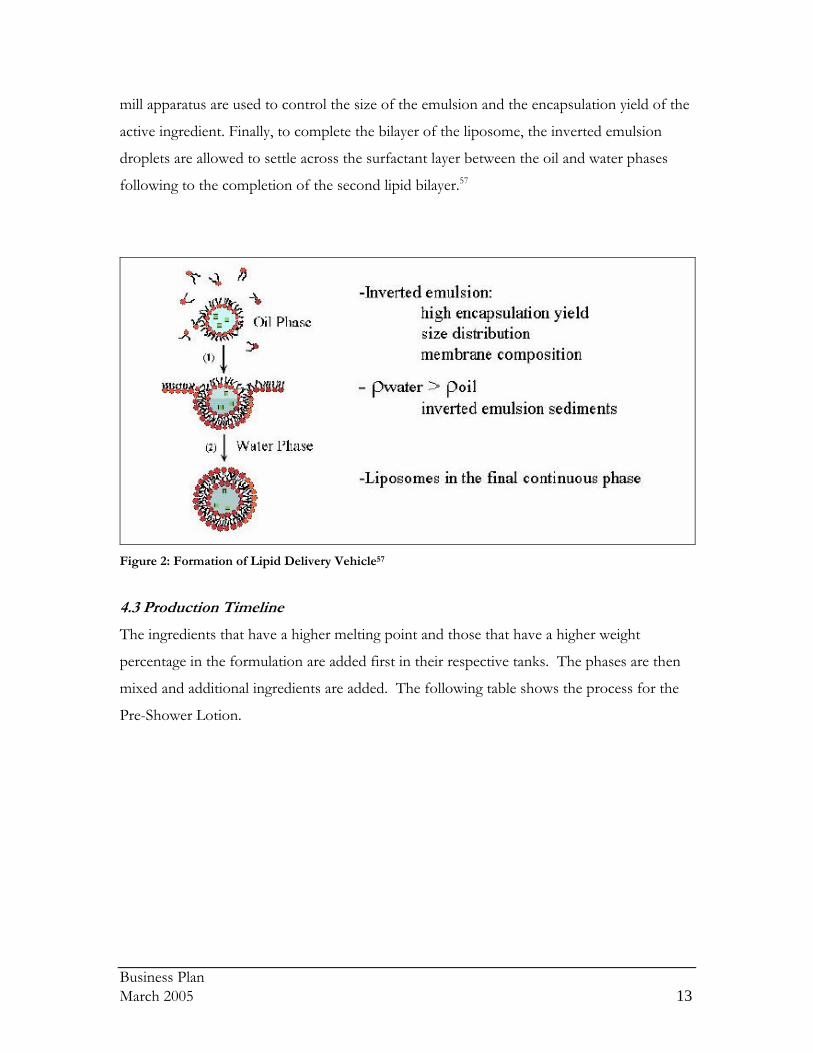
4.3 Production Timeline
The ingredients that have a higher melting point and those that have a higher weight
percentage in the formulation are added first in their respective tanks. The phases are then
mixed and additional ingredients are added. The following table shows the process for the
Pre-Shower Lotion.
Business Plan March 2005 13
Table 5: Pre-Shower Production Timeline with Ingredients in Weight Percentage
Phase A- Oil phase Add Jojoba Oil 8 Mix Turn sweeper and mixer on Heat Up to 54-56 Add Cetyl Alcohol 2.9 Cool Stop heating cool to less than 40 C Add Retinyl palmitate 8
Phase B- Water phase Add Deonized water 60 Add Ammonium Lactate 10
Mixing Phases Add Phase A- Oil phase to Phase B-water phase
Constant and steady rate Homogenize for 15-20 min
Add Octyldodecanol 2.9 Add PEG-4 8 Tranfer Move to sonicator for 15-20 min Add Phenoxyethanol 0.196 Add Maleic acid to adjust pH 0.004
5. Economic Analysis
A significant consideration to the development of the final product is the
economically feasibility of the project as a whole. Factors such as anticipated demand and
market trends comprise the assessment of economic worth. The largest contributor to this
economic evaluation is the price of raw materials. Certain ingredients in the formulation are
expensive and must be minimized without affecting the efficacy of the product. Based on
the product costs, package pricing must be considered and made comparable to current
treatments on the market. Net present worth estimation will be used to evaluate the
profitability of the project and development of the final product. Several factors are
necessary to obtain net present worth including capital investment, utilities and operating
labor costs and annual product costs. To obtain a more accurate net present worth, risk
assessment must be performed.
Business Plan March 2005 14

5.1 Determination of Demand
The amount of products to be produced was determined based upon an estimated
demand for the product. Assuming that 15% of the approximately 10% of people affected
with Ichthyosis Vulgaris in the Central Midwest will purchase the package, the demand
would be about 15,000 people. The product was formulated to last one month. Thus, the
demand for the product was estimated to be 180,000 packages sold per year. This is
equivalent to 2.88 million oz of each of the lotions and 3.6 million oz of the shower gel.
5.2 Market Trends
Ichthyosis patients of all forms make up over one million people in the United States
per year. It has also been found that 16,000 babies are born per year with one of the forms
of this family of disorders. Since there is no cure for ichthyosis, it is unlikely that patients will
no longer need a product to treat the disorder. Assuming that the number of people
affected by ichthyosis remains constant, the demand should never decrease. The only case
in which demand would decrease results from unfavorable response from the patients using
our product. Since we are planning to consider consumer feedback to improve the product,
we will assume that demand will not decrease. With favorable response, the demand could
increase to more than the anticipated value.
5.3 Raw Material Costs
The raw material costs were determined from Peters, Timmerhaus & West76 and the
catalogs of Aldrich, FisherSci and Sigma-Aldrich. The mass produced per bottle for each
ingredient was calculated by multiplying the percent of the ingredient by the amount in
weight of the 16oz and 20oz bottles. The amount in weight was calculated by assuming that
the ingredients had an approximate density similar to water. The annual mass produced was
calculated by multiplying the mass produced per bottle and the annual demand. The volume
produced per bottle for each ingredient was estimated by multiplying the percent of the
ingredient by the volume of the corresponding bottle. The annual volume produced was
calculated by multiplying the volume produced per bottle and the annual demand. The use
of volume or mass was determined by whether volume or mass was given for the ingredient
Business Plan March 2005 15

cost in the product catalog. The raw materials costs were then added for each product for a
total package cost.
5.3.1 Optimal Formulation
The formulations specified in Tables 1, 2 and 3 in 3.4.1 yielded a raw material cost that was
greater than the product value. The raw material cost for the package was $51.62 million
dollars. Table 6 breaks down these costs into the individual products.
Table 6: Raw Material Cost per Product for Optimal Formulation
Cost (million $/yr) Pre-Shower Lotion 6.99
Shower Gel 8.90 After-Shower Lotion 35.62
Total Package 51.62 5.3.2 Decreased Raw Material Cost Formulation
In order to obtain a more positive or less negative net present worth, the raw
material cost must be reduced. Reducing this cost meant using less of the more expensive
and, unfortunately, more effective ingredients, which reduced the quality of the product.
Tables 7, 8, and 9 show these adjustments and the new composition for each product.
Table 7: Pre-Shower Lotion Ingredients and Compositions with Decreased Raw Material Cost Formulation
Material Weight % in Pre-Shower
Lotion % Change
Deionized Water 70 +10 Ammonium Lactate 10 0
Retinyl Palmitate (Vitamin A Palmitate) 4 -1
Jojoba Oil 4 -4 Cetyl Alcohol 3 +0.1
Phenoxyethanol 0.196 -0.8 Octyldodecanol 5.9 +3.9
Maleic Acid 0.004 0 PEG 8 2
Business Plan March 2005 16

Table 8: Shower Gel Ingredients and Compositions with Decreased Raw Material Cost Formulation Material Weight % in Shower Gel % Change
Deionized Water 60 +8 Sodium PCA 2 -1 Lactic Acid 4 0
Urocanic Acid 0.8 -2.2 Citric Acid 2 -1
Urea 4 0 Polysorbate-20 20 0
Cocoamidopropyl Betaine 4.05 -0.95 Phenoxyethanol 0.5 +0.3
Oleic Acid (Glycerol Oleate) 1.25 -1.75 Maleic Acid 0.004 0
Cetyl Alcohol 1.396 -1.4 Table 9: After-Shower Lotion Ingredients and Compositions with Decreased Raw Material Cost Formulation
Material Weight % % Change Deionized Water 70 +10
Lanolin 13.993 +5.993 Dimethicone 4 -6
Ceramide 0.0015 -0.0285 γ-linoleic acid 0.0005 -0.0095 Cholesterol 0.0005 -0.0095 Palm Oil 0.0005 -0.0095
Cetyl Alcohol 2 -3 Phenoxyethanol 1 -3.936 Isostearic Acid 4 -1
Maleic Acid 0.004 0 PEG 5 -2
Using these formulations instead of the original formulations, the raw material cost
for the package decreased by almost $40 million, yielding a new package raw material cost of
$11.86 million. These costs are summarized in Table 10.
Table 10: Raw Material Cost per Product with Decreased Raw Material Cost Formulation
Cost (million $/yr) Change in Cost (million $/yr)
Pre-Shower Lotion 4.33 -2.66 Shower Gel 4.67 -4.23
After-Shower Lotion 2.86 -32.86 Total Package 11.86 -39.76
5.4 Product Pricing
Business Plan March 2005 17

It’s important to price the product as with competitor prices in mind. Our package
is naturally going to be priced higher than competing moisturizing lotions, since we have a
much larger product, in volume. Also, competing treatments tend to have one active that is
costly mixed with other ingredients that are typically used in lotions such as emollients and
thickeners. These ingredients are used because of their low raw material cost and good
efficacy, but the active is used for its function. Our initial product price is $50/package.
This seems competitive to other products on the market, as other products are comparable
when considering price per volume. The following table gives prices of competing lotions
recommended for ichthyosis patients found on a range of online pharmacies and compares it
to our package.
Table 11: Competition Prices Compared to Hemina
Lotion Size (oz) Price ($) Price ($/oz)
LactiCare 7.5 9 1.2
11.5 11.69-13.75 ~1.04
Carmol 10 6 8.99 1.5
Nutraderm 8 7.99 1.0
16 9.19-10 0.60
Lac Hydrin 5 w/ AHA 4 6.29-7.29 1.5
8 10.99-12.99 1.5
Hemina 52 50 1.5
5.4.1 Optimal Formulation
Selling the package at $50 each and distributing once per month yielded a product
value of $9.0 million dollars, which is over $42 million less than the package raw material
cost. Increasing the selling price to $90 only yields a product value of $16.2 million, which is
still over $35 million less than the package raw material cost. The actual profit will be lower
due to the higher product costs. These costs are summarized in Table 12.
Business Plan March 2005 18

Table 12: Product Value with Optimal Formulation
Selling Price per Package ($)
Product Value (million $/yr)
Profit based on Raw Material Cost only
(million $/yr) 50 9 -42.62 70 16.2 -35.42
5.4.2 Decreased Raw Material Cost Formulation
Selling the package at $50 still yields a product value less than the raw material cost by $2.86
million dollars. However, increasing the selling price to $90 per package yields a product
value of $16.2 million, which is $4.34 million above the raw material cost. Although the
actual profit will be lower due to higher product costs, this positive profit based on the raw
material cost only is nevertheless encouraging. These costs are summarized in Table 13.
Table 13: Product Value with Decreased Raw Material Cost Formulation
Selling Price per Package ($)
Product Value (million $/yr)
Profit based on Raw Material Cost only
(million $/yr) 50 9 -2.86 70 16.2 +4.34
5.5 Capital Investment
The capital investment was estimated using a fluid processing plant by percentage of
delivered equipment method. No construction or total product cost inflations were assumed
in these estimations although they were included in the cost evaluation. To calculate this
value the direct and indirect costs were estimated. The equipment cost was estimated to be
$0.0765 million. The fixed capital Investment (FCI) was estimated to be $424,000, the
working capital was estimated to be $75,000 and the total capital investment was estimated
to be $499,000.
5.6 Utilities Cost
The required utilities for this process are electricity and cooling water. The electricity
requirement was assumed to be 10,000 kWh based on expected plant area and local
electricity prices. This corresponded to an annual cost of $39,000. The cooling water
requirement was determined from the surface area of the tanks used for the lotions. The
height of both tanks was assumed to be 3m which yielded a surface area of 9.5m2 for each
Business Plan March 2005 19

tank. It was assumed that the water was flowing continuously throughout the jacket. For
both tanks the cooling water requirement was assumed to be 52,000 m3/yr, which
corresponded to a cost of $4000 per year. Table 14 shows the breakdown of these costs.
Table 14. Utilities Cost
Utility Cost/unit Annual requirement
(unit/yr) Annual Cost (million $/y)
Electricity $0.013/kWh 3,000,000 0.039 Jacket Water $0.08/m3 104,000 0.008
Total Utility Cost $0.047
5.7 Operating Labor Costs
Using Table 6-15 in PT&W76, the labor index was found and extrapolated linearly to
find the cost for 2005 which was $37.94/hr. There will be 2 operators per shift and 1 shift
per day. Operating time consists of 3 days per week, working 16 hours per day and 2 days
per week, working 8 hours per day. This corresponds to an annual operating labor cost of
$240,000.
5.8 Annual Total Product Cost
Total product cost is dependent on raw material cost along with additional
potentially variable expenses such as operating labor, utilities, and maintenance and repairs.
Also, fixed charges such as rent and taxes affect the total product cost. Lower product costs
give better profit and so it is important to keep it as low as possible. The formulation that
was originally designed based on optimal formulation. Then, the formulation was altered in
order to obtain lower product cost for later comparison.
5.8.1 Optimal Formulation
The total product cost without depreciation was estimated to be $58.0 million dollars
for the optimal formulation. This cost was based on the raw materials cost of $51.6 million,
operating labor, operating supervision, utilities, maintenance and repairs, operating supplies,
laboratory charges and royalties. These costs represent a variable cost of $52.6 million. The
fixed charges include property taxes, a finance interest rate of 5% of the FCI and insurance
and were estimated to be $0.034 million. The general plant overhead was estimated to be
Business Plan March 2005 20

$0.168 million. The variable costs, fixed charges and the overhead cost represent the
manufacturing costs of $52.8 million. The general expenses included administrative costs,
distribution and selling and research and development and were estimated to be $5.3 million.
Table 15 summarizes these results.
Table 15. Total Product Cost without Depreciation of Optimal Formulation
Item Cost (million $/y) Raw Materials 51.616 Variable Costs 52.561 Fixed Charges 0.034
Plant Overhead 0.168 Manufacturing 52.763
General Expense 5.280 Total Product Cost without Depreciation 58.0
5.8.2 Decreased Raw Material Cost Formulation
The total product cost without depreciation for the decreased raw material cost
formulation was estimated to be $14.0 million. The raw material costs were reduced to $11.9
million which reduced the variable costs to $12.5 million. This yielded a manufacturing cost
of $12.7 million and reduced the general expenses to $1.3 million. Table 16 summarizes
these costs.
Table 16. Total Product Cost without Depreciation of Decreased Raw Material Cost Formulation
Item Cost (million $/y) Raw Materials 11.9 Variable Costs 12.5 Manufacturing 12.7
General Expense 1.3 Total Product Cost without Depreciation 14.0
5.9 Cost Evaluation According to estimates, the first three years will be used to build the process and will
start in the 4th year. Assuming a construction inflation rate of 2% per year, the fixed capital
investment will be $0.06 million for the start up year 1st year, $0.15 million in the 2nd year,
and $0.22 million in the 3rd year. Including this interest rate increases the fixed capital
investment to $0.44 million. Additionally, the working capital increases in the 2nd year but is
forecasted to be recovered in the 5th year of operation, the 8th year.
Business Plan March 2005 21

Assuming a total product cost inflation rate of 2% per year to take into account the
rising raw materials cost, the total capital investment is equal to the fixed capital investment
for the 1st and 2nd years. In the 3rd year the TCI is $0.30 million. The start-up cost in the 4th
year is $0.04 million which represents 10% of the FCI.
Assuming a 3 year MACRS depreciation rate, the depreciation for the 4th year is
$0.15 million, $0.19 million in the 5th year, $0.06 million in the 6th year and $0.03 million in
the 7th year. The total depreciation received is estimated to be $0.44 million over the 5-year
project life.
Since production will begin at full capacity in the 4th year of the project, annual sales
are estimated to stay constant at $9 million from the 4th year to the 8th year which equals $45
million for the length of the project.
Table 17 shows the capital investment costs for the first three years of the project.
Table 17. Capital Investment Cost (million $)
Year 1 Year 2 Year 3 Total
Fixed Capital Investment 0.06 0.15 0.22 0.44
Working Capital 0.08 0.08
Total Capital Investment 0.06 0.15 0.30 0.51
Table 18 shows the depreciation amounts for the project.
Table 18. 3-Year MACRS Depreciation in million $
Year 4 Year 5 Year 6 Year 7 Total
Depreciation Amount 0.15 0.19 0.06 0.03 0.44
5.9.1 Optimal Formulation
The extremely high raw material costs make this a very unprofitable process which is
shown by the negative net present worth (NPW). NPW for this process is -$219.8 million at
a discount rate of 8% per year.
The annual total product cost without including depreciation is $61.6 million in the
4th year and $66.7 million in the 8th year for a total product cost of $320.6 million for the life
of the project.
Business Plan March 2005 22
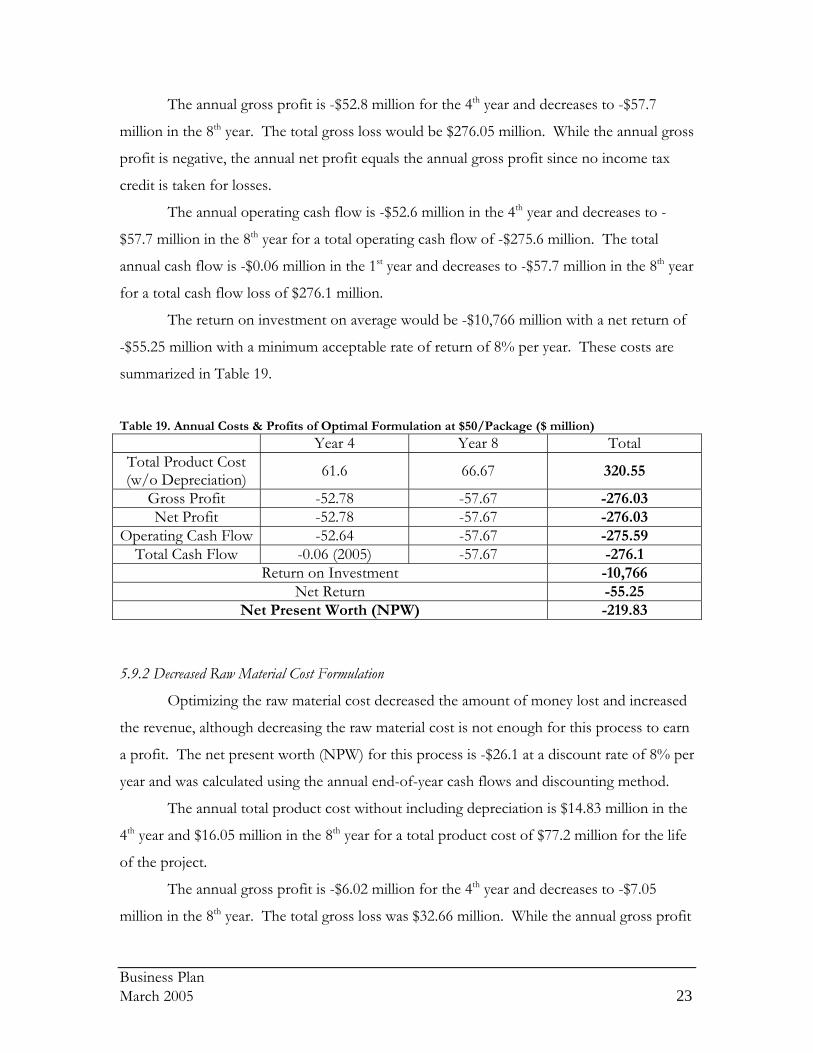
The annual gross profit is -$52.8 million for the 4th year and decreases to -$57.7
million in the 8th year. The total gross loss would be $276.05 million. While the annual gross
profit is negative, the annual net profit equals the annual gross profit since no income tax
credit is taken for losses.
The annual operating cash flow is -$52.6 million in the 4th year and decreases to -
$57.7 million in the 8th year for a total operating cash flow of -$275.6 million. The total
annual cash flow is -$0.06 million in the 1st year and decreases to -$57.7 million in the 8th year
for a total cash flow loss of $276.1 million.
The return on investment on average would be -$10,766 million with a net return of
-$55.25 million with a minimum acceptable rate of return of 8% per year. These costs are
summarized in Table 19.
Table 19. Annual Costs & Profits of Optimal Formulation at $50/Package ($ million)
Year 4 Year 8 Total Total Product Cost (w/o Depreciation) 61.6 66.67 320.55
Gross Profit -52.78 -57.67 -276.03 Net Profit -52.78 -57.67 -276.03
Operating Cash Flow -52.64 -57.67 -275.59 Total Cash Flow -0.06 (2005) -57.67 -276.1
Return on Investment -10,766 Net Return -55.25
Net Present Worth (NPW) -219.83
5.9.2 Decreased Raw Material Cost Formulation
Optimizing the raw material cost decreased the amount of money lost and increased
the revenue, although decreasing the raw material cost is not enough for this process to earn
a profit. The net present worth (NPW) for this process is -$26.1 at a discount rate of 8% per
year and was calculated using the annual end-of-year cash flows and discounting method.
The annual total product cost without including depreciation is $14.83 million in the
4th year and $16.05 million in the 8th year for a total product cost of $77.2 million for the life
of the project.
The annual gross profit is -$6.02 million for the 4th year and decreases to -$7.05
million in the 8th year. The total gross loss was $32.66 million. While the annual gross profit
Business Plan March 2005 23

is negative, the annual net profit equals the annual gross profit since no income tax credit is
taken for losses.
The annual operating cash flow is -$6.02 million in the 4th year and decreases to -
$7.05 million in the 8th year for a total operating cash flow of -$32.22 million. The total
annual cash flow is -$0.06 million in the 1st year and decreases to -$7.05 million in the 8th year
for a total cash flow loss of $32.74 million.
The return on investment on average would be -$1,274 million with a net return of -
$6.6 million with a minimum acceptable rate of return of 8% per year.
These values are summarized in the following table, Table 20.
Table 20. Annual Costs & Profits of Decreased Raw Material Costs Formulation at $50/Package ($ million)
2008 2012 Total Total Product Cost (w/o Depreciation) 14.83 16.05 77.18
Gross Profit -6.02 -7.05 -32.66 Net Profit -6.02 -7.05 -32.66
Operating Cash Flow -5.87 -7.05 -32.22 Total Cash Flow -0.06 (2005) -7.05 32.74
Return on Investment -1,274 Net Return -6.6
Net Present Worth (NPW) -26.08
Since the annual gross profit is positive, an income tax rate of 35% was applied
reducing the annual net profit. As Table 21 shows, the NPW is $1.5 million/yr.
Table 21: Annual Costs & Profits of Decreased Raw Material Costs Formulation at $90/Package ($ million)
Year 4 Year 8 Total Total Product Cost (w/o Depreciation) 14.9 16.1 77.5
Gross Profit 1.1 0.09 3.05 Net Profit 0.73 0.06 1.98
Operating Cash Flow 0.88 0.06 2.42 Total Cash Flow -0.06 (2005) 0.06 1.91
Return on Investment 77.4 Net Return 0.36
Net Present Worth (NPW) 1.52
Business Plan March 2005 24

The following figure compares the two formulations. As Figure 1 portrays, both
formulations have negative profits but the optimal formulation is significantly less profitable.
The chart also shows that the profit decreases with increasing years.
-60
-50
-40
-30
-20
-10
0P
rofi
t ($
/m
illio
n)
1 2 3 4 5 6 7 8
Year
Profit Comparison
Decreased RMC Formulation Gross ProfitDecreased RMC Formulation Net ProfitOptimal Formulation Gross ProfitOptimal Formulation Net Profit
Figure 3: Profit Comparison of the Formulations with a Selling Price of $50/Package The following chart compares the cash flow of the two formulations. As Chart 2
shows, both formulations have negative cash flows but the optimal formulation yields
significantly less cash flow. The chart also shows that the cash flow decreases with
increasing years.
-60
-55
-50
-45
-40
-35
-30
-25
-20
-15
-10
-5
0
5
10
Cash Flow ($/million)
1 2 3 4 5 6 7 8
Year
Cash Flow
Decreased RMC FormulationOperating Cash FlowDecreased RMC Formulation CashFlowOptimal Formulation Operating CashFlowOptimal Formulation Cash Flow
Business Plan March 2005 25

Figure 4: Cash Flow Comparison of the Formulations with a Selling Price of $50/Package The following chart shows the profit comparison of the two formulations if the
package was sold at $90. The profit for the decreased raw material cost formulation is
positive but decreases with increasing years. The chart shows the optimal formulation but
even selling the package at this price still produces very negative positive results.
-60
-50
-40
-30
-20
-10
0
10
Pro
fit
($/
mill
ion
)
1 2 3 4 5 6 7 8
Year
Profit Comparison
Decreased RMC Formulation Gross ProfitDecreased RMC Formulation Net ProfitOptimal Formulation Gross ProfitOptimal Formulation Net Profit
Figure 5: Profit Comparison of the Formulations with a Selling Price of $90/Package The following chart shows the cash flow if the formulations were sold at $90 per
package. The optimal formulation still yields very negative results but the decreased raw
material cost formulation shows a slightly positive cash flow.
Business Plan March 2005 26

-55
-50
-45
-40
-35
-30
-25
-20
-15
-10
-5
0
5
10
Cash Flow ($/million)
1 2 3 4 5 6 7 8
Year
Cash Flow
Decreased RMC FormulationOperating Cash FlowDecreased RMC Formulation CashFlowOptimal Formulation Operating CashFlowOptimal Formulation Cash Flow
Figure 6: Cash Flow Comparison of the Formulations with a Selling Price of $90/Package
5.10 Risk
When accounting risk for projects there are several factors that can be taken into account.
For the risk analysis for this project, the change of the raw materials cost over the course of
the 5 year life of the project was analyzed. In order to make the risk analysis, different but
constant inflation rates were chosen randomly to affect the price of the raw materials used in
each package. The risk analysis was only developed for the first four raw material that have
the highest percent total cost of a yearly production of a product. Tables 1, 2, and 3 show
the results when calculating the % total cost needed for each ingredient and the rows
highlighted show the four ingredients that were used to make the risk analysis.
Business Plan March 2005 27

Table22: Percent Total Cost of Components in Pre-Shower Lotion
Material % Mass Needed/yr
(kg/yr) Cost ($/year) % Total Cost Deoinized Water 60 51840 $4 0.00
Ammonium Lactate (Aldrich) 10 8640 $1,479,905 20.46 Retinyl palmitate 5 4320 $1,362,960 18.84
Jojoba oil 8 6912 $1,695,851 23.44 Cetyl alcohol# 2.9 2505.6 $245,298 3.39
Phenoxyethanol 0.196 169.344 $5,793 0.08 Octyldodecanol 5.9 5097.6 $2,306,538 31.89
Maleic acid (Aldrich) 0.004 3.456 $92 0.00 PEG 8 6912 $137,030 1.89 Total 100 86400 $7,233,473 100.00
Table23: Percent Total Cost of Components in Shower Gel
Material % Mass Needed/ year (kg/yr) Cost ($)/ yr % Total Cost
Deoinized Water 52 56160 $5
0.00
Sodium PCA 2 2160 $975,217
10.95
Lactic Acid 5 5400 $167,040
1.88
Urocanic Acid 2 2160 $6,687,360
75.11
Citric Acid 2 2160 $55,253
0.62
Urea 4 4320 $31,752
0.36
Polysorbate-20 20 21600 $584,137
6.56 Cocoamidopropyl
Betaine 6.9 7452 $37,357
0.42
Phenoxyethanol 0.3 324 $11,243
0.13 Glyceryl oleate (oleic
acid) 3 3240 $58,369
0.66
Maleic acid 0.004 4.32 $115
0.00
Cetyl alcohol 2.796 3019.68 $295,627
3.32
Total 100 108000 $8,903,475
100.00
Business Plan March 2005 28

Table24: Percent Total Cost of Components in After-Shower Lotion
Material % Mass Needed/year
(kg/yr) Cost ($)/Year % Total Cost
Deoinized Water 60 51840 $4.41 0.00 Lanolin 8 6912 $233,625.60 0.65
Dimethicone 10 8640 $946,944.00 2.65 Ceramide 0.03 25.92 $33,675,264.00 94.26
γ-linoleic acid 0.01 8.64 $49,766.40 0.14 Cholesterol 0.01 8.64 $2,522.88 0.01 Palm Oil 0.01 8.64 $317.00 0.00
Cetyl alcohol 5 4320 $422,928.00 1.18 Phenoxyethanol 4.936 4264.704 $147,985.23 0.41 Isostearic Acid 5 4320 $125,202.58 0.35
Maleic acid 0.004 3.456 $92.25 0.00 PEG 7 6048 $119,901.60 0.34
Total 100 86400 $35,724,553.95
100.00
Ten scenarios were developed for the ingredients chosen from Year 4-Year 8 since
these are the years when the product is starting to be manufactured. The scenarios were
developed by using different inflation rates chosen randomly. Table 25 shows as an example
the active ingredient in the pre-shower lotion ammonium lactate.
Table 25: Development of Scenarios in Ammonium Lactate
Ammonium Lactate Inflation Year 4 Year 5 Year 6 Year 7 Year 8
Scenario #1 0.96 $1,479,905 $1,420,709 $1,363,881 $1,309,325 $1,256,952
Scenario #2
1.02 $1,479,905 $1,509,503 $1,539,693 $1,570,487 $1,601,897Scenario #3 0.98 $1,479,905 $1,450,307 $1,421,301 $1,392,875 $1,365,018Scenario #4 1.01 $1,479,905 $1,494,704 $1,509,651 $1,524,748 $1,539,995Scenario #5 0.97 $1,479,905 $1,435,508 $1,392,443 $1,350,670 $1,310,150Scenario #6 1.05 $1,479,905 $1,553,901 $1,631,596 $1,713,175 $1,798,834Scenario #7 0.95 $1,479,905 $1,405,910 $1,335,615 $1,268,834 $1,205,392Scenario #8 1.06 $1,479,905 $1,568,700 $1,662,822 $1,762,591 $1,868,346Scenario #9 1.03 $1,479,905 $1,524,302 $1,570,032 $1,617,132 $1,665,646
Scenario #10 1.04 $1,479,905 $1,539,101 $1,600,666 $1,664,692 $1,731,280
Business Plan March 2005 29
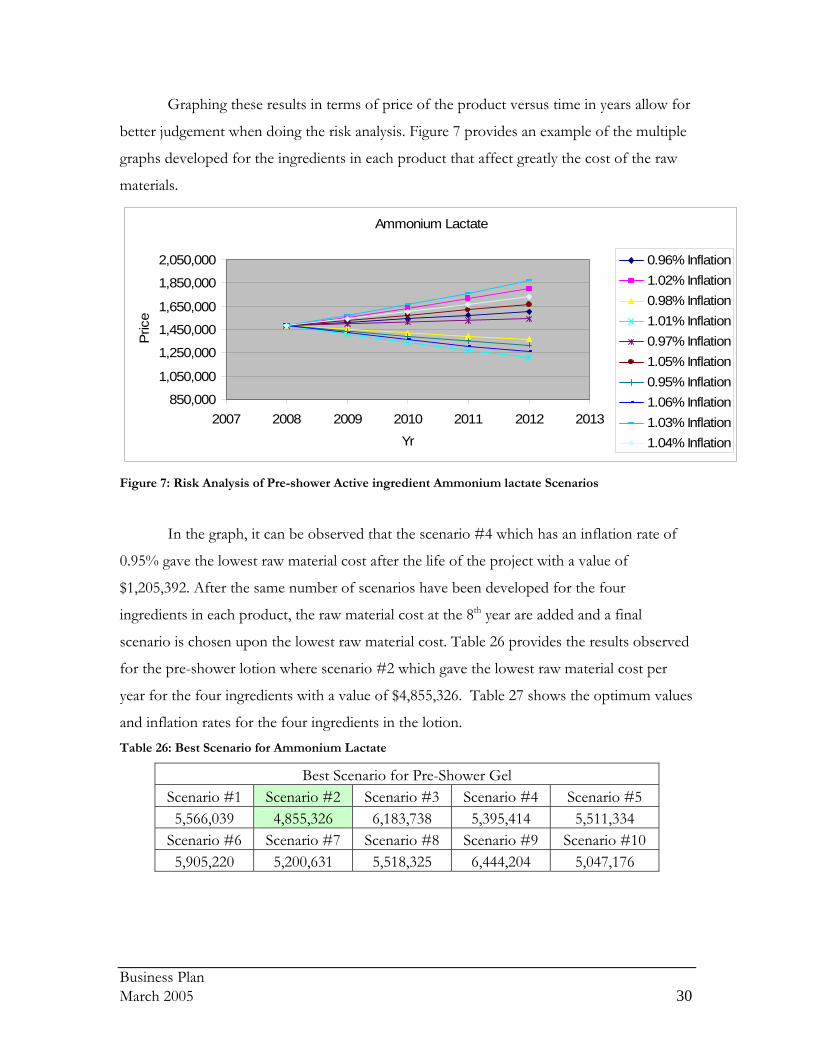
Graphing these results in terms of price of the product versus time in years allow for
better judgement when doing the risk analysis. Figure 7 provides an example of the multiple
graphs developed for the ingredients in each product that affect greatly the cost of the raw
materials.
Ammonium Lactate
850,000
1,050,000
1,250,000
1,450,000
1,650,000
1,850,000
2,050,000
2007 2008 2009 2010 2011 2012 2013Yr
Pric
e
0.96% Inflation1.02% Inflation0.98% Inflation1.01% Inflation0.97% Inflation1.05% Inflation0.95% Inflation1.06% Inflation1.03% Inflation1.04% Inflation
Figure 7: Risk Analysis of Pre-shower Active ingredient Ammonium lactate Scenarios
In the graph, it can be observed that the scenario #4 which has an inflation rate of
0.95% gave the lowest raw material cost after the life of the project with a value of
$1,205,392. After the same number of scenarios have been developed for the four
ingredients in each product, the raw material cost at the 8th year are added and a final
scenario is chosen upon the lowest raw material cost. Table 26 provides the results observed
for the pre-shower lotion where scenario #2 which gave the lowest raw material cost per
year for the four ingredients with a value of $4,855,326. Table 27 shows the optimum values
and inflation rates for the four ingredients in the lotion. Table 26: Best Scenario for Ammonium Lactate
Best Scenario for Pre-Shower Gel Scenario #1 Scenario #2 Scenario #3 Scenario #4 Scenario #5 5,566,039 4,855,326 6,183,738 5,395,414 5,511,334
Scenario #6 Scenario #7 Scenario #8 Scenario #9 Scenario #10 5,905,220 5,200,631 5,518,325 6,444,204 5,047,176
Business Plan March 2005 30

Table 27: Best scenario for Pre-shower lotion
Scenario #2 Ingredient Inflation % Cost in Year 4 Cost in Year 8
Ammonium Lactate 1.02 $1,479,905 $1,798,834 Retinyl Palmitate 1.02 $1,362,960 $1,475,312
Jojoba Oil 0.97 $1,695,851 $1,501,325 Octyldodecanol 0.95 $2,306,538 $1,878,690
The example shown above describes the best scenario in industry conditions. Further
analysis could be done with the worse case scenario always keeping the fixed selling price
according to the market.
Business Plan March 2005 31