hemas interim report june · pdf filebaby cheramy, clogard and kumarika growing share. for the...
TRANSCRIPT

Hemas Interim Report June 2007

CEO’s Review
Hemas Holdings Interim Report 1st Quarter 2007-20081
Your company recorded a Turnover of Rs 3.13Bn for thefirst quarter of the financial year reflecting a year on yeargrowth of 20%. Operating margins, however, declined to12% mainly due to higher input costs at FMCG along withan increase in establishment overheads. Finance costs forthe quarter were Rs 80.4Mn which is an increase of 26%over the previous quarter. This is due to higher marketinterest rates along with increased borrowings to fund ourinvestments in Hospitals and relocation of our FMCGfactory. For the quarter under review, the effective taxrate decreased to 18% on account of investment reliefbenefits. As a result a 3% drop in pre-tax profits havebeen translated into a 6% increase in post tax profits, toRs 229.6Mn.
We saw a slow down in industry growth at FMCG whencompared to 2006 with the Personal Care categoryregistering a value growth of 7% during the first 5 monthsof calendar 2007. During this period the Sector did well tostrengthen its overall market share with key brands likeBaby Cheramy, Clogard and Kumarika growing share. Forthe quarter under review, turnover grew faster than themarket by 22% to Rs 1,018Mn although Profits declinedby 3% largely on account of higher input costs whichwere not passed on in full to the consumer. The Sector isfocusing on proactive cost management with a view tominimizing the impact of the increasing input costs onconsumers.
The Healthcare sector performance was belowexpectation with a sluggish April holding back turnoverfor the quarter to Rs 689Mn, a growth of 6% growth overthe corresponding quarter of last year. Profits were up by14% to Rs 31.3Mn. Development of our 100 bed hospitalin Wattala is progressing as per schedule. In June 2007,we completed the acquisition of Southern Hospitals, Galleand the first phase of a two stage refurbishment programis already underway.
The Leisure sector has, as expected, fared belowpotential due to the security situation. Pursuant to ourdecision to postpone the repositioning of Serendib,
the hotel has been reintroduced to the market in itsoriginal state and will open for operations for the winterseason. Our destination management company hasfocused on improving productivity during this difficultperiod and has developed an integrated booking solutionwhich will come on stream in August this year.
The Transportation sector closed with a profit for thequarter of Rs 26.9Mn, a 31% increase over thecorresponding period last year. During the quarter, theclosure of the airport for night flights had a significantimpact on our GSA operations with both Emirates andMalaysian Airlines reducing frequencies. We anticipate afull recovery of these schedules now that the airport isonce again operating round the clock.
The Heladhanavi power plant continues to operatesatisfactorily and the 42% increase in turnover for thequarter was mainly as a result of the higher tariffs as aresult of the pass through cost of fuel. Although, profitsfor the quarter have closed at Rs 104.7Mn which is 57%over last year, this will defray in part due to a majorscheduled maintenance of the machines which will becarried out during the second quarter.
The outlook for the forthcoming quarter remainsconservative with no clear solution in sight with regard tothe cessation of hostilities or stabilization of economicfundamentals. We are however looking at mitigatingcountry risk by exploring opportunities to take the FMCGand leisure business regional and develop on our regionalexpansion in the transport sector.
Husein EsufallyDirector / Chief Executive Officer
19th July 2007

Investor Information
Hemas Holdings Interim Report 1st Quarter 2007-20082
3 Months 3 MonthsEnded Jun '07 Ended Jun '06
Market Value of Shares
Closing Price on 30th June (Rs) 102.50 103.00
Highest Price during the Period (Rs) 120.00 114.00
Lowest Price during the Period (Rs) 95.00 100.00
Market Capitalization on 30th June (Rs Mn) 10,384 10,283
Ratios
Net Asset Per Share on 30th June (Rs) 53.98 45.15
Price Earnings Ratio on 30th June (times) 10.97 11.84
Share Trading
No of transactions during the Period 288 461
No of shares traded during the Period 238,900 1,923,700
Value of shares traded during the Period (Rs Mn) 25 202

Consolidated Income Statement
Hemas Holdings Interim Report 1st Quarter 2007-20083
Three Months Three MonthsEnded Ended
30.06.2007 30.06.2006 ChangeRs '000 Rs '000 %
Revenue 3,130,961 2,605,225 20.2 Cost of Sales (2,197,781) (1,729,977) (27.0)
Gross Profit 933,180 875,248 6.6 Dividend Income - - NA Change in Fair Value of Investment Property 6,000 6,000 - Other Income 46,869 42,287 10.8 Distribution Expenses (231,736) (234,991) 1.4 Administrative Expenses (379,690) (321,251) (18.2)Other Operating Expenses (14,358) (13,948) (2.9)
Operating Profit 360,265 353,345 1.9 Finance Cost (80,457) (63,605) (26.5)Share of Associate Companies Profits - 85 (100.0)
Profit Before Taxation 279,808 289,825 (3.5)Income Tax Expenses (50,242) (74,135) 32.2
Profit for the Year 229,566 215,690 6.4
Attributable to:Equity Holders of the Parent 236,550 216,964 9.0 Minority Interest (6,984) (1,274) (448.2)
229,566 215,690 6.4
Earnings per Share (Rs) 2.33 2.17Earnings per Share (Rs) - Annualised 9.34 8.70
Dividends per Share (Rs) - -
The above figures are provisional and subject to audit.
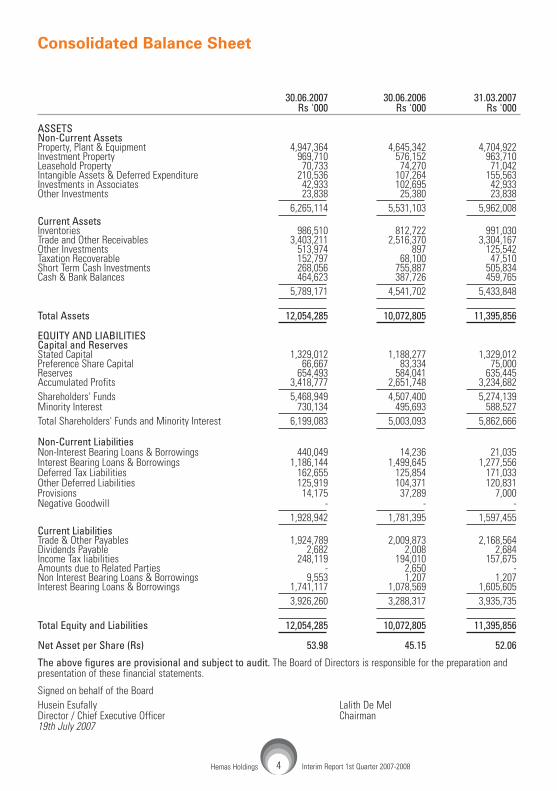
Consolidated Balance Sheet
Hemas Holdings Interim Report 1st Quarter 2007-20084
30.06.2007 30.06.2006 31.03.2007Rs '000 Rs '000 Rs '000
ASSETSNon-Current AssetsProperty, Plant & Equipment 4,947,364 4,645,342 4,704,922 Investment Property 969,710 576,152 963,710 Leasehold Property 70,733 74,270 71,042 Intangible Assets & Deferred Expenditure 210,536 107,264 155,563 Investments in Associates 42,933 102,695 42,933 Other Investments 23,838 25,380 23,838
6,265,114 5,531,103 5,962,008Current AssetsInventories 986,510 812,722 991,030 Trade and Other Receivables 3,403,211 2,516,370 3,304,167 Other Investments 513,974 897 125,542 Taxation Recoverable 152,797 68,100 47,510 Short Term Cash Investments 268,056 755,887 505,834 Cash & Bank Balances 464,623 387,726 459,765
5,789,171 4,541,702 5,433,848
Total Assets 12,054,285 10,072,805 11,395,856
EQUITY AND LIABILITIESCapital and ReservesStated Capital 1,329,012 1,188,277 1,329,012 Preference Share Capital 66,667 83,334 75,000 Reserves 654,493 584,041 635,445 Accumulated Profits 3,418,777 2,651,748 3,234,682Shareholders' Funds 5,468,949 4,507,400 5,274,139 Minority Interest 730,134 495,693 588,527Total Shareholders' Funds and Minority Interest 6,199,083 5,003,093 5,862,666
Non-Current LiabilitiesNon-Interest Bearing Loans & Borrowings 440,049 14,236 21,035 Interest Bearing Loans & Borrowings 1,186,144 1,499,645 1,277,556 Deferred Tax Liabilities 162,655 125,854 171,033 Other Deferred Liabilities 125,919 104,371 120,831 Provisions 14,175 37,289 7,000 Negative Goodwill - - -
1,928,942 1,781,395 1,597,455Current Liabilities Trade & Other Payables 1,924,789 2,009,873 2,168,564 Dividends Payable 2,682 2,008 2,684 Income Tax liabilities 248,119 194,010 157,675 Amounts due to Related Parties - 2,650 - Non Interest Bearing Loans & Borrowings 9,553 1,207 1,207 Interest Bearing Loans & Borrowings 1,741,117 1,078,569 1,605,605
3,926,260 3,288,317 3,935,735
Total Equity and Liabilities 12,054,285 10,072,805 11,395,856
Net Asset per Share (Rs) 53.98 45.15 52.06
The above figures are provisional and subject to audit. The Board of Directors is responsible for the preparation andpresentation of these financial statements.
Signed on behalf of the BoardHusein Esufally Lalith De MelDirector / Chief Executive Officer Chairman 19th July 2007

Company Income Statement
Hemas Holdings Interim Report 1st Quarter 2007-20085
Three Months Three MonthsEnded 30.06.2007 Ended 30.06.2006 Change
Rs '000 Rs '000 %
Revenue 33,202 30,219 9.9
Cost of Sales - - NA
Gross Profit 33,202 30,219 9.9
Other Income 5,842 6,773 (13.8)
Distribution Expenses - - NA
Administrative Expenses (41,335) (30,164) (37.0)
Other Operating Expenses - - NA
Operating Profit (2,291) 6,828 (133.5)
Finance Cost (8,993) (7,728) (16.4)
Profit Before Taxation (11,284) (900) (1,153.8)
Income Tax Expenses (1,468) 860 (270.7)
Profit for the Year (12,752) (40) (31,780.0)
Attributable to:
Equity Holders of the Parent (12,752) (40) (31,780.0)
Minority Interest - - NA
(12,752) (40) (31,780.0)
Earnings per Share (Rs) - -
Earnings per Share (Rs) - Annualised - -
Dividends per Share (Rs) - -
The above figures are provisional and subject to audit.

Company Balance Sheet
Hemas Holdings Interim Report 1st Quarter 2007-20086
30.06.2007 30.06.2006 31.03.2007Rs '000 Rs '000 Rs '000
ASSETSNon-Current AssetsProperty, Plant & Equipment 62,089 68,637 67,854 Investment Property 258,710 207,745 258,710 Loans Receivable from Related Parties 29,938 101,067 12,184 Investments in Subsidiaries 4,344,334 4,255,394 4,335,975 Investments in Associates - 43,046 -Investments in Joint Venture - - 8,359 Other Investments 13,405 12,905 13,405
4,708,476 4,688,794 4,696,487Current AssetsTrade and Other Receivables 112,318 100,060 75,148 Loans Receivable from Related Parties 162,699 285,196 255,337 Other Investments 49 49 49 Taxation Recoverable 11,254 7,991 10,920 Amounts due from Related Parties 48,825 27,917 58,361 Short Term Cash Investments 3,160 209,574 3,586 Cash and Bank Balances 7,389 12,484 75,727
345,694 643,271 479,128
Total Assets 5,054,170 5,332,065 5,175,615
EQUITY AND LIABILITIESCapital and ReservesStated Capital 1,329,012 1,188,277 1,329,012 Reserves 372,665 372,664 372,665 Accumulated Profits 2,599,816 2,794,869 2,612,568Shareholders' Funds 4,301,493 4,355,810 4,314,245
Non-Current LiabilitiesNon-Interest Bearing Loans and Borrowings 422,036 326,424 421,281 Deferred Tax Liabilities 53,273 30,716 51,882 Other Deferred Liabilities 11,569 11,560 11,382
486,878 368,700 484,545Current Liabilities Trade and Other Payables 24,710 25,644 17,215 Dividends Payable 166 - 168 Income Tax Liabilities 8,689 5,510 9,231 Amounts Due to Related Parties 229,324 6,406 4,338 Interest Bearing Loans & Borrowings 2,910 569,995 345,873
265,799 608,031 376,825
Total Equity and Liabilities 5,054,170 5,332,065 5,175,615
Net Asset per Share (Rs) 42.46 43.63 42.59
The above figures are provisional and subject to audit. The Board of Directors is responsible for the preparation andpresentation of these financial statements.
Signed on behalf of the BoardHusein Esufally Lalith De Mel Director / Chief Executive Officer Chairman19th July 2007

Sta
tem
ent
of
Ch
ang
es o
f E
qu
ity-
Co
nso
lidat
ed
Hemas Holdings Interim Report 1st Quarter 2007-20087
Thre
e m
onth
s to
30t
h Ju
ne 2
007
Stat
edPr
efer
ence
Capi
tal
Exch
ange
Reva
luat
ionA
ccum
ulate
d To
tal
Min
ority
To
tal
Capi
tal
Shar
eRe
demp
tion
Rese
rve
& Re
venu
e Pr
ofits
Inte
rest
sEq
uity
Capi
tal
Rese
rve
Rese
rves
Rs '0
00Rs
'000
Rs '0
00Rs
'000
Rs '0
00Rs
'000
Rs '0
00Rs
'000
Rs '0
00
Bala
nce
as a
t 01s
t Apr
il 20
071,
329,
012
75,0
00
25,0
00
(77,
742)
688,
187
3,23
4,68
2 5,
274,
139
588,
527
5,86
2,66
6 N
et P
rofit
/ (L
oss)
for t
he P
erio
d-
-
-
-
-
23
6,55
0 23
6,55
0(6
,984
)22
9,56
6Di
vide
nds
-
-
-
-
-
(2,5
37)
(2,5
37)
-
(2,5
37)
Shar
es Is
sued
to M
inor
ity S
hare
hold
ers
-
-
-
-
(2,1
37)
(9,0
95)
(11,
232)
148,
591
137,
359
Rede
mpt
ion
of P
refe
renc
e Sh
ares
-
(8,3
33)
8,33
3 -
-
(8
,333
)(8
,333
)-
(8
,333
)Tr
ansf
erre
d to
/fro
m d
urin
g th
e Pe
riod
-
- Ove
rhau
l Res
erve
-
-
-
-
37,7
96
(37,
796)
--
-
- Rev
alua
tion
& R
even
ue R
eser
ves
-
-
-
-
(4,1
81)
5,30
6 1,
125
-
1,12
5N
et G
ain/
(Los
s) R
ecog
nise
d Di
rect
ly in
Equ
ity
- Exc
hang
e Re
serv
e-
-
-
(2
0,76
3)-
-
(2
0,76
3)-
(2
0,76
3)Ba
lanc
e as
at 3
0th
June
200
71,
329,
012
66,6
67
33,3
33
(98,
505)
719,
665
3,41
8,77
7 5,
468,
949
730,
134
6,19
9,08
3
Thre
e m
onth
s to
30t
h Ju
ne 2
006
Stat
edPr
efer
ence
Capi
tal
Exch
ange
Reva
luat
ionA
ccum
ulat
ed
Tota
lM
inor
ity
Tota
lCa
pita
lSh
are
Rede
mptio
nRe
serv
e&
Reve
nue
Prof
itsIn
tere
sts
Equi
tyCa
pita
lRe
serv
eRe
serv
esRs
'000
Rs '0
00Rs
'000
Rs '0
00Rs
'000
Rs '0
00Rs
'000
Rs '0
00Rs
'000
Bala
nce
as a
t 01s
t Apr
il 20
061,
185,
529
91,6
67
8,33
3 14
,428
56
7,82
2 2,
451,
308
4,31
9,08
7 49
6,96
7 4,
816,
054
Net
Pro
fit /
(Los
s) fo
r the
Per
iod
-
-
-
-
-
216,
964
216,
964
(1,2
74)
215,
690
Divi
dend
s-
-
-
-
-
(2
,742
)(2
,742
)-
(2
,742
)Sh
ares
Issu
ed fo
r Cas
h &
Ful
ly P
aid
(ESO
P)2,
748
-
-
-
-
-
2,74
8-
2,
748
Rede
mpt
ion
of P
refe
renc
e Sh
ares
-
(8,3
33)
8,33
3 -
-
(8
,333
)(8
,333
)-
(8
,333
)Tr
ansf
erre
d to
/fro
m d
urin
g th
e Pe
riod
- Ove
rhau
l Res
erve
-
-
-
5,44
9 (5
,449
)-
-
-N
et G
ain/
(Los
s) R
ecog
nise
d Di
rect
ly in
Equ
ity
- Exc
hang
e Re
serv
e-
-
-
(2
0,32
4)-
-
(2
0,32
4)-
(2
0,32
4)Ba
lanc
e as
at 3
0th
June
200
61,
118,
277
83,3
34
16,6
66
(5,8
96)
573,
271
2,65
1,74
8 4,
507,
400
495,
693
5,00
3,09
3
The
abov
e fig
ures
are
pro
visi
onal
and
sub
ject
to a
udit.

Hemas Holdings Interim Report 1st Quarter 2007-20088
Sta
tem
ent
of
Ch
ang
es o
f E
qu
ity-
Co
mp
any
Thre
e m
onth
s to
30t
h Ju
ne 2
007
Stat
ed C
apita
l Ca
pita
l &
Accu
mul
ated
To
tal
Reve
nue
Prof
itRe
serv
esRs
'000
Rs '0
00Rs
'000
Rs '0
00
Bala
nce
as a
t 01s
t Apr
il 20
071,
329,
012
372,
665
2,61
2,56
8 4,
314,
245
Net
Pro
fit /
(Los
s) fo
r the
Per
iod
--
(12,
752)
(12,
752)
Divi
dend
s-
--
-
Shar
es Is
sued
for C
ash
& F
ully
Pai
d (E
SOP)
--
--
Bo
nus
Issu
e-
--
- Sh
are
of C
apita
l Res
erve
s of
Sub
sidi
arie
s-
--
-Ba
lanc
e as
at 3
0th
June
200
71,
329,
012
372,
665
2,59
9,81
6 4,
301,
493
Thre
e m
onth
s to
30t
h Ju
ne 2
006
Stat
ed C
apita
l Ca
pita
l &
Accu
mul
ated
To
tal
Reve
nue
Prof
itsRe
serv
esRs
'000
Rs '0
00Rs
'000
Rs '0
00
Bala
nce
as a
t 01s
t Apr
il 20
061,
185,
529
372,
664
2,79
4,90
9 4,
353,
102
Net
Pro
fit /
(Los
s) fo
r the
Per
iod
--
(40)
(40)
Divi
dend
s-
-
--
Shar
es Is
sued
for C
ash
& F
ully
Pai
d (E
SOP)
2,74
8 -
-2,
748
Bonu
s Is
sue
--
--
Shar
e of
Cap
ital R
eser
ves
of S
ubsi
diar
ies
--
--
Bala
nce
as a
t 30t
h Ju
ne 2
006
1,18
8,27
7 37
2,66
4 2,
794,
869
4,35
5,81
0
The
abov
e fig
ures
are
pro
visi
onal
and
sub
ject
to a
udit.

Cash Flow Statement - Consolidated
Hemas Holdings Interim Report 1st Quarter 2007-20089
For the three months ended June 2007 2006Rs '000 Rs '000
Oprating ActivitiesNet Profit Before Taxation 279,808 289,825 Non - CashDepreciation 106,514 99,232 (Profit)/Loss on Sale of Property, Plant & Equipment (860) (4,175)Provision for Retiring Gratuity 7,647 5,509 Amortisation of Intangible Assets 6,208 4 Finance Cost 80,457 63,605 (Profit)/Loss on Associates/Subsidiaries - (85)Change in Fair Value of Investment Property (6,000) (6,000)
Working Capital Adjustments(Increase)/Decrease in Receivables (99,044) (66,556)(Increase)/Decrease in Inventories 4,520 (67,361)Increase/(Decrease) in Amounts due from Related Companies - 631Increase/(Decrease) in Amounts due to Related Companies - (728)Increase/(Decrease) in Creditors and Accruals (243,775) (105,963)Increase/(Decrease) in Provisions 7,175 6,242 Finance Cost Paid (80,457) (63,605)Income Tax Paid (73,464) (39,563)Gratuity Paid (2,559) (4,842)Net Cash from / (used in) Operating Activities (13,830) 106,170
Investing ActivitiesPurchase of Property, Plant & Equipment (352,427) (79,379)Investment in Intangible Assets (60,871) -Acquisition of Other Investments (388,431) (10,903)Redemption of Preference Shares (8,333) (8,333)Proceeds from Sale of Property, Plant & Equipment 5,455 4,999 Maturity of Fixed Deposit - 20,410 Net Cash from / (used in) Investing Activities (804,607) (73,206)
Financing ActivitiesBorrowing (Net) (636,201) (46,984)Proceeds from Issue of Shares (Net of Issue Expenses) - 2,748 Proceeds from Issue of Shares to Minority 137,359 -Dividends Paid (2,539) (127,672)Net Cash from / (used in) Financing Activities (501,381) (171,908)
Net Decrease in Cash & Cash Equivalents (1,319,818) (138,944)
Cash & Cash Equivalents at the Beginning of the Year (27,543) 813,486
Cash & Cash Equivalents at the End of the Period (1,347,361) 674,542

Cash Flow Statement - Company
Hemas Holdings Interim Report 1st Quarter 2007-200810
For the three months ended June 2007 2006Rs '000 Rs '000
Operating ActivitiesNet Profit Before Taxation (11,284) (900)Non - CashDepreciation 6,798 5,579 (Profit)/Loss on Sale of Property, Plant & Equipment 7 Provision for Retiring Gratuity 541 338 Finance Cost 8,993 7,728 Working Capital Adjustments (Increase)/Decrease in Receivables (37,171) (84,770)(Increase)/Decrease in Amounts due from Related Companies 84,421 (39,117)Increase/(Decrease) in Amounts due to Related Companies (116,553) 270,933 Increase/(Decrease) in Creditors and Accruals 7,494 (7,056)Finance Cost Paid (8,993) (7,728)Income Tax Paid (952) (1,000)Gratuity Paid (354) -Net Cash from / (used in) Operating Activities (67,060) 144,014
Investing ActivitiesPurchase of Property, Plant & Equipment (1,032) (8,300)Acquisition of Other Investments (10,000)Proceeds from Sale of Property, Plant & Equipment 12 Net Cash from / (used in) Investing Activities (1,032) (18,288)
Financing ActivitiesProceeds from Issue of Shares (Net of Issue Expenses) - 2,748 Dividends Paid (2) (124,928)
Net Cash from / (used in) Financing Activities (2) (122,180)
Net Increase / (Decrease) in Cash & Cash Equivalents (68,094) 3,546
Cash & Cash Equivalents at the Beginning of the Year 75,733 218,512
Cash & Cash Equivalents at the End of the Period 7,639 222,058

Notes to the Financial Statements
Hemas Holdings Interim Report 1st Quarter 2007-200811
1 The Interim Financial Statements have been prepared in accordance with the accounting policies set out in the auditedaccounts for the year ended 31st March 2007, and also in compliance with Sri Lanka Accounting Standard 35 - InterimFinancial Reporting.
2 The previous years'/periods' figures and phrases have been rearranged wherever necessary to conform to the currentpresentation.
3 There has not been a significant change in the nature of the contingent liabilities which were disclosed in the AuditedAccounts for the year ended 31st March 2007.
4 No circumstances have arisen since the Balance Sheet date that would require adjustments to or disclosure in thefinancial statements.
5 The operational results of the first three months may not reflect the full year results due to seasonality and cyclicalityof the business, especially in the Leisure sector.
Industry Segment - Turnover
Three Months Three Months Ended 30.06.2007 Ended 30.06.2006
Total Total ChangeRs Mn Rs Mn %
FMCG 1,018.6 834.6 22.0 Healthcare 689.3 650.4 5.9 Leisure 149.5 204.7 (26.9)Transportation 138.1 112.1 23.2 Power 1,118.9 788.1 41.9 Others 66.6 59.4 12.1
3,181.0 2,649.3 20.1 Less: Inter Sector Sales (50.1) (44.1)
3,130.9 2,605.2 20.2
Industry Segment - Group Profit
Three Months Three Months Ended 30.06.2007 Ended 30.06.2006
Total Total ChangeRs Mn Rs Mn %
FMCG 101.4 104.8 (3.2)Healthcare 31.3 27.5 13.8 Leisure (3.1) 7.9 (139.2)Transportation 26.9 20.6 30.6 Power 104.7 66.7 56.9 Others (24.6) (10.5) (134.3)
236.6 217.0 9.0

Corporate Information
Hemas Holdings Interim Report 1st Quarter 2007-200812
NAME OF THE COMPANY Hemas Holdings PLC
LEGAL FORM A listed company with limited liability incorporated in Sri Lanka under theCompany's Ordinance No. 51 of 1938 on 10th December 1948. TheCompany was re- registered in terms of the Company's Act No.7 of 2007 on 30th May 2007.
STOCK EXCHANGE LISTING The Ordinary Shares of the Company were listed in the Colombo Stock Exchange on 27th August 2003.
COMPANY REGISTRATION NO. P Q 6
REGISTERED OFFICE No. 36, Bristol Street, Colombo 01.
DIRECTORS Lalith De Mel - ChairmanHusein EsufallyAbbas EsufallyImtiaz EsufallyMurtaza EsufallyDivyaroop BhatnagarMaithri WickremesinghePradipta Mohapatra
AUDIT COMMITTEE Maithri WickremesinghePradipta Mohapatra
REMUNERATION COMMITTEE Lalith De MelMaithri Wickremesinghe
SECRETARIES Hemas Corporate Services (Pvt) LtdNo. 36, Bristol Street, Colombo 01.
REGISTRARS SSP Corporate Services (Pvt) Ltd101, Inner Flower Road, Colombo 03.
AUDITORS M/S. Ernst & YoungChartered AccountantsNo. 201, De Saram Place,P O Box 101,Colombo 10.
LAWYERS D L and F de SaramNo. 47, Alexandra Place,Colombo 07.
BANKERS Commercial Bank of Ceylon LtdDeutsche BankHongkong & Shanghai Banking Corp. LtdHatton National Bank Ltd

Hemas Interim Report June 2007