he/lx analysis software user’s manual · he/lx analysis operator’s manual table of contents...
TRANSCRIPT
Part number: NEMM027_Rev_MUpdate Date: February 2019Copyright 2007 - 2019All rights reserved
HE/LX Analysis SoftwareUser’s Manual
product functions: Pro / Enhanced Plus / Enhancedproduct features: Sleep-Apnea &Remote Receive
Software version: 6.0c
Copyright 2007 - 2019 NorthEast Monitoring, Inc. All rights reserved.
The HE/LX Analysis software has been developed by NorthEast Monitoring, Inc.
NorthEast Monitoring is an FDA Registered Facility, number 1224919, that follows all FDA CGMP Manufacturing Practices.
The HE/LX Analysis software has FDA 510(k) Market Approval Number K930564 and K081861.
Microsoft Windows 7 and Windows 10 are registered trademarks of Microsoft Corp.
Java software is developed by Oracle Corporation.
Adobe Acrobat Reader is a registered trademark of Adobe Systems Incorporated.
Special acknowledgement to Bruno Lowagie and Paulo Soares, the authors of iText library. This open source library provided the ability to generate Adobe
Acrobat files. For more information, see www.itextpdf.com

NorthEa
Table of Contents
Chapter 1. Introduction...6Intended Use and Indications for Use...6Recorder Definitions...7System requirements...7Operator knowledge...7Specifications for HE/LX Analysis software...7The HE/LX Analysis Software Package includes:...8The Flashcard...8Initializing a flashcard...9The Holter Procedure...9Online help...10
Chapter 2. Patient Information...11Enter a new patient...12Diary Information...146-Minute Walk Assessment Window...15To Change Settings...15Starting Holter Analysis...15Edit patient information for the “current” patient...15The Current Patient...17The Patient List...17Remote Receive...19Preview data on flashcard...20
Chapter 3. Holter Analysis...21Starting Holter Analysis...21Color coded beat morphologies...21Beat Labeling...22Scanning Criteria...23Re-analysis...27Update...28What Strips to Auto Save...29How Often Strips Auto Save...31Oximetry analysis...32ST segment analysis...33Pacemaker analysis...37
st Monitoring, Inc. NEMM027-Rev-M Page 3 of 117
HE/LX Analysis Operator’s Manual Table of Contents
NorthE
Chapter 4. Review Methods...40Reviewing Bins (Pro and Enhanced Plus Levels)...40Reviewing Critical Events...44Reviewing Saved Strips...48Reviewing in the Page window...51Reviewing the Trends window...56Reviewing Tables...59Additional features...62
Chapter 5. 12-Lead Presentations...64Recording 12-lead data...64Printing 12-lead data and strips...69
Chapter 6. HRV Analysis...71Reviewing HRV data...71HRV Analysis (Additional features found in Pro)...74Printing HRV data...77
Chapter 7. Reporting...78Status indicators...84Full disclosure...84Reviewing the report...85Printing...85Closing Reports window...86Adding Logo to report...86
Chapter 8. Archive Patients...87The HE/LX Patient Archive Tool...87Archive Patients Tab...88Restore Patients Tab...89Auto Archive...90
Chapter 9. Preferences...91Preferences window...91Managing Lists...94
Chapter 10. Configurations...95
Chapter 11. Licensing, Utilities & Set up...99Licensing...99Utilities...99Patient Directories...100Remote Receive Set up...101Interface for Foreign (non-NEMon) Data Formats...102
ast Monitoring, Inc. NEMM027-Rev-M Page 4 of 117
HE/LX Analysis Operator’s Manual Table of Contents
NorthE
Appendix A - Calculation of Heart Rate... 105
Appendix B - Network Installations... 108Network HASP Key Installation...108Setting up Shared Network Patient Data...109PPU Networks - Additional step...109Windows 2008 Server Installation...110
Appendix C - HIS - Hospital Information System (Pro Level) 111HIS Import Option...114
Appendix D - LX Sleep - Apnea... 115Requirements to run the LX Sleep - Apnea software:...115The Apnea Trend / AHI Probability chart...115
Appendix E - Test Issues. 117
ast Monitoring, Inc. NEMM027-Rev-M Page 5 of 117

1. INTRODUCTION Welcome to NorthEast Monitoring’s HE/LX Analysis Software. Used in conjunction with a NorthEast Monitoring Digital Holter Recorder - either the DR180 Series, the DR180 Series with the optional Oxy-Holter cable, the DR200/HE or the DR300 - HE/LX Analysis allows you to fully review all of the ECG recorded during the Holter test, including all normal, ventricular, supraventricular, and paced beats. You can quickly review and edit morphology types, significant arrhythmic events, strips saved for the printed report, data trends, and tables. You can also review and edit report information before it’s printed, and then print whatever pages are required to document each patient’s Holter test. In addition, HE/LX Analysis automatically reads recording data from the recorder’s flashcard - including entries made using the Event button - and saves sample strips of event markers and diary entries.
Archiving, Remote Reporting and Spectral Analysis are also included.
Optional oximetry from the DR180 Series with OxyHolter and 12-lead data from the DR180 Series can also be analyzed, edited, and presented.
N
Intended Use and Indications for Use
Intended Use:
The HE/LX Analysis software is intended to provide a means for trained operators to analyze long-term ambulatory Electrocardiogram (ECG) recordings [Holter recordings]. The results of this anal-ysis are intended to assist the physician in the interpretation of the recorded data. The HE/LX Analysis software is intended to be used by a trained operator under the supervision of a licensed healthcare professional.
Indications for Use:
1. The HE/LX Analysis software is to be used to analyze the data recorded by Holter recorders such as the NorthEast Monitoring DR180+, DR181, DR200/HE and the DR300.
2. Detection of Arrhythmias: The HE/LX Analysis software assists in the evaluation of ECG recordings of cardiac rhythm when intermittent arrhythmias are suspected due to patient symp-toms such as palpitations, transient ischemic attacks (TIAs), syncope (fainting), or other such symptoms as determined by the physician.
3. Efficacy of Treatment: The HE/LX Analysis software assists in documenting the effect of pharmacological treatment of known arrhythmias is effective by measuring the frequency and duration of the arrhythmia compared to the frequency and duration prior to treatment.
4. Pacemaker Evaluation: The HE/LX Analysis software assists in the evaluation of the function of implanted pacemakers to insure that the pacemaker is functioning within prescribed limits.
5. Detection of Sleep Apnea: The HE/LX Analysis software assists physicians in determining the need for clinical diagnosis and evaluation by polysomnography based on the patient's score.
The HE/LX Analysis software is to be used only on the order of a physician.
orthEast Monitoring, Inc. NEMM027-Rev-M Page 6 of 117
HE/LX Analysis Operator’s Manual Introduction: Recorder Definitions
North
Recorder DefinitionsThe following definitions are applied throughout this manual:
• "DR180 Series" is a DR180+ or DR181 recorder
• "OxyHolter" is a DR180 Series recorder with an optional OxyHolter or Oxy-Holter/A cable
• "NEMon Holter" is any DR180 Series, DR200/HE or DR300 Holter recorder
System requirementsThe HE/LX Analysis software is to be used to analyze the data recorded by a NEMon Holter recorder. To run the HE/LX Analysis software, your personal computer must include:
• Microsoft Windows 7 or 10 Operating System
• a processor with a speed of 1 GHz or faster
• at least 2 GB of memory
• at least 10 GB of free space on hard drive
• a monitor with a resolution of at least 1280 by 1024
• a USB flashcard reader (included) or a laptop PC card slot
• a laser printer is recommended.
Operator knowledgeTo use NorthEast Monitoring HE/LX Analy-sis Software, you must have extensive Holter knowledge that allows you to prop-erly identify sinus and paced rhythms, abnormal rhythms, supraventricular and ventricular arrhythmias, artifact, ST segment changes, and pacemaker failures. In addi-tion, all instructions assume a working knowledge of computers and, specifically a Windows operating system.
Specifications for HE/LX Analysis software
User Specifications:
The software is designed to be used by a trained operator under the supervision of a licensed clinician for the purpose of evaluat-ing the severity of arrhythmia as part of the patient's medical evaluation for treatment.
Software Performance and Specifications:
Arrhythmia Detection:
• Ventricular Premature Beats (VPBs)
• Supraventricular Premature Beats (SVPBs)
Maximum time analyzed:
• 14 days
Presentation of data:
• Standard 25 mm/s for 3-lead and 12-lead recordings
• 50 mm/s available for 12-lead recordings
• All 12-lead data displayed for 12-lead recordings
• For oximetry recordings, SpO2 replaces 3rd channel
• Calibration indication can be provided in reports
ST Segment slope:
• Positive or negative slope indicated based on manual setting of cursors by trained operator
LAN Capability:
• Allows multiple users to access a com-mon database of patient data without con-flict.
East Monitoring, Inc. NEMM027-Rev-M Page 7 of 117
HE/LX Analysis Operator’s Manual Introduction: The HE/LX Analysis Software Package includes:
Nor
Pacemaker detection:
• Displayed and annotated for the operator
Oximetry:
• When available, displayed by software
• When at least 4 hours of noise free data is provided will calculate AHI (Apnea-hypopnea index) value.
Reports:
• Capability of labeling all arrhythmias with the operators input
• Modular with ability for operator to select modules to be included
• All reportable values and labels are edit-able by the operator
• Ability to remove and/or add sample ECG strips
Algorithm Performance:
• Based on quality of recorded data*
• The following values were calculated from the "MIT-BIH Arrhythmia Database":
•QRS Sensitivity: up to 98%
•QRS Positive Predictivity: up to 99%
•SVPB Sensitivity: up to 65%
•SVPB Positive Predictivity: up to 80%
•VPB Sensitivity: up to 95%
•VPB Positive Predictivity: up to 99%
*Noise in a recording can significantly affect the performance of the algorithm, however, all data is presented to the operator and can be presented in the report for review by the physician. Results are no lower than 2% of expected results. The accuracy calculation uses the methodology of 60601-2-47.
The HE/LX Analysis Software Package includes:• HE/LX Analysis Software disk
• License File disk
• Software HASP key
• USB flashcard reader
The HE/LX Analysis software must be installed on your hard drive in order to run. A license file must also be installed. A demo patient has been provided with your software. Otherwise, you will need a flash.dat file from a Holter recorder to begin analysis.
The FlashcardECG data recorded during the Holter period is saved on a removable flashcard. The DR181, DR200/HE and DR300 Holter recorders use an SD flashcard while the DR180+ Holter Recorder uses a compact flashcard. To input the data from the card to the computer system, first remove the flashcard from the recorder, and then insert it into your computer system’s card reader.
Depending on your computer and your card reader, a window may appear acknowledging that a card has been newly inserted and listing what files are present on the card. A recording saved by a NorthEast Monitoring recorder is named “flash.dat.” If the window appears, close it.
Into a USB SD card reader
To insert an SD flashcard into the drive, hold the card right-side up, with the missing corner away from you and to the right. Insert the opposite edge into the opening of the card reader. Push the card in gently until it is fully plugged in. Some card readers have a light indicating when a flashcard is properly
thEast Monitoring, Inc. NEMM027-Rev-M Page 8 of 117
HE/LX Analysis Operator’s Manual Introduction: Initializing a flashcard
NorthEas
In
inserted; if yours does, make sure the light comes on.
Into a USB compact card reader
To insert the compact flashcard into the reader, hold onto the card by the edge with the ridge and insert the opposite edge into the opening of the flashcard slot. Push the card in gently until it is fully plugged in. Some card readers have a light indicating when a flashcard is properly inserted; if yours does, make sure the light comes on.
Into a laptop PC card slot
First insert the flashcard into a flashcard adaptor; to do so, hold onto the card by the edge with the ridge and insert the opposite edge into the adapter. Then insert the adap-tor, right side up into the laptop’s card slot. If a window appears listing what files are on the flashcard, close it.
Initializing a flashcard Before using a new card for the first time, or between recordings, you may want to initialize your flashcard with a clean flash.data file.
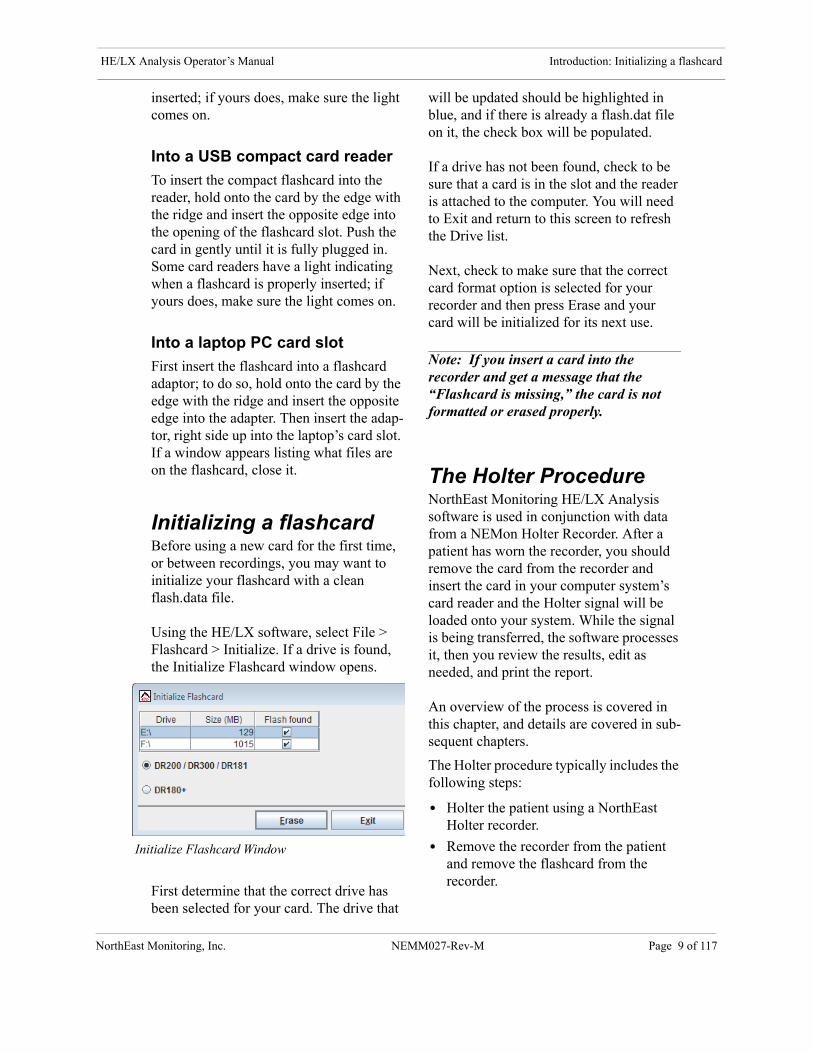
Using the HE/LX software, select File > Flashcard > Initialize. If a drive is found, the Initialize Flashcard window opens.
First determine that the correct drive has been selected for your card. The drive that
will be updated should be highlighted in blue, and if there is already a flash.dat file on it, the check box will be populated.
If a drive has not been found, check to be sure that a card is in the slot and the reader is attached to the computer. You will need to Exit and return to this screen to refresh the Drive list.
Next, check to make sure that the correct card format option is selected for your recorder and then press Erase and your card will be initialized for its next use.
Note: If you insert a card into the recorder and get a message that the “Flashcard is missing,” the card is not formatted or erased properly.
The Holter Procedure NorthEast Monitoring HE/LX Analysis software is used in conjunction with data from a NEMon Holter Recorder. After a patient has worn the recorder, you should remove the card from the recorder and insert the card in your computer system’s card reader and the Holter signal will be loaded onto your system. While the signal is being transferred, the software processes it, then you review the results, edit as needed, and print the report.
An overview of the process is covered in this chapter, and details are covered in sub-sequent chapters.
The Holter procedure typically includes the following steps:
• Holter the patient using a NorthEast Holter recorder.
• Remove the recorder from the patient and remove the flashcard from the recorder.
itialize Flashcard Window
t Monitoring, Inc. NEMM027-Rev-M Page 9 of 117

HE/LX Analysis Operator’s Manual Introduction: Online help
NorthEa
• Insert the flashcard into the computer’s card reader.
• Start the NorthEast HE/LX Analysis software.
• Enter/review information about the patient and the recording.
• Let the software analyze the Holter data.
• Review the templates in the Bin display to ensure that each type of beat is iden-tified properly. Edit bins, templates, or beats as necessary. Make measurements as necessary. (Bin feature not available in Enhanced Level.)
• Review what Critical Events were found throughout the recording. Save strips to document additional signifi-cant events for the final report.
• Review the Saved Strips, making sure that all significant events are docu-mented and labeled properly.
• Type your comments about the Holter test in the Report Summary.
• Create and print the final report to be reviewed by a physician.
Detailed information about the steps out-lined above appears in subsequent chapters in this manual.
Online helpIn addition to the information in this man-ual and the on-screen help messages that appear within the HE/LX Analysis soft-ware, more information and help is avail-able at our web site www.nemon.com or
• Toll Free in USA: 866-346-5837
• Phone: [+1] 978-461-3992
• Fax: [+1] 978-461-5991
• email: [email protected]
The “Support” page on the web-site includes software downloads, manuals FAQs and a whole lot more.
st Monitoring, Inc. NEMM027-Rev-M Page 10 of 117
2. PATIENT INFORMATION
The HE/LX Analysis software automatically retrieves the Holter signal, patient identification number, recorder number, date and time the recording started, and any diary entries that the patient saved using the EVENT button on the recorder from the flashcard from the recorder. All of this information is carried for-ward onto the Patient Information screen when the flashcard is read. You are now responsible for entering any additional data that you want to save on the Patient Information screen.
NorthEast Monito
Standar
While running the HE/LX Analysis software, you have the choice of opening the Patient Information window for (1) the last patient whose Holter test was accessed (that is, the “current” patient), (2) a previous patient whose Holter test has already been analyzed, or (3) a new patient whose Holter test has not yet been analyzed. In the first two cases, a patient record has already been created for the patient and the Holter data for the patient has already been downloaded from the flashcard onto the hard drive of your computer.
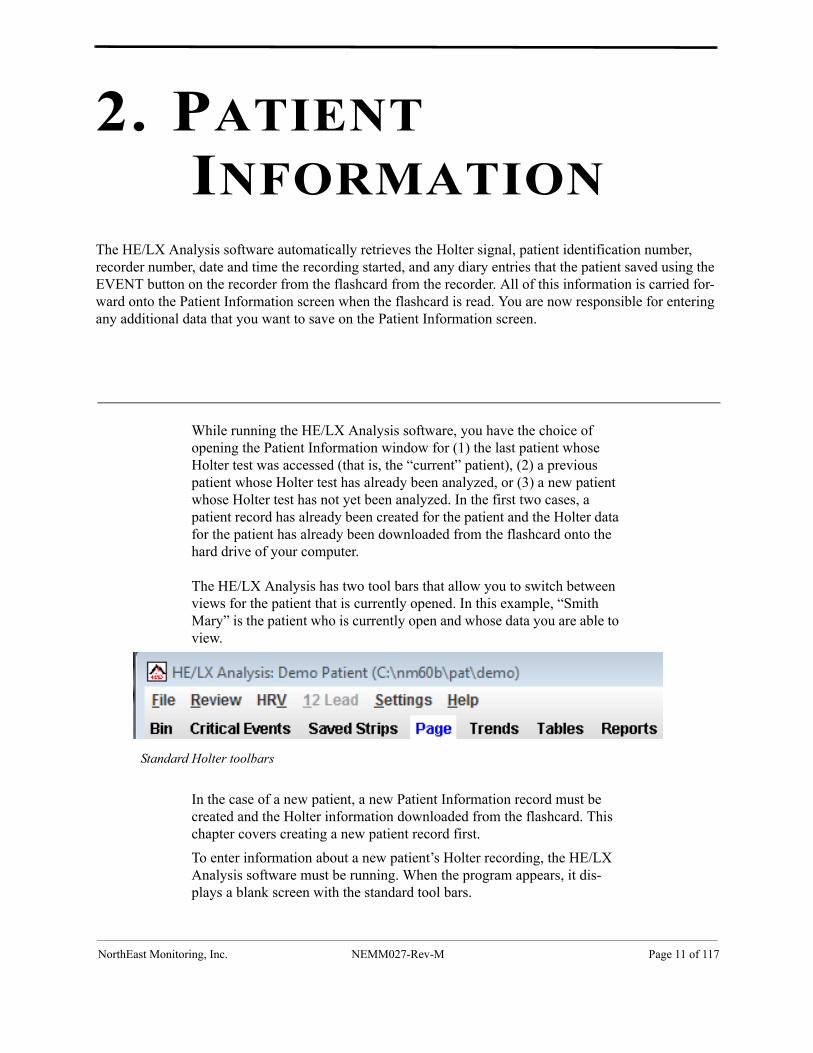
The HE/LX Analysis has two tool bars that allow you to switch between views for the patient that is currently opened. In this example, “Smith Mary” is the patient who is currently open and whose data you are able to view.
In the case of a new patient, a new Patient Information record must be created and the Holter information downloaded from the flashcard. This chapter covers creating a new patient record first.
To enter information about a new patient’s Holter recording, the HE/LX Analysis software must be running. When the program appears, it dis-plays a blank screen with the standard tool bars.
d Holter toolbars
ring, Inc. NEMM027-Rev-M Page 11 of 117
HE/LX Analysis Operator’s Manual Patient Information: Enter a new patient
NorthEa
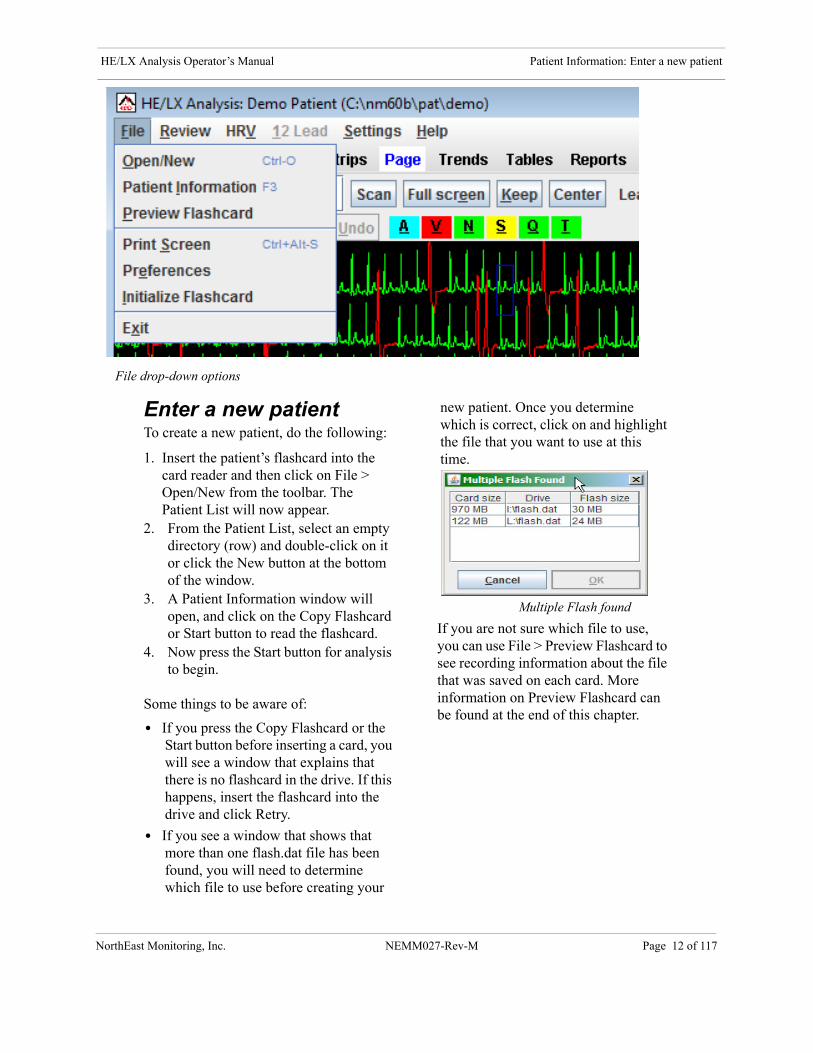
File
Enter a new patientTo create a new patient, do the following:
1. Insert the patient’s flashcard into the card reader and then click on File > Open/New from the toolbar. The Patient List will now appear.
2. From the Patient List, select an empty directory (row) and double-click on it or click the New button at the bottom of the window.
3. A Patient Information window will open, and click on the Copy Flashcard or Start button to read the flashcard.
4. Now press the Start button for analysis to begin.
Some things to be aware of:
• If you press the Copy Flashcard or the Start button before inserting a card, you will see a window that explains that there is no flashcard in the drive. If this happens, insert the flashcard into the drive and click Retry.
• If you see a window that shows that more than one flash.dat file has been found, you will need to determine which file to use before creating your
new patient. Once you determine which is correct, click on and highlight the file that you want to use at this time.
If you are not sure which file to use, you can use File > Preview Flashcard to see recording information about the file that was saved on each card. More information on Preview Flashcard can be found at the end of this chapter.
Multiple Flash found
drop-down options
st Monitoring, Inc. NEMM027-Rev-M Page 12 of 117

HE/LX Analysis Operator’s Manual Patient Information: Enter a new patient
Patient Information window
As the Holter data from the card loads onto your computer hard drive, you can enter or edit the patient information. You can hover your cursor over the title of a field to get more infor-mation, when available.
Note: Once the flash.dat has loaded, the “Copy flashcard” button in the Patient Infor-mation window changes to “Copy different flashcard.” If the ID from the recorder does not match the patient, remove the card, insert the correct one and click “Copy different flashcard.”
DOB and Age
The D.O.B. and Age fields work together. If you know the patient’s date of birth, enter it, and the software automatically calculates the patient’s age based on the D.O.B. and the recording date. If you do not know the date of birth, but know the age, type a numeric entry in the Age field, and select the appropriate unit (e.g., years) in the Age Unit field.
Type of Analysis/Report
Your system has been set up with a set of configurations or Type of Analysis/Reports to get you started.
The Custom configuration is identical to the Holter configu-ration, except that it includes the Report header that you entered in the Setup screen.
The configuration selected will load a set of default settings for the patient. At this point, you can override any of the settings by clicking on Settings and updating where you choose. After you save a patient with one type of analy-sis / report, you can change it, but all data that you edited, except for patient information, will be lost.
Note: For more information about Types of Analysis/Report, see Chapter 10: Configura-tions.
T f A l i /R t
New Patient Information window
NorthEast Monitoring, Inc. NEMM027-Rev-M Page 13 of 117

HE/LX Analysis Operator’s Manual Patient Information: Diary Information
NorthEa
Notes
The Notes field allows an alphanumeric entry that can be used to record informa-tion that might be helpful about the Holter test or the patient. It is not printed on the final report. To enter notes to be printed in the final report, use the Comments section of the Report summary.
BMI
HE/LX Analysis will calculate your patient’s Body Mass Index (BMI) if you enter the patient’s height and weight and the appropriate units. A patient’s weight status can be determined from the BMI as follows:
• Below 18.5 - Underweight
• 18.5 -24.9 - Normal
• 25 - 29.9 - Overweight
• 30 & Above - Obese
Diary InformationWhile wearing a NEMon Holter recorder, the patient can identify symptoms and activities in two ways:
(1) by pressing the Event/Diary button on the recorder and, possibly, entering a pre-coded symptom or activity, or
(2) by keeping a written record of times and symptoms or activities.
When analysis takes place, the software reads the Event/Diary button information directly from the flashcard and enters it automatically. You must type any signifi-
cant information from the written record manually into the Diary window from the Patient Information Screen.
To open the Diary Symptoms window, click the Diary button in the Patient Infor-mation window. If any entries are present initially, those are the diary entries that were automatically read from the flash-card. You can now add any additional diary entries at this time.
Note: Whether the software uses a 12- or 24-hour clock is determined by your computer’s setting in the Control Panel.
Date -. The date and time will initially be populated by the previous entry or the date recorded. If you need to edit the date, you can either do it manually by clicking on it or double-click on it to open the calendar edit screen
Time -. You should edit the time by dou-ble-clicking on the box. Since no two diary entries can contain the same date/time, be sure that you edit the time so that is not the same as what is entered above or below it. If two entries appear at the same date/time, you can edit the symptom to include both.
Symptom -. To enter a symptom, first click on the Symptom field next to the Date. Then enter the text either by typing a freeform entry or by clicking on the arrow
BMI on Patient Information Screen
Dairy symptoms window
st Monitoring, Inc. NEMM027-Rev-M Page 14 of 117
HE/LX Analysis Operator’s Manual Patient Information: 6-Minute Walk Assessment Window
North
to display a scrolling list of pre-typed entries. To enter a selection from the list, click on it; you can now edit the entry or move to the next field by clicking on it. Once a symptom is entered, the diary entry now exists. If there is no symptom, the diary entry does not exist.
When you have finished entering all written diary events, click the OK button to save your entries and return to the Patient Infor-mation window.
Delete -. To delete a diary entry, click on the trash can icon to the left of entry.
Editing -. If you add or modify diaries after analysis, the system will force an update and some of your editing of the ECG may be lost. For this reason, it is best to enter diaries before the analysis is started.
6-Minute Walk Assessment WindowIf you have a 6-Minute Walk Assessment patient, you are able to enter 6MWA data using the window that is accessible at the bottom of the Patient Information Screen. The 6MWA window allows you to enter data that wa recorded during the assessment. This data can be output by using the 6MWA front page that is available on the Reports screen.
To Change SettingsDuring Holter analysis, the HE/LX Analysis software makes decisions about the Holter signal based on a variety of predefined set-tings from the Type of Analysis/Report or Configuration you have chosen for your patient. After selecting a configuration, you can change any of the analysis criteria in the Settings windows, which are accessible from the menu displayed by clicking the
Settings button in the Patient Information window or by clicking the Settings menu item in the main tool bar.
Adjustments that can be made in the Set-tings windows are detailed in Chapter 3: Holter Analysis.
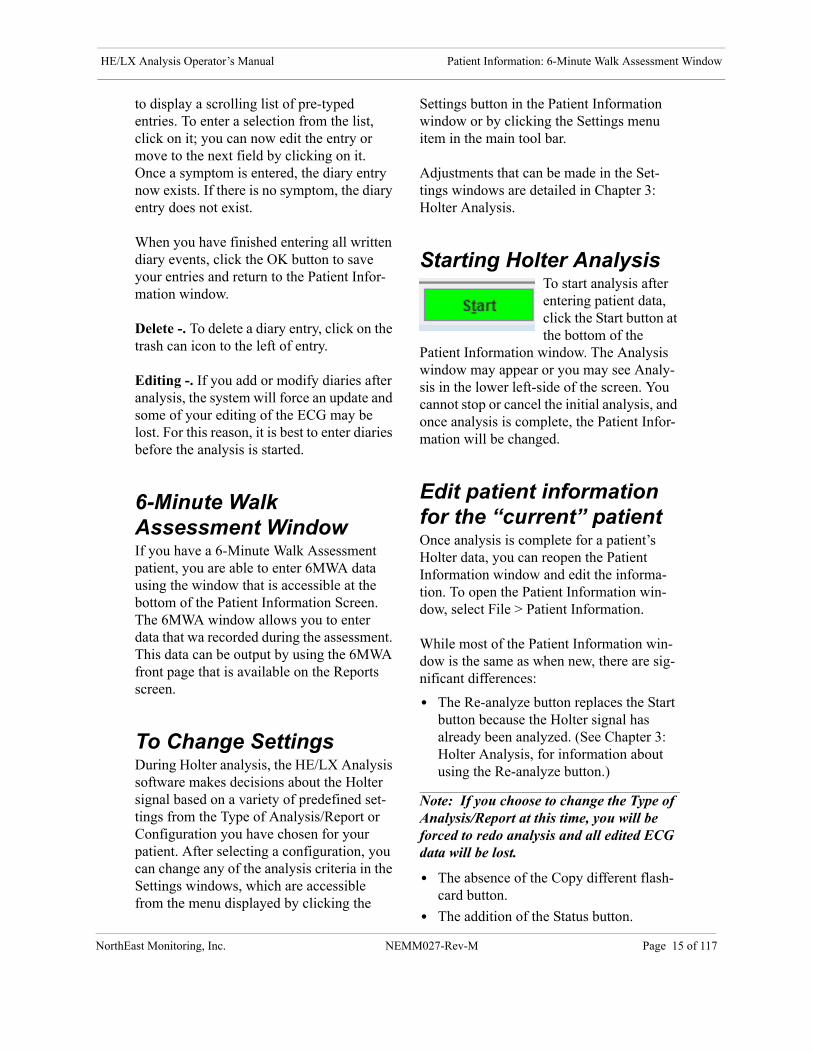
Starting Holter AnalysisTo start analysis after entering patient data, click the Start button at the bottom of the
Patient Information window. The Analysis window may appear or you may see Analy-sis in the lower left-side of the screen. You cannot stop or cancel the initial analysis, and once analysis is complete, the Patient Infor-mation will be changed.
Edit patient information for the “current” patient Once analysis is complete for a patient’s Holter data, you can reopen the Patient Information window and edit the informa-tion. To open the Patient Information win-dow, select File > Patient Information.
While most of the Patient Information win-dow is the same as when new, there are sig-nificant differences:
• The Re-analyze button replaces the Start button because the Holter signal has already been analyzed. (See Chapter 3: Holter Analysis, for information about using the Re-analyze button.)
Note: If you choose to change the Type of Analysis/Report at this time, you will be forced to redo analysis and all edited ECG data will be lost.
• The absence of the Copy different flash-card button.
• The addition of the Status button.
East Monitoring, Inc. NEMM027-Rev-M Page 15 of 117
HE/LX Analysis Operator’s Manual Patient Information: Edit patient information for the “current” patient
NorthEa
Cur
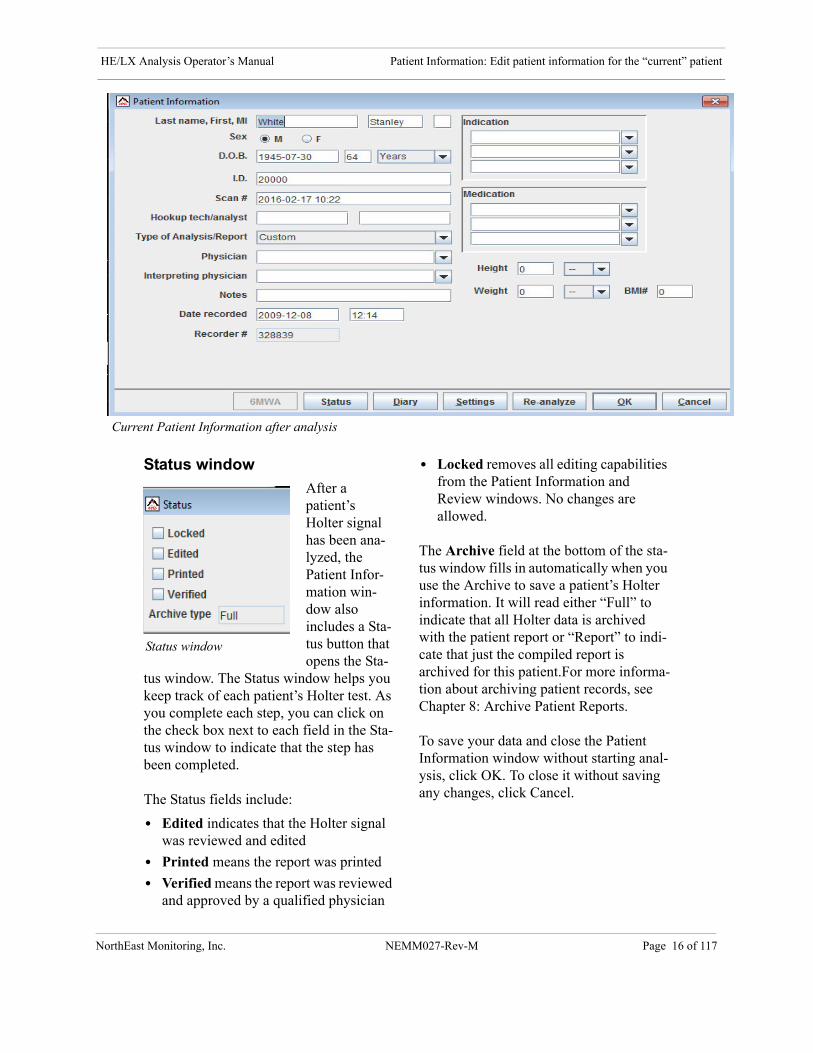
Status window
After a patient’s Holter signal has been ana-lyzed, the Patient Infor-mation win-dow also includes a Sta-tus button that opens the Sta-
tus window. The Status window helps you keep track of each patient’s Holter test. As you complete each step, you can click on the check box next to each field in the Sta-tus window to indicate that the step has been completed.
The Status fields include:
• Edited indicates that the Holter signal was reviewed and edited
• Printed means the report was printed
• Verified means the report was reviewed and approved by a qualified physician
• Locked removes all editing capabilities from the Patient Information and Review windows. No changes are allowed.
The Archive field at the bottom of the sta-tus window fills in automatically when you use the Archive to save a patient’s Holter information. It will read either “Full” to indicate that all Holter data is archived with the patient report or “Report” to indi-cate that just the compiled report is archived for this patient.For more informa-tion about archiving patient records, see Chapter 8: Archive Patient Reports.
To save your data and close the Patient Information window without starting anal-ysis, click OK. To close it without saving any changes, click Cancel.
Status window
rent Patient Information after analysis
st Monitoring, Inc. NEMM027-Rev-M Page 16 of 117
HE/LX Analysis Operator’s Manual Patient Information: The Current Patient
NorthEa
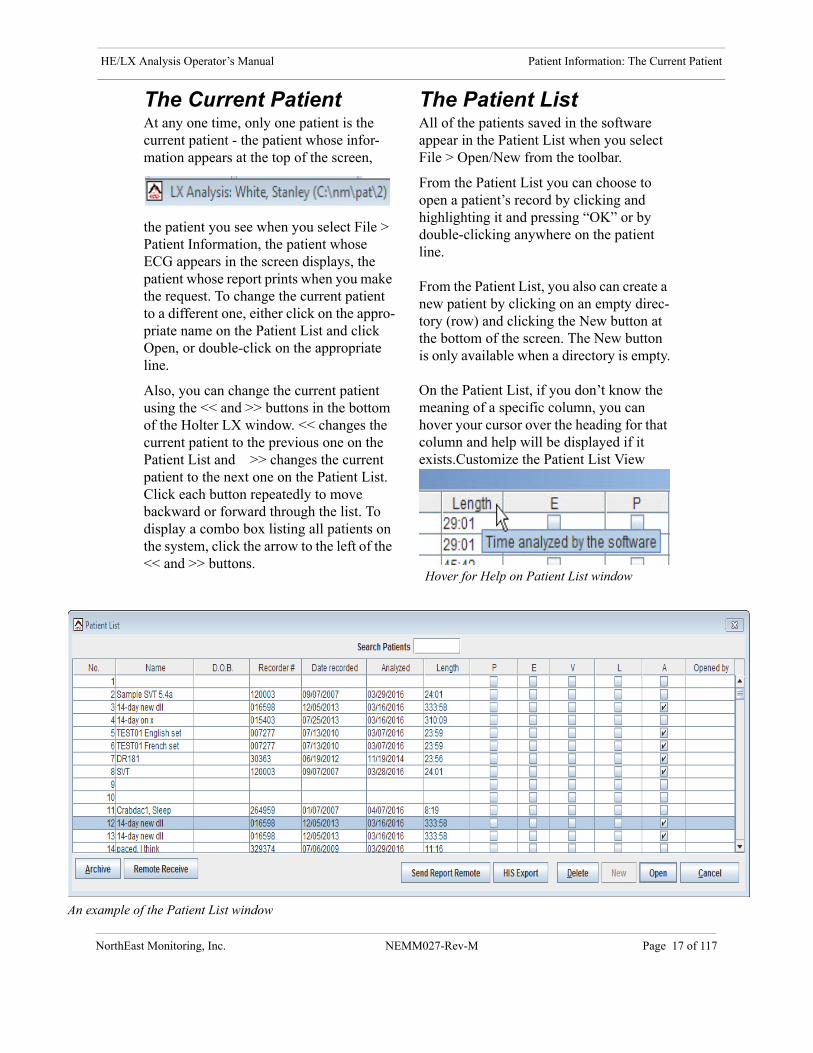
An example
The Current PatientAt any one time, only one patient is the current patient - the patient whose infor-mation appears at the top of the screen,
the patient you see when you select File > Patient Information, the patient whose ECG appears in the screen displays, the patient whose report prints when you make the request. To change the current patient to a different one, either click on the appro-priate name on the Patient List and click Open, or double-click on the appropriate line.
Also, you can change the current patient using the << and >> buttons in the bottom of the Holter LX window. << changes the current patient to the previous one on the Patient List and >> changes the current patient to the next one on the Patient List. Click each button repeatedly to move backward or forward through the list. To display a combo box listing all patients on the system, click the arrow to the left of the << and >> buttons.
The Patient ListAll of the patients saved in the software appear in the Patient List when you select File > Open/New from the toolbar.
From the Patient List you can choose to open a patient’s record by clicking and highlighting it and pressing “OK” or by double-clicking anywhere on the patient line.
From the Patient List, you also can create a new patient by clicking on an empty direc-tory (row) and clicking the New button at the bottom of the screen. The New button is only available when a directory is empty.
On the Patient List, if you don’t know the meaning of a specific column, you can hover your cursor over the heading for that column and help will be displayed if it exists.Customize the Patient List View
Hover for Help on Patient List window
of the Patient List window
st Monitoring, Inc. NEMM027-Rev-M Page 17 of 117
HE/LX Analysis Operator’s Manual Patient Information: The Patient List
NorthE
You are able to customize the Patient List for your specific needs in the following ways:
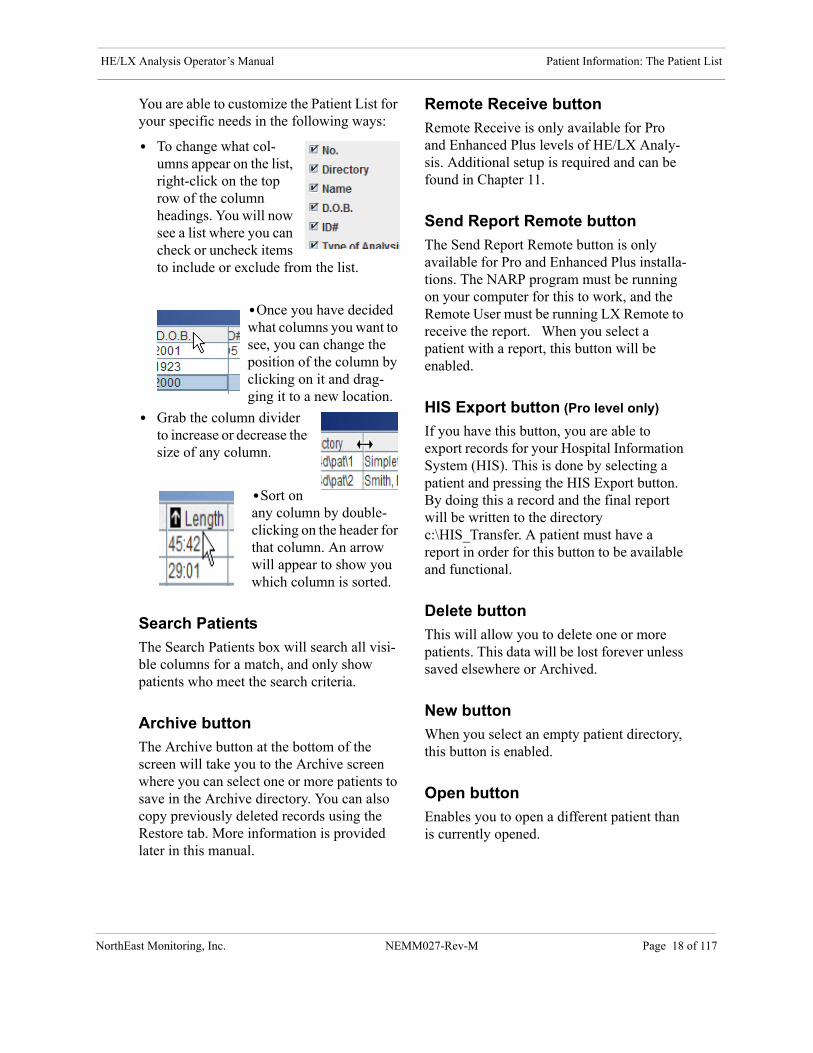
• To change what col-umns appear on the list, right-click on the top row of the column headings. You will now see a list where you can check or uncheck items to include or exclude from the list.
•Once you have decided what columns you want to see, you can change the position of the column by clicking on it and drag-ging it to a new location.
• Grab the column divider to increase or decrease the size of any column.
•Sort on any column by double-clicking on the header for that column. An arrow will appear to show you which column is sorted.
Search Patients
The Search Patients box will search all visi-ble columns for a match, and only show patients who meet the search criteria.
Archive button
The Archive button at the bottom of the screen will take you to the Archive screen where you can select one or more patients to save in the Archive directory. You can also copy previously deleted records using the Restore tab. More information is provided later in this manual.
Remote Receive button
Remote Receive is only available for Pro and Enhanced Plus levels of HE/LX Analy-sis. Additional setup is required and can be found in Chapter 11.
Send Report Remote button
The Send Report Remote button is only available for Pro and Enhanced Plus installa-tions. The NARP program must be running on your computer for this to work, and the Remote User must be running LX Remote to receive the report. When you select a patient with a report, this button will be enabled.
HIS Export button (Pro level only)
If you have this button, you are able to export records for your Hospital Information System (HIS). This is done by selecting a patient and pressing the HIS Export button. By doing this a record and the final report will be written to the directory c:\HIS_Transfer. A patient must have a report in order for this button to be available and functional.
Delete button
This will allow you to delete one or more patients. This data will be lost forever unless saved elsewhere or Archived.
New button
When you select an empty patient directory, this button is enabled.
Open button
Enables you to open a different patient than is currently opened.
ast Monitoring, Inc. NEMM027-Rev-M Page 18 of 117
HE/LX Analysis Operator’s Manual Patient Information: Remote Receive
NorthEa
Remote
Remote Receive(Pro and Enhanced Plus levels only)
The HE/LX Analysis software is able to receive files from either the LX Remote web-based system or the DR300 Socket software.
Note: Please ask your technical profes-sional for assistance in setting this up. Refer to Chapter 11 for information on setting up Remote Receive.
When enabled, there is a window at the bottom of the screen that tells you whether remote files are avail-able, or if your remote process is not run-ning.
Remote Receive Screen
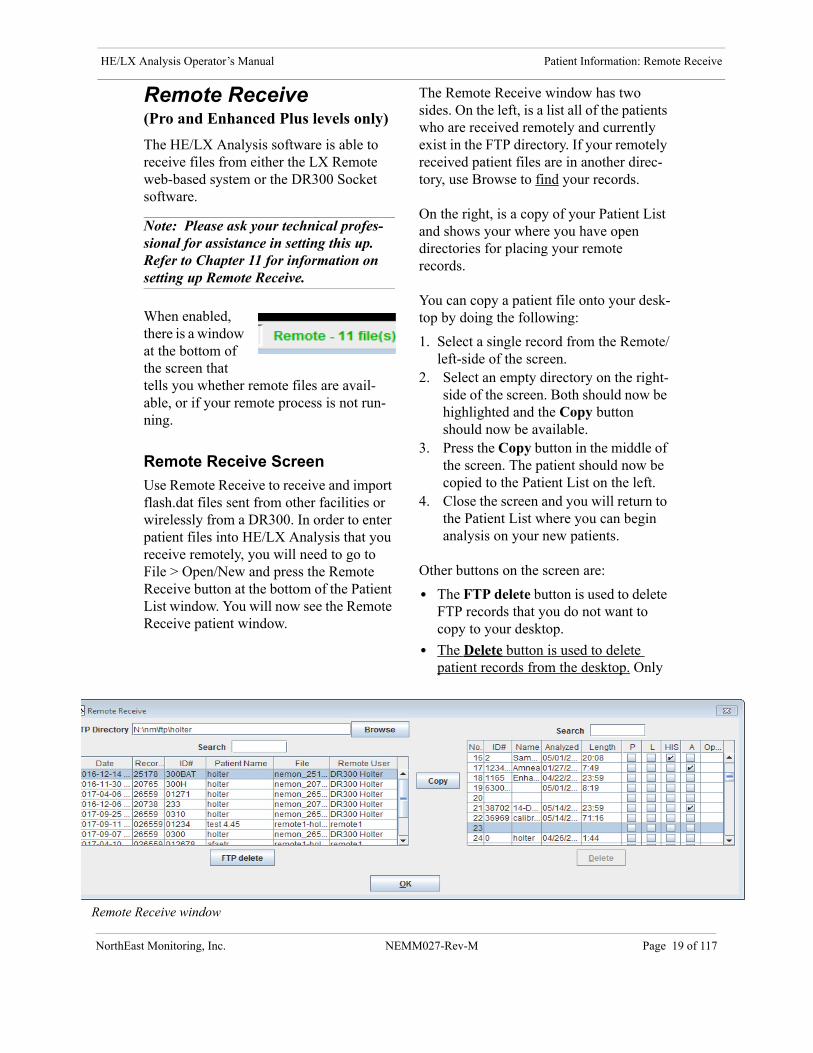
Use Remote Receive to receive and import flash.dat files sent from other facilities or wirelessly from a DR300. In order to enter patient files into HE/LX Analysis that you receive remotely, you will need to go to File > Open/New and press the Remote Receive button at the bottom of the Patient List window. You will now see the Remote Receive patient window.
The Remote Receive window has two sides. On the left, is a list all of the patients who are received remotely and currently exist in the FTP directory. If your remotely received patient files are in another direc-tory, use Browse to find your records.
On the right, is a copy of your Patient List and shows your where you have open directories for placing your remote records.
You can copy a patient file onto your desk-top by doing the following:
1. Select a single record from the Remote/left-side of the screen.
2. Select an empty directory on the right-side of the screen. Both should now be highlighted and the Copy button should now be available.
3. Press the Copy button in the middle of the screen. The patient should now be copied to the Patient List on the left.
4. Close the screen and you will return to the Patient List where you can begin analysis on your new patients.
Other buttons on the screen are:
• The FTP delete button is used to delete FTP records that you do not want to copy to your desktop.
• The Delete button is used to delete patient records from the desktop. Only
Receive window
st Monitoring, Inc. NEMM027-Rev-M Page 19 of 117
HE/LX Analysis Operator’s Manual Patient Information: Preview data on flashcard
NorthEa
do this if the patient has already been archived or you no longer need this patient information.
• The OK button will return you to the previous screen.
As with the Patient List, both sides of the screen can be customized for what col-umns appear, column width and column order.
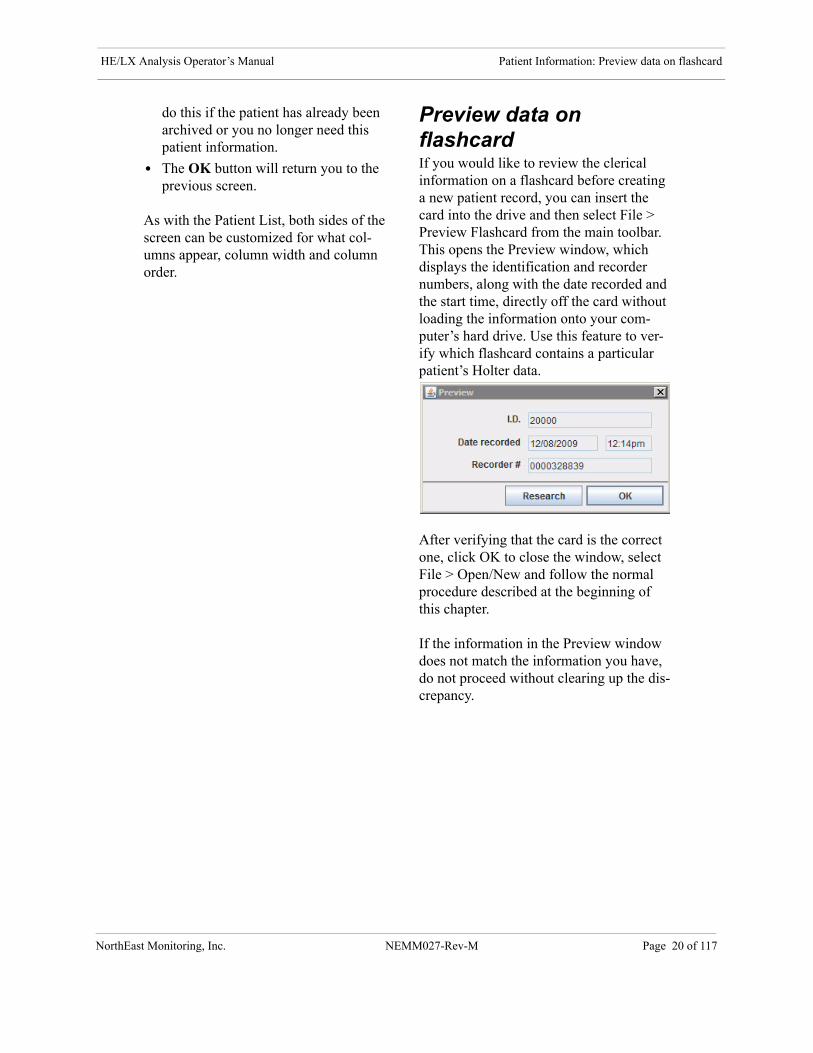
Preview data on flashcardIf you would like to review the clerical information on a flashcard before creating a new patient record, you can insert the card into the drive and then select File > Preview Flashcard from the main toolbar. This opens the Preview window, which displays the identification and recorder numbers, along with the date recorded and the start time, directly off the card without loading the information onto your com-puter’s hard drive. Use this feature to ver-ify which flashcard contains a particular patient’s Holter data.
After verifying that the card is the correct one, click OK to close the window, select File > Open/New and follow the normal procedure described at the beginning of this chapter.
If the information in the Preview window does not match the information you have, do not proceed without clearing up the dis-crepancy.
st Monitoring, Inc. NEMM027-Rev-M Page 20 of 117
3. HOLTER ANALYSISThis chapter addresses the features that you have control over during analysis, re-analysis and updating. During analysis, the HE/LX Analysis software detects each R-wave; determines the patient’s normal mor-phology; establishes normal, ventricular and paced templates; matches every beat to a template; counts normal, supraventricular, ventricular and paced beats, including any pairs and runs; measures RR intervals and calculates heart rates; does ST segment and AF analysis; counts other abnormalities as defined in the Scanning Criteria; and saves sample strips for the final report. You can review and edit decisions made by the software; the information is then either re-analyzed or updated to include your changes.
NorthEast
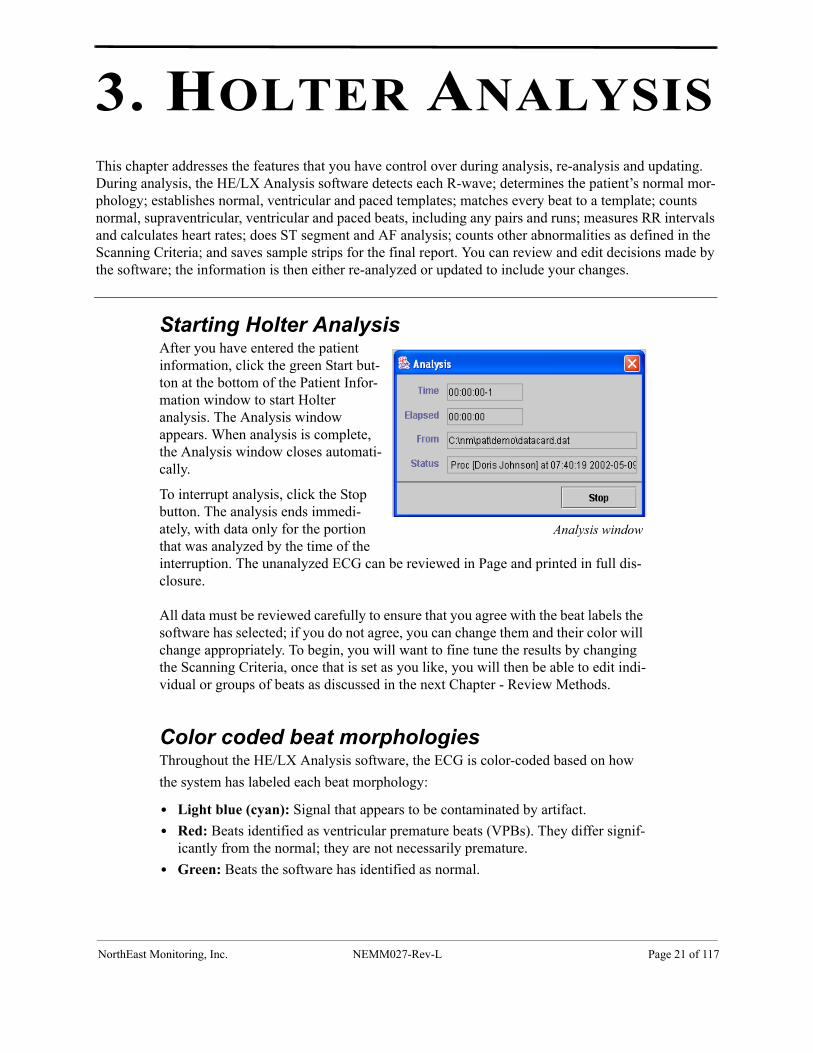
Starting Holter AnalysisAfter you have entered the patient information, click the green Start but-ton at the bottom of the Patient Infor-mation window to start Holter analysis. The Analysis window appears. When analysis is complete, the Analysis window closes automati-cally.
To interrupt analysis, click the Stop button. The analysis ends immedi-ately, with data only for the portion that was analyzed by the time of the interruption. The unanalyzed ECG can be reviewed in Page and printed in full dis-closure.
All data must be reviewed carefully to ensure that you agree with the beat labels the software has selected; if you do not agree, you can change them and their color will change appropriately. To begin, you will want to fine tune the results by changing the Scanning Criteria, once that is set as you like, you will then be able to edit indi-vidual or groups of beats as discussed in the next Chapter - Review Methods.
Color coded beat morphologiesThroughout the HE/LX Analysis software, the ECG is color-coded based on how
the system has labeled each beat morphology:
• Light blue (cyan): Signal that appears to be contaminated by artifact.
• Red: Beats identified as ventricular premature beats (VPBs). They differ signif-icantly from the normal; they are not necessarily premature.
• Green: Beats the software has identified as normal.
Analysis window
Monitoring, Inc. NEMM027-Rev-L Page 21 of 117
HE/LX Analysis Operator’s Manual Holter Analysis: Beat Labeling
N
• Yellow: Beats identified as supraventricular premature beats (SVPBs). They have a nor-mal morphology, but fall early.
• Orange: Beats identified as part of an AF event (either Atrial fibrillation or Atrial flut-ter). Pro and Enhanced Plus levels only.
• Cobalt blue: Beats identified as paced.
• White: Beats identified as pauses, based on the definition in the Scanning Criteria win-dow. The white overrides any other color that the beat may also qualify for (e.g., red because it’s a VPB).
In addition to the labels the software can provide for each beat, there are some labels only you can use to relabel beats. These are:
• Questionable (Unknown): Use this label to separate out beats you cannot identify and keep them from being included in another category. They are colored green, like nor-mals. This can be used as a template or a beat label.
• T-wave: Use this label if the software has identified a portion of the signal as a QRS, but it is not. This will remove the beat from the counts and will merge its RR interval with the preceding RR interval. The signal will take the color of whatever beat precedes it. This can only be a beat label.
Beat Labeling Once the beat morphologies are established, arrhythmia analysis starts by labeling each beat. The beat labels that are automatically assigned by the analysis process are assigned in the fol-lowing order:
1. Event - the time-of-day when either (1) the event button was pushed or (2) an entry was manually typed into the Diary Symptoms window
2. Artifact - ECG Signal that appears to be contaminated by artifact
3. VTAC - three or more VPBs in a row, regardless of heart rate
4. Failure to Sense - the occurrence of a paced beat too soon following another beat; that is, too short an RR interval
5. Failure to Capture- the presence of a pace-maker spike without a following R-wave
6. Inhibition - the absence of a paced beat when it should occur; that is, too long an RR interval
7. VPB Pair - two VPBs in a row8. Bigeminy - an alternating pattern of single
VPBs and normal beats, with at least three VPBs in the series; that is - NVNVNVN
9. Trigeminy - a pattern of single VPBs every third beat, with normals in between, with at least three VPBs in the series; that is - VNNVNNVN
10. Quadrigeminy - a pattern of single VPBs every fourth beat, with normals in between, with at least three VPBs in the series; that is - VNNNVNNNVN
11. VPB- a single beat that matches a ventric-ular template, regardless of prematurity
12. SVT - three or more SVPBs in a row, the first 3 beats must meet the SVT Heart rate
13. SVPB Pair - two SVPBs in a row that meet the SVT Heart rate
14. SVPB- a beat that matches a normal tem-plate, but occurs at least as early as the SVPB prematurity setting in the Scanning Criteria window
15. Missed beat16. PAT (paroxysmal atrial tachycardia) - a
sudden rate increase, 2x the normal rate, stable before and stable after
17. Tachycardia - a heart rate at least as fast as the Tachycardia setting in the Scanning Criteria window
18. Bradycardia - a heart rate at or below the Bradycardia setting in the Scanning Crite-ria window
19. Unknown or Questionable20. AF (Event) - AF consists of Atrial Fibrilla-
tion and/or Atrial Flutter. To be labeled as AF, beats must meet both Minimum AF Peak HR and Minimum AF Time require-
orthEast Monitoring, Inc. NEMM027-Rev-L Page 22 of 117
HE/LX Analysis Operator’s Manual Holter Analysis: Scanning Criteria
No
ments in the Scanning Criteria. VPB and artifact beats can occur within an AF event. VPB and artifact that falls within an AF event, will be included in the AF time, but the beats will not be counted as AF beats, but as VPB or artifact, respectively.
21. Irregular HR (Sinus Arrhythmia) - a variability in sequential R-R interval
22. AV Paced – both atrial and ventricular23. A. Paced – Atrial only24. V. Paced – Ventricular only25. Normal - None of the above
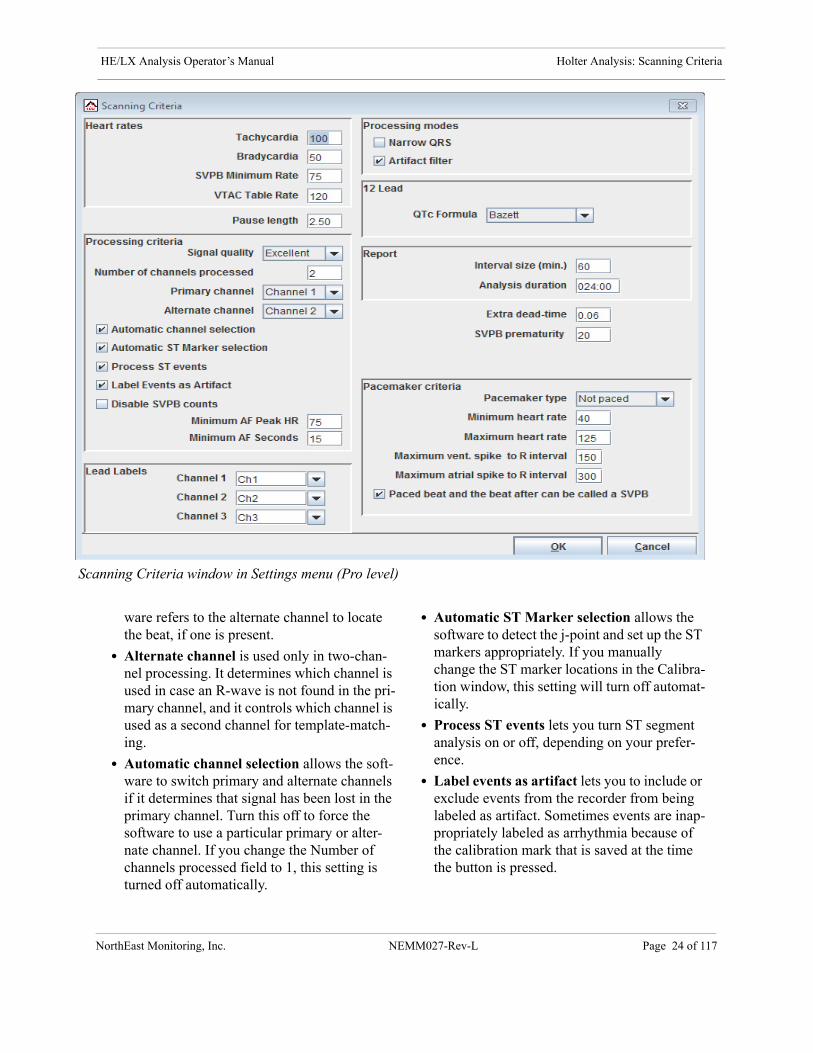
Scanning CriteriaThe Scanning Criteria are used during Holter analysis to define some of the arrhythmias labeled by the software, along with settings that control the amount of information pro-cessed.
Note: The Pro level of software has all of the settings listed below. The Enhanced versions of the software have a reduced number of settings.
The adjustable criteria include:
• Tachycardia defines at least how fast a heart rate must be for the Tachycardia label to appear. All beats that occur at that heart rate or above are included in the tachycardia beat count in the Tachy/Brady table in the Tables window.
• Bradycardia defines how low the heart rate must be for the Bradycardia label to appear. All beats that occur at that heart rate or below are included in the bradycardia beat count in the Tachy/Brady table in the Tables window.
• SVPB Minimum Rate is the minimum heart rate required for a beat to be labeled SVPB. If not listed in Scanning Criteria, 75 bpm is used.
• VTAC Table Rate separates fast and slow runs of VPBs that appear in the Ventricular
Runs table of the Tables window and in the Report Summary. In all other areas of the software, slow and fast ventricular runs are combined in the VTAC counts.
• Pause length (sec.) defines how long an RR interval must be for the beat at its onset to be called a Pause and appear white on the col-ored display. This RR interval can be initi-ated by any type of beat except artifact.
• Signal quality has three settings that control the amount of artifact that is tolerated before the signal is thrown out because of too much artifact: 1.Research turns off the artifact detector so
that none of the signal except the first min-ute and the last minute of the recording is called artifact. This results in the analysis of all the signal, including any artifact.
2. Excellent allows the software to detect and reject a moderate amount of artifact. Any signal that is determined to be con-taminated with artifact appears light blue and is not analyzed. Anything that occurs during periods of artifact is not counted.
3. Normal allows the software to discard any signal that it considers contaminated by artifact. Anything that occurs during periods of artifact is not counted.
• Number of channels processed determines whether the software uses one or two chan-nels to determine the location of an R-wave and what template each matches. Single-channel analysis uses just the channel set in the Primary channel field. Dual-channel analysis uses the Primary channel to locate R-waves first, then refers to the Alternate channel as a back-up channel to locate R-waves, and both primary and alternate to do template-matching.
• Primary channel determines which channel is used during analysis. For single-channel analysis, the primary one is the only one used to locate R-waves and do template-matching. For dual-channel analysis, the pri-mary channel is used first to locate R-waves, but if an R-wave cannot be located, the soft-
rthEast Monitoring, Inc. NEMM027-Rev-L Page 23 of 117
HE/LX Analysis Operator’s Manual Holter Analysis: Scanning Criteria
N
Sca
ware refers to the alternate channel to locate the beat, if one is present.
• Alternate channel is used only in two-chan-nel processing. It determines which channel is used in case an R-wave is not found in the pri-mary channel, and it controls which channel is used as a second channel for template-match-ing.
• Automatic channel selection allows the soft-ware to switch primary and alternate channels if it determines that signal has been lost in the primary channel. Turn this off to force the software to use a particular primary or alter-nate channel. If you change the Number of channels processed field to 1, this setting is turned off automatically.
• Automatic ST Marker selection allows the software to detect the j-point and set up the ST markers appropriately. If you manually change the ST marker locations in the Calibra-tion window, this setting will turn off automat-ically.
• Process ST events lets you turn ST segment analysis on or off, depending on your prefer-ence.
• Label events as artifact lets you to include or exclude events from the recorder from being labeled as artifact. Sometimes events are inap-propriately labeled as arrhythmia because of the calibration mark that is saved at the time the button is pressed.
nning Criteria window in Settings menu (Pro level)
orthEast Monitoring, Inc. NEMM027-Rev-L Page 24 of 117

HE/LX Analysis Operator’s Manual Holter Analysis: Scanning Criteria
NorthEa
Scan
• Disable SVPB Counts prevents the sys-tem from label beats as SVPBs. SVPB beats can be labeled manually.
• Minimum AF Peak HR is the mini-mum HR which at least any 2 beats of the previous 20 must reach. AF includes both Atrial Fibrillation and Atrial flutter. Valid entries are 30-250. Enter a large value to reduce the amount of AF while keeping Irregular HR labels.
• Minimum AF Seconds is the minimum amount of time In seconds required to label irregular HR as AF. AF can consist of both Atrial Fibrillation and Atrial Flutter. Valid entries are 15-300 sec-onds, or enter 0 seconds to turn AF and Irregular HR Off.
• Lead Labels allows you to change the label for each channel. You can also enter a label of your own by typing in a new entry.
• Narrow QRS permits the software to identify narrower-than-normal QRS complexes, like those seen in pediatric patients, as normal beats. Turn this on routinely for pediatric patients.
• Artifact filter works in conjunction with the Signal quality setting. If it is turned on and Signal quality is set to Normal, the filter limits the response to 20 Hz, instead of 70. If it is on and the Signal quality is set to Excellent or Research, the filter limits the response to 30 Hz instead of 70.
• QTc Calculation lets you choose which formula to use for QTc calculation. (To calculate QTc, you need to have either a 12-Lead recording or a derived data set using the AVEQT utility. If using the AVEQT utility, contact Support for more details.) The formulae are as fol-lows:1. Bazett: QT/(RR^(1/2))
ning Criteria window in Settings menu (Enhanced Plus level)
st Monitoring, Inc. NEMM027-Rev-L Page 25 of 117

HE/LX Analysis Operator’s Manual Holter Analysis: Scanning Criteria
NorthEa
Scan
2. Hodges: QT + 1.75*(60/RR - 60)3. Framingham: QT + 0.154*(1-RR)4. Frederica: QT/(RR^(1/3))
• Interval size (min.) determines how many minutes are including in each interval in the interval tables of the Tables window.
• Analysis duration determines how many hours of data are analyzed. All the ECG loads in from the memory/ flash-card during analysis, but analysis stops after the amount of time indicated here. It uses the HHH:MM format, with the first three digits indicating how many hours and the second two indicating how many minutes. A maximum of 336 hours (14 days) may be entered.
• Extra dead-time controls the tail end of the dead-time period following an R-wave during which another QRS com-plex cannot be detected, allowing for the presence of a T-wave. Increase the time
(in seconds) if large T-waves are being identified as R-waves. See details in Appendix A.
• SVPB prematurity (percent) sets the requirement for how early a beat that matches a normal template must be for it to be identified as an SVPB. For exam-ple, at a heart rate of 60 bpm, a normal RR interval is 1 second long, and a beat that is 10 percent premature would fall at 0.9 seconds after the preceding beat. The SVPB Minimum Heart Rate must also be met.
• Pacemaker type contains four settings that allow the software to expect certain behavior:1.Not paced means that the software
will not identify any pacemaker spikes, beats or failures.
2. VVI means that each paced beat will be preceded by a single spike. All
ning Criteria window in Settings menu (Enhance level)
st Monitoring, Inc. NEMM027-Rev-L Page 26 of 117
HE/LX Analysis Operator’s Manual Holter Analysis: Re-analysis
NorthEa
paced beats are counted as ventricular paced.
3. AV sequential means that paced beats will be preceded by two pacemaker spikes, one atrial and one ventricular. All paced beats are counted as AV paced.
4. DDD means that paced beats can be preceded by either one or two pace-maker spikes. Depending on the spike’s location relative to the follow-ing R-wave, a beat preceded by a sin-gle spike can be called either atrial paced or ventricular paced, while a beat preceded by two spikes can be counted as AV paced.
• Minimum heart rate refers to the mini-mum rate allowed by the pacemaker. If the pacemaker does not fire appropri-ately and there is an RR interval longer than the patient should experience, the Inhibition label appears.
• Maximum heart rate refers to the max-imum rate initiated by the pacemaker. If the pacemaker fires early, typically because it did not sense the previous beat, it would result in a faster rate, the Sense failure label appears.
• Maximum vent. spike to R interval sets the maximum time between the fir-ing of the second pacemaker spike and the following R-wave. If the second spike appears and is not followed by an R-wave in this amount of time, the Cap-ture failure label appears.
• Maximum atrial spike to R interval sets the limit for how long is allowed between a single spike and the subse-quent R-wave. If a single spike occurs and the following R-wave is not within this amount of time, the Capture failure label appears.
• Paced beat and the beat after can be called a SVPB is a setting that allows you to identify early beats following a
paced beat as SVPBs because they are premature.
Note: Refer to the section “Pacemaker analysis” in this chapter for more infor-mation about the pacemaker settings.
Re-analysisIf you have already analyzed the patient’s Holter, changes that you make to some of the settings may force the software to re-analyze the patient’s data, while others require an update to take effect. When re-analysis takes place, the patient will be newly analyzed and all editing changes you have made previously will be lost.
Note: Because re-analysis is required after a change in some Settings, be sure to make any changes to the Settings before you work on the final report. Any bin, template or beat editing, along with manually saved sample strips and typed comments will be lost after some changes in the Settings.
Re-analysis is required after changing any of the settings in the Processing criteria, Pacemaker criteria and Processing modes, as well as Analysis duration or Extra dead-time.
After making a change to any of these set-tings and clicking on OK to close the win-dow, the software asks you to confirm that you want the data re-analyzed or not. If you want the change to take effect, click Yes. If not, click No, and your changes to Settings will not be saved.
st Monitoring, Inc. NEMM027-Rev-L Page 27 of 117

HE/LX Analysis Operator’s Manual Holter Analysis: Update
Nor
UpdateSome changes in the Settings require an update afterward, just as beat, template and bin editing (in Enhanced Plus and Pro) and single-beat and all-matches editing in Page require an update afterward.
Note: Because update is required after a change in some Settings, be sure to make any changes to the Settings before you edit Saved Strips, Tables and Report Summary for the final report. Bin, template or beat editing done before the update will not be lost.
The update incorporates simple changes into all other aspects of the report. For example, a change in all matches to a beat with 12 matches from ventricular to aberrant will affect other aspects of the report: the total count of VPBs will decrease by 12 and SVPBs will increase by 12 in Tables, Critical Events, Trends, and Report Summary. In addi-tion, different Saved Strips will be selected.
Those changes in Settings that require an update are all those in the What Strips to Auto Save and How Often Strips Auto Save win-dows, along with these settings in the Scan-ning Criteria window - Tachycardia, Bradycardia, SVT and VTAC rates, Pause length, QTc Formula, Interval size, and the SVPB prematurity setting.
If the “Automatically Update feature” is turned on in the Preferences window, the update will occur automatically when you close the Settings window.
If an Update but-ton appears in your Review tool-bar, the Auto-matic Update feature is turned off in the Prefer-
ences window. That means that after some editing changes, you must click the Update button to incorporate your changes. After you make changes that require an update, the Update button will become enabled and will blink red as a reminder that you must at some point click it.
Update required
thEast Monitoring, Inc. NEMM027-Rev-L Page 28 of 117

HE/LX Analysis Operator’s Manual Holter Analysis: What Strips to Auto Save
North
What Strips to Auto SaveAll the different types of strip labels the soft-ware uses appear in this window. The soft-ware uses these labels to identify one particular beat or event (for example, the “current” beat or the beat centered in a Saved Strip). Each label can be turned off or on to indicate whether sample strips of that type should be saved for the final report. A check mark indicates that sample strips with that label will be saved.
Click on a label or its check box to turn it off or on. Click on the button Select/Deselect All to turn all labels on or off. Click OK to save changes and close the window, and click Cancel to close the window without saving changes.
Note: The Pro level of software has all of the strip labels listed below. The Enhanced levels have a reduced number of strip labels.
The strip labels in the What Strips to Auto Save window are as follows:
• VPB
• VPB pair
• VTAC
• Bigeminy
• Trigeminy
• Quadrigeminy
• Longest VTAC - the longest run of three or more VPBs, regardless of rate
• Fastest VTAC - the run of three or more VPBs with the fastest heart rate
Pacemaker Analysis - For more information,
refer to the section “Pacemaker Analysis” in this chapter.
• Failure to capture - Pacemaker only
• Failure to sense - Pacemaker only
• Inhibition - Pacemaker only
• SVPB
• SVPB pair
• SVT
• Longest SVT - the longest run of three or more SVPBs, regardless of rate
• Fastest SVT - the run of three or more SVPBs with the fastest heart rate
ST Segment Analysis - For more informa-tion on ST Analysis, refer to the section “ST Segment Analysis” in this chapter. T he Depression and Elevation check-boxes are NOT strip labels. Instead, they determine whether strips of the following types are saved for each episode of ST Depression or Elevation detected by the software.
What Strips to Auto Save window in Settings menu (Pro level)
East Monitoring, Inc. NEMM027-Rev-L Page 29 of 117

HE/LX Analysis Operator’s Manual Holter Analysis: What Strips to Auto Save
NorthEa
W
• Depression - at least a 1 millimeter depression in the ST segment compared to the patient’s normal
• Elevation - at least a 1 millimeter eleva-tion in the ST segment compared to the patient’s normal
• Baseline - a sample of the patient’s nor-mal ST segment preceding a detected event
• Onset - near the beginning of a detected event, at the time the change is 0.5 mm.
• Maximum HR - the ECG when the maximum heart rate occurred during the event
• Maximum deviation - the ECG at the point of maximum change from the nor-mal
• End - the ECG after the patient has re-established normal
• AF - AF events
• Longest AF - the longest period of AF
• Fastest AF - the fastest period of AF based on AF HR
• Pause - an RR interval at least as long as the Pause length in the Scanning Criteria window
• Tachycardia
• Bradycardia
• Irregular RR
• Minimum HR - the minimum heart rate calcu-lated using the heart rate algo-rithm described in Appendix A, gen-erally a four-beat
running average
• Maximum HR - the maximum heart rate calculated using the heart rate algo-rithm described in Appendix A, gener-ally a four-beat running average
• Shortest RR - the shortest RR interval measured during the Holter period, excluding those before or after artifact
• Longest RR - the longest RR interval measured during the Holter period, excluding those before or after artifact
• Diary or event
• Save 1 strip/hour - a strip at the onset of each new hour
• Calibration strip - the calibration sig-nal at the onset of the Holter recording
hat Strips to Auto Save window in Settings menu (Enhanced levels)
st Monitoring, Inc. NEMM027-Rev-L Page 30 of 117
HE/LX Analysis Operator’s Manual Holter Analysis: How Often Strips Auto Save
NorthEa
How O
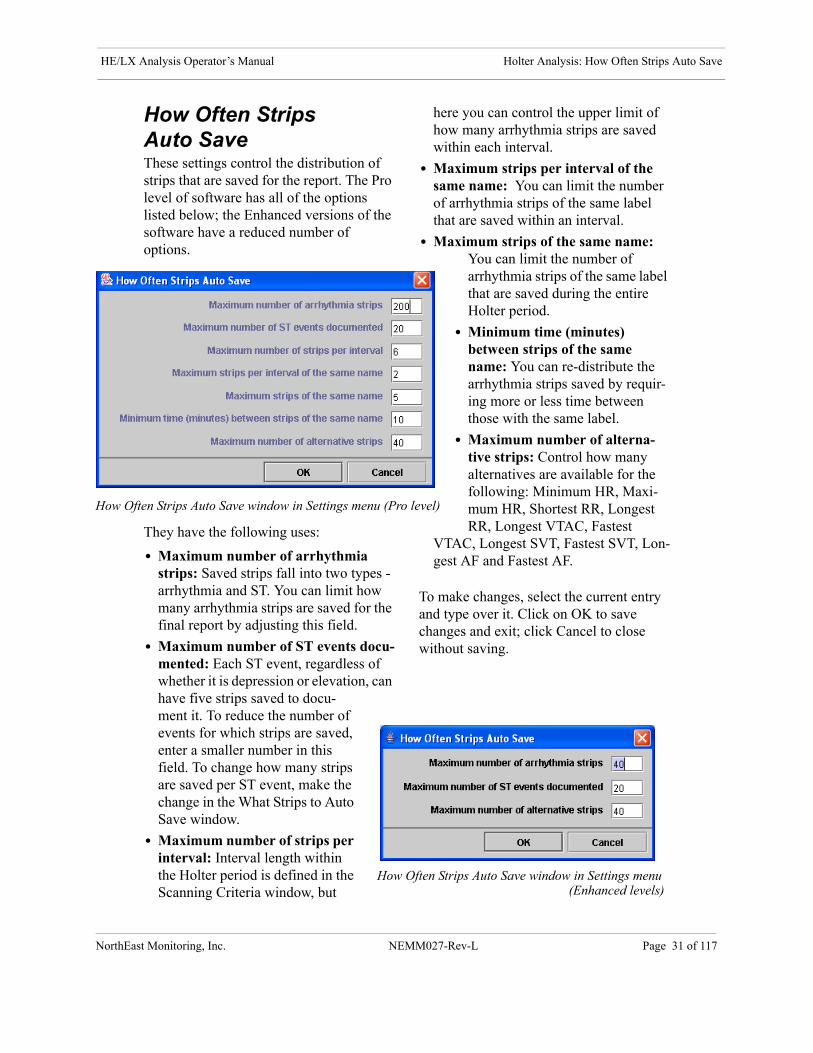
How Often Strips Auto SaveThese settings control the distribution of strips that are saved for the report. The Pro level of software has all of the options listed below; the Enhanced versions of the software have a reduced number of options.
They have the following uses:
• Maximum number of arrhythmia strips: Saved strips fall into two types - arrhythmia and ST. You can limit how many arrhythmia strips are saved for the final report by adjusting this field.
• Maximum number of ST events docu-mented: Each ST event, regardless of whether it is depression or elevation, can have five strips saved to docu-ment it. To reduce the number of events for which strips are saved, enter a smaller number in this field. To change how many strips are saved per ST event, make the change in the What Strips to Auto Save window.
• Maximum number of strips per interval: Interval length within the Holter period is defined in the Scanning Criteria window, but
here you can control the upper limit of how many arrhythmia strips are saved within each interval.
• Maximum strips per interval of the same name: You can limit the number of arrhythmia strips of the same label that are saved within an interval.
• Maximum strips of the same name: You can limit the number of arrhythmia strips of the same label that are saved during the entire Holter period.
• Minimum time (minutes) between strips of the same name: You can re-distribute the arrhythmia strips saved by requir-ing more or less time between those with the same label.
• Maximum number of alterna-tive strips: Control how many alternatives are available for the following: Minimum HR, Maxi-mum HR, Shortest RR, Longest RR, Longest VTAC, Fastest
VTAC, Longest SVT, Fastest SVT, Lon-gest AF and Fastest AF.
To make changes, select the current entry and type over it. Click on OK to save changes and exit; click Cancel to close without saving.
How Often Strips Auto Save window in Settings menu (Enhanced levels)
ften Strips Auto Save window in Settings menu (Pro level)
st Monitoring, Inc. NEMM027-Rev-L Page 31 of 117
HE/LX Analysis Operator’s Manual Holter Analysis: Oximetry analysis
NorthEa
Oximetry analysisThe DR180 Series recorders can be used to record oximetry. When you attach your optional oximetry hook-up equipment to your DR180 Series recorder, it becomes a OxyHolter recorder. When analyzing an OxyHolter recording, oximetry analysis is done automatically when you start analysis from the Patient Information screen.
Note: When Oximetry is recorded, no pacemaker analysis will be done.
The oximetry data appears in the channel 3 area of all ECG displays. This includes a color-coded (based on the beat label, so usually green) trend of the SpO2 data, with a vertical scale of 60 to 100 percent satura-tion; artifact in that trend is indicated by vertical hash marks. Pulse oximetry data is displayed as the white trend above the SpO2 trend.
The Oximetry trend window shows the oximetry heart rate data superimposed on the heart rate trend.
The Oximetry trend window also shows desaturation events highlighted in red along the oximetry trend. The desaturation events are defined by the settings in the Oximetry window in the Settings menu.
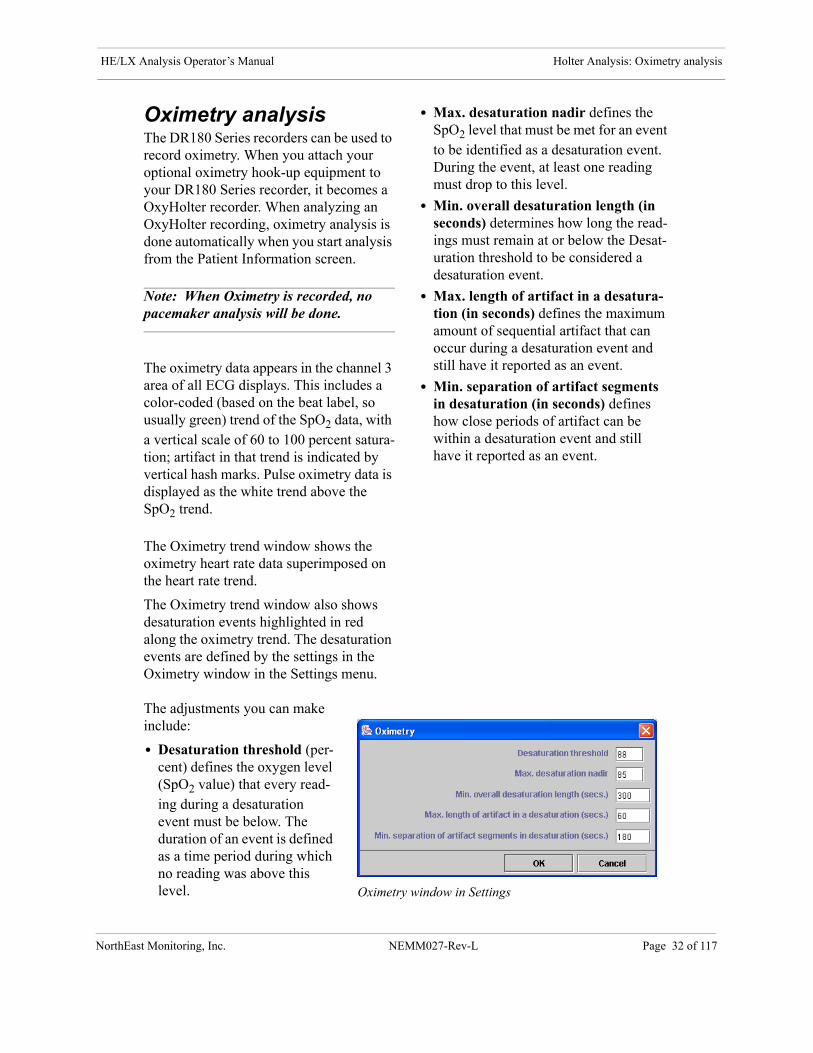
The adjustments you can make include:
• Desaturation threshold (per-cent) defines the oxygen level (SpO2 value) that every read-ing during a desaturation event must be below. The duration of an event is defined as a time period during which no reading was above this level.
• Max. desaturation nadir defines the SpO2 level that must be met for an event to be identified as a desaturation event. During the event, at least one reading must drop to this level.
• Min. overall desaturation length (in seconds) determines how long the read-ings must remain at or below the Desat-uration threshold to be considered a desaturation event.
• Max. length of artifact in a desatura-tion (in seconds) defines the maximum amount of sequential artifact that can occur during a desaturation event and still have it reported as an event.
• Min. separation of artifact segments in desaturation (in seconds) defines how close periods of artifact can be within a desaturation event and still have it reported as an event.
Oximetry window in Settings
st Monitoring, Inc. NEMM027-Rev-L Page 32 of 117
HE/LX Analysis Operator’s Manual Holter Analysis: ST segment analysis
Nort
ST segment analysisST segment analysis includes these steps (which are each explained in depth in the following pages):
1.Setting ST markers. This is done auto-matically by the software, but you can adjust the markers for any patient.
2. Measuring the ST segment on all three channels of every normal beat. This is done automatically. If you rela-bel normal beats to some other label, the ST segment analysis will be re-done automatically.
3. Plotting ST data in 30-second incre-ments. All normal beats within each 30-second time period are averaged.
4. Establishing ST baseline for the patient throughout the Holter period. The software does this automatically and plots it in blue on the ST trends in the Trends window.
5. Comparing the 30-second ST seg-ment data measured with the baseline at the same time. A difference of at least 1 millimeter in any channel is consid-ered to be an event. Again, the software does this automatically.
6. Identifying ST events. ST events are listed in the ST event table in the Tables window. This is automatically com-piled for you, but you can edit any of the fields within the table.
7. Documenting ST events. You deter-mine which strips are saved to docu-ment each event, based on the settings in the What Strips to Auto Save win-dow. How many ST events are docu-mented is determined in the How Often to Auto Save window.
Note: The procedure does not include calibrating the signal because the data is recorded at 1 centimeter per millivolt, the standard for ST segment analysis.
Setting ST markers
To review the locations of the ST markers used during analysis:
1. Select Review > Calibration. The Cali-bration window opens displaying the calibration pulse, a series of eight 1-mil-livolt square waves.
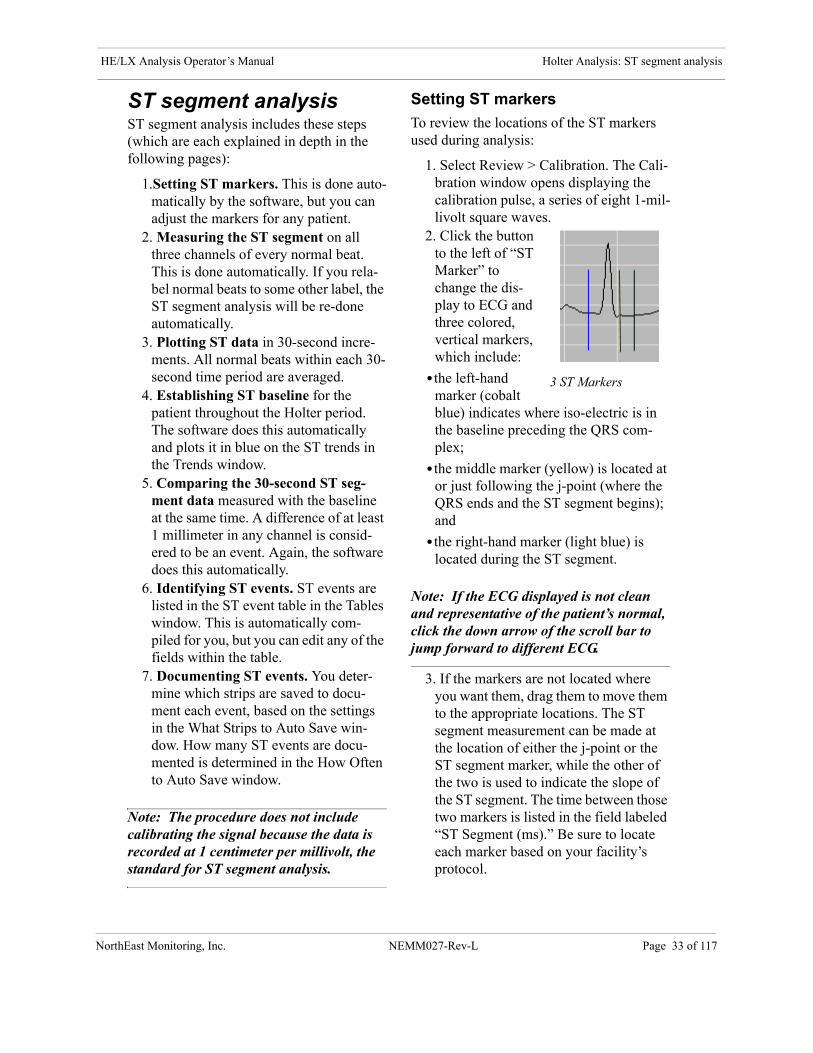
2. Click the button to the left of “ST Marker” to change the dis-play to ECG and three colored, vertical markers, which include:
•the left-hand marker (cobalt blue) indicates where iso-electric is in the baseline preceding the QRS com-plex;
•the middle marker (yellow) is located at or just following the j-point (where the QRS ends and the ST segment begins); and
•the right-hand marker (light blue) is located during the ST segment.
Note: If the ECG displayed is not clean and representative of the patient’s normal, click the down arrow of the scroll bar to jump forward to different ECG.
3. If the markers are not located where you want them, drag them to move them to the appropriate locations. The ST segment measurement can be made at the location of either the j-point or the ST segment marker, while the other of the two is used to indicate the slope of the ST segment. The time between those two markers is listed in the field labeled “ST Segment (ms).” Be sure to locate each marker based on your facility’s protocol.
3 ST Markers
hEast Monitoring, Inc. NEMM027-Rev-L Page 33 of 117
HE/LX Analysis Operator’s Manual Holter Analysis: ST segment analysis
NorthEa
Note: Each marker for each channel moves independently so that you can precisely position the markers based on each channel’s morphology.
4. Once each marker is in the appropri-ate location, click the button next to Done. If you have made changes to either the Gain or the ST Marker win-dow, a window opens to ask whether it’s okay to continue. Click on Yes to make the change and continue. Click No to cancel your changes and retain the previous information
5. To exit from the ST Marker window without saving your changes, click the button next to Cancel.
Measuring the ST segment
This is performed automatically for all three channels of ECG. Whether the ST segment measurement is done at the posi-tion of the j-point or the ST segment marker is determined by the setting “ST measurement” in the Preferences window. See Chapter 8 for details of the Preferences settings and their use.
The ST segment measurement is averaged in 30-second increments throughout the Holter period. Only normals not contami-nated by artifact are included in each aver-age. At least eight valid measurements must be made within a 30-second period for it to be included; if there are fewer than eight clean normal beats, the 30-second increment is considered artifact.
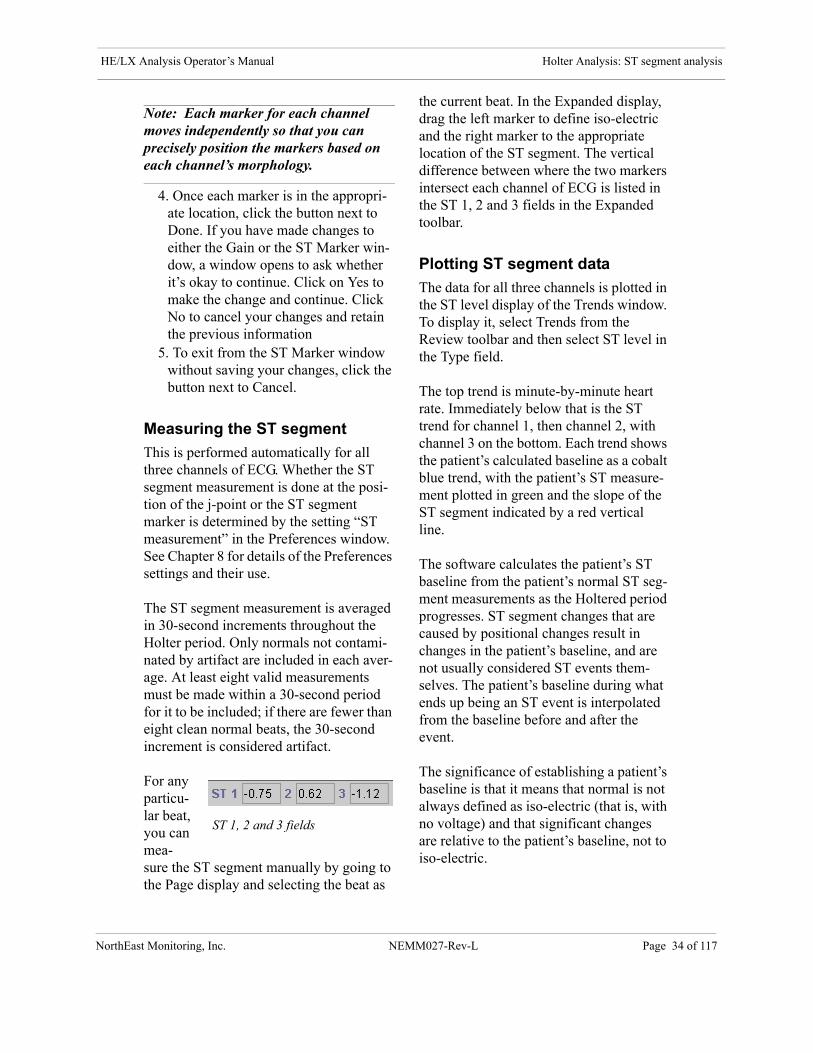
For any particu-lar beat, you can mea-sure the ST segment manually by going to the Page display and selecting the beat as
the current beat. In the Expanded display, drag the left marker to define iso-electric and the right marker to the appropriate location of the ST segment. The vertical difference between where the two markers intersect each channel of ECG is listed in the ST 1, 2 and 3 fields in the Expanded toolbar.
Plotting ST segment data
The data for all three channels is plotted in the ST level display of the Trends window. To display it, select Trends from the Review toolbar and then select ST level in the Type field.
The top trend is minute-by-minute heart rate. Immediately below that is the ST trend for channel 1, then channel 2, with channel 3 on the bottom. Each trend shows the patient’s calculated baseline as a cobalt blue trend, with the patient’s ST measure-ment plotted in green and the slope of the ST segment indicated by a red vertical line.
The software calculates the patient’s ST baseline from the patient’s normal ST seg-ment measurements as the Holtered period progresses. ST segment changes that are caused by positional changes result in changes in the patient’s baseline, and are not usually considered ST events them-selves. The patient’s baseline during what ends up being an ST event is interpolated from the baseline before and after the event.
The significance of establishing a patient’s baseline is that it means that normal is not always defined as iso-electric (that is, with no voltage) and that significant changes are relative to the patient’s baseline, not to iso-electric.
ST 1, 2 and 3 fields
st Monitoring, Inc. NEMM027-Rev-L Page 34 of 117

HE/LX Analysis Operator’s Manual Holter Analysis: ST segment analysis
NorthEa
Identifying ST events
The ST analysis software looks through the ST level trends, comparing the ST trends to the patient’s baseline trends, to find episodes of significant ST segment changes.
For an incident to be called an ST event, at least one 30-second ST segment data point must be at least 1 millimeter different than the patient’s baseline for that channel at that time-of-day. A depression is a change of at least 1 millimeter in the negative direction, while an elevation is a change of at least 1 millimeter in the positive direc-tion.
In the ST level trends, incidents that are flagged as ST segment events are indicated by a light blue horizontal line above the appropriate channel and lasting as long as the event.
The events are listed in the ST event table in the Tables window. To display it, click Tables in the Review toolbar, then click on ST event in the Tables list at the right of the Tables window. In that table, the description for each event includes:
• Channel - the channel in which the event was detected
• Onset - the time-of-day at the start of the event (defined as when the change in ST segment passes through the point 0.5-millimeter different from the patient’s baseline)
• End - the time-of-day at the end of the event (defined as when the change in ST segment returns to within 0.5-millime-ters different from the patient’s baseline)
• Duration - the difference between the end and the onset times
• Max HR - the maximum heart rate cal-culated during the duration of the event
• Max ST deviation Time - the time-of-day at the event’s maximum deviation from the patient’s baseline
• Max ST deviation HR - the heart rate during the event’s maximum deviation from the patient’s baseline
• Max ST deviation Baseline - the ST segment measurement’s deviation from the patient’s baseline at the point of maximum deviation
• Max ST deviation Iso-electric - the ST segment measurement’s deviation from iso-electric at the point of maximum deviation
• Max ST deviation Slope - the slope of the ST segment event at the point of maximum deviation (+ indicates upslop-ing; - indicates downsloping; 0 indicates horizontal)
• Integral - the calculation that reflects the area under the slope between the ST trend and the patient’s baseline during the event
ST Event Edit window
st Monitoring, Inc. NEMM027-Rev-L Page 35 of 117

HE/LX Analysis Operator’s Manual Holter Analysis: ST segment analysis
NorthEa
Note: If an event includes both a positive component and a negative one, the integral is actually less than the true area. Although we report the absolute value, the integral calculation can result in a “negative” area, which when added to a positive area can cancel some or all of it.
All of the information listed in the ST event table can be edited by clicking the Edit button to open the ST Event Edit win-dow and making the changes you desire. To edit an entry, drag across the existing entry and type the information to replace it. When finished, click OK to save your changes and exit. Click Cancel to close the window without saving the changes.
To add an ST event, click the Add button. The ST Event Edit window opens with blank fields. Type the appropriate informa-tion in each of the fields. Click OK to save the event and exit. Click Cancel to exit without saving the event.To delete an ST event from the table, click on the event to be deleted, then click the Delete button. The event disappears.
To print the table, click the Print button. To close the Tables window, click OK.
Documenting ST events
You control what strips are saved to docu-ment ST segment events using a combina-tion of settings in the What Strips to Auto Save and How Often Strips Auto Save windows.
st Monitoring, Inc. NEMM027-Rev-L Page 36 of 117

HE/LX Analysis Operator’s Manual Holter Analysis: Pacemaker analysis
NorthEa
Diagr
Pacemaker analysisPacemaker activity is recorded on NEMon Holter Recorders without distorting the patient’s ECG, by removing the effects of the pacemaker spike and replacing it with a pacemaker marker. That marker, when re-introduced to the ECG when the flashcard is read by the analysis software, appears as a vertical spike in the precise location of the original pacemaker spike.
Note: When Oximetry is recorded, no pacemaker spikes will appear on the Holter recording as no pacemaker analysis is done.
For the software to do a proper analysis of the pacemaker activity during the Holter period, the pacemaker settings in the Scan-ning Criteria window must be set properly. They include:
• Pacemaker type, which contains four settings that allow the software to expect certain behavior:1.Not paced means that the software
will not identify any pacemaker spikes, beats or failures.
2. VVI means that each paced beat will be preceded by a single spike. All
paced beats are counted as ventricular paced.
3. AV sequential means that paced beats should be preceded by two pacemaker spikes, one atrial and one ventricular.
4. DDD means that paced beats can be preceded by either a one or two pace-maker spikes. Depending on the spike’s location relative to the follow-ing R-wave, a beat preceded by a sin-gle spike will be called either atrial paced or ventricular paced, while a beat preceded by two spikes will be counted as AV paced.
• Minimum heart rate refers to the mini-mum rate allowed by the pacemaker. If the pacemaker does not fire appropri-ately and there is a RR interval longer than the patient should experience, the Inhibition label appears.
• Maximum heart rate refers to the max-imum rate initiated by the pacemaker. If the pacemaker fires early, typically because it did not sense the previous beat, it would result in a faster rate, the Sense failure label appears.
• Maximum vent. spike to R interval sets the maximum time between the fir-ing of the second pacemaker spike and the following R-wave. If the second spike appears and is not followed by an
am of pacemaker interval settings
st Monitoring, Inc. NEMM027-Rev-L Page 37 of 117
HE/LX Analysis Operator’s Manual Holter Analysis: Pacemaker analysis
NorthEa
R-wave in this amount of time, the Cap-ture failure label appears.
• Maximum atrial spike to R interval sets the limit for how long is allowed between a single spike and the subse-quent R-wave. If a single spike occurs and the following R-wave is not within this amount of time, the Capture failure label appears.
• Paced beat and the beat after can be called a SVPB is a setting that allows you to identify early beats following a paced beat as SVPBs because they were premature, even if they themselves are paced beats. Click on the check box to turn it off and on.
Pacemaker labels
Beats can be identified and counted with the following labels (refer to the diagram on the previous page):
• A paced for a beat that is paced just in the atrium. The atrial spike is deter-mined to be the one that occurs well before the QRS, falling before the “Maximum ventricular spike to R inter-val,” but within the “Maximum atrial spike to R interval.”
• V paced for a beat that is paced just in the ventricle. With pacemaker type set to DDD or AV Sequential, the ventricu-lar spike is determined to be the one that occurs during the “Maximum ventricu-lar spike to R interval.” This label also includes all paced beats with the pace-maker type set to VVI and all beats without pacemaker spikes that are man-ually labeled “Paced.”
• AV paced for a beat that is paced in both the atrium and the ventricle, with the atrial and ventricular spikes identified in the same way as described above.
• Sense failure means that the pacemaker (1) did not sense a QRS that occurred
and (2) fired, resulting in a shorter-than-programmed R-to-spike interval. The label can happen under three scenarios:1.Pacemaker type is set to DDD and
two pacemaker spikes occur, with less than the “Maximum atrial spike to R interval” between them, and with the second spike more than 20 millisec-onds after the QRS.
2. A single spike is more than 20 milli-seconds after the QRS.
3. The time between the preceding QRS and the next pacemaker spike is less than 60 divided by the “Maximum heart rate;” that is, the pacemaker fired early.
• Inhibition refers to inappropriate inhi-bition of the pacemaker, resulting in a longer-than-programmed RR interval. This label appears if the time between the preceding QRS and the next pace-maker spike is greater than 60 divided by the “Minimum heart rate” setting; that is, the pacemaker fired late.
• Capture failure means that the pace-maker has fired, but there is no subse-quent QRS within the allotted interval. The label, which falls on the detected QRS after the missing QRS, appears in four scenarios:1.The pacemaker type is DDD or AV
Sequential and there are two pace-maker spikes, with the time between them less than “Maximum atrial spike to R interval” and the time between the second spike to the QRS greater than the “Maximum ventricular spike to R interval” setting.
2. The pacemaker type is DDD or AV Sequential and there is only one pace-maker spike, with the time between the spike and the following QRS greater than the “Maximum atrial spike to R interval” setting.
st Monitoring, Inc. NEMM027-Rev-L Page 38 of 117

HE/LX Analysis Operator’s Manual Holter Analysis: Pacemaker analysis
NorthEa
3. The pacemaker type is VVI and the time between the pacemaker spike and the following QRS is greater than the “Maximum ventricular spike to R interval” setting.
4. There are two pacemaker spikes that are more than the “Maximum atrial spike to R interval” apart and the time from the first pacemaker spike to the following QRS is greater than the “Maximum ventricular spike to R interval” setting.
Pacemaker table
Pacemaker counts are itemized in the Paced table in the Tables window. To dis-play it, click Tables in the Review toolbar, then click on Paced in the Tables list at the right of the Tables window. The Paced table is an interval table and the reported data includes:
• Time-of-day - the time-of-day at the start of the interval;
• Total Beats - the total number of beats identified and counted within the inter-val, not including artifact;
• Time Analyzed - the total amount of time analyzed during the interval; this does not including periods that are con-sidered to be artifact;
• Total Paced - total of the following 3 fields;
• Atrial Only - paced beats that were determined to be paced only in the atrium, not the ventricle;
• Vent(ricular) Only - paced beats that were determined to be paced only in the ventricle, not the atrium;
• AV - paced beats that were determined to be paced in both atrial and ventricular chambers;
• Sense Failure - the number of times sense failures occurred (these are defined in the previous section);
• Capture Failure - the number of times capture failures occurred (these are defined in the previous section);
• Inhibit(ion) - the number of times the pacemaker was inappropriately inhib-ited from firing (this is defined in the previous section).
• Paced% - the percentage of paced beats out of all beats in that interval.
The fields in this table can be edited as described in the “Editing table entries” section of the following chapter.
st Monitoring, Inc. NEMM027-Rev-L Page 39 of 117
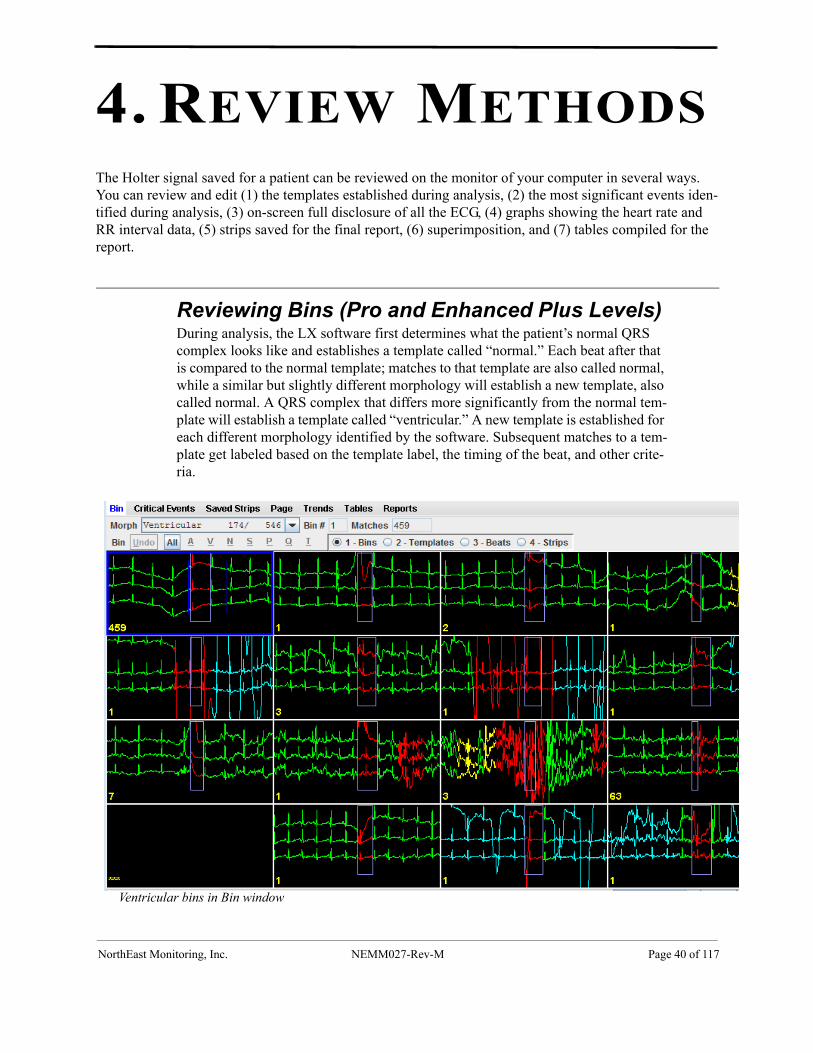
4. REVIEW METHODSThe Holter signal saved for a patient can be reviewed on the monitor of your computer in several ways. You can review and edit (1) the templates established during analysis, (2) the most significant events iden-tified during analysis, (3) on-screen full disclosure of all the ECG, (4) graphs showing the heart rate and RR interval data, (5) strips saved for the final report, (6) superimposition, and (7) tables compiled for the report.
NorthEast Mo
Ventricul
Reviewing Bins (Pro and Enhanced Plus Levels) During analysis, the LX software first determines what the patient’s normal QRS complex looks like and establishes a template called “normal.” Each beat after that is compared to the normal template; matches to that template are also called normal, while a similar but slightly different morphology will establish a new template, also called normal. A QRS complex that differs more significantly from the normal tem-plate will establish a template called “ventricular.” A new template is established for each different morphology identified by the software. Subsequent matches to a tem-plate get labeled based on the template label, the timing of the beat, and other crite-ria.
ar bins in Bin window
nitoring, Inc. NEMM027-Rev-M Page 40 of 117
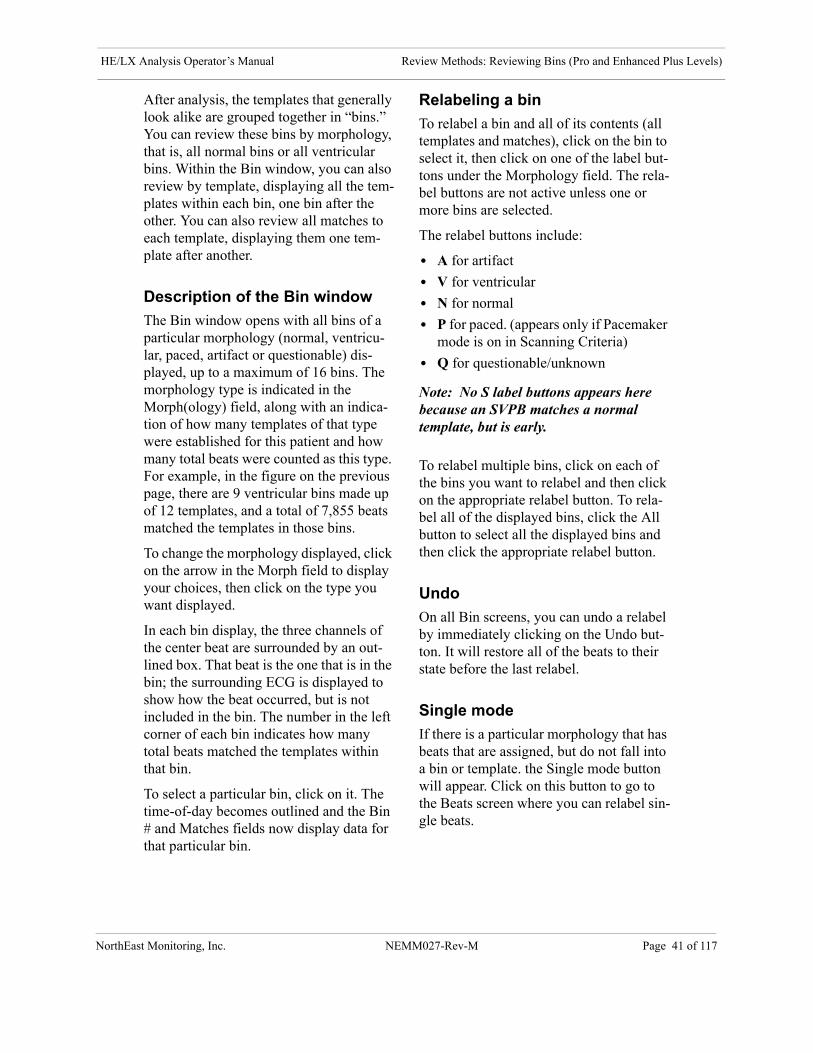
HE/LX Analysis Operator’s Manual Review Methods: Reviewing Bins (Pro and Enhanced Plus Levels)
NorthEa
After analysis, the templates that generally look alike are grouped together in “bins.” You can review these bins by morphology, that is, all normal bins or all ventricular bins. Within the Bin window, you can also review by template, displaying all the tem-plates within each bin, one bin after the other. You can also review all matches to each template, displaying them one tem-plate after another.
Description of the Bin window
The Bin window opens with all bins of a particular morphology (normal, ventricu-lar, paced, artifact or questionable) dis-played, up to a maximum of 16 bins. The morphology type is indicated in the Morph(ology) field, along with an indica-tion of how many templates of that type were established for this patient and how many total beats were counted as this type. For example, in the figure on the previous page, there are 9 ventricular bins made up of 12 templates, and a total of 7,855 beats matched the templates in those bins.
To change the morphology displayed, click on the arrow in the Morph field to display your choices, then click on the type you want displayed.
In each bin display, the three channels of the center beat are surrounded by an out-lined box. That beat is the one that is in the bin; the surrounding ECG is displayed to show how the beat occurred, but is not included in the bin. The number in the left corner of each bin indicates how many total beats matched the templates within that bin.
To select a particular bin, click on it. The time-of-day becomes outlined and the Bin # and Matches fields now display data for that particular bin.
Relabeling a bin
To relabel a bin and all of its contents (all templates and matches), click on the bin to select it, then click on one of the label but-tons under the Morphology field. The rela-bel buttons are not active unless one or more bins are selected.
The relabel buttons include:
• A for artifact
• V for ventricular
• N for normal
• P for paced. (appears only if Pacemaker mode is on in Scanning Criteria)
• Q for questionable/unknown
Note: No S label buttons appears here because an SVPB matches a normal template, but is early.
To relabel multiple bins, click on each of the bins you want to relabel and then click on the appropriate relabel button. To rela-bel all of the displayed bins, click the All button to select all the displayed bins and then click the appropriate relabel button.
Undo
On all Bin screens, you can undo a relabel by immediately clicking on the Undo but-ton. It will restore all of the beats to their state before the last relabel.
Single mode
If there is a particular morphology that has beats that are assigned, but do not fall into a bin or template. the Single mode button will appear. Click on this button to go to the Beats screen where you can relabel sin-gle beats.
st Monitoring, Inc. NEMM027-Rev-M Page 41 of 117
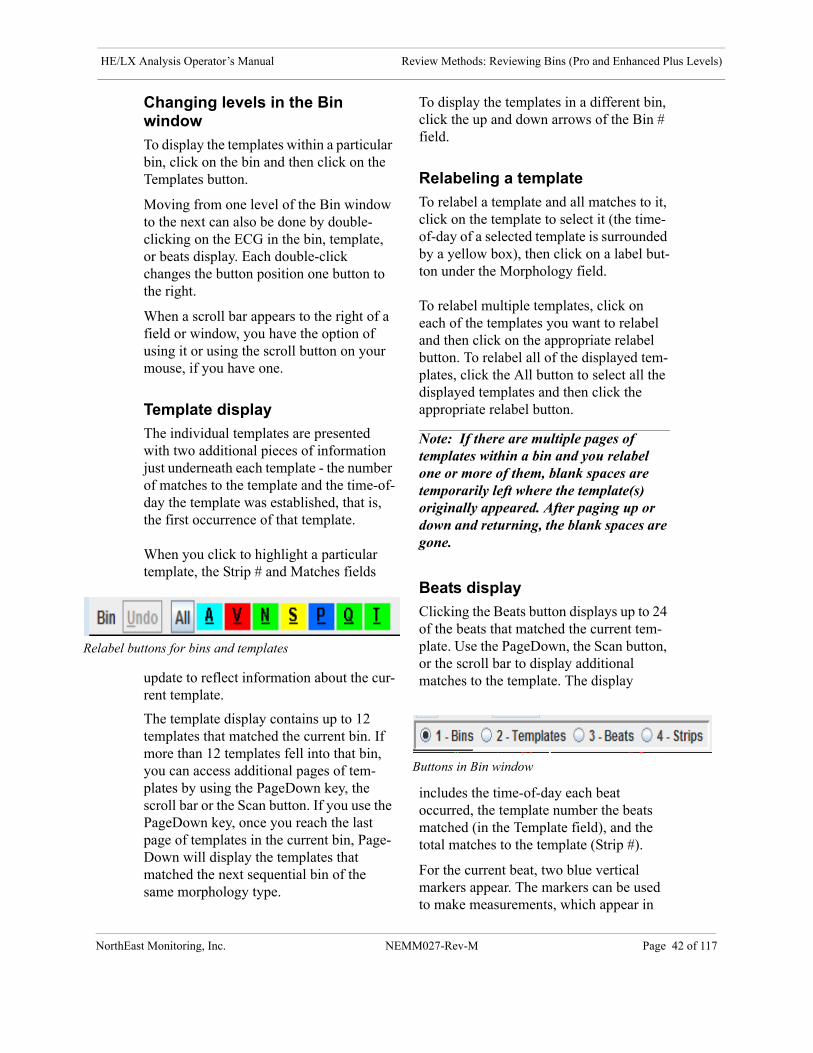
HE/LX Analysis Operator’s Manual Review Methods: Reviewing Bins (Pro and Enhanced Plus Levels)
NorthEa
Relabel b
Changing levels in the Bin window
To display the templates within a particular bin, click on the bin and then click on the Templates button.
Moving from one level of the Bin window to the next can also be done by double-clicking on the ECG in the bin, template, or beats display. Each double-click changes the button position one button to the right.
When a scroll bar appears to the right of a field or window, you have the option of using it or using the scroll button on your mouse, if you have one.
Template display
The individual templates are presented with two additional pieces of information just underneath each template - the number of matches to the template and the time-of-day the template was established, that is, the first occurrence of that template.
When you click to highlight a particular template, the Strip # and Matches fields
update to reflect information about the cur-rent template.
The template display contains up to 12 templates that matched the current bin. If more than 12 templates fell into that bin, you can access additional pages of tem-plates by using the PageDown key, the scroll bar or the Scan button. If you use the PageDown key, once you reach the last page of templates in the current bin, Page-Down will display the templates that matched the next sequential bin of the same morphology type.
To display the templates in a different bin, click the up and down arrows of the Bin # field.
Relabeling a template
To relabel a template and all matches to it, click on the template to select it (the time-of-day of a selected template is surrounded by a yellow box), then click on a label but-ton under the Morphology field.
To relabel multiple templates, click on each of the templates you want to relabel and then click on the appropriate relabel button. To relabel all of the displayed tem-plates, click the All button to select all the displayed templates and then click the appropriate relabel button.
Note: If there are multiple pages of templates within a bin and you relabel one or more of them, blank spaces are temporarily left where the template(s) originally appeared. After paging up or down and returning, the blank spaces are gone.
Beats display
Clicking the Beats button displays up to 24 of the beats that matched the current tem-plate. Use the PageDown, the Scan button, or the scroll bar to display additional matches to the template. The display
includes the time-of-day each beat occurred, the template number the beats matched (in the Template field), and the total matches to the template (Strip #).
For the current beat, two blue vertical markers appear. The markers can be used to make measurements, which appear in
uttons for bins and templates
Buttons in Bin window
st Monitoring, Inc. NEMM027-Rev-M Page 42 of 117

HE/LX Analysis Operator’s Manual Review Methods: Reviewing Bins (Pro and Enhanced Plus Levels)
NorthEas
Data f
the data fields below the large time-of-day field.
Drag the blue markers to appropriate loca-tions to have the data fields display:
• HR (2RR) field shows the heart rate calculation based on the blue markers being two RR intervals apart.
• Time field indicates the time (in sec-onds) between the blue markers.
• ST 1 field displays the vertical differ-ence between where the markers inter-sect channel 1. The left marker should define iso-electric and the right marker should be located where you want the ST measurement made.
• ST 2 field displays the vertical differ-ence between where the markers inter-sect channel 2. They should be positioned as indicated for channel 1.
• ST 3 field displays the vertical differ-ence between where the markers inter-sect channel 3. They should be positioned as indicated for channel 1.
Click the Both check box to drag the mark-ers keeping them the same distance apart. Click the Both box again to move the markers separately.
To keep the calipers in the same locations as you move through different screens of ECG, click the check box next to Lock; the calipers will stay in the indicated locations unless you move them again. Click again to turn off.
Relabeling a beat
The Beats window in Bin allows only sin-gle-beat editing, which removes a beat from its template and relabels just that beat. To relabel a beat this way, click on the beat to select it, then click on one of the
relabel buttons under the Morphology field.
In addition to the relabel buttons defined in the “Relabeling a bin” section earlier in this chapter, the relabel buttons for beats and strips include:
• S for supraventricular
• T for T-wave
To relabel multiple beats, click on each of them and then click on the correct relabel button.
Saving sample strips for the report
As you review the ECG, you can choose to manually save sample strips for the report. The 7.5-second sample strips are printed as full-sized, 25-mm/second ECG on a back-ground grid. To save a strip containing one of the displayed beats, click on the beat you want at the center of the strip to make it the current beat, and then click Keep; the Keep window opens. To label the strip, either type the label in the Description field or select a label from the scrolling list; then click OK to save the strip. To close the Keep window without saving the strip, click Cancel.
For more information about the Keep win-dow, see “Saving sample strips for the report” in the Page window section of this chapter.
Printing the ECG now
To print a strip of ECG centered on a dis-played beat, along with a page of full dis-closure of the surrounding rhythm, use the Print button. When the Print window opens, click the left-hand button to print
Relabel buttons for beats and strips
ields in Beats and Strips displays
t Monitoring, Inc. NEMM027-Rev-M Page 43 of 117
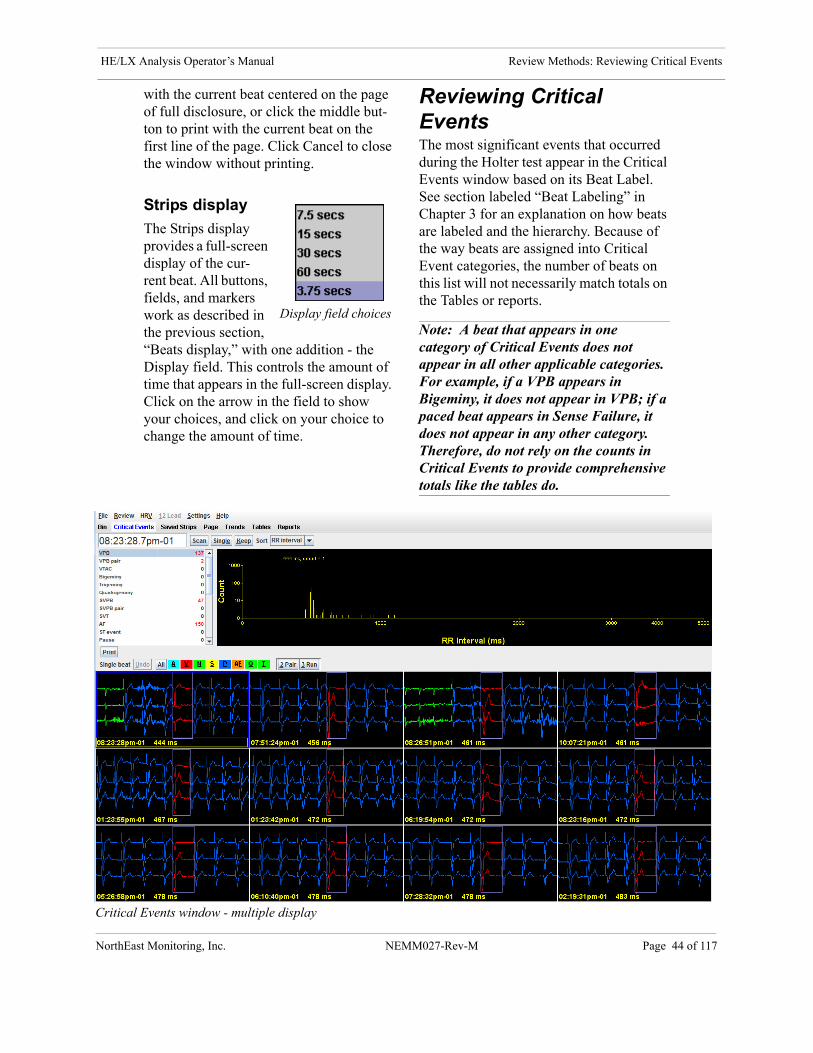
HE/LX Analysis Operator’s Manual Review Methods: Reviewing Critical Events
NorthEa
Critica
with the current beat centered on the page of full disclosure, or click the middle but-ton to print with the current beat on the first line of the page. Click Cancel to close the window without printing.
Strips display
The Strips display provides a full-screen display of the cur-rent beat. All buttons, fields, and markers work as described in the previous section, “Beats display,” with one addition - the Display field. This controls the amount of time that appears in the full-screen display. Click on the arrow in the field to show your choices, and click on your choice to change the amount of time.
Reviewing Critical EventsThe most significant events that occurred during the Holter test appear in the Critical Events window based on its Beat Label. See section labeled “Beat Labeling” in Chapter 3 for an explanation on how beats are labeled and the hierarchy. Because of the way beats are assigned into Critical Event categories, the number of beats on this list will not necessarily match totals on the Tables or reports.
Note: A beat that appears in one category of Critical Events does not appear in all other applicable categories. For example, if a VPB appears in Bigeminy, it does not appear in VPB; if a paced beat appears in Sense Failure, it does not appear in any other category. Therefore, do not rely on the counts in Critical Events to provide comprehensive totals like the tables do.
Display field choices
l Events window - multiple display
st Monitoring, Inc. NEMM027-Rev-M Page 44 of 117
HE/LX Analysis Operator’s Manual Review Methods: Reviewing Critical Events
NorthEa
To select a type to be displayed, use the scroll bar to scroll through the list and dis-play your choice, and then click on your selection.To move through the displayed episodes, use the PageUp and PageDown keys, the scroll bar, the scroll button on your mouse, or click Scan to automatically move from one display to the next. Click the Scan button again to stop the display.
When a single episode is displayed, click the Multiple button to display 12 at a time. When multiple episodes are displayed, the button label changes to “Single;” click that to display just one episode. You can also double-click on a strip to toggle back and forth between the single and multiple dis-plays. Each event is labeled with time-of-day and RR interval. In addition, if the ECG appears in a strip saved for the printed report, the word “saved” appears to the right of the RR interval.
ST events
ST events are in the Critical Events list. If you click ST Events, the strips showing the maximum ST deviation during each event are displayed. In addition, an ST event table button appears; that allows you to display a table listing the ST events that were found on this Holter test.
HR strips (Enhanced Plus and Pro Levels)
Critical Events includes this display of all the ECG recorded during the Holter period, in 7.5-second strips. While some beats may appear more than once in other categories (because they are adjacent to the current beat being displayed), this category displays each beat in one strip only. The heart rate listed is based on all beats pres-ent in the displayed strip.
Saved strips
Saved strips are in the Critical Events list so that you can review the strips saved for the final report without leaving the Critical Events window.
Changing the amount of time displayed
The Display field controls the amount of time that appears in the single event dis-play. Click on the arrow in the field to show your choices, and click on your choice to change the amount of time dis-played.
Saving sample strips for the report
As you review the ECG, you can choose to manually save sample strips for the report. The 7.5-second sample strips are printed as full-sized, 25 mm/second ECG on a back-ground grid.
To save a strip containing one of the dis-played beats, click on the beat you want at the center of the strip to make it the current beat, and then click Keep; the Keep win-dow opens. To keep it with the current label, click OK. To relabel the strip, type the label in the Description field or select a label from the scrolling list; then click OK to save the strip.
To save multiple strips all with the same label, click on each one to be saved, then click the Keep button and click on the but-ton that indicates multiple strips - it will read “x strips,” with x equal to the number of strips you selected before clicking Keep.
Any strips you manually save are included in the Saved Strips window.
st Monitoring, Inc. NEMM027-Rev-M Page 45 of 117

HE/LX Analysis Operator’s Manual Review Methods: Reviewing Critical Events
NorthEa
If you decide to close the Keep window without saving the strip, click Cancel.
For more information about the Keep win-dow, see “Saving sample strips for the report” in the Page window section of this chapter.
Sorting episodes within a type (Enhanced Plus and Pro only)
The Sort field lets you change the order of the episodes within each type. You can choose “RR interval” to put them in order based on the RR interval, from shortest to longest, starting with the current beat. Unlike RR interval labeling elsewhere in the software, which labels the interval length from the current beat to the follow-ing beat, sorting by RR interval in Critical Events sorts based on the RR interval pre-ceding the current beat; in that way, you can review the most premature beats of a type or the latest beats of a type.
The “Time” setting orders the episodes based on the time-of-day of the event, from earliest to latest.
The “24 hours” setting also orders them by time-of-day, but the histogram at the top of the window is divided into hourly inter-vals. See the “Histograms” section below for details.
To change the setting, use the scroll bar to display additional choices and then click on your choice.
Histograms
The top portion of the Critical Events win-dow presents a histogram showing the dis-tribution of the events within the type displayed - either an RR histogram or a 24-hour histogram.
The RR histogram plots the length of the RR interval preceding each episode of the displayed type. The number of events is on the vertical axis (with a log scale) and RR interval (in milliseconds) is on the horizon-tal axis. The blue marker is located at the position of the current event. To display the event associated with an alternate RR interval, click on the RR interval in the his-togram; the appropriate event will appear as the active event in the bottom portion of the window.
The 24-hour histogram shows how many episodes of the displayed type occurred during each 10-minute interval of the recording. The blue arrow is located at the position of the current event. To display the events associated with a different time-of-day, click on the histogram at that time; the appropriate event will appear as the active event in the bottom portion of the window.
Which histogram displays is based on the setting in the Sort field. The settings “RR interval” and “Time” display the RR histo-gram; the setting “24 hours” displays the time-of-day histogram shown above.
24-hour histogram
st Monitoring, Inc. NEMM027-Rev-M Page 46 of 117
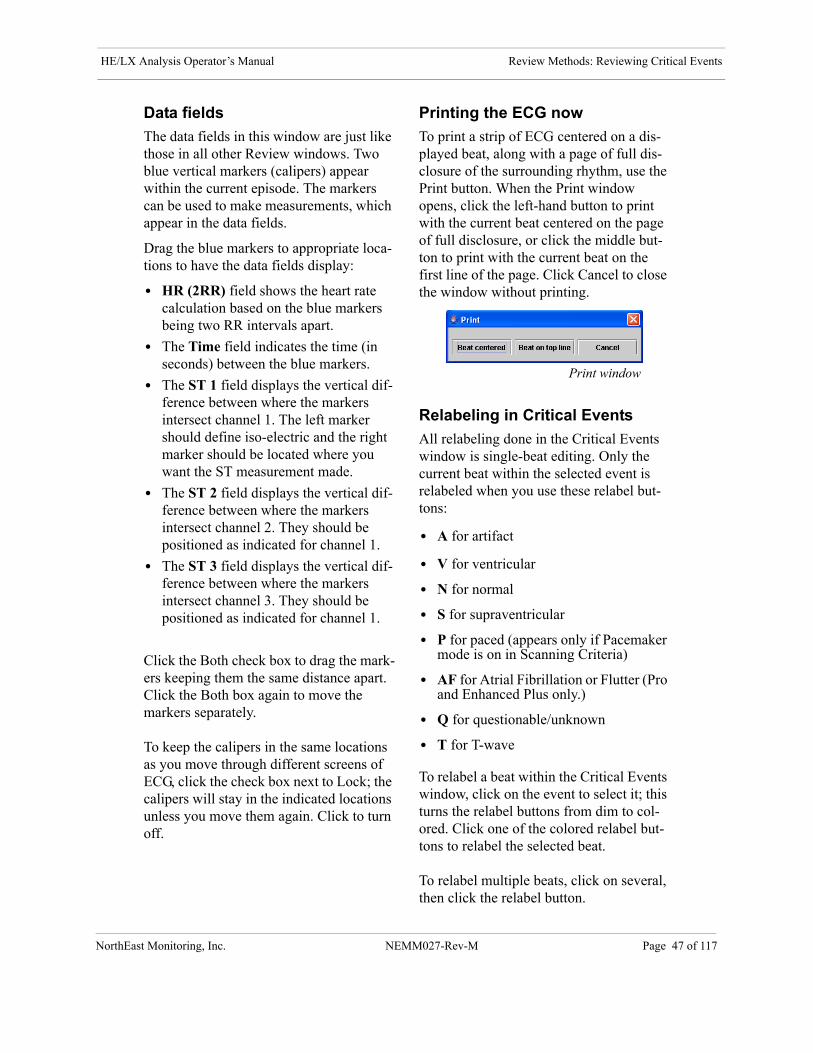
HE/LX Analysis Operator’s Manual Review Methods: Reviewing Critical Events
NorthEa
Data fields
The data fields in this window are just like those in all other Review windows. Two blue vertical markers (calipers) appear within the current episode. The markers can be used to make measurements, which appear in the data fields.
Drag the blue markers to appropriate loca-tions to have the data fields display:
• HR (2RR) field shows the heart rate calculation based on the blue markers being two RR intervals apart.
• The Time field indicates the time (in seconds) between the blue markers.
• The ST 1 field displays the vertical dif-ference between where the markers intersect channel 1. The left marker should define iso-electric and the right marker should be located where you want the ST measurement made.
• The ST 2 field displays the vertical dif-ference between where the markers intersect channel 2. They should be positioned as indicated for channel 1.
• The ST 3 field displays the vertical dif-ference between where the markers intersect channel 3. They should be positioned as indicated for channel 1.
Click the Both check box to drag the mark-ers keeping them the same distance apart. Click the Both box again to move the markers separately.
To keep the calipers in the same locations as you move through different screens of ECG, click the check box next to Lock; the calipers will stay in the indicated locations unless you move them again. Click to turn off.
Printing the ECG now
To print a strip of ECG centered on a dis-played beat, along with a page of full dis-closure of the surrounding rhythm, use the Print button. When the Print window opens, click the left-hand button to print with the current beat centered on the page of full disclosure, or click the middle but-ton to print with the current beat on the first line of the page. Click Cancel to close the window without printing.
Relabeling in Critical Events
All relabeling done in the Critical Events window is single-beat editing. Only the current beat within the selected event is relabeled when you use these relabel but-tons:
• A for artifact
• V for ventricular
• N for normal
• S for supraventricular
• P for paced (appears only if Pacemaker mode is on in Scanning Criteria)
• AF for Atrial Fibrillation or Flutter (Pro and Enhanced Plus only.)
• Q for questionable/unknown
• T for T-wave
To relabel a beat within the Critical Events window, click on the event to select it; this turns the relabel buttons from dim to col-ored. Click one of the colored relabel but-tons to relabel the selected beat.
To relabel multiple beats, click on several, then click the relabel button.
Print window
st Monitoring, Inc. NEMM027-Rev-M Page 47 of 117
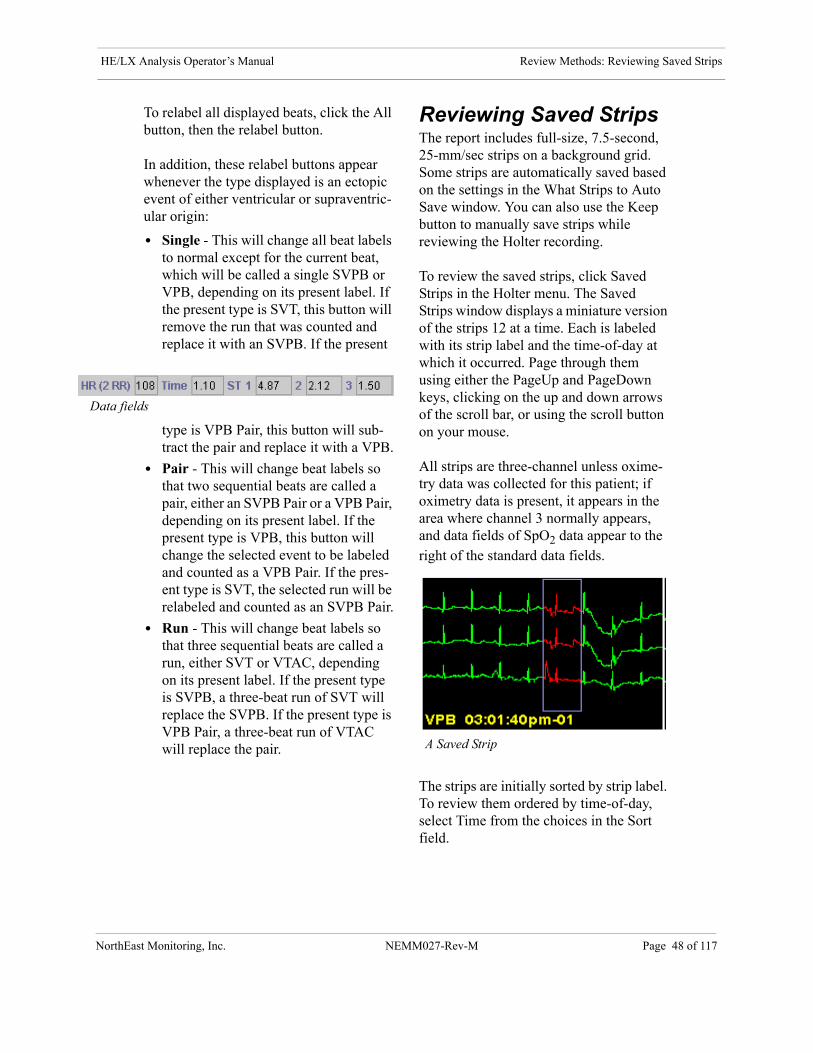
HE/LX Analysis Operator’s Manual Review Methods: Reviewing Saved Strips
NorthEa
Data fie
To relabel all displayed beats, click the All button, then the relabel button.
In addition, these relabel buttons appear whenever the type displayed is an ectopic event of either ventricular or supraventric-ular origin:
• Single - This will change all beat labels to normal except for the current beat, which will be called a single SVPB or VPB, depending on its present label. If the present type is SVT, this button will remove the run that was counted and replace it with an SVPB. If the present
type is VPB Pair, this button will sub-tract the pair and replace it with a VPB.
• Pair - This will change beat labels so that two sequential beats are called a pair, either an SVPB Pair or a VPB Pair, depending on its present label. If the present type is VPB, this button will change the selected event to be labeled and counted as a VPB Pair. If the pres-ent type is SVT, the selected run will be relabeled and counted as an SVPB Pair.
• Run - This will change beat labels so that three sequential beats are called a run, either SVT or VTAC, depending on its present label. If the present type is SVPB, a three-beat run of SVT will replace the SVPB. If the present type is VPB Pair, a three-beat run of VTAC will replace the pair.
Reviewing Saved StripsThe report includes full-size, 7.5-second, 25-mm/sec strips on a background grid. Some strips are automatically saved based on the settings in the What Strips to Auto Save window. You can also use the Keep button to manually save strips while reviewing the Holter recording.
To review the saved strips, click Saved Strips in the Holter menu. The Saved Strips window displays a miniature version of the strips 12 at a time. Each is labeled with its strip label and the time-of-day at which it occurred. Page through them using either the PageUp and PageDown keys, clicking on the up and down arrows of the scroll bar, or using the scroll button on your mouse.
All strips are three-channel unless oxime-try data was collected for this patient; if oximetry data is present, it appears in the area where channel 3 normally appears, and data fields of SpO2 data appear to the right of the standard data fields.
The strips are initially sorted by strip label. To review them ordered by time-of-day, select Time from the choices in the Sort field.
A Saved Strip
lds
st Monitoring, Inc. NEMM027-Rev-M Page 48 of 117
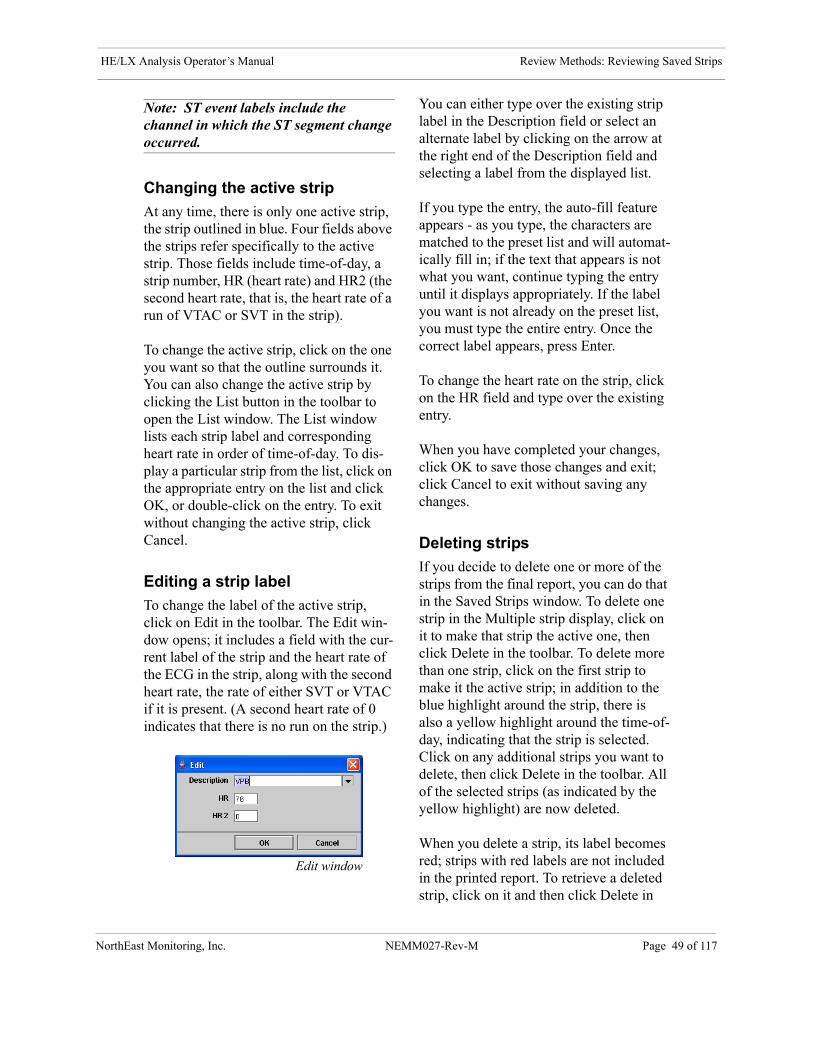
HE/LX Analysis Operator’s Manual Review Methods: Reviewing Saved Strips
NorthEa
Note: ST event labels include the channel in which the ST segment change occurred.
Changing the active strip
At any time, there is only one active strip, the strip outlined in blue. Four fields above the strips refer specifically to the active strip. Those fields include time-of-day, a strip number, HR (heart rate) and HR2 (the second heart rate, that is, the heart rate of a run of VTAC or SVT in the strip).
To change the active strip, click on the one you want so that the outline surrounds it. You can also change the active strip by clicking the List button in the toolbar to open the List window. The List window lists each strip label and corresponding heart rate in order of time-of-day. To dis-play a particular strip from the list, click on the appropriate entry on the list and click OK, or double-click on the entry. To exit without changing the active strip, click Cancel.
Editing a strip label
To change the label of the active strip, click on Edit in the toolbar. The Edit win-dow opens; it includes a field with the cur-rent label of the strip and the heart rate of the ECG in the strip, along with the second heart rate, the rate of either SVT or VTAC if it is present. (A second heart rate of 0 indicates that there is no run on the strip.)
You can either type over the existing strip label in the Description field or select an alternate label by clicking on the arrow at the right end of the Description field and selecting a label from the displayed list.
If you type the entry, the auto-fill feature appears - as you type, the characters are matched to the preset list and will automat-ically fill in; if the text that appears is not what you want, continue typing the entry until it displays appropriately. If the label you want is not already on the preset list, you must type the entire entry. Once the correct label appears, press Enter.
To change the heart rate on the strip, click on the HR field and type over the existing entry.
When you have completed your changes, click OK to save those changes and exit; click Cancel to exit without saving any changes.
Deleting strips
If you decide to delete one or more of the strips from the final report, you can do that in the Saved Strips window. To delete one strip in the Multiple strip display, click on it to make that strip the active one, then click Delete in the toolbar. To delete more than one strip, click on the first strip to make it the active strip; in addition to the blue highlight around the strip, there is also a yellow highlight around the time-of-day, indicating that the strip is selected. Click on any additional strips you want to delete, then click Delete in the toolbar. All of the selected strips (as indicated by the yellow highlight) are now deleted.
When you delete a strip, its label becomes red; strips with red labels are not included in the printed report. To retrieve a deleted strip, click on it and then click Delete in
Edit window
st Monitoring, Inc. NEMM027-Rev-M Page 49 of 117

HE/LX Analysis Operator’s Manual Review Methods: Reviewing Saved Strips
NorthEa
Confirm w
the toolbar again; the label text changes back to yellow.
To delete all of the strips displayed, click the button labeled Del/Undel All. To retrieve all of the strips displayed, click the button again.
Deleting channels from a strip
To delete one or more channels of a strip, but not the entire strip, click on a strip to make it active. Then, click on one of the check boxes labeled Channel 1, 2 and 3. For a particular strip, if a check is present, the channel will be included; if a box is not checked, the channel will be deleted. To delete a channel from all strips, delete the channel from the active strip, then click on All.
When the Confirm window appears, click Yes to delete the channel(s) from all strips. Click No to cancel the All command.
Replacing a strip with an alternative
Some strips can be replaced by an alterna-tive: maximum and minimum heart rates, shortest and longest RR intervals, and fast-est and longest runs of VTAC and SVT. The software selects sample strips for those types automatically. If you would prefer to select a different one (perhaps because the selected one contains artifact), click on the strip to make it active; the Alternatives button appears.
When you click Alternatives, the Alterna-tives window opens, displaying other choices for that label. All categories except the longest runs are sorted by heart rate, with the worst case first; the longest runs of SVT and VTAC are sorted by length, longest first. The current selection is the first one, in the upper left corner.
To select a different strip, click on the strip and then the Select new Alternative button. The window closes and the new strip appears in the Saved Strips window. To exit from the Alternatives window without changing the strip, click the Back to Saved Strips button.
Measuring
The data fields in the center of the toolbar - HR (2 RR), Time, and the ST indicators for each channel - contain data calculated based on the two blue calipers in the active strip. As you drag the blue calipers, those fields change, reflecting the new caliper positions.
To measure a two-beat heart rate, place the calipers two RR intervals apart; the mea-surement appears in the HR (2 RR) field. To measure ST in any of the channels, position the left caliper in the isoelectric area of the PR interval and the right caliper where you want to make the ST measure-ment; the measurements for each channel appear in the appropriate fields.
To move the calipers keeping them the same distance apart, click the check box next to Both and then drag the calipers. Click again to remove the mark and move them separately.
To keep the calipers in the same locations as you move through different screens of ECG, click the check box next to Lock; the
indow for deleting channel in All strips
st Monitoring, Inc. NEMM027-Rev-M Page 50 of 117
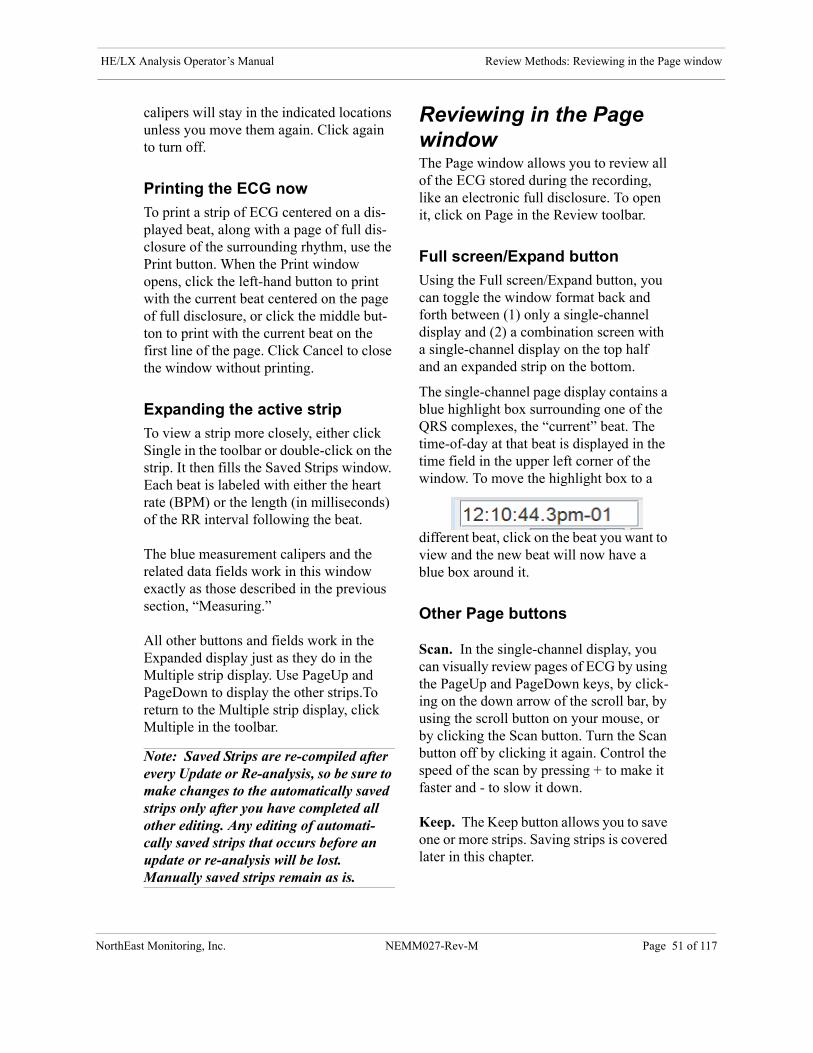
HE/LX Analysis Operator’s Manual Review Methods: Reviewing in the Page window
NorthEa
calipers will stay in the indicated locations unless you move them again. Click again to turn off.
Printing the ECG now
To print a strip of ECG centered on a dis-played beat, along with a page of full dis-closure of the surrounding rhythm, use the Print button. When the Print window opens, click the left-hand button to print with the current beat centered on the page of full disclosure, or click the middle but-ton to print with the current beat on the first line of the page. Click Cancel to close the window without printing.
Expanding the active strip
To view a strip more closely, either click Single in the toolbar or double-click on the strip. It then fills the Saved Strips window. Each beat is labeled with either the heart rate (BPM) or the length (in milliseconds) of the RR interval following the beat.
The blue measurement calipers and the related data fields work in this window exactly as those described in the previous section, “Measuring.”
All other buttons and fields work in the Expanded display just as they do in the Multiple strip display. Use PageUp and PageDown to display the other strips.To return to the Multiple strip display, click Multiple in the toolbar.
Note: Saved Strips are re-compiled after every Update or Re-analysis, so be sure to make changes to the automatically saved strips only after you have completed all other editing. Any editing of automati-cally saved strips that occurs before an update or re-analysis will be lost. Manually saved strips remain as is.
Reviewing in the Page windowThe Page window allows you to review all of the ECG stored during the recording, like an electronic full disclosure. To open it, click on Page in the Review toolbar.
Full screen/Expand button
Using the Full screen/Expand button, you can toggle the window format back and forth between (1) only a single-channel display and (2) a combination screen with a single-channel display on the top half and an expanded strip on the bottom.
The single-channel page display contains a blue highlight box surrounding one of the QRS complexes, the “current” beat. The time-of-day at that beat is displayed in the time field in the upper left corner of the window. To move the highlight box to a
different beat, click on the beat you want to view and the new beat will now have a blue box around it.
Other Page buttons
Scan. In the single-channel display, you can visually review pages of ECG by using the PageUp and PageDown keys, by click-ing on the down arrow of the scroll bar, by using the scroll button on your mouse, or by clicking the Scan button. Turn the Scan button off by clicking it again. Control the speed of the scan by pressing + to make it faster and - to slow it down.
Keep. The Keep button allows you to save one or more strips. Saving strips is covered later in this chapter.
st Monitoring, Inc. NEMM027-Rev-M Page 51 of 117
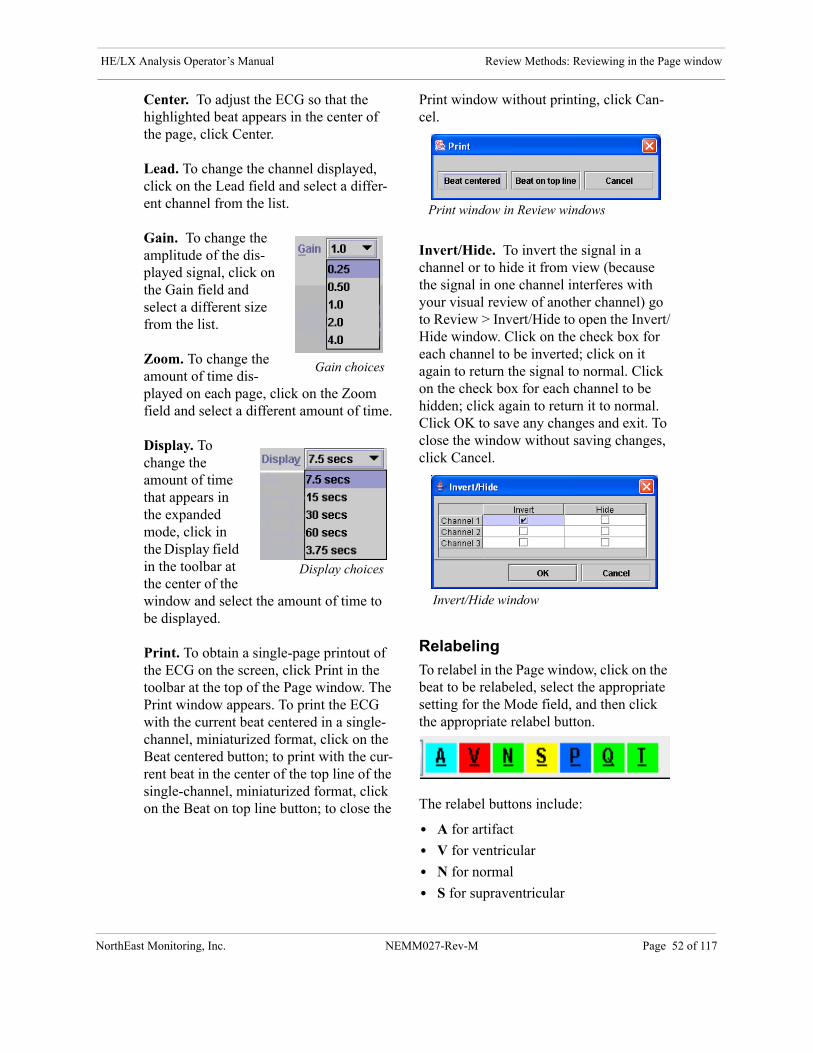
HE/LX Analysis Operator’s Manual Review Methods: Reviewing in the Page window
NorthEa
Center. To adjust the ECG so that the highlighted beat appears in the center of the page, click Center.
Lead. To change the channel displayed, click on the Lead field and select a differ-ent channel from the list.
Gain. To change the amplitude of the dis-played signal, click on the Gain field and select a different size from the list.
Zoom. To change the amount of time dis-played on each page, click on the Zoom field and select a different amount of time.
Display. To change the amount of time that appears in the expanded mode, click in the Display field in the toolbar at the center of the window and select the amount of time to be displayed.
Print. To obtain a single-page printout of the ECG on the screen, click Print in the toolbar at the top of the Page window. The Print window appears. To print the ECG with the current beat centered in a single-channel, miniaturized format, click on the Beat centered button; to print with the cur-rent beat in the center of the top line of the single-channel, miniaturized format, click on the Beat on top line button; to close the
Print window without printing, click Can-cel.
Invert/Hide. To invert the signal in a channel or to hide it from view (because the signal in one channel interferes with your visual review of another channel) go to Review > Invert/Hide to open the Invert/Hide window. Click on the check box for each channel to be inverted; click on it again to return the signal to normal. Click on the check box for each channel to be hidden; click again to return it to normal. Click OK to save any changes and exit. To close the window without saving changes, click Cancel.
Relabeling
To relabel in the Page window, click on the beat to be relabeled, select the appropriate setting for the Mode field, and then click the appropriate relabel button.
The relabel buttons include:
• A for artifact
• V for ventricular
• N for normal
• S for supraventricular
Gain choices
Display choices
Print window in Review windows
Invert/Hide window
st Monitoring, Inc. NEMM027-Rev-M Page 52 of 117
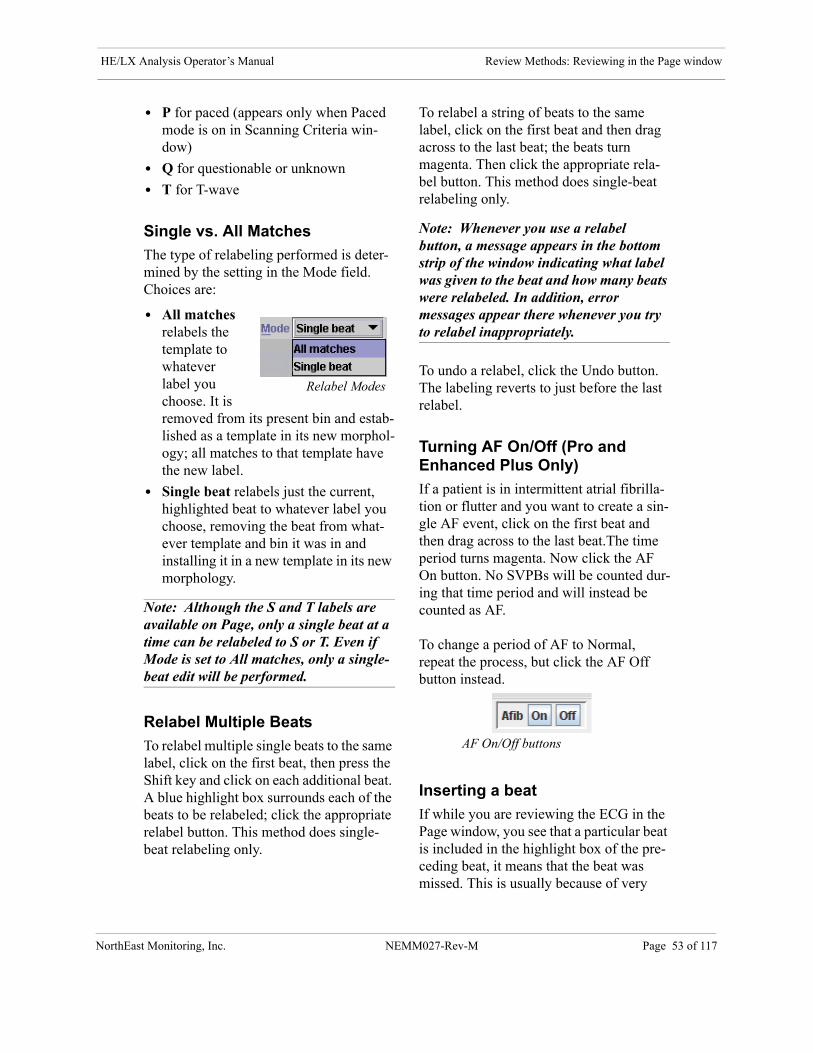
HE/LX Analysis Operator’s Manual Review Methods: Reviewing in the Page window
NorthEa
• P for paced (appears only when Paced mode is on in Scanning Criteria win-dow)
• Q for questionable or unknown
• T for T-wave
Single vs. All Matches
The type of relabeling performed is deter-mined by the setting in the Mode field. Choices are:
• All matches relabels the template to whatever label you choose. It is removed from its present bin and estab-lished as a template in its new morphol-ogy; all matches to that template have the new label.
• Single beat relabels just the current, highlighted beat to whatever label you choose, removing the beat from what-ever template and bin it was in and installing it in a new template in its new morphology.
Note: Although the S and T labels are available on Page, only a single beat at a time can be relabeled to S or T. Even if Mode is set to All matches, only a single-beat edit will be performed.
Relabel Multiple Beats
To relabel multiple single beats to the same label, click on the first beat, then press the Shift key and click on each additional beat. A blue highlight box surrounds each of the beats to be relabeled; click the appropriate relabel button. This method does single-beat relabeling only.
To relabel a string of beats to the same label, click on the first beat and then drag across to the last beat; the beats turn magenta. Then click the appropriate rela-bel button. This method does single-beat relabeling only.
Note: Whenever you use a relabel button, a message appears in the bottom strip of the window indicating what label was given to the beat and how many beats were relabeled. In addition, error messages appear there whenever you try to relabel inappropriately.
To undo a relabel, click the Undo button. The labeling reverts to just before the last relabel.
Turning AF On/Off (Pro and Enhanced Plus Only)
If a patient is in intermittent atrial fibrilla-tion or flutter and you want to create a sin-gle AF event, click on the first beat and then drag across to the last beat.The time period turns magenta. Now click the AF On button. No SVPBs will be counted dur-ing that time period and will instead be counted as AF.
To change a period of AF to Normal, repeat the process, but click the AF Off button instead.
Inserting a beat
If while you are reviewing the ECG in the Page window, you see that a particular beat is included in the highlight box of the pre-ceding beat, it means that the beat was missed. This is usually because of very
Relabel Modes
AF On/Off buttons
st Monitoring, Inc. NEMM027-Rev-M Page 53 of 117
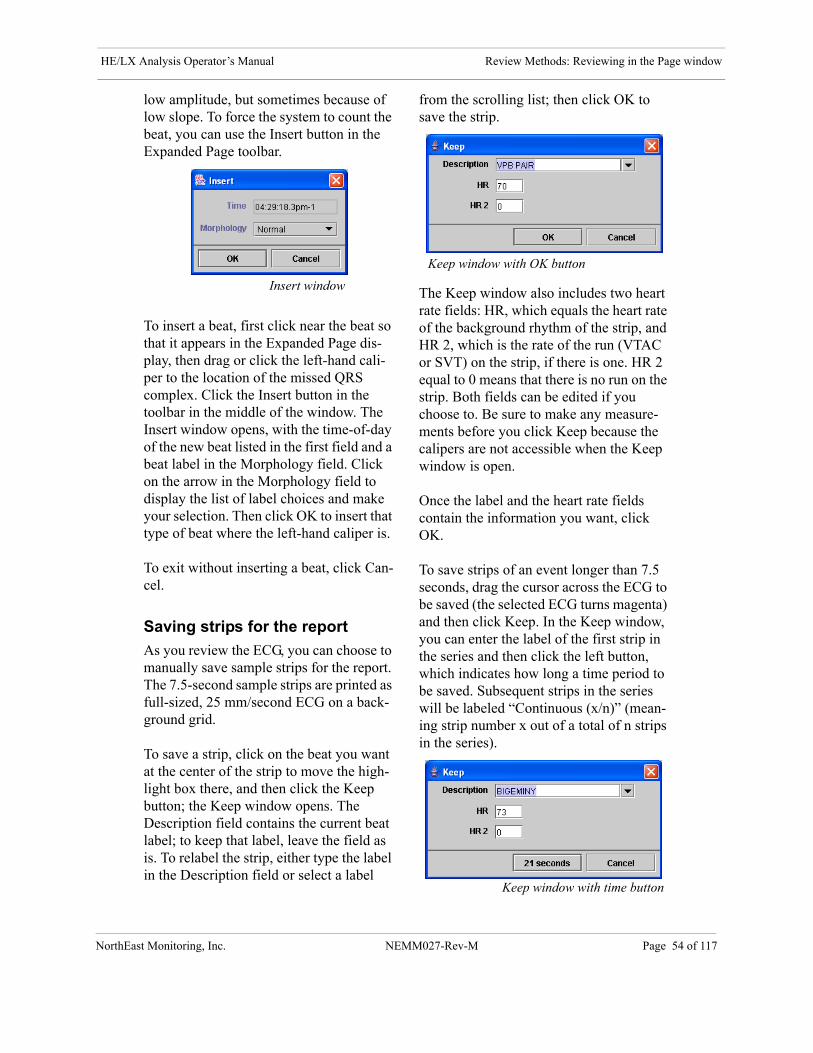
HE/LX Analysis Operator’s Manual Review Methods: Reviewing in the Page window
NorthEa
low amplitude, but sometimes because of low slope. To force the system to count the beat, you can use the Insert button in the Expanded Page toolbar.
To insert a beat, first click near the beat so that it appears in the Expanded Page dis-play, then drag or click the left-hand cali-per to the location of the missed QRS complex. Click the Insert button in the toolbar in the middle of the window. The Insert window opens, with the time-of-day of the new beat listed in the first field and a beat label in the Morphology field. Click on the arrow in the Morphology field to display the list of label choices and make your selection. Then click OK to insert that type of beat where the left-hand caliper is.
To exit without inserting a beat, click Can-cel.
Saving strips for the report
As you review the ECG, you can choose to manually save sample strips for the report. The 7.5-second sample strips are printed as full-sized, 25 mm/second ECG on a back-ground grid.
To save a strip, click on the beat you want at the center of the strip to move the high-light box there, and then click the Keep button; the Keep window opens. The Description field contains the current beat label; to keep that label, leave the field as is. To relabel the strip, either type the label in the Description field or select a label
from the scrolling list; then click OK to save the strip.
The Keep window also includes two heart rate fields: HR, which equals the heart rate of the background rhythm of the strip, and HR 2, which is the rate of the run (VTAC or SVT) on the strip, if there is one. HR 2 equal to 0 means that there is no run on the strip. Both fields can be edited if you choose to. Be sure to make any measure-ments before you click Keep because the calipers are not accessible when the Keep window is open.
Once the label and the heart rate fields contain the information you want, click OK.
To save strips of an event longer than 7.5 seconds, drag the cursor across the ECG to be saved (the selected ECG turns magenta) and then click Keep. In the Keep window, you can enter the label of the first strip in the series and then click the left button, which indicates how long a time period to be saved. Subsequent strips in the series will be labeled “Continuous (x/n)” (mean-ing strip number x out of a total of n strips in the series).
Insert window
Keep window with OK button
Keep window with time button
st Monitoring, Inc. NEMM027-Rev-M Page 54 of 117
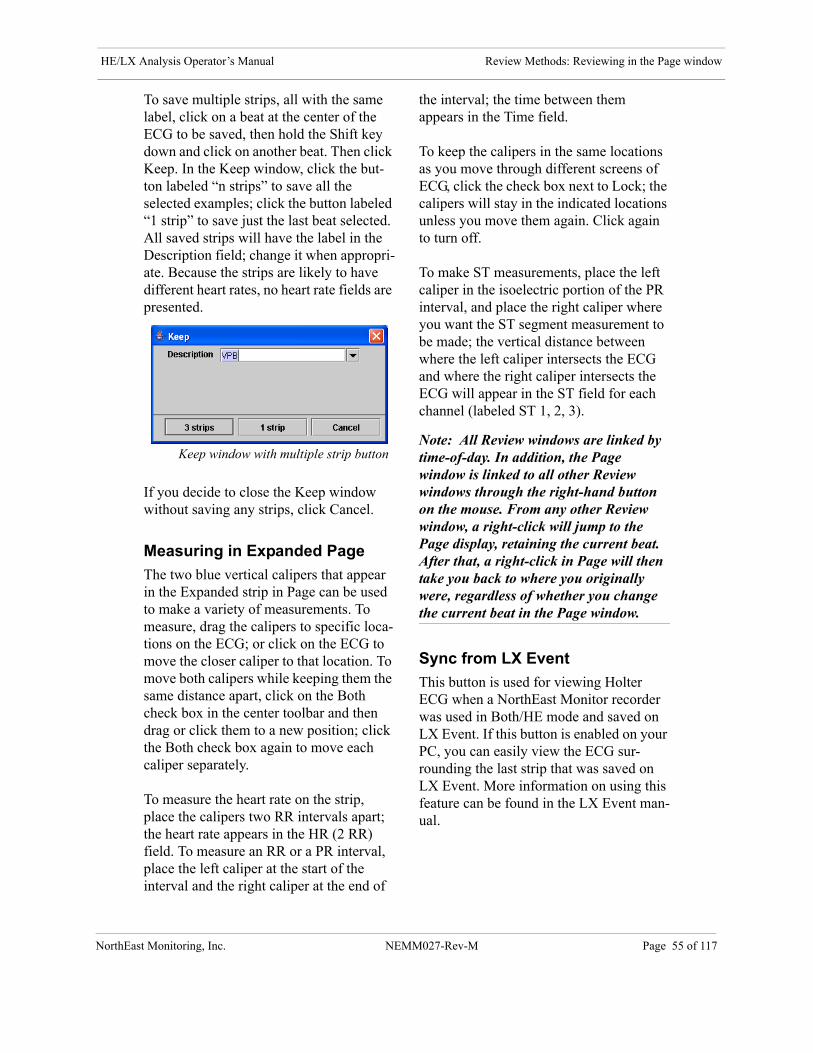
HE/LX Analysis Operator’s Manual Review Methods: Reviewing in the Page window
NorthEa
To save multiple strips, all with the same label, click on a beat at the center of the ECG to be saved, then hold the Shift key down and click on another beat. Then click Keep. In the Keep window, click the but-ton labeled “n strips” to save all the selected examples; click the button labeled “1 strip” to save just the last beat selected. All saved strips will have the label in the Description field; change it when appropri-ate. Because the strips are likely to have different heart rates, no heart rate fields are presented.
If you decide to close the Keep window without saving any strips, click Cancel.
Measuring in Expanded Page
The two blue vertical calipers that appear in the Expanded strip in Page can be used to make a variety of measurements. To measure, drag the calipers to specific loca-tions on the ECG; or click on the ECG to move the closer caliper to that location. To move both calipers while keeping them the same distance apart, click on the Both check box in the center toolbar and then drag or click them to a new position; click the Both check box again to move each caliper separately.
To measure the heart rate on the strip, place the calipers two RR intervals apart; the heart rate appears in the HR (2 RR) field. To measure an RR or a PR interval, place the left caliper at the start of the interval and the right caliper at the end of
the interval; the time between them appears in the Time field.
To keep the calipers in the same locations as you move through different screens of ECG, click the check box next to Lock; the calipers will stay in the indicated locations unless you move them again. Click again to turn off.
To make ST measurements, place the left caliper in the isoelectric portion of the PR interval, and place the right caliper where you want the ST segment measurement to be made; the vertical distance between where the left caliper intersects the ECG and where the right caliper intersects the ECG will appear in the ST field for each channel (labeled ST 1, 2, 3).
Note: All Review windows are linked by time-of-day. In addition, the Page window is linked to all other Review windows through the right-hand button on the mouse. From any other Review window, a right-click will jump to the Page display, retaining the current beat. After that, a right-click in Page will then take you back to where you originally were, regardless of whether you change the current beat in the Page window.
Sync from LX Event
This button is used for viewing Holter ECG when a NorthEast Monitor recorder was used in Both/HE mode and saved on LX Event. If this button is enabled on your PC, you can easily view the ECG sur-rounding the last strip that was saved on LX Event. More information on using this feature can be found in the LX Event man-ual.
Keep window with multiple strip button
st Monitoring, Inc. NEMM027-Rev-M Page 55 of 117
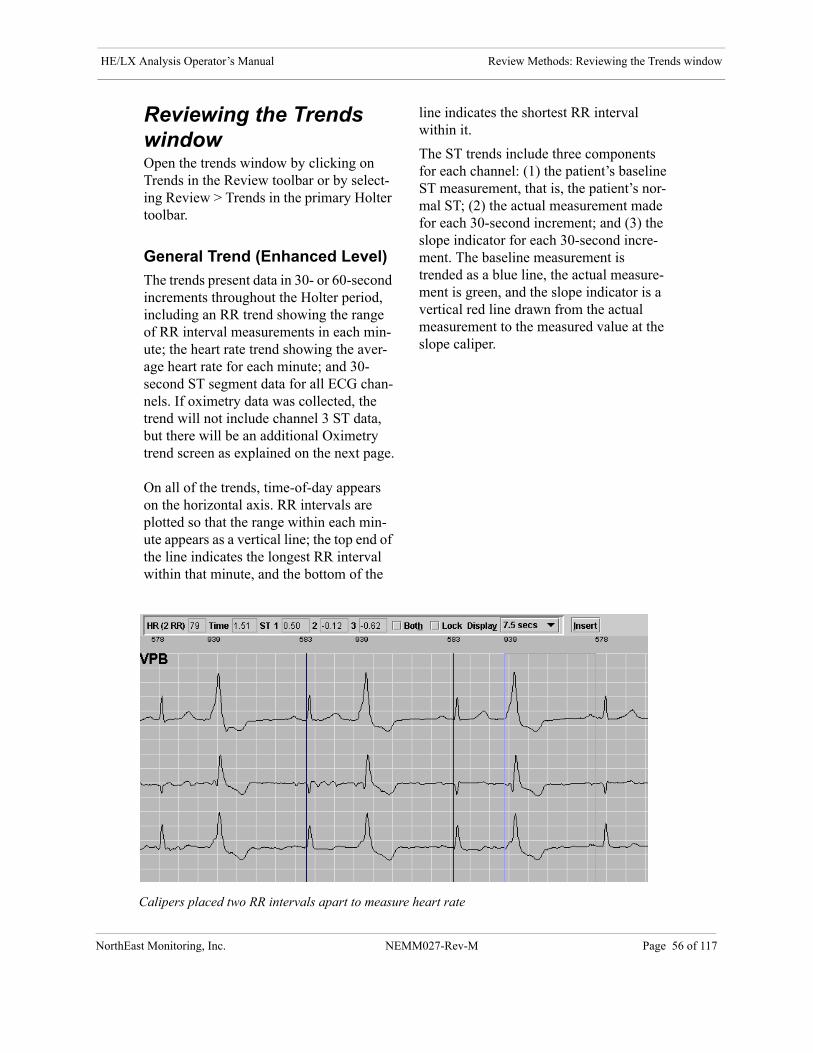
HE/LX Analysis Operator’s Manual Review Methods: Reviewing the Trends window
NorthEa
Reviewing the Trends windowOpen the trends window by clicking on Trends in the Review toolbar or by select-ing Review > Trends in the primary Holter toolbar.
General Trend (Enhanced Level)
The trends present data in 30- or 60-second increments throughout the Holter period, including an RR trend showing the range of RR interval measurements in each min-ute; the heart rate trend showing the aver-age heart rate for each minute; and 30-second ST segment data for all ECG chan-nels. If oximetry data was collected, the trend will not include channel 3 ST data, but there will be an additional Oximetry trend screen as explained on the next page.
On all of the trends, time-of-day appears on the horizontal axis. RR intervals are plotted so that the range within each min-ute appears as a vertical line; the top end of the line indicates the longest RR interval within that minute, and the bottom of the
line indicates the shortest RR interval within it.
The ST trends include three components for each channel: (1) the patient’s baseline ST measurement, that is, the patient’s nor-mal ST; (2) the actual measurement made for each 30-second increment; and (3) the slope indicator for each 30-second incre-ment. The baseline measurement is trended as a blue line, the actual measure-ment is green, and the slope indicator is a vertical red line drawn from the actual measurement to the measured value at the slope caliper.
Calipers placed two RR intervals apart to measure heart rate
st Monitoring, Inc. NEMM027-Rev-M Page 56 of 117
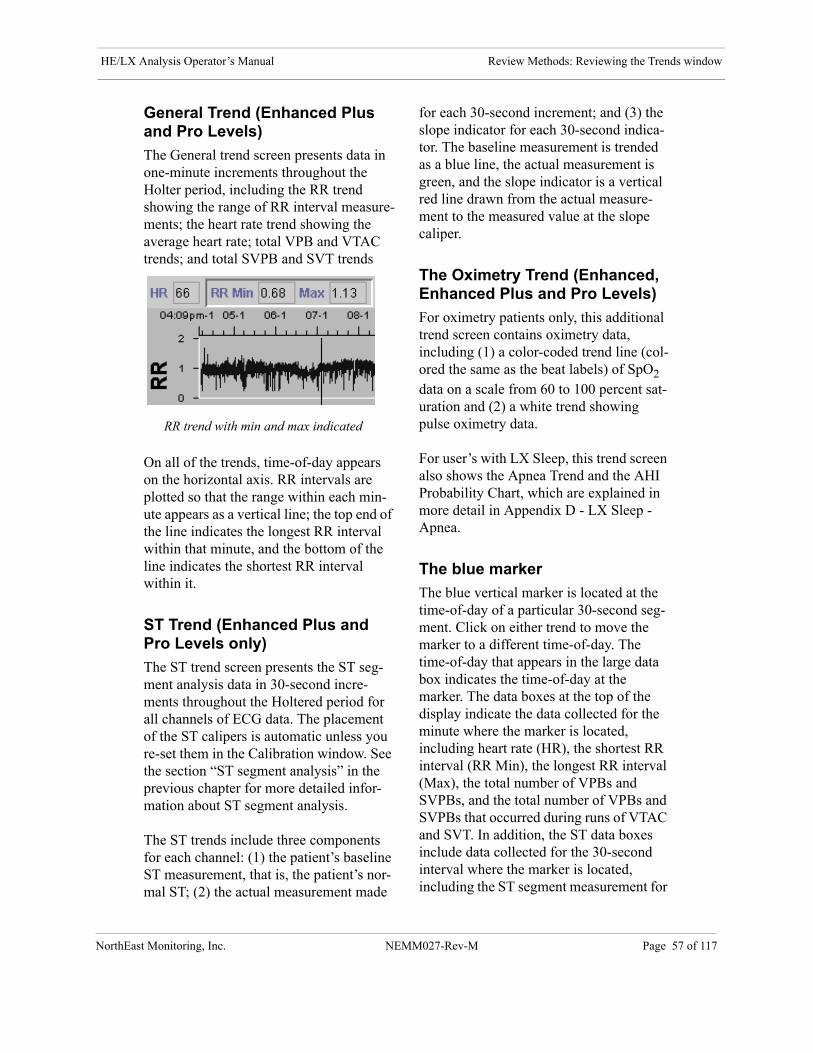
HE/LX Analysis Operator’s Manual Review Methods: Reviewing the Trends window
NorthEa
General Trend (Enhanced Plus and Pro Levels)
The General trend screen presents data in one-minute increments throughout the Holter period, including the RR trend showing the range of RR interval measure-ments; the heart rate trend showing the average heart rate; total VPB and VTAC trends; and total SVPB and SVT trends
On all of the trends, time-of-day appears on the horizontal axis. RR intervals are plotted so that the range within each min-ute appears as a vertical line; the top end of the line indicates the longest RR interval within that minute, and the bottom of the line indicates the shortest RR interval within it.
ST Trend (Enhanced Plus and Pro Levels only)
The ST trend screen presents the ST seg-ment analysis data in 30-second incre-ments throughout the Holtered period for all channels of ECG data. The placement of the ST calipers is automatic unless you re-set them in the Calibration window. See the section “ST segment analysis” in the previous chapter for more detailed infor-mation about ST segment analysis.
The ST trends include three components for each channel: (1) the patient’s baseline ST measurement, that is, the patient’s nor-mal ST; (2) the actual measurement made
for each 30-second increment; and (3) the slope indicator for each 30-second indica-tor. The baseline measurement is trended as a blue line, the actual measurement is green, and the slope indicator is a vertical red line drawn from the actual measure-ment to the measured value at the slope caliper.
The Oximetry Trend (Enhanced, Enhanced Plus and Pro Levels)
For oximetry patients only, this additional trend screen contains oximetry data, including (1) a color-coded trend line (col-ored the same as the beat labels) of SpO2 data on a scale from 60 to 100 percent sat-uration and (2) a white trend showing pulse oximetry data.
For user’s with LX Sleep, this trend screen also shows the Apnea Trend and the AHI Probability Chart, which are explained in more detail in Appendix D - LX Sleep - Apnea.
The blue marker
The blue vertical marker is located at the time-of-day of a particular 30-second seg-ment. Click on either trend to move the marker to a different time-of-day. The time-of-day that appears in the large data box indicates the time-of-day at the marker. The data boxes at the top of the display indicate the data collected for the minute where the marker is located, including heart rate (HR), the shortest RR interval (RR Min), the longest RR interval (Max), the total number of VPBs and SVPBs, and the total number of VPBs and SVPBs that occurred during runs of VTAC and SVT. In addition, the ST data boxes include data collected for the 30-second interval where the marker is located, including the ST segment measurement for
RR trend with min and max indicated
st Monitoring, Inc. NEMM027-Rev-M Page 57 of 117

HE/LX Analysis Operator’s Manual Review Methods: Reviewing the Trends window
NorthEa
each channel in ST 1, 2 and 3, and the ST slope measurement for each channel in Slope 1, 2 and 3.
The oximetry data appear with the mea-sured heart rate in the SpO2 HR field, the minimum SpO2 measurement in the Min field, and the maximum 2 measurement in the Max field.
Asterisks indicate that there is no data for that time period, usually because of arti-fact.
Relabeling to artifact
If entire periods are contaminated by arti-fact or if the electrodes were removed early (which generates lots of high fre-quency noise without ECG at the end of the Holter data), you can relabel continu-ous periods of data artifact. On the General trend screen, you can only artifact ECG data, and on the Oximetry trend screen, you can only artifact the SpO2 data. To artifact both, you must go to both screens.
In the Trends window, to relabel a continu-ous period as artifact, click at the time-of-day you want to start rejecting and then drag until the end time. The time period turns magenta. Now click the Artifact but-ton. A message will appear asking whether you mean to relabel the period as artifact. Click Yes to do so. All of the data within that time period is now called artifact, col-ored light blue, and not included in any of the totals.
To cancel the relabel, click No when the confirmation window appears.
Desaturation buttons (Oximetry trend only)
On the oximetry trend screen, the Desat(uration) On and Off buttons appear. This allows you to manually identify desaturation events that were not identified automatically. To create a new desaturation event, drag across the Trend window from the beginning of the event to the end. The trend is highlighted in magenta. Press Desat On to identify that period as a desat-uration event; the event is automatically entered in the Desaturation table in the Tables window.
You can undo the change in the Trends window by dragging to select it again and then pressing Desat Off.
Shorten analysis time
If the Holter period ends prematurely, you can either throw out the information as artifact, as described in the section above or you can shorten the analysis time.
To shorten the analysis time, in the Trends window, click to move the marker to the time-of-day at which you would like to end analysis, then select Review > Shorten analysis time. When the window opens to confirm the command, click Yes to re-ana-lyze the data, stopping at the time indi-cated. To close without re-analyzing, click No.
Turning AF On/Off (Pro and Enhanced Plus Only)
If a patient is in intermittent atrial fibrilla-tion or flutter and you want to create a sin-gle AF event, click on the trend on the
Desaturation On, Off buttons
st Monitoring, Inc. NEMM027-Rev-M Page 58 of 117
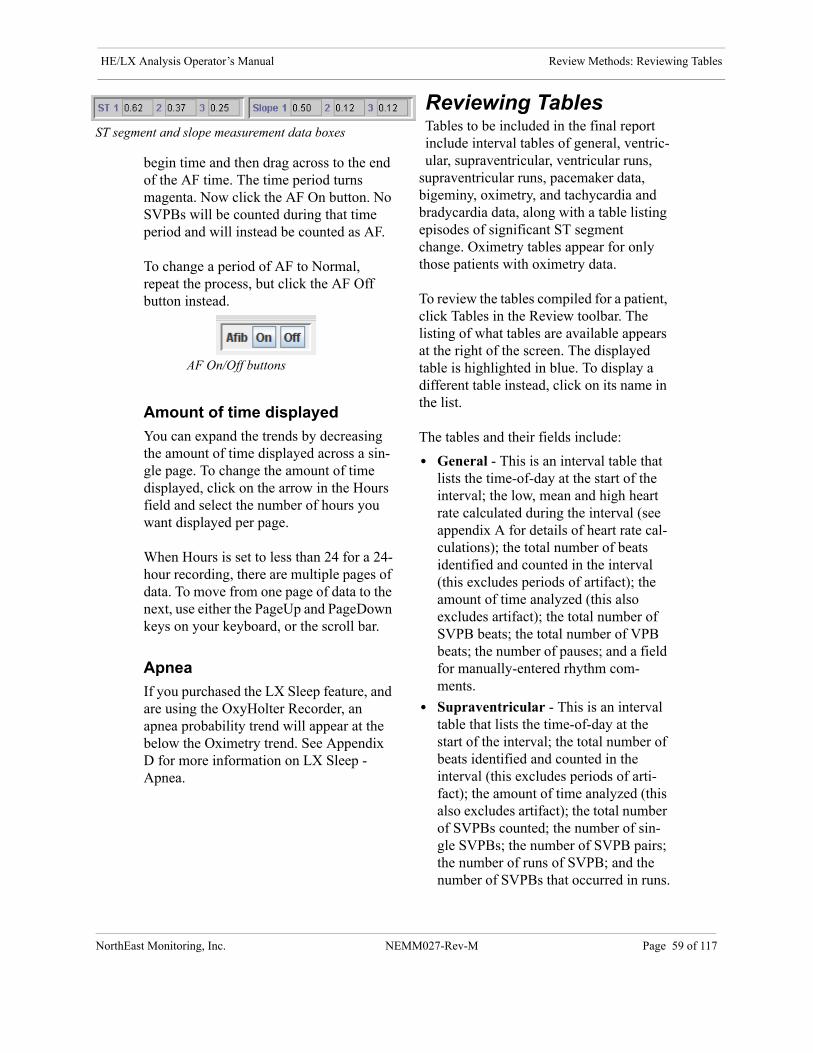
HE/LX Analysis Operator’s Manual Review Methods: Reviewing Tables
NorthEa
ST segm
begin time and then drag across to the end of the AF time. The time period turns magenta. Now click the AF On button. No SVPBs will be counted during that time period and will instead be counted as AF.
To change a period of AF to Normal, repeat the process, but click the AF Off button instead.
Amount of time displayed
You can expand the trends by decreasing the amount of time displayed across a sin-gle page. To change the amount of time displayed, click on the arrow in the Hours field and select the number of hours you want displayed per page.
When Hours is set to less than 24 for a 24-hour recording, there are multiple pages of data. To move from one page of data to the next, use either the PageUp and PageDown keys on your keyboard, or the scroll bar.
Apnea
If you purchased the LX Sleep feature, and are using the OxyHolter Recorder, an apnea probability trend will appear at the below the Oximetry trend. See Appendix D for more information on LX Sleep - Apnea.
Reviewing TablesTables to be included in the final report include interval tables of general, ventric-ular, supraventricular, ventricular runs,
supraventricular runs, pacemaker data, bigeminy, oximetry, and tachycardia and bradycardia data, along with a table listing episodes of significant ST segment change. Oximetry tables appear for only those patients with oximetry data.
To review the tables compiled for a patient, click Tables in the Review toolbar. The listing of what tables are available appears at the right of the screen. The displayed table is highlighted in blue. To display a different table instead, click on its name in the list.
The tables and their fields include:
• General - This is an interval table that lists the time-of-day at the start of the interval; the low, mean and high heart rate calculated during the interval (see appendix A for details of heart rate cal-culations); the total number of beats identified and counted in the interval (this excludes periods of artifact); the amount of time analyzed (this also excludes artifact); the total number of SVPB beats; the total number of VPB beats; the number of pauses; and a field for manually-entered rhythm com-ments.
• Supraventricular - This is an interval table that lists the time-of-day at the start of the interval; the total number of beats identified and counted in the interval (this excludes periods of arti-fact); the amount of time analyzed (this also excludes artifact); the total number of SVPBs counted; the number of sin-gle SVPBs; the number of SVPB pairs; the number of runs of SVPB; and the number of SVPBs that occurred in runs.
AF On/Off buttons
ent and slope measurement data boxes
st Monitoring, Inc. NEMM027-Rev-M Page 59 of 117

HE/LX Analysis Operator’s Manual Review Methods: Reviewing Tables
NorthEa
• Ventricular - An interval table that lists the time-of-day at the start of the inter-val; the total number of beats identified and counted in the interval (this excludes periods of artifact); the amount of time analyzed (this also excludes artifact); the total number of VPBs counted; the number of single VPBs; the number of VPB pairs; the number of runs of VTAC; and the num-ber of VTAC beats that occurred in runs.
• ST Event - This table lists the ST seg-ment events that were detected during the Holter test. Data in this table includes the channel in which the event was detected; the time-of-day at the start of the event; the time-of-day at the end of the event; the duration of the event; the maximum heart rate calcu-lated during the event; the time-of-day at the event’s maximum deviation from the patient’s baseline; the heart rate dur-ing the event’s maximum deviation from the patient’s baseline; the ST seg-ment measurement’s deviation from the patient’s baseline; the ST segment mea-surement’s deviation from iso-electric; the slope of the ST segment event at the point of maximum deviation; and the integral of the event.
Note: Details of ST segment analysis and labels are provided in the “ST segment analysis” section of the previous chapter.
• Paced - An interval table that lists the time-of-day at the start of the interval; the total number of beats identified and counted in the interval (this excludes periods of artifact); the amount of time analyzed (this also excludes artifact); the total number of beats counted as paced; the number that were atrial-paced only; the number that were ven-tricular-paced only; the number that were paced in both chambers; the num-
ber of sense failures; the number of capture failures; the number of occur-rences of inappropriate inhibition; and the percentage of paced beats.
Note: Details of the pacemaker analysis and labels are provided in the “Pacemaker analysis” section of the previous chapter.
• Oximetry (optional) - Oximetry data is reported in four tables:
5. SpO2 /HR summary - This includes the Minimum, Mean and Maximum values of SpO2 and heart rate for the patient.
6. SpO2 summary - This provides an overview of the amount of time (hours, minutes, and seconds; and percentage) the patient spent in var-ious saturation ranges.
7. Heart Rate summary - This pro-vides an overview of the amount of time (hours, minutes, and seconds; and percentage) the patient spent in various heart rate ranges.
8. Desaturation - This table lists the start and end times and total dura-tion of any desaturation events identified by the software (based on settings in Settings > Oximetry) or manually identified in the Trends window.
The following Tables exist in the Pro level only:
• Supraventricular runs - An interval table that lists the time-of-day at the start of the interval; then the number of 3-beat, 4-beat, 5-beat, 6-to-9-beat, and 10+-beat SVT runs. It also includes number of beats included in AF events, the number of AF events, and total AF time.
st Monitoring, Inc. NEMM027-Rev-M Page 60 of 117
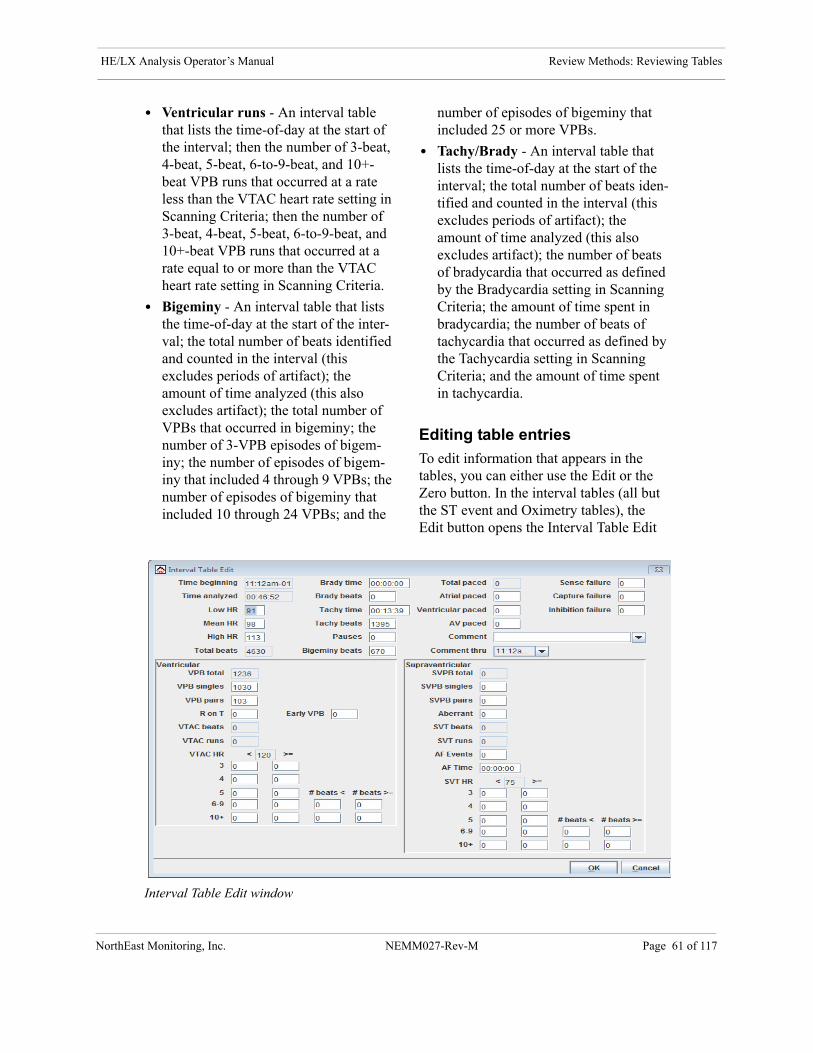
HE/LX Analysis Operator’s Manual Review Methods: Reviewing Tables
NorthEa
• Ventricular runs - An interval table that lists the time-of-day at the start of the interval; then the number of 3-beat, 4-beat, 5-beat, 6-to-9-beat, and 10+-beat VPB runs that occurred at a rate less than the VTAC heart rate setting in Scanning Criteria; then the number of 3-beat, 4-beat, 5-beat, 6-to-9-beat, and 10+-beat VPB runs that occurred at a rate equal to or more than the VTAC heart rate setting in Scanning Criteria.
• Bigeminy - An interval table that lists the time-of-day at the start of the inter-val; the total number of beats identified and counted in the interval (this excludes periods of artifact); the amount of time analyzed (this also excludes artifact); the total number of VPBs that occurred in bigeminy; the number of 3-VPB episodes of bigem-iny; the number of episodes of bigem-iny that included 4 through 9 VPBs; the number of episodes of bigeminy that included 10 through 24 VPBs; and the
number of episodes of bigeminy that included 25 or more VPBs.
• Tachy/Brady - An interval table that lists the time-of-day at the start of the interval; the total number of beats iden-tified and counted in the interval (this excludes periods of artifact); the amount of time analyzed (this also excludes artifact); the number of beats of bradycardia that occurred as defined by the Bradycardia setting in Scanning Criteria; the amount of time spent in bradycardia; the number of beats of tachycardia that occurred as defined by the Tachycardia setting in Scanning Criteria; and the amount of time spent in tachycardia.
Editing table entries
To edit information that appears in the tables, you can either use the Edit or the Zero button. In the interval tables (all but the ST event and Oximetry tables), the Edit button opens the Interval Table Edit
Interval Table Edit window
st Monitoring, Inc. NEMM027-Rev-M Page 61 of 117

HE/LX Analysis Operator’s Manual Review Methods: Additional features
NorthEa
window that allows you to change infor-mation within the data fields for a particu-lar interval. To use the Edit button, first click on a particular interval in a table to highlight it, then click Edit.
Note: If you choose to edit tables, this should be the last thing you do before creating the report, as calculated values are recalculated every time you do an Update or Reanalyze the data.
Note: If you have already created a front page, you will need to do a View Summary > Reset to ensure that table changes are incorporated on the front page of the report.
Editable fields appear with data against a white background. Fields that you cannot edit have a blue background. For example, total beat counts are not editable because they are calculated from other field data present in the table; as you make changes to the other fields, the total counts change appropriately.
To completely eliminate all information within an interval, use the Zero button, which opens the Interval Table Zero win-dow.Click on as many data fields as you want zeroed out in the interval tables, then click OK to exit. Click Cancel to exit with-out saving any changes.
Select/deselect all buttons are available for each section. Use them to turn on or off all data fields within each specified section - general information, ventricular, or supra-ventricular.
Printing tables
To print a displayed table, click Print to open the Print window, then click OK to
print. Click Cancel to close the window without printing.
Additional features
Superimposition
HE/LX Analysis software allows you to review the patient’s ECG in superimposition mode. In superimpo-sition, each beat is quickly superim-posed upon the pre-ceding one in a continuous stream, which allows you to easily identify rhythm changes. Normal beats, VPBs and artifact are superimposed in sep-arate locations in the Superimposition window so that you can also verify beat identification.
To open the Super-imposition window, select Superimposition from the drop-down Review menu. Click on Scan to start and stop the superimposition display.
In the display, channel 1 appears on top, channel 2 in the middle, and channel 3 at the bottom. (The channel 3 area is empty if there is oximetry data for this patient.) Beats that match normal and paced tem-plates are superimposed at the left side of the window, while beats that match ven-tricular templates appear in the center, and
Superimposition
st Monitoring, Inc. NEMM027-Rev-M Page 62 of 117
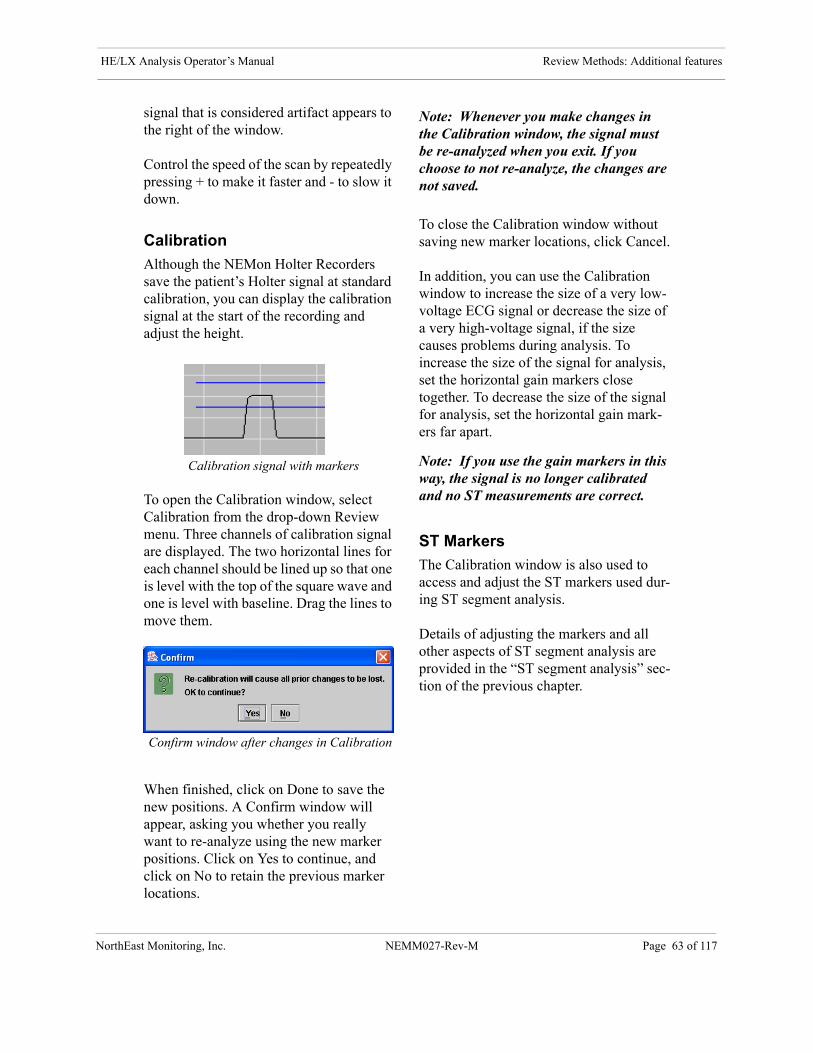
HE/LX Analysis Operator’s Manual Review Methods: Additional features
NorthEa
signal that is considered artifact appears to the right of the window.
Control the speed of the scan by repeatedly pressing + to make it faster and - to slow it down.
Calibration
Although the NEMon Holter Recorders save the patient’s Holter signal at standard calibration, you can display the calibration signal at the start of the recording and adjust the height.
To open the Calibration window, select Calibration from the drop-down Review menu. Three channels of calibration signal are displayed. The two horizontal lines for each channel should be lined up so that one is level with the top of the square wave and one is level with baseline. Drag the lines to move them.
When finished, click on Done to save the new positions. A Confirm window will appear, asking you whether you really want to re-analyze using the new marker positions. Click on Yes to continue, and click on No to retain the previous marker locations.
Note: Whenever you make changes in the Calibration window, the signal must be re-analyzed when you exit. If you choose to not re-analyze, the changes are not saved.
To close the Calibration window without saving new marker locations, click Cancel.
In addition, you can use the Calibration window to increase the size of a very low-voltage ECG signal or decrease the size of a very high-voltage signal, if the size causes problems during analysis. To increase the size of the signal for analysis, set the horizontal gain markers close together. To decrease the size of the signal for analysis, set the horizontal gain mark-ers far apart.
Note: If you use the gain markers in this way, the signal is no longer calibrated and no ST measurements are correct.
ST Markers
The Calibration window is also used to access and adjust the ST markers used dur-ing ST segment analysis.
Details of adjusting the markers and all other aspects of ST segment analysis are provided in the “ST segment analysis” sec-tion of the previous chapter.
Calibration signal with markers
Confirm window after changes in Calibration
st Monitoring, Inc. NEMM027-Rev-M Page 63 of 117
5. 12-LEAD PRESENTATIONS
The HE/LX Analysis software enables you to review and edit 12-lead information recorded on one of the NorthEast Monitoring DR180 Series Holter Recorders using one of the 12-lead recording modes. The 12-lead data and 6-by-2 presentations can then be included in the final Holter report or printed separately.
NorthEast M
Recording 12-lead dataTo review the 12-lead data collected during a patient’s Holter test, the recording mode of the DR180 Series recorder must be set to record 12-Lead.
When 12-lead data is present on the flashcard along with a patient’s Holter data, the HE/LX Analysis software activates the 12-Lead menu item in the Review toolbar. If the 12 Lead item is dim, it means that the patient’s Holter recording did not include 12-lead data.
HE/LX Analysis allows you to review the 12-lead data on-screen in three different ways - ST Graphs, Strips, and Trends. These three options are listed in the 12 Lead menu in the Review toolbar.
12-lead strips
The 12-lead data recorded on the DR180 Series recorder is displayed in 12 strips per sample. They are from leads I, II, III, aVR, aVL, aVF, and V1 through V6. In the Strips window, you can choose to display them three leads at a time by clicking the Single button or 12 leads at a time by clicking the Multiple button.
Note: In the 12 Lead Strips window, the Single button appears only in the Multiple display and the Multiple button appearsonly in the three-lead display.
In addition to the ECG, the strips appear with either P, Q, R, S and T markers or ST markers (iso-electric, j-point and S), depending on which button is selected. Click on the button to the left of your choice to change the display.
Sorting of strips
Strips within the 12 Lead Strips window can be sorted by time-of-day in the order they were saved or by the ST segment elevation or depression measurement in a particular
Buttons in 12 Lead Strips
onitoring, Inc. NEMM027-Rev-M Page 64 of 117

HE/LX Analysis Operator’s Manual 12-Lead Presentations: Recording 12-lead data
NorthEa
indow
lead. Make a selection from the Sort field to change the order of the strips.
Marker (Caliper) locations
For each beat in each lead, the software determines the approximate positions of the P (onset of p-wave), Q (onset of QRS complex), R (maximum amplitude of QRS complex), S (end of QRS complex), and T (end of T-wave) calipers, along with the R caliper for the following beat. It also deter-mines the approximate positions of the iso-electric, j-point and ST segment calipers. In addition, it averages each caliper’s loca-tion across all 12 leads for each individual beat. It is up to you to determine whether those positions are accurate for each beat, and reposition them, if necessary.
The QRS and ST markers displayed in the 12 Lead Strips can be located either at the particular location determined for that individual lead at that time or at the aver-age location across the 12 leads at that time. This is determined by whether the Actual or Average button, respectively, is clicked on. Click on the button to the left of your choice to change the display.
Each lead displayed has data associated with it based on the locations of the var-ious calipers. With the QRS markers displayed, the data include:
• RR interval - from the R marker on the current beat to the R marker on the next beat,
• QRS duration - from the Q marker to the S marker of the current beat,
• PR interval - from the P marker to the Q marker, and
• QT/c - the first number is the interval from the Q to the T marker (at the end of the T-wave), and the second
number is the corrected QT, otherwise known as QTc.QTc can be calculated one of 4 ways:1. Bazett: QT/(RR^(1/2))2. Hodges: QT + 1.75*(60/RR - 60)3. Frederica: QT/(RR^(1/3)) and4. Framingham: QT + 0.154*(1-RR)
With the ST calipers displayed, the data include:
• J-ST interval - from the J marker to the S marker and
• ST segment measurement - the verti-cal distance between where the I marker intersects the ECG and where the S marker intersects the ECG.
The data displayed are dependent on the current positions of the calipers; if you move the calipers, the data change.
The “average” data uses all good leads combined (there must be at least 5 good leads). To determine the combined “aver-age” data, the software uses the earliest P caliper, the earliest Q caliper, an average of all R calipers, the latest S caliper, and the latest T caliper. For the ST calipers, the average positions of the I and J calipers are used, and the S caliper is a fixed offset from the average J.
Actual, Average buttons
QRS markers in 12 Lead Strips w
st Monitoring, Inc. NEMM027-Rev-M Page 65 of 117
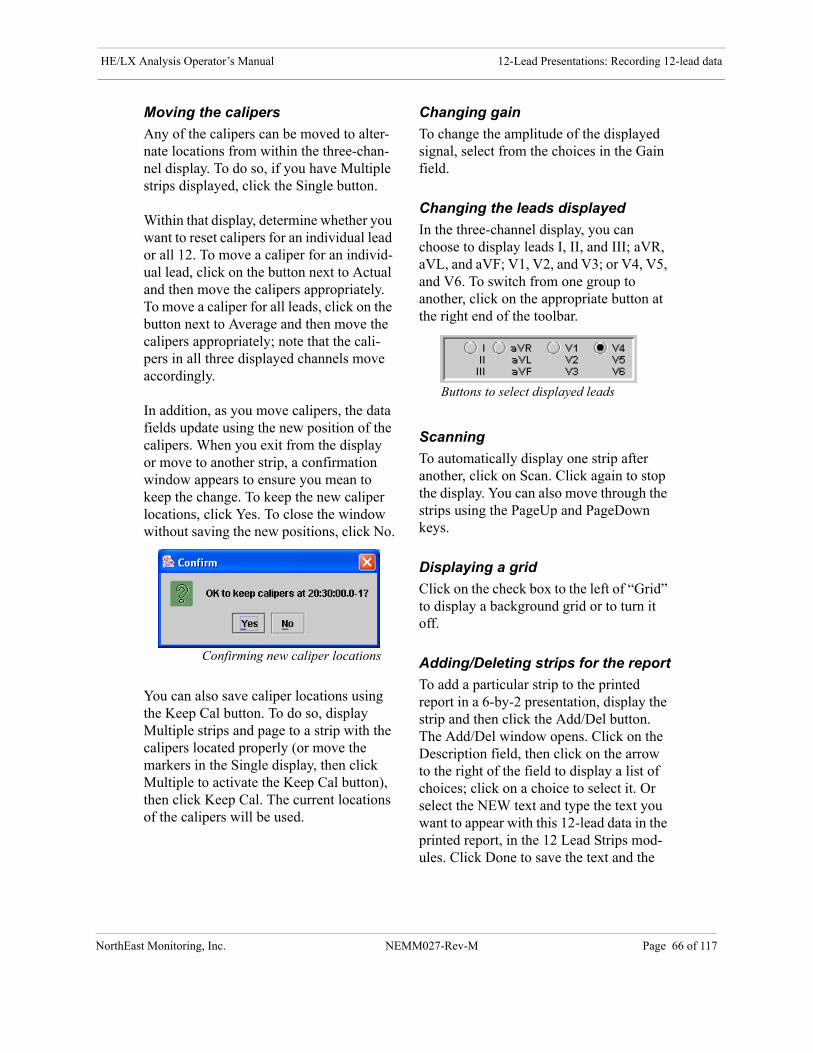
HE/LX Analysis Operator’s Manual 12-Lead Presentations: Recording 12-lead data
NorthEa
Moving the calipers
Any of the calipers can be moved to alter-nate locations from within the three-chan-nel display. To do so, if you have Multiple strips displayed, click the Single button.
Within that display, determine whether you want to reset calipers for an individual lead or all 12. To move a caliper for an individ-ual lead, click on the button next to Actual and then move the calipers appropriately. To move a caliper for all leads, click on the button next to Average and then move the calipers appropriately; note that the cali-pers in all three displayed channels move accordingly.
In addition, as you move calipers, the data fields update using the new position of the calipers. When you exit from the display or move to another strip, a confirmation window appears to ensure you mean to keep the change. To keep the new caliper locations, click Yes. To close the window without saving the new positions, click No.
You can also save caliper locations using the Keep Cal button. To do so, display Multiple strips and page to a strip with the calipers located properly (or move the markers in the Single display, then click Multiple to activate the Keep Cal button), then click Keep Cal. The current locations of the calipers will be used.
Changing gain
To change the amplitude of the displayed signal, select from the choices in the Gain field.
Changing the leads displayed
In the three-channel display, you can choose to display leads I, II, and III; aVR, aVL, and aVF; V1, V2, and V3; or V4, V5, and V6. To switch from one group to another, click on the appropriate button at the right end of the toolbar.
Scanning
To automatically display one strip after another, click on Scan. Click again to stop the display. You can also move through the strips using the PageUp and PageDown keys.
Displaying a grid
Click on the check box to the left of “Grid” to display a background grid or to turn it off.
Adding/Deleting strips for the report
To add a particular strip to the printed report in a 6-by-2 presentation, display the strip and then click the Add/Del button. The Add/Del window opens. Click on the Description field, then click on the arrow to the right of the field to display a list of choices; click on a choice to select it. Or select the NEW text and type the text you want to appear with this 12-lead data in the printed report, in the 12 Lead Strips mod-ules. Click Done to save the text and the
Confirming new caliper locations
Buttons to select displayed leads
st Monitoring, Inc. NEMM027-Rev-M Page 66 of 117
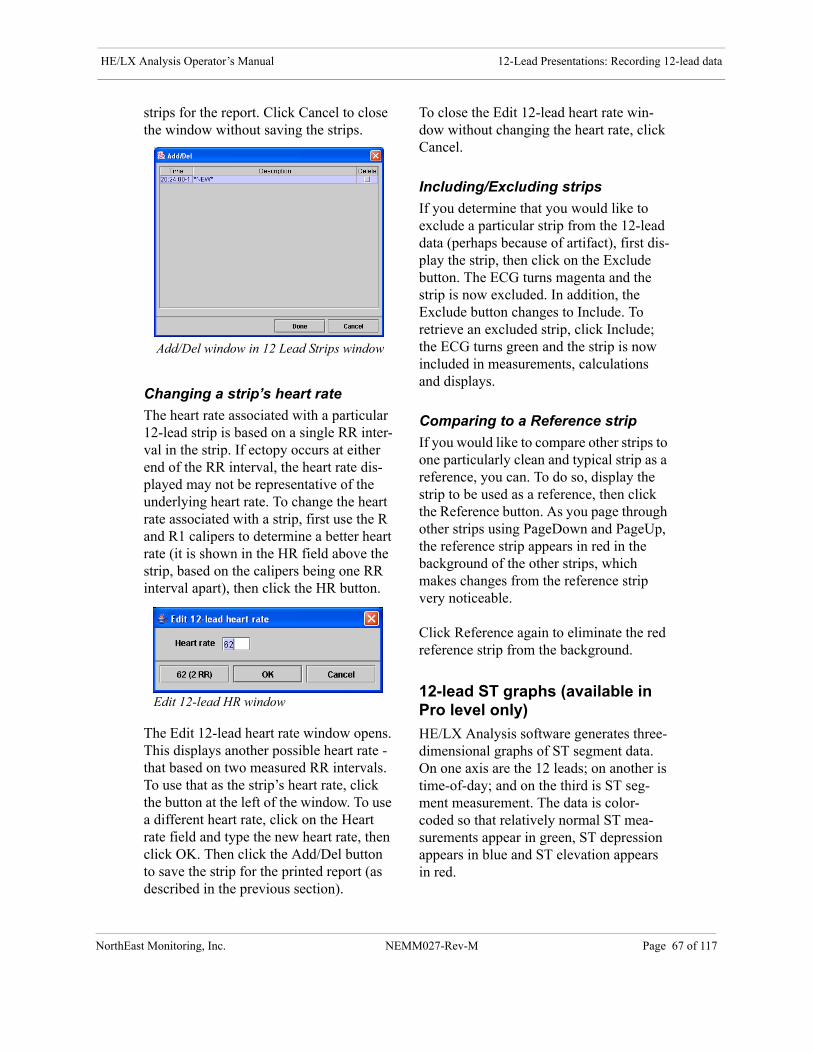
HE/LX Analysis Operator’s Manual 12-Lead Presentations: Recording 12-lead data
NorthEa
strips for the report. Click Cancel to close the window without saving the strips.
Changing a strip’s heart rate
The heart rate associated with a particular 12-lead strip is based on a single RR inter-val in the strip. If ectopy occurs at either end of the RR interval, the heart rate dis-played may not be representative of the underlying heart rate. To change the heart rate associated with a strip, first use the R and R1 calipers to determine a better heart rate (it is shown in the HR field above the strip, based on the calipers being one RR interval apart), then click the HR button.
The Edit 12-lead heart rate window opens. This displays another possible heart rate - that based on two measured RR intervals. To use that as the strip’s heart rate, click the button at the left of the window. To use a different heart rate, click on the Heart rate field and type the new heart rate, then click OK. Then click the Add/Del button to save the strip for the printed report (as described in the previous section).
To close the Edit 12-lead heart rate win-dow without changing the heart rate, click Cancel.
Including/Excluding strips
If you determine that you would like to exclude a particular strip from the 12-lead data (perhaps because of artifact), first dis-play the strip, then click on the Exclude button. The ECG turns magenta and the strip is now excluded. In addition, the Exclude button changes to Include. To retrieve an excluded strip, click Include; the ECG turns green and the strip is now included in measurements, calculations and displays.
Comparing to a Reference strip
If you would like to compare other strips to one particularly clean and typical strip as a reference, you can. To do so, display the strip to be used as a reference, then click the Reference button. As you page through other strips using PageDown and PageUp, the reference strip appears in red in the background of the other strips, which makes changes from the reference strip very noticeable.
Click Reference again to eliminate the red reference strip from the background.
12-lead ST graphs (available in Pro level only)
HE/LX Analysis software generates three-dimensional graphs of ST segment data. On one axis are the 12 leads; on another is time-of-day; and on the third is ST seg-ment measurement. The data is color-coded so that relatively normal ST mea-surements appear in green, ST depression appears in blue and ST elevation appears in red.
Add/Del window in 12 Lead Strips window
Edit 12-lead HR window
st Monitoring, Inc. NEMM027-Rev-M Page 67 of 117
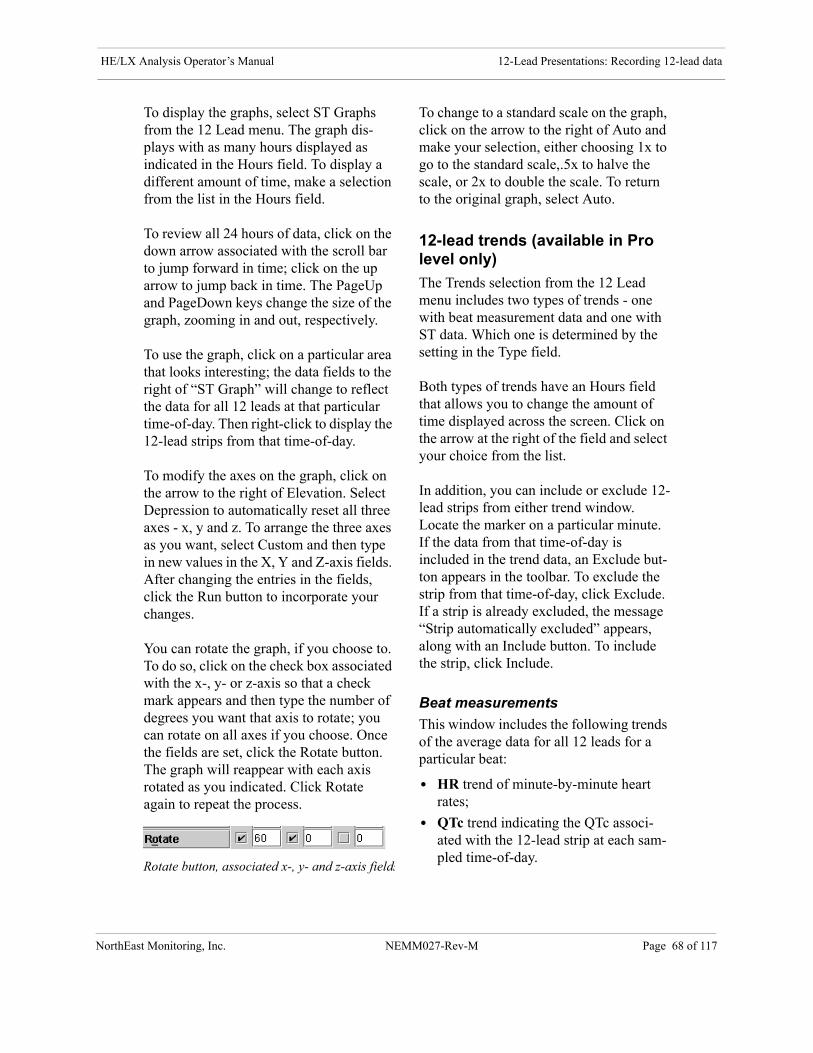
HE/LX Analysis Operator’s Manual 12-Lead Presentations: Recording 12-lead data
NorthEa
To display the graphs, select ST Graphs from the 12 Lead menu. The graph dis-plays with as many hours displayed as indicated in the Hours field. To display a different amount of time, make a selection from the list in the Hours field.
To review all 24 hours of data, click on the down arrow associated with the scroll bar to jump forward in time; click on the up arrow to jump back in time. The PageUp and PageDown keys change the size of the graph, zooming in and out, respectively.
To use the graph, click on a particular area that looks interesting; the data fields to the right of “ST Graph” will change to reflect the data for all 12 leads at that particular time-of-day. Then right-click to display the 12-lead strips from that time-of-day.
To modify the axes on the graph, click on the arrow to the right of Elevation. Select Depression to automatically reset all three axes - x, y and z. To arrange the three axes as you want, select Custom and then type in new values in the X, Y and Z-axis fields. After changing the entries in the fields, click the Run button to incorporate your changes.
You can rotate the graph, if you choose to. To do so, click on the check box associated with the x-, y- or z-axis so that a check mark appears and then type the number of degrees you want that axis to rotate; you can rotate on all axes if you choose. Once the fields are set, click the Rotate button. The graph will reappear with each axis rotated as you indicated. Click Rotate again to repeat the process.
To change to a standard scale on the graph, click on the arrow to the right of Auto and make your selection, either choosing 1x to go to the standard scale,.5x to halve the scale, or 2x to double the scale. To return to the original graph, select Auto.
12-lead trends (available in Pro level only)
The Trends selection from the 12 Lead menu includes two types of trends - one with beat measurement data and one with ST data. Which one is determined by the setting in the Type field.
Both types of trends have an Hours field that allows you to change the amount of time displayed across the screen. Click on the arrow at the right of the field and select your choice from the list.
In addition, you can include or exclude 12-lead strips from either trend window. Locate the marker on a particular minute. If the data from that time-of-day is included in the trend data, an Exclude but-ton appears in the toolbar. To exclude the strip from that time-of-day, click Exclude. If a strip is already excluded, the message “Strip automatically excluded” appears, along with an Include button. To include the strip, click Include.
Beat measurements
This window includes the following trends of the average data for all 12 leads for a particular beat:
• HR trend of minute-by-minute heart rates;
• QTc trend indicating the QTc associ-ated with the 12-lead strip at each sam-pled time-of-day.
Rotate button, associated x-, y- and z-axis fields
st Monitoring, Inc. NEMM027-Rev-M Page 68 of 117

HE/LX Analysis Operator’s Manual 12-Lead Presentations: Printing 12-lead data and strips
NorthEa
• PR trend showing the measured PR interval for the 12-lead strip at each sampled time-of-day;
• QRS trend indicating the width of the QRS complex for the 12-lead strip at each sampled time-of-day; and
• QTd trend showing the QT dispersion for each sampled time-of-day, using the formula QTd = (longest QT in any lead) - (shortest QT in any lead).
Above the trends are data fields that dis-play the exact measurements at the time-of-day where the blue marker is located. Asterisks in a field indicate that the data was considered to be artifact and was not used.
To move to the strips from the time-of-day where the marker is located, right-click the mouse.
ST level
The ST trends in 12-lead show trends from all 12 leads at one time. The information plotted is the ST segment measurement made on a particular lead for each 12-lead strip. Specific data for the strip at the time-of-day where the marker is located show up for each lead to the right of the lead name.
Printing 12-lead data and stripsThe HE/LX Analysis software includes these four 12-lead modules that can be included in the printed report: The Trends and Graphs are only available in the Pro level of the software.
• 12-lead Trend Graphs
• 12-lead Tables (25 pages)
• 12-lead Strips (25 mm/sec)
• 12-lead Strips (50 mm/sec)
To include a module in the printed report, click on the check box next to it. A check mark indicates that the module will be included in the report. No check mark indi-cates that it will not be included in the report. To print the 12-lead data without a Holter report, leave the Holter modules not checked and check just those 12-lead mod-ules you want to include.
12-lead Trend Graphs
This is a group of 24-hour trends called “12 Lead Data Graph” that plot:
• QTd, which is the QT dispersion, the difference between the longest QT interval and the shortest QT interval for a particular point in time;
• QTc, which is a corrected QT interval using the formula of your choice from the Scanning Criteria;
• QT, the QT interval;
• PR, the PR interval;
• QRS, the width of the QRS complex; and
• RR, the RR interval following the mea-sured beat.
12-lead ST level trend
st Monitoring, Inc. NEMM027-Rev-M Page 69 of 117
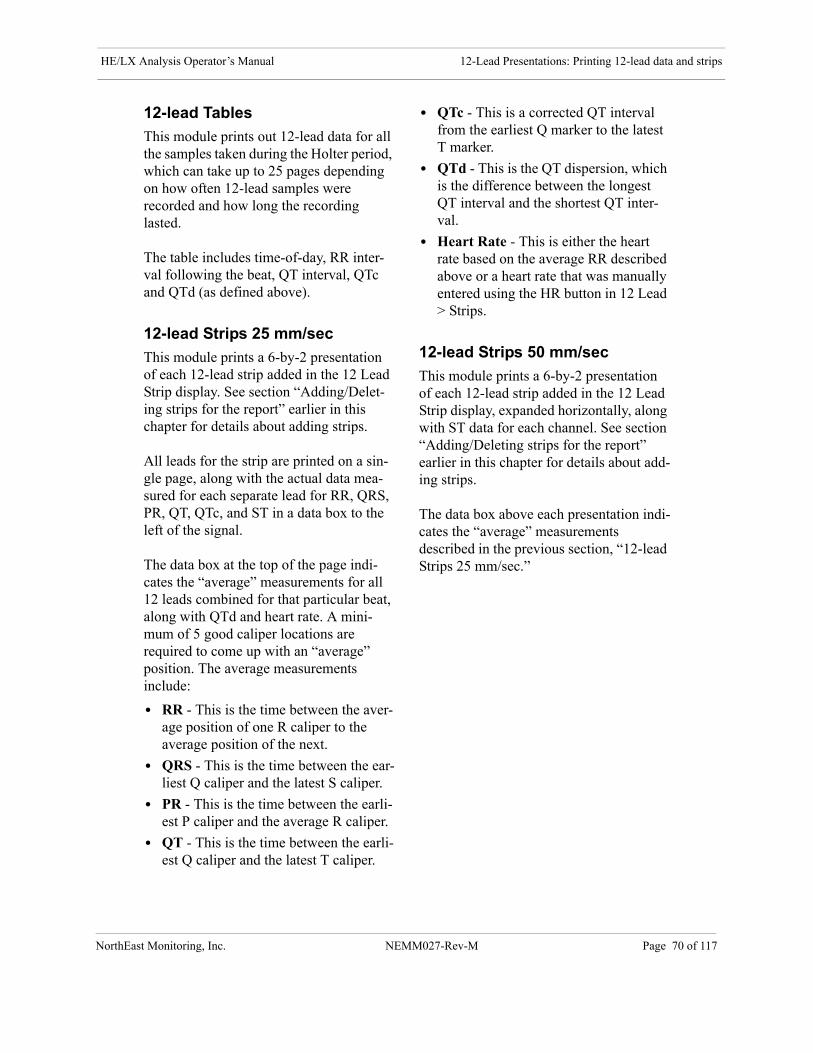
HE/LX Analysis Operator’s Manual 12-Lead Presentations: Printing 12-lead data and strips
NorthEa
12-lead Tables
This module prints out 12-lead data for all the samples taken during the Holter period, which can take up to 25 pages depending on how often 12-lead samples were recorded and how long the recording lasted.
The table includes time-of-day, RR inter-val following the beat, QT interval, QTc and QTd (as defined above).
12-lead Strips 25 mm/sec
This module prints a 6-by-2 presentation of each 12-lead strip added in the 12 Lead Strip display. See section “Adding/Delet-ing strips for the report” earlier in this chapter for details about adding strips.
All leads for the strip are printed on a sin-gle page, along with the actual data mea-sured for each separate lead for RR, QRS, PR, QT, QTc, and ST in a data box to the left of the signal.
The data box at the top of the page indi-cates the “average” measurements for all 12 leads combined for that particular beat, along with QTd and heart rate. A mini-mum of 5 good caliper locations are required to come up with an “average” position. The average measurements include:
• RR - This is the time between the aver-age position of one R caliper to the average position of the next.
• QRS - This is the time between the ear-liest Q caliper and the latest S caliper.
• PR - This is the time between the earli-est P caliper and the average R caliper.
• QT - This is the time between the earli-est Q caliper and the latest T caliper.
• QTc - This is a corrected QT interval from the earliest Q marker to the latest T marker.
• QTd - This is the QT dispersion, which is the difference between the longest QT interval and the shortest QT inter-val.
• Heart Rate - This is either the heart rate based on the average RR described above or a heart rate that was manually entered using the HR button in 12 Lead > Strips.
12-lead Strips 50 mm/sec
This module prints a 6-by-2 presentation of each 12-lead strip added in the 12 Lead Strip display, expanded horizontally, along with ST data for each channel. See section “Adding/Deleting strips for the report” earlier in this chapter for details about add-ing strips.
The data box above each presentation indi-cates the “average” measurements described in the previous section, “12-lead Strips 25 mm/sec.”
st Monitoring, Inc. NEMM027-Rev-M Page 70 of 117

6. HRV ANALYSIS Heart Rate Variability (HRV) software allows you to review information about a patient’s normal-to-nor-mal RR interval data in a wide variety of ways, including Lorenz, 3-dimensional, circadian and time-domain plots. In addition, HRV information is reported in tabular formats of both time and frequency domain. Tables include calculations standard for HRV analysis, including SDNN, SDSD, RMSSD, NN50 count, pNN50, and a variety of indices - HRV triangular, differential and logarithmic.
NorthEast M
orenz Plot
Reviewing HRV dataReview the HRV data by selecting one of the items from the HRV drop-down menu in the main Holter menu bar.
Note: HRV Analysis can only be performed when the Analysis time is 24 hours or less. For this reason, the HRV menu option from the toolbar will be disabled when the Analysis duration is greater than 28 hours.
Lorenz Plot
These are scatter dia-grams comparing the RR interval following the current beat to the RR interval prior to the current beat. You can choose to display all RR intervals, only normal-to-normal RR intervals, only RR intervals on either side of a ventricu-lar ectopic, or only RR intervals on either side of a supraventricular ectopic. Make your selection in the Morph field by clicking on the arrow and then clicking on your choice.You can change the range on the two axes by making a different selection in the Scale (ms) field. Your choices are 1000, 2000, 3000, 4000, or 5000. Click on the arrow in the field and then click on your choice to change the setting.
L
onitoring, Inc. NEMM027-Rev-M Page 71 of 117
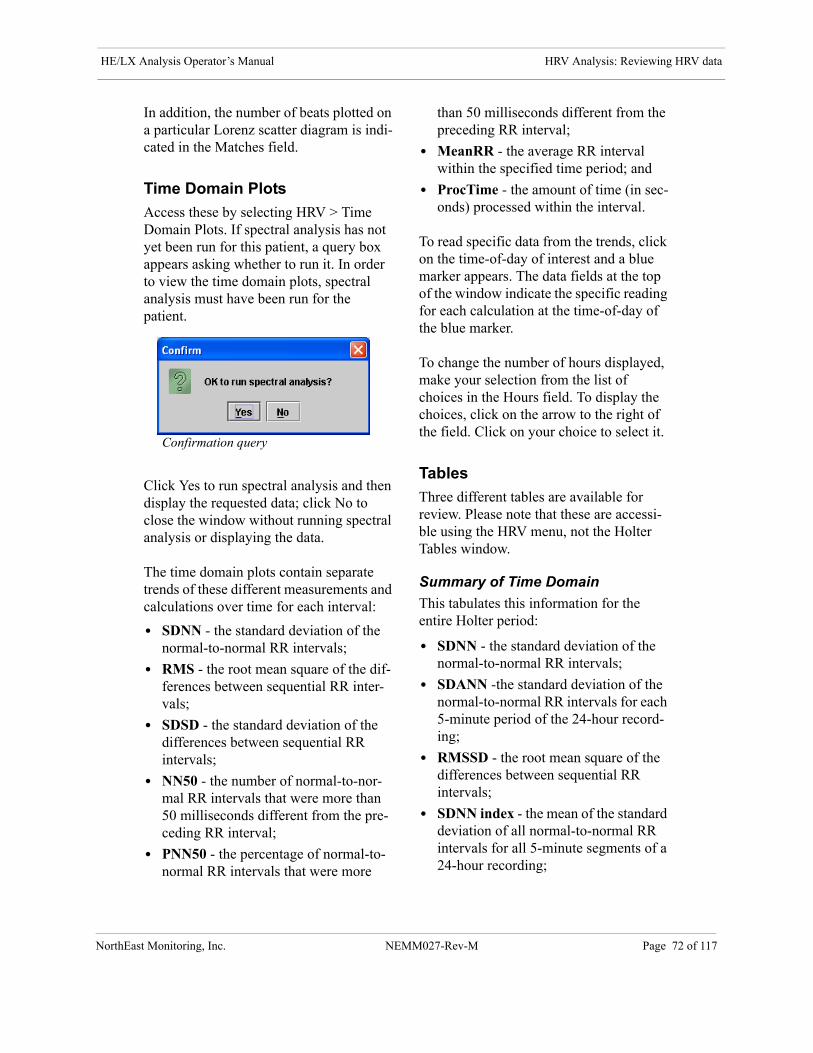
HE/LX Analysis Operator’s Manual HRV Analysis: Reviewing HRV data
NorthEa
In addition, the number of beats plotted on a particular Lorenz scatter diagram is indi-cated in the Matches field.
Time Domain Plots
Access these by selecting HRV > Time Domain Plots. If spectral analysis has not yet been run for this patient, a query box appears asking whether to run it. In order to view the time domain plots, spectral analysis must have been run for the patient.
Click Yes to run spectral analysis and then display the requested data; click No to close the window without running spectral analysis or displaying the data.
The time domain plots contain separate trends of these different measurements and calculations over time for each interval:
• SDNN - the standard deviation of the normal-to-normal RR intervals;
• RMS - the root mean square of the dif-ferences between sequential RR inter-vals;
• SDSD - the standard deviation of the differences between sequential RR intervals;
• NN50 - the number of normal-to-nor-mal RR intervals that were more than 50 milliseconds different from the pre-ceding RR interval;
• PNN50 - the percentage of normal-to-normal RR intervals that were more
than 50 milliseconds different from the preceding RR interval;
• MeanRR - the average RR interval within the specified time period; and
• ProcTime - the amount of time (in sec-onds) processed within the interval.
To read specific data from the trends, click on the time-of-day of interest and a blue marker appears. The data fields at the top of the window indicate the specific reading for each calculation at the time-of-day of the blue marker.
To change the number of hours displayed, make your selection from the list of choices in the Hours field. To display the choices, click on the arrow to the right of the field. Click on your choice to select it.
Tables
Three different tables are available for review. Please note that these are accessi-ble using the HRV menu, not the Holter Tables window.
Summary of Time Domain
This tabulates this information for the entire Holter period:
• SDNN - the standard deviation of the normal-to-normal RR intervals;
• SDANN -the standard deviation of the normal-to-normal RR intervals for each 5-minute period of the 24-hour record-ing;
• RMSSD - the root mean square of the differences between sequential RR intervals;
• SDNN index - the mean of the standard deviation of all normal-to-normal RR intervals for all 5-minute segments of a 24-hour recording;
Confirmation query
st Monitoring, Inc. NEMM027-Rev-M Page 72 of 117
HE/LX Analysis Operator’s Manual HRV Analysis: Reviewing HRV data
NorthEa
• SDSD - the standard deviation of the differences between sequential RR intervals;
• NN50 count - the number of normal-to-normal RR intervals that were more than 50 milliseconds different from the preceding RR interval;
• pNN50 - the percentage of normal-to-normal RR intervals that were more than 50 milliseconds different from the preceding RR interval;
• HRV triangular index - an index cal-culated by first determining the density of beats vs. RR intervals (scaled to a sampling rate of 128 per second), then dividing the total number of beats by the peak density.
• TINN - a variation of the triangular index described above.
• Differential index - an index describ-ing the differences between the widths of the histogram of differences between adjacent RR intervals measured at the levels of 1,000 and 10,000 beats.
• Logarithmic index - coefficient of
the negative exponential Ke-t that is the best approximation of the histogram of absolute differences between adja-cent RR intervals.
• Spectrum slope on log-log plot - slope of the linear interpolation of the long-term (24-hour) spectrum in a log-log scale. This is the value of the function (log(f)-that gives the best estima-tion of the function log(P(f)) where P(f) is the power density of the spectrum.
• Ranges values of entire 24 hours - the values defining each frequency range for this patient.
• Interval length - the amount of time (in seconds) included in each interval.
• Number of intervals - the number of intervals included in the 24-hour recording;
• Values per interval - the RR tacho-gram is sampled every (interval length)/(values per interval) seconds to calcu-late the long-term (24-hour or proce-dure length) spectrum.
• Frequency resolution of short-term spectrums - this is the size of the step in frequency used to make all calcula-tions for each interval (100 or 300 sec-onds).
• Frequency resolution of 24-hour spectrum - this is the size of the step in frequency used to make all calculations for the long-term spectrum (24-hour or procedure length).
Time Domain
This reports the time domain information for the included data. The table includes:
• # - the data number;
• Time - the time-of-day of the data;
• SDNN - the standard deviation of the normal-to-normal RR intervals;
• RMS - the root mean square of the dif-ferences between sequential RR inter-vals;
• SDSD - the standard deviation of the differences between sequential RR intervals;
• NN50 - the number of normal-to-nor-mal RR intervals that were more than 50 milliseconds different from the pre-ceding RR interval;
• pNN50 - the percentage of normal-to-normal RR intervals that were more than 50 milliseconds different from the preceding RR interval;
• Mean RR - the average RR interval;
• Proc. Time - the amount of time included;
• # Beats - the total number of beats used for the calculations.
st Monitoring, Inc. NEMM027-Rev-M Page 73 of 117

HE/LX Analysis Operator’s Manual HRV Analysis: HRV Analysis (Additional features found in Pro)
NorthEa
Frequency Domain
This reports the frequency domain infor-mation for the included data. The table includes:
• # - the data number;
• Time - the time-of-day of the data;
• Regular VLF (very low frequency), LF (low frequency), HF (high fre-quency) and Total - the actual calcula-tions made for the data indicated;
• Normalized LF (low frequency) and HF (high frequency) - the relative amount of high versus low frequency data expressed as a percentage of the total.
HRV Analysis (Additional features found in Pro)To perform HRV analysis, the software considers only normal-to-normal RR inter-vals and performs the analysis based on the settings available in Settings > Spectral Analysis.
Spectral Analysis settings
The following settings are available in the Spectral Analysis window:
• Run spectral analysis after analysis completes. This setting determines whether HRV analysis will be done automatically at the end of Holter anal-ysis. A check mark in the check box indicates that the HRV program will run automatically upon completion of Holter analysis. No check mark indi-cates that HRV analysis will not be per-formed automatically. If the HRV analysis has not been done and you ask to review HRV data, the software will
ask whether you want to run it at that time.
• Window type. This field indicates what type of sliding window is used for HRV analysis and what type of window to use. The choices are None (simple slid-ing window), Hamming, Hann, and Tri-angle. Click on the arrow in the field to list the choices and click on your selec-tion.
• Size (secs.). This setting determines whether the sliding window is 100 or 300 seconds long. Click on the arrow in the field to list the choices and click on your selection. A setting of 100 limits the minimum frequency to 0.01 Hz., while 300 limits the minimum fre-quency to 0.0033.
• Take average of logs. As HRV analysis is done, you can choose to have the magnitude of spectral values first con-verted to a log form before averaging. A check mark in the check box indi-cates that the data will be converted; no check mark indicates that the average is performed on the magnitude of the spectral values directly and the log, if any, is taken after the average.
• Number of seconds over which the spectral average is made. The average of the spectrum is a two-dimensional calculation made using a sliding win-dow. The window is the “Size” described above; it moves “Spacing between averages” described below between each spectrum calculation. This setting is the total number of sec-onds the window must move to calcu-late one point in the result. The range allowed is from 0 to 3600. Click on the field and type your entry to change the setting.
• Frequency range used for average. The average is made over this range of
st Monitoring, Inc. NEMM027-Rev-M Page 74 of 117
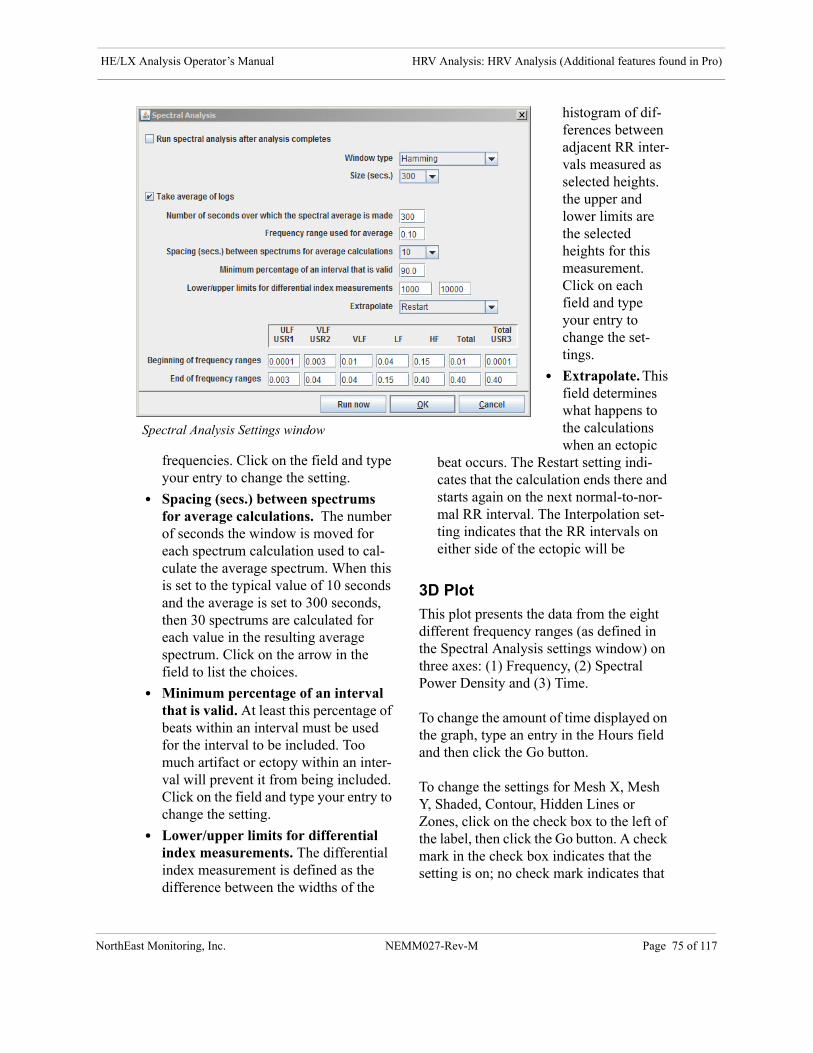
HE/LX Analysis Operator’s Manual HRV Analysis: HRV Analysis (Additional features found in Pro)
NorthEa
frequencies. Click on the field and type your entry to change the setting.
• Spacing (secs.) between spectrums for average calculations. The number of seconds the window is moved for each spectrum calculation used to cal-culate the average spectrum. When this is set to the typical value of 10 seconds and the average is set to 300 seconds, then 30 spectrums are calculated for each value in the resulting average spectrum. Click on the arrow in the field to list the choices.
• Minimum percentage of an interval that is valid. At least this percentage of beats within an interval must be used for the interval to be included. Too much artifact or ectopy within an inter-val will prevent it from being included. Click on the field and type your entry to change the setting.
• Lower/upper limits for differential index measurements. The differential index measurement is defined as the difference between the widths of the
histogram of dif-ferences between adjacent RR inter-vals measured as selected heights. the upper and lower limits are the selected heights for this measurement. Click on each field and type your entry to change the set-tings.
• Extrapolate. This field determines what happens to the calculations when an ectopic
beat occurs. The Restart setting indi-cates that the calculation ends there and starts again on the next normal-to-nor-mal RR interval. The Interpolation set-ting indicates that the RR intervals on either side of the ectopic will be
3D Plot
This plot presents the data from the eight different frequency ranges (as defined in the Spectral Analysis settings window) on three axes: (1) Frequency, (2) Spectral Power Density and (3) Time.
To change the amount of time displayed on the graph, type an entry in the Hours field and then click the Go button.
To change the settings for Mesh X, Mesh Y, Shaded, Contour, Hidden Lines or Zones, click on the check box to the left of the label, then click the Go button. A check mark in the check box indicates that the setting is on; no check mark indicates that
Spectral Analysis Settings window
st Monitoring, Inc. NEMM027-Rev-M Page 75 of 117
HE/LX Analysis Operator’s Manual HRV Analysis: HRV Analysis (Additional features found in Pro)
NorthEa
the setting is off. After you click Go, the graph will redraw using the new settings.
To customize the axes, select Custom from the field above the Go button. This acti-vates the X, Y, and Z fields to the right of it. Type the new orientation for whichever axis you choose and then click the Go but-ton. To return the graph to its original set-tings, click on the arrow and select Default from the list of choices, then click Go.
Circadian Plots
This shows the power level of each fre-quency over time, in both absolute terms (seconds squared) and normalized as a per-centage. The color key for each frequency is indicated at the top of the plot, under-neath the data field of the frequency the color represents.
A check mark to the left of the frequency indicates that the frequency is plotted. No check mark indicates that the frequency is not plotted. To change the setting for a fre-quency, click on the check box.
To read specific data from the plot, click on the time-of-day of interest and a blue marker appears. The data fields at the top of the plot now indicate the specific read-ing for each plotted frequency at the time-of-day of the blue marker.
To change the number of hours displayed, make your selection from the list of choices in the Hours field. To display the choices, click on the arrow to the right of the field. Click on your choice to select it.
• merged and the location of a normal beat interpolated from the surrounding RR intervals.
• Beginning/End of frequency ranges. Each of the frequency ranges indicated are used to calculate the total energy in
the indicated portion of the spectrum. This is used for all spectrum calcula-tions. The calculated energy in each range is calculated every 5 minutes. The results appear in the Circadian Plots. Note that some columns such as the ULF may have no valid spectral values for a 5-minute spectrum if the default values are used. If alternate val-ues are supplied, the resulting trend could be valid. These values are also used in the same manner to calculate the range values in the spectrum sum-mary.
The frequency ranges are abbreviated:
• ULF USR1 stands for ultra low fre-quency, with the range defined by the user;
• VLF USR2 stands for very low fre-quency, with the range defined by the user;
• VLF stands for very low frequency;
• LF stands for low frequency;
• HF stands for high frequency;
• Total stands for the total; and
• Total USR3 stands for the total, with the range defined by the user.
24 Hour Plot
This plots power (milliseconds squared) versus frequency (Hz), showing the delin-eation of each frequency range. It can be presented on either a linear or a log scale.
st Monitoring, Inc. NEMM027-Rev-M Page 76 of 117
HE/LX Analysis Operator’s Manual HRV Analysis: Printing HRV data
NorthEa
Printing HRV data
Report modules
• Frequency Domain Table. (Pro) This lists the very low, low, and high fre-quency data for each interval. Each fre-quency is reported as a percentage, for a total of 1.0 for each type of frequency.
• Normalized Frequency Domain. (Pro) This lists the low (LF) and high frequency (HF) data normalized by dividing each by the total for that fre-quency.
• Time Domain Table. For each interval, this lists the total number of normal beats along with heart rate variability calculations, including the standard deviation of normal-normal intervals (SDNN), the root mean square of the standard deviation (RMSSD), the stan-dard deviation of the standard devia-tions (SDSD), the number of normal-normal intervals that were greater than 50 milliseconds different from the pre-ceding normal-normal interval (NN50), the percentage of normal-normal inter-vals that were greater than 50 millisec-onds different from the preceding normal-normal interval (PNN50), the average normal-normal interval (RR Mean), and the time included in the interval.
• HRV Time Summary. This prints a summary of the time domain calcula-tions, as described for the “Time Domain Table” above, plus the maxi-mum standard deviation of normal-nor-mal intervals (Max SDNN), the SDANN, the SDNN index, the HRV tri-angular index, the Differential index and the Logarithmic index. In addition, the time domain data is plotted across the Holter period, along with two histo-grams, one showing the RR interval
distribution of normal beats and the other showing the RR interval distribu-tion of all beats.
To include a module in the report, the check box next to the module name in the Reports window must contain a check mark. Click on an empty box to add a check mark, and click on a check mark to remove it. To turn all of the modules on or off, click on the All On/Off check box under the report module list; to change them all again, click on the All On/Off check box again.
st Monitoring, Inc. NEMM027-Rev-M Page 77 of 117
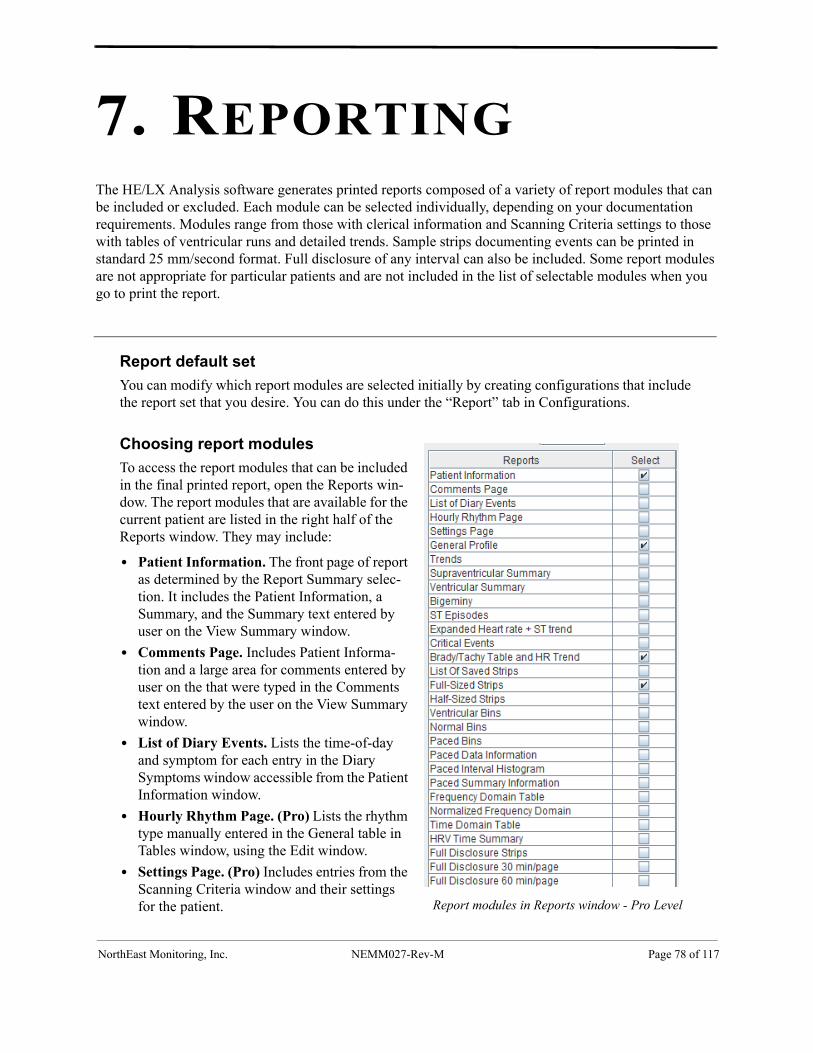
7. REPORTING The HE/LX Analysis software generates printed reports composed of a variety of report modules that can be included or excluded. Each module can be selected individually, depending on your documentation requirements. Modules range from those with clerical information and Scanning Criteria settings to those with tables of ventricular runs and detailed trends. Sample strips documenting events can be printed in standard 25 mm/second format. Full disclosure of any interval can also be included. Some report modules are not appropriate for particular patients and are not included in the list of selectable modules when you go to print the report.
No
Report default set
You can modify which report modules are selected initially by creating configurations that include the report set that you desire. You can do this under the “Report” tab in Configurations.
Choosing report modules
To access the report modules that can be included in the final printed report, open the Reports win-dow. The report modules that are available for the current patient are listed in the right half of the Reports window. They may include:
• Patient Information. The front page of report as determined by the Report Summary selec-tion. It includes the Patient Information, a Summary, and the Summary text entered by user on the View Summary window.
• Comments Page. Includes Patient Informa-tion and a large area for comments entered by user on the that were typed in the Comments text entered by the user on the View Summary window.
• List of Diary Events. Lists the time-of-day and symptom for each entry in the Diary Symptoms window accessible from the Patient Information window.
• Hourly Rhythm Page. (Pro) Lists the rhythm type manually entered in the General table in Tables window, using the Edit window.
• Settings Page. (Pro) Includes entries from the Scanning Criteria window and their settings for the patient. Report modules in Reports window - Pro Level
rthEast Monitoring, Inc. NEMM027-Rev-M Page 78 of 117

HE/LX Analysis Operator’s Manual Reporting:
NorthEa
• General Profile. An overview of the patient’s Holter data. The table includes interval data: the time-of-day at the start of the interval; the low, mean and high heart rates within the interval; the total number of beats; the total number of VPBs, VPB pairs, runs of VTAC, SVPBs, SVPB pairs, runs of SVT, and pauses; and the amount of time ana-lyzed in the interval.
• Trends. Include minute-by-minute heart rate, VPBs, VTAC beats, SVPBs, and SVT beats.
• Supraventricular / AF Summary. (Pro) Tabulates the patient’s supraven-tricular ectopy, including SVPB totals, singles, pairs, and runs for each inter-val. Also displays a detailed summary of supraventricular run information, described by run length and by the heart rate during the run. AF beats, events and time also included when it exists.
• Ventricular Summary. (Pro) Tabu-lates the patient’s ventricular ectopy, including VPB totals, singles, pairs, and runs for each interval. In addition, it displays a detailed summary of ventric-ular run information, described by run length and by the heart rate during the run.
• Bigeminy. (Pro) An interval table that lists the number of runs of bigeminy by length (in beats).
• ST Episodes. List describing the detected ST segment events during the Holter test, along with a trend of the ST segment measurements for each of the three channels and the marker locations that were used for ST segment analysis. Each description includes:
1. Ch - the channel in which the event occurred;
2. Onset - the time-of-day the event started;
3. End - the time-of-day the event ended;
4. Duration - the duration of the event in HH:MM:SS;
5. Max HR - the maximum heart rate during the event;
6. Time - the time-of-day of the maxi-mum ST change during the event;
7. HR - the heart rate at the time-of-day of the maximum ST change during the event;
8. mm from baseline - the maximum change (in millimeters) from baseline during the event;
9. mm from iso-electric - the maximum change (in millimeters) from iso-elec-tric during the event;
10. Slope - the slope of the ST segment during the event; and
11. Integral - the integral (considered to be the area between the curves) between the ST segment trend and the patient’s baseline trend during the event.
• Expanded Heart rate + ST trend. (Pro) Presents 8 hours of minute heart rates and 30-second ST data (for each channel) per page.
• Critical Events. (Pro) A bar graph that includes interval data and a representa-tive example for each of these signifi-cant types of event: VPBs, VPB pairs, VTAC, SVPBs, SVPB pairs, SVT and pauses.
• Brady/Tachy Table and HR Trend. (Pro) An interval table that lists the number of beats of bradycardia that occurred and the time spent in brady-cardia, along with the number of beats of tachycardia that occurred and the time spent in tachycardia. Below the table is a 48-hour heart-rate trend.
• List of Saved Strips. Lists the strips that are in the printed report, including the time-of-day, strip label, heart rate and heart rate of an event of VTAC or SVT, if appropriate, for each strip.
st Monitoring, Inc. NEMM027-Rev-M Page 79 of 117
HE/LX Analysis Operator’s Manual Reporting:
NorthEa
• Full-Size Strips. Presents the saved strips in a 25 mm/second format, with three strips per page.
• Half-Size Strips. Presents up to 14 strips per page in a non-standard for-mat.
• 12-lead Trend Graphs. (Pro) Consists of 6 trends, called 12-lead data graphs, for 12-lead data, which includes QTd, QTc, QT, PR, QRS, and RR intervals. The intervals between 12-lead data samples is based on the DR180 Series recorder setting when the Holter test was performed.
Note: See Chapter 5: 12-Lead Presenta-tions for more detailed information about the 12-lead report modules. 12-lead data is available on DR180 Series only.
• 12-lead Tables. (Pro) Table that reports the numeric data for each 12-lead sam-ple throughout the monitored period. Reported data includes RR, cal RR, QT, cal QT, QTc and QTd.
• 12-lead Strips 25 mm/sec. Prints a 25 mm/second 6-by-2 12-lead presenta-tion, along with the 12-lead data, for all manually saved 12-lead strips.
• 12-lead Strips 50 mm/sec. Prints a 50 mm/second 12-lead presentation, along with the 12-lead data, for all manually saved 12-lead strips.
• Ventricular Bins. (Enh+ and Pro) A bar histogram of the distribution of each ventricular template across the Holter period, along with the first example of each template.
• Normal Bins.(Enh+ and Pro) A bar histogram of the distribution of each normal template across the Holter period, along with the first example of each template.
• Paced Bins. (Enh+ and Pro) A bar his-togram of the distribution of each paced
template across the Holter period, along with the first example of each template.
• Paced Data Information. An interval table that describes the pacemaker activity during the Holter period. This includes the total number of paced beats, the percentage of paced beats, the number of beats that were atrial-paced only, the number that were ventricular-paced only, and the number that were paced in both the atrium and the ventri-cle, along with capture failures, sense failures, and inappropriate inhibition.
• Paced Interval Histogram. (Pro) This includes four histograms plotting the number of beats versus the RR interval following the current beat. The four include total paced beats, sense failures, capture failures, and inappropriate inhi-bition. This module also includes a heart rate trend for the Holter period, and the definitions of the LX software’s pacemaker labels.
• Paced Summary Information. (Pro) This interval table details the number of paced beats and percentages for all paced beats, atrial-paced only, ventricu-lar-paced only and dual-chambered paced beats. The information also includes the pacemaker settings used during analysis, as defined in the Scan-ning Criteria window.
• Frequency Domain Table. *(Pro) This lists the very low, low, and high fre-quency data for each interval. Each fre-quency is reported as a percentage, for a total of 1.0 for each type of frequency.
• Normalized Frequency Domain. (Pro) This lists the low (LF) and high frequency (HF) data normalized by dividing each by the total for that fre-quency.
• Time Domain Table.* For each inter-val, this lists the total number of normal beats along with heart rate variability calculations, including the standard
st Monitoring, Inc. NEMM027-Rev-M Page 80 of 117
HE/LX Analysis Operator’s Manual Reporting:
NorthEa
deviation of normal-normal intervals (SDNN), the root mean square of the standard deviation (RMSSD), the stan-dard deviation of the standard devia-tions (SDSD), the number of normal-normal intervals that were greater than 50 milliseconds different from the pre-ceding normal-normal interval (NN50), the percentage of normal-normal inter-vals that were greater than 50 millisec-onds different from the preceding normal-normal interval (PNN50), the average normal-normal interval (RR Mean), and the time included in the interval.
*Note: The Summary/Overall line at the bottom of these reports is calcu-lated for the entire analysis period. Since some of the columns represent non-linear calculations, such as standard deviations, there is no linear operation (like average, min, max or median) one can do on the column to produce the value in the summary/overall line. For example, for the SDNN column, the value in the summary line will be calculated for the entire recording, and in general, will not be a simple average of the values calculated at each interval in the table above.
• HRV Time Summary. This prints a summary of the time domain calcula-tions, as described for the “Time Domain Table” above, plus the maxi-mum standard deviation of normal-nor-mal intervals (Max SDNN), the SDANN, the SDNN index, the HRV tri-angular index, the Differential index and the Logarithmic index. In addition, the time domain data is plotted across the Holter period, along with two histo-grams, one showing the RR interval distribution of normal beats and the
other showing the RR interval distribu-tion of all beats.
• Full Disclosure Strips. This report will create a page for each manually saved strip. Each page will include a full-sized strip at the top with 6 minutes of full disclosure below.
• Oxy trend 24 hours (optional, Oxy-Holter only). This prints a compressed trend of oximetry and heart rate data, with 24 hours across one page. Also includes the apnea trend, the apnea regions, the AHI, and a respiration printout where Oxy data exists. If you are not seeing this information, you may need to rerun the Apnea Analysis again before creating the report.
• Oxy trend 2 hours (optional, Oxy-Holter only). This prints an expanded trend of oximetry and heart rate data, with 2 hours across each page.
• Oxy and heart rate summary (optional, OxyHolter only). This table presents the minimum, maximum and mean SpO2 and heart rate values for the monitored period.
• Oxy values and Full Disclosure (optional, OxyHolter only). This prints two-channel full disclosure of the ECG annotated with SpO2 values.
• Oxy trend and Full Disclosure (optional, OxyHolter only). This prints full disclosure of the ECG, along with a trend of the SpO2 data at that time.
• Respiration - Full Disclosure (For Apnea Patients only)
• Airflow - Full Disclosure (For patients with airflow sensors only.)
To include a module in the report, the check box next to the module name in the Reports window must contain a check mark. Click on an empty box to add a check mark, and click on a check mark to
st Monitoring, Inc. NEMM027-Rev-M Page 81 of 117
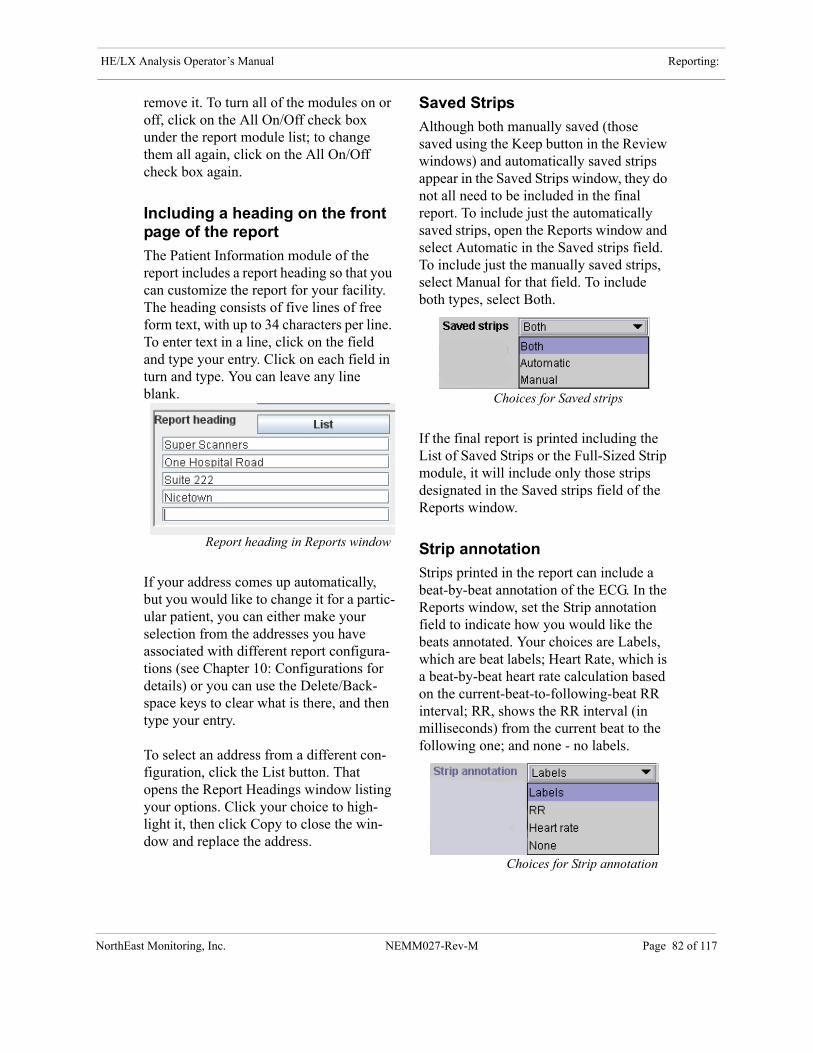
HE/LX Analysis Operator’s Manual Reporting:
NorthEa
remove it. To turn all of the modules on or off, click on the All On/Off check box under the report module list; to change them all again, click on the All On/Off check box again.
Including a heading on the front page of the report
The Patient Information module of the report includes a report heading so that you can customize the report for your facility. The heading consists of five lines of free form text, with up to 34 characters per line. To enter text in a line, click on the field and type your entry. Click on each field in turn and type. You can leave any line blank.
If your address comes up automatically, but you would like to change it for a partic-ular patient, you can either make your selection from the addresses you have associated with different report configura-tions (see Chapter 10: Configurations for details) or you can use the Delete/Back-space keys to clear what is there, and then type your entry.
To select an address from a different con-figuration, click the List button. That opens the Report Headings window listing your options. Click your choice to high-light it, then click Copy to close the win-dow and replace the address.
Saved Strips
Although both manually saved (those saved using the Keep button in the Review windows) and automatically saved strips appear in the Saved Strips window, they do not all need to be included in the final report. To include just the automatically saved strips, open the Reports window and select Automatic in the Saved strips field. To include just the manually saved strips, select Manual for that field. To include both types, select Both.
If the final report is printed including the List of Saved Strips or the Full-Sized Strip module, it will include only those strips designated in the Saved strips field of the Reports window.
Strip annotation
Strips printed in the report can include a beat-by-beat annotation of the ECG. In the Reports window, set the Strip annotation field to indicate how you would like the beats annotated. Your choices are Labels, which are beat labels; Heart Rate, which is a beat-by-beat heart rate calculation based on the current-beat-to-following-beat RR interval; RR, shows the RR interval (in milliseconds) from the current beat to the following one; and none - no labels.
Report heading in Reports window
Choices for Saved strips
Choices for Strip annotation
st Monitoring, Inc. NEMM027-Rev-M Page 82 of 117

HE/LX Analysis Operator’s Manual Reporting:
NorthEa
The beat labels consist of:
• N for normal
• S for SVPB
• V for VPB
• A for artifact
• P for paced (A, V, or AV)
• F for AF
• D for event marker
• ? for questionable/unknown
Reports in Color
ECG, logos and some trends will print in color if you choose to do so. Turn on/off color by going to the Preferences screen and click on “Print in color”. Additionally, the “Faxable Report” option in Preferences will suppress the gray backgrounds, and make your report more suitable for faxing.
Report summary
The summary that prints on the front page of the report can take one of several for-mats, based upon the type of patient you have. For example, The 6-Min Walk Assess report is only available for 6MWA patients, and only apnea patients will be able to select an AHI/OSA report. In the Reports window, select the summary style that you would like to use for the printed report for this patient. Report summaries include 6-Min Walk Assess(ment), AHI/
OSA Report for Sleep, Oximetry, Numeric, Verbal, Concise and Narrative.
To view and/or edit the summary on-screen before printing the report, make your selection in the Report summary field and then click the View summary button in the bottom of the Reports window; this opens the appropriate Report Summary window.
Editing the Report summary
The View Summary window displays the front page as it will appear on the bottom of the first page of the report. Every char-acter can be edited, if you choose to do so. You can select the text and then delete it or type over it, or you can simply add to the information that is already there.
To add com-ments to the end of the summary, click after Comments: and then either type the comment or select a line from the Phrases win-
dow in the left portion of the window; after selecting the phrase, click Add to copy it
All available Report summary choices
Summary phrases
st Monitoring, Inc. NEMM027-Rev-M Page 83 of 117
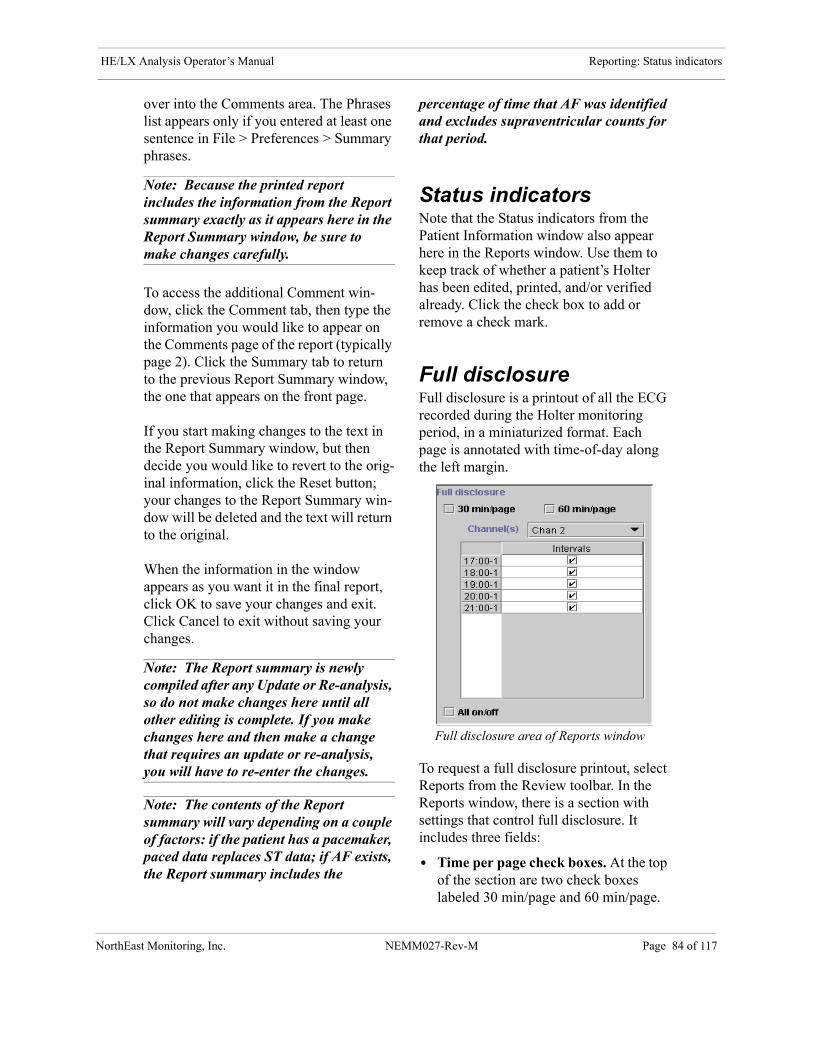
HE/LX Analysis Operator’s Manual Reporting: Status indicators
NorthEa
over into the Comments area. The Phrases list appears only if you entered at least one sentence in File > Preferences > Summary phrases.
Note: Because the printed report includes the information from the Report summary exactly as it appears here in the Report Summary window, be sure to make changes carefully.
To access the additional Comment win-dow, click the Comment tab, then type the information you would like to appear on the Comments page of the report (typically page 2). Click the Summary tab to return to the previous Report Summary window, the one that appears on the front page.
If you start making changes to the text in the Report Summary window, but then decide you would like to revert to the orig-inal information, click the Reset button; your changes to the Report Summary win-dow will be deleted and the text will return to the original.
When the information in the window appears as you want it in the final report, click OK to save your changes and exit. Click Cancel to exit without saving your changes.
Note: The Report summary is newly compiled after any Update or Re-analysis, so do not make changes here until all other editing is complete. If you make changes here and then make a change that requires an update or re-analysis, you will have to re-enter the changes.
Note: The contents of the Report summary will vary depending on a couple of factors: if the patient has a pacemaker, paced data replaces ST data; if AF exists, the Report summary includes the
percentage of time that AF was identified and excludes supraventricular counts for that period.
Status indicatorsNote that the Status indicators from the Patient Information window also appear here in the Reports window. Use them to keep track of whether a patient’s Holter has been edited, printed, and/or verified already. Click the check box to add or remove a check mark.
Full disclosureFull disclosure is a printout of all the ECG recorded during the Holter monitoring period, in a miniaturized format. Each page is annotated with time-of-day along the left margin.
To request a full disclosure printout, select Reports from the Review toolbar. In the Reports window, there is a section with settings that control full disclosure. It includes three fields:
• Time per page check boxes. At the top of the section are two check boxes labeled 30 min/page and 60 min/page.
Full disclosure area of Reports window
st Monitoring, Inc. NEMM027-Rev-M Page 84 of 117
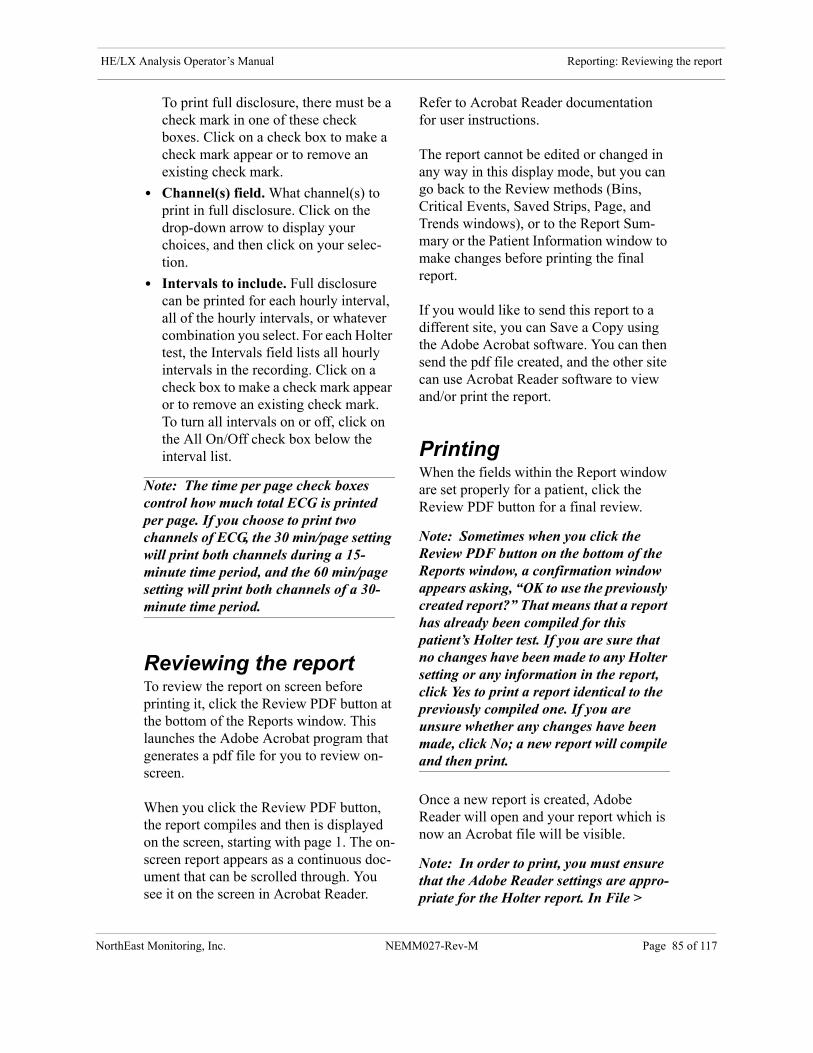
HE/LX Analysis Operator’s Manual Reporting: Reviewing the report
NorthEa
To print full disclosure, there must be a check mark in one of these check boxes. Click on a check box to make a check mark appear or to remove an existing check mark.
• Channel(s) field. What channel(s) to print in full disclosure. Click on the drop-down arrow to display your choices, and then click on your selec-tion.
• Intervals to include. Full disclosure can be printed for each hourly interval, all of the hourly intervals, or whatever combination you select. For each Holter test, the Intervals field lists all hourly intervals in the recording. Click on a check box to make a check mark appear or to remove an existing check mark. To turn all intervals on or off, click on the All On/Off check box below the interval list.
Note: The time per page check boxes control how much total ECG is printed per page. If you choose to print two channels of ECG, the 30 min/page setting will print both channels during a 15-minute time period, and the 60 min/page setting will print both channels of a 30-minute time period.
Reviewing the reportTo review the report on screen before printing it, click the Review PDF button at the bottom of the Reports window. This launches the Adobe Acrobat program that generates a pdf file for you to review on-screen.
When you click the Review PDF button, the report compiles and then is displayed on the screen, starting with page 1. The on-screen report appears as a continuous doc-ument that can be scrolled through. You see it on the screen in Acrobat Reader.
Refer to Acrobat Reader documentation for user instructions.
The report cannot be edited or changed in any way in this display mode, but you can go back to the Review methods (Bins, Critical Events, Saved Strips, Page, and Trends windows), or to the Report Sum-mary or the Patient Information window to make changes before printing the final report.
If you would like to send this report to a different site, you can Save a Copy using the Adobe Acrobat software. You can then send the pdf file created, and the other site can use Acrobat Reader software to view and/or print the report.
PrintingWhen the fields within the Report window are set properly for a patient, click the Review PDF button for a final review.
Note: Sometimes when you click the Review PDF button on the bottom of the Reports window, a confirmation window appears asking, “OK to use the previously created report?” That means that a report has already been compiled for this patient’s Holter test. If you are sure that no changes have been made to any Holter setting or any information in the report, click Yes to print a report identical to the previously compiled one. If you are unsure whether any changes have been made, click No; a new report will compile and then print.
Once a new report is created, Adobe Reader will open and your report which is now an Acrobat file will be visible.
Note: In order to print, you must ensure that the Adobe Reader settings are appro-priate for the Holter report. In File >
st Monitoring, Inc. NEMM027-Rev-M Page 85 of 117
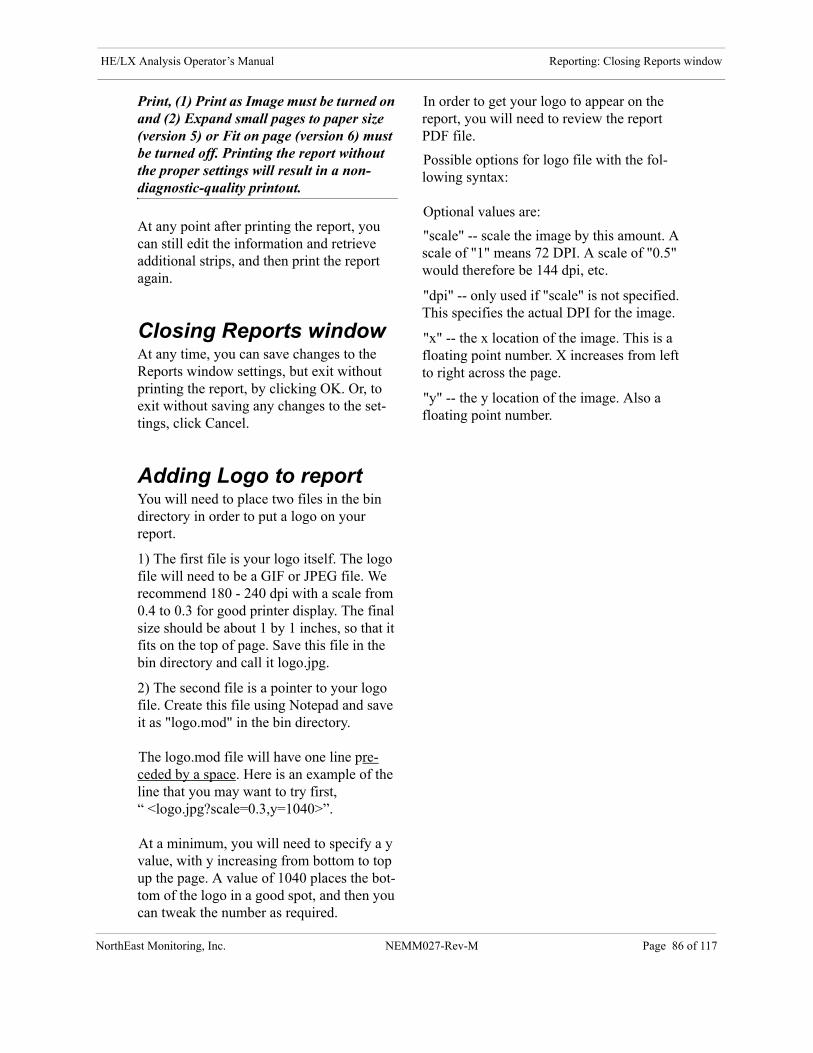
HE/LX Analysis Operator’s Manual Reporting: Closing Reports window
NorthE
Print, (1) Print as Image must be turned on and (2) Expand small pages to paper size (version 5) or Fit on page (version 6) must be turned off. Printing the report without the proper settings will result in a non-diagnostic-quality printout.
At any point after printing the report, you can still edit the information and retrieve additional strips, and then print the report again.
Closing Reports windowAt any time, you can save changes to the Reports window settings, but exit without printing the report, by clicking OK. Or, to exit without saving any changes to the set-tings, click Cancel.
Adding Logo to reportYou will need to place two files in the bin directory in order to put a logo on your report.
1) The first file is your logo itself. The logo file will need to be a GIF or JPEG file. We recommend 180 - 240 dpi with a scale from 0.4 to 0.3 for good printer display. The final size should be about 1 by 1 inches, so that it fits on the top of page. Save this file in the bin directory and call it logo.jpg.
2) The second file is a pointer to your logo file. Create this file using Notepad and save it as "logo.mod" in the bin directory.
The logo.mod file will have one line pre-ceded by a space. Here is an example of the line that you may want to try first,“ <logo.jpg?scale=0.3,y=1040>”.
At a minimum, you will need to specify a y value, with y increasing from bottom to top up the page. A value of 1040 places the bot-tom of the logo in a good spot, and then you can tweak the number as required.
In order to get your logo to appear on the report, you will need to review the report PDF file.
Possible options for logo file with the fol-lowing syntax:
Optional values are:
"scale" -- scale the image by this amount. A scale of "1" means 72 DPI. A scale of "0.5" would therefore be 144 dpi, etc.
"dpi" -- only used if "scale" is not specified. This specifies the actual DPI for the image.
"x" -- the x location of the image. This is a floating point number. X increases from left to right across the page.
"y" -- the y location of the image. Also a floating point number.
ast Monitoring, Inc. NEMM027-Rev-M Page 86 of 117
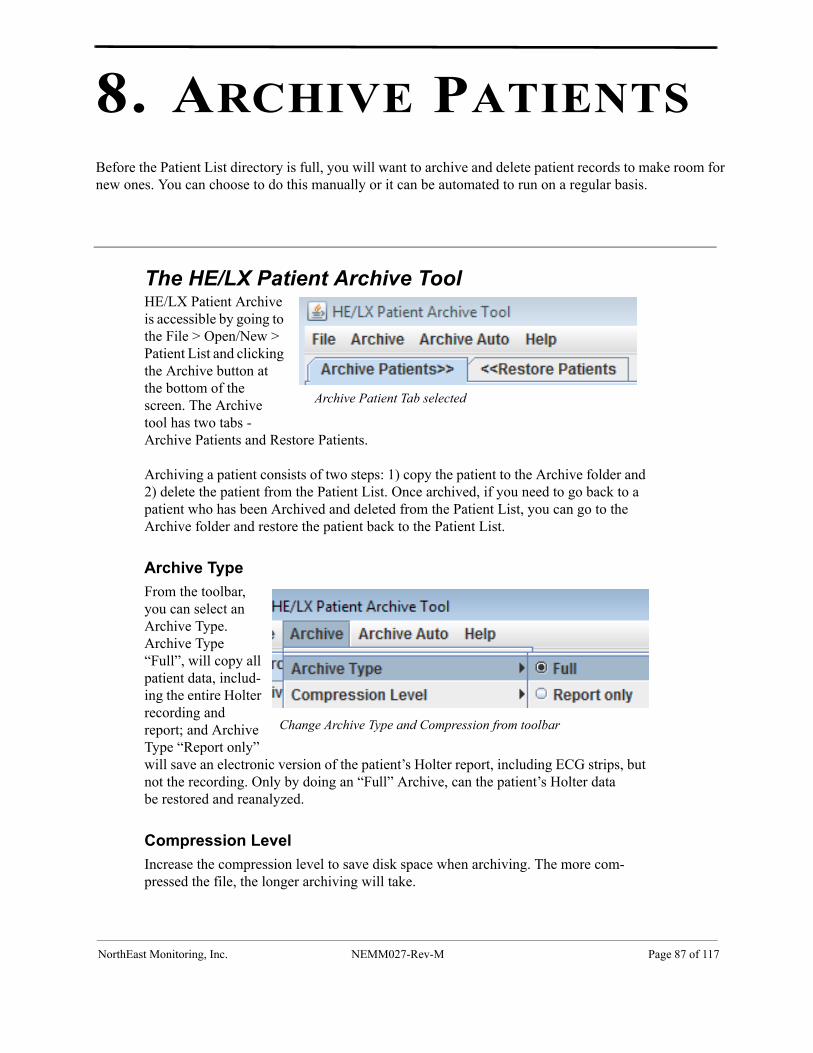
8. ARCHIVE PATIENTS
Before the Patient List directory is full, you will want to archive and delete patient records to make room for new ones. You can choose to do this manually or it can be automated to run on a regular basis.
NorthE
The HE/LX Patient Archive ToolHE/LX Patient Archive is accessible by going to the File > Open/New > Patient List and clicking the Archive button at the bottom of the screen. The Archive tool has two tabs -Archive Patients and Restore Patients.
Archiving a patient consists of two steps: 1) copy the patient to the Archive folder and 2) delete the patient from the Patient List. Once archived, if you need to go back to a patient who has been Archived and deleted from the Patient List, you can go to the Archive folder and restore the patient back to the Patient List.
Archive Type
From the toolbar, you can select an Archive Type. Archive Type “Full”, will copy all patient data, includ-ing the entire Holter recording and report; and Archive Type “Report only” will save an electronic version of the patient’s Holter report, including ECG strips, but not the recording. Only by doing an “Full” Archive, can the patient’s Holter data be restored and reanalyzed.
Compression Level
Increase the compression level to save disk space when archiving. The more com-pressed the file, the longer archiving will take.
Archive Patient Tab selected
Change Archive Type and Compression from toolbar
ast Monitoring, Inc. NEMM027-Rev-M Page 87 of 117

HE/LX Analysis Operator’s Manual Archive Patients: Archive Patients Tab
North
Archive P
Archive Patients TabThe HE/LX Patient Archive Tool will ini-tially open with the “Archive Patients” tab selected. Once opened, all patients who can be archived will be highlighted in blue. A patient is highlighted in blue when:
1. They have been analyzed2. They have a report3. They have never been archived previ-
ously, or their information has been updated since they were last archived.
If you want to override the highlighted patients, you can hold the Shift-key and click on any directory in order to manually select or deselect it. When finished, click the “Archived Selected Patients” button at the bottom of the screen and the selected patients will be copied to the Archive folder.
Note: If a Patient is opened and viewed, but not updated, the system will perceive this patient as being updated and show that the patient needs to be archived again. To ensure that this does not become a problem for you, be sure to wait to archive a patient until you are sure that they will most likely not be viewed or reviewed again.
Delete Patient Records
Once archived, you will want to delete the patients from the Patient List in order to make room for new patients. The Archived check box, labeled “A” on the Patient List, will show you which patients have been archived and can be deleted at this time.
Customizing Screens
Just like the primary Patient List, you can cus-tomize any of the archive lists
by changing, moving and resizing columns. Select columns by right-clicking on any of the column headings and then on “Update Columns.” You can also search on each list by typing into the Search box at top of the screen.
atient Window
East Monitoring, Inc. NEMM027-Rev-M Page 88 of 117
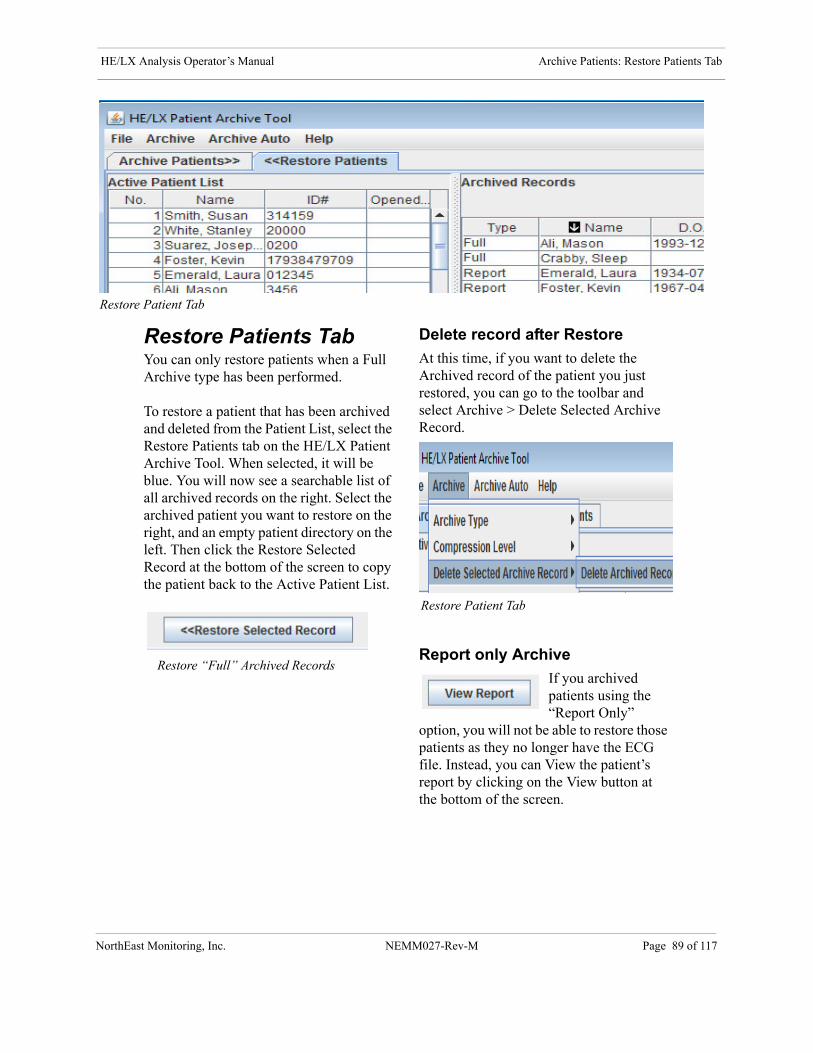
HE/LX Analysis Operator’s Manual Archive Patients: Restore Patients Tab
NorthEa
Restor
Restore Patients TabYou can only restore patients when a Full Archive type has been performed.
To restore a patient that has been archived and deleted from the Patient List, select the Restore Patients tab on the HE/LX Patient Archive Tool. When selected, it will be blue. You will now see a searchable list of all archived records on the right. Select the archived patient you want to restore on the right, and an empty patient directory on the left. Then click the Restore Selected Record at the bottom of the screen to copy the patient back to the Active Patient List.
Delete record after Restore
At this time, if you want to delete the Archived record of the patient you just restored, you can go to the toolbar and select Archive > Delete Selected Archive Record.
Report only Archive
If you archived patients using the “Report Only”
option, you will not be able to restore those patients as they no longer have the ECG file. Instead, you can View the patient’s report by clicking on the View button at the bottom of the screen.
Restore “Full” Archived Records
Restore Patient Tab
e Patient Tab
st Monitoring, Inc. NEMM027-Rev-M Page 89 of 117
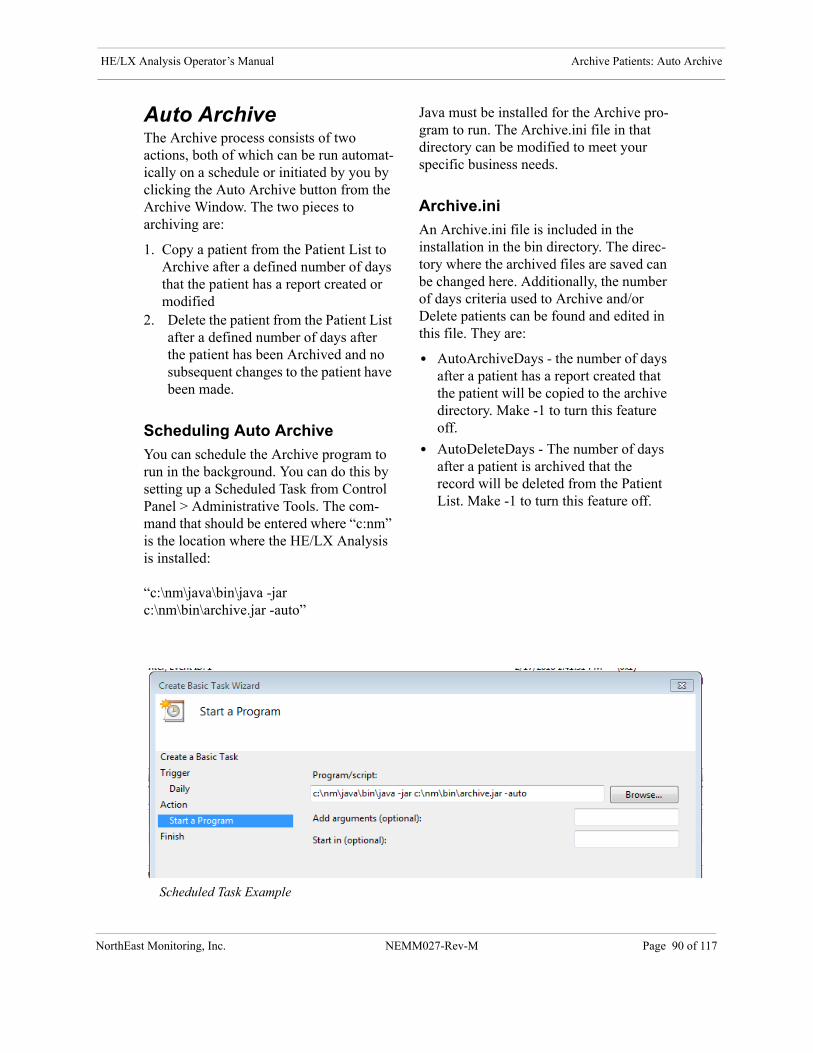
HE/LX Analysis Operator’s Manual Archive Patients: Auto Archive
NorthEa
Auto ArchiveThe Archive process consists of two actions, both of which can be run automat-ically on a schedule or initiated by you by clicking the Auto Archive button from the Archive Window. The two pieces to archiving are:
1. Copy a patient from the Patient List to Archive after a defined number of days that the patient has a report created or modified
2. Delete the patient from the Patient List after a defined number of days after the patient has been Archived and no subsequent changes to the patient have been made.
Scheduling Auto Archive
You can schedule the Archive program to run in the background. You can do this by setting up a Scheduled Task from Control Panel > Administrative Tools. The com-mand that should be entered where “c:nm” is the location where the HE/LX Analysis is installed:
“c:\nm\java\bin\java -jar c:\nm\bin\archive.jar -auto”
Java must be installed for the Archive pro-gram to run. The Archive.ini file in that directory can be modified to meet your specific business needs.
Archive.ini
An Archive.ini file is included in the installation in the bin directory. The direc-tory where the archived files are saved can be changed here. Additionally, the number of days criteria used to Archive and/or Delete patients can be found and edited in this file. They are:
• AutoArchiveDays - the number of days after a patient has a report created that the patient will be copied to the archive directory. Make -1 to turn this feature off.
• AutoDeleteDays - The number of days after a patient is archived that the record will be deleted from the Patient List. Make -1 to turn this feature off.
Scheduled Task Example
st Monitoring, Inc. NEMM027-Rev-M Page 90 of 117
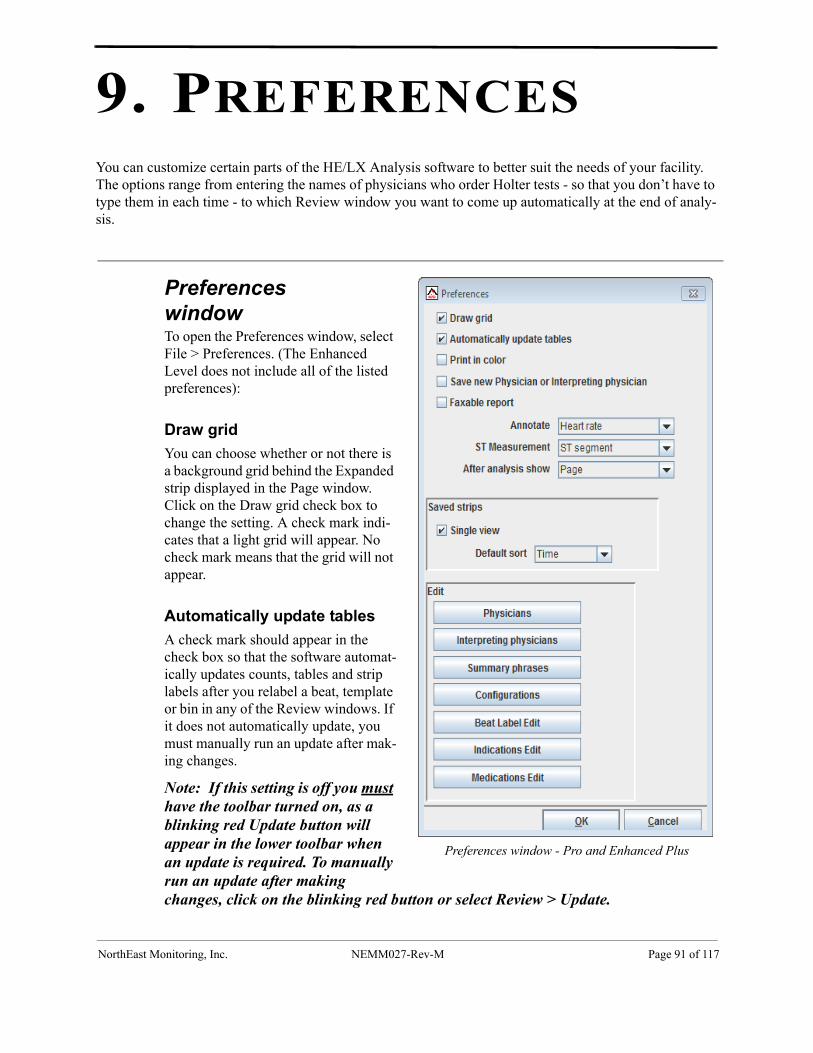
9. PREFERENCESYou can customize certain parts of the HE/LX Analysis software to better suit the needs of your facility. The options range from entering the names of physicians who order Holter tests - so that you don’t have to type them in each time - to which Review window you want to come up automatically at the end of analy-sis.
NorthEast M
lus
Preferences windowTo open the Preferences window, select File > Preferences. (The Enhanced Level does not include all of the listed preferences):
Draw grid
You can choose whether or not there is a background grid behind the Expanded strip displayed in the Page window. Click on the Draw grid check box to change the setting. A check mark indi-cates that a light grid will appear. No check mark means that the grid will not appear.
Automatically update tables
A check mark should appear in the check box so that the software automat-ically updates counts, tables and strip labels after you relabel a beat, template or bin in any of the Review windows. If it does not automatically update, you must manually run an update after mak-ing changes.
Note: If this setting is off you must have the toolbar turned on, as a blinking red Update button will appear in the lower toolbar when an update is required. To manually run an update after making changes, click on the blinking red button or select Review > Update.
Preferences window - Pro and Enhanced P
onitoring, Inc. NEMM027-Rev-M Page 91 of 117
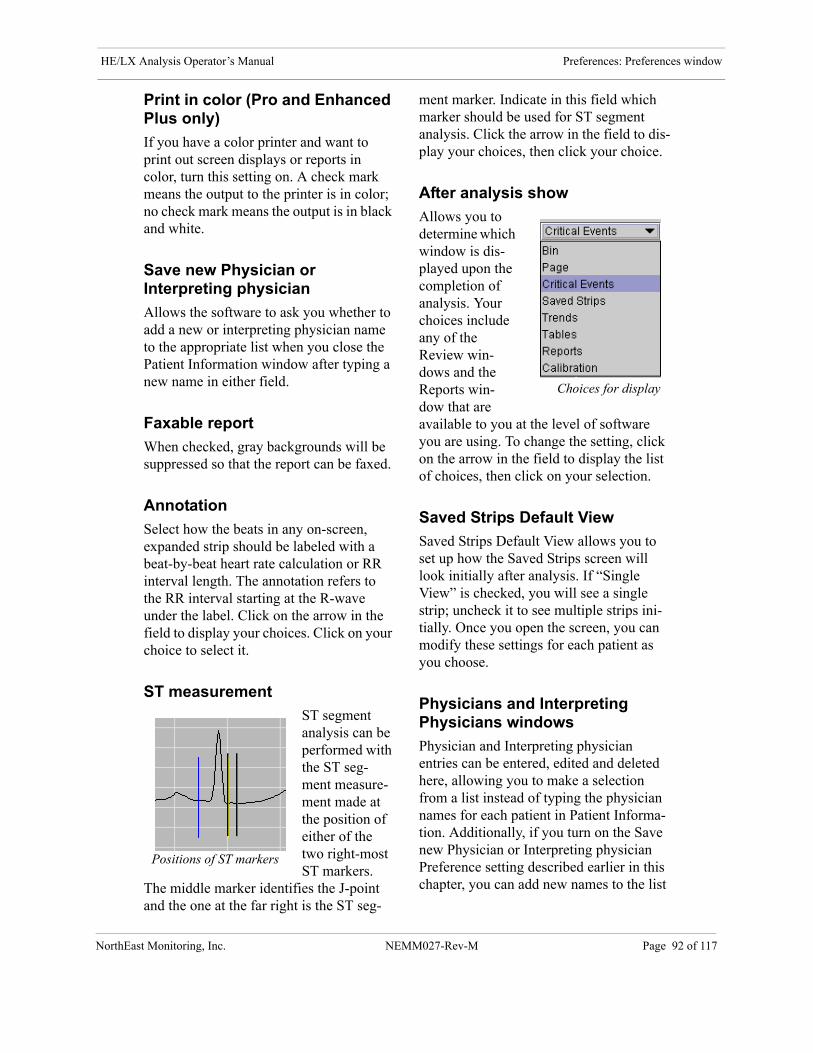
HE/LX Analysis Operator’s Manual Preferences: Preferences window
NorthEa
Print in color (Pro and Enhanced Plus only)
If you have a color printer and want to print out screen displays or reports in color, turn this setting on. A check mark means the output to the printer is in color; no check mark means the output is in black and white.
Save new Physician or Interpreting physician
Allows the software to ask you whether to add a new or interpreting physician name to the appropriate list when you close the Patient Information window after typing a new name in either field.
Faxable report
When checked, gray backgrounds will be suppressed so that the report can be faxed.
Annotation
Select how the beats in any on-screen, expanded strip should be labeled with a beat-by-beat heart rate calculation or RR interval length. The annotation refers to the RR interval starting at the R-wave under the label. Click on the arrow in the field to display your choices. Click on your choice to select it.
ST measurement
ST segment analysis can be performed with the ST seg-ment measure-ment made at the position of either of the two right-most ST markers.
The middle marker identifies the J-point and the one at the far right is the ST seg-
ment marker. Indicate in this field which marker should be used for ST segment analysis. Click the arrow in the field to dis-play your choices, then click your choice.
After analysis show
Allows you to determine which window is dis-played upon the completion of analysis. Your choices include any of the Review win-dows and the Reports win-dow that are available to you at the level of software you are using. To change the setting, click on the arrow in the field to display the list of choices, then click on your selection.
Saved Strips Default View
Saved Strips Default View allows you to set up how the Saved Strips screen will look initially after analysis. If “Single View” is checked, you will see a single strip; uncheck it to see multiple strips ini-tially. Once you open the screen, you can modify these settings for each patient as you choose.
Physicians and Interpreting Physicians windows
Physician and Interpreting physician entries can be entered, edited and deleted here, allowing you to make a selection from a list instead of typing the physician names for each patient in Patient Informa-tion. Additionally, if you turn on the Save new Physician or Interpreting physician Preference setting described earlier in this chapter, you can add new names to the list
Positions of ST markers
Choices for display
st Monitoring, Inc. NEMM027-Rev-M Page 92 of 117
HE/LX Analysis Operator’s Manual Preferences: Preferences window
NorthEa
automatically when entering new physi-cians in the Patient Information window.
To create an entry, click on the “Add new item” button, go to the new line and enter the item. Hit the Enter button on the key-board to save and add more if you like.
To exit without saving changes, click Can-cel. To edit just click on a line and then update, and to delete an entry, click on the trash can next to line you want to remove. Click OK to exit the screen when finished.
Summary phrases
You are able to customize entries for the Comments area of the Report Summary section of the printed report using this but-ton. Edit the items using the same instruc-tions found for the physician screen above.
The sentences on this screen are available for you to select when you display Reports > View Summary, so that you don’t need to re-type common phrases.
Configurations
Click this button to launch the Configura-tion program that allows further customize the HE/LX Analysis software settings. Details appear in Chapter 10: Configura-tions.
Beat Label Edit
This screen allows you to customize the list of labels that appear on Strip Labels, Saved Strips and the final report. Double-click on the No. of the label that you want to edit on the column labeled “Editable custom label,” edit and press Enter.
Note: Changes to labels must be made carefully because the meaning of the label MUST NOT change. For example, when the system calls a beat ventricular, it uses the VPB label when saving strips
for the report; you can change the text to read VE instead, but not SVPB or BBB, or your report will be incorrect.
Indications and Medications Edit
This window is for customizing the indica-tion and medication lists on the Patient Information screen.
st Monitoring, Inc. NEMM027-Rev-M Page 93 of 117
HE/LX Analysis Operator’s Manual Preferences: Managing Lists
NorthEa
Managing ListsSome additional notes for special cases. This does not apply to most users.
Pro-EDIT Level
The Pro-EDIT level does not have access to Preferences and therefore does not have screens to edit Summary Phrases or Physi-cians. In order to work around this, the Pro-EDIT user can do one of two things:
1. Update the information in the Pro ver-sion and copy the resulting file over to the Edit system, or
2. Use Notepad to create and/or edit the file.
The file where this information is stored is called info.ini and can be found in the bin directory and will look something like this:
[physician name]Dr. Physician[physician interp]Dr. Interpret[repcomments]Summary Phrase 2Summary Phrase I
Similarly, the medication, indication and diary lists are stored in the h4w.ini file and can be carefully copied from one PC to another.
Updating Software
If you are upgrading from an older version of Holter LX Analysis (5.2 or later), you should be able to copy and paste the old info.ini file into your new location. (See above) The old info.ini file will either be found in the directory of the old install, if you installed to a new directory; or in bin_backup if you installed your software in the same directory.
st Monitoring, Inc. NEMM027-Rev-M Page 94 of 117
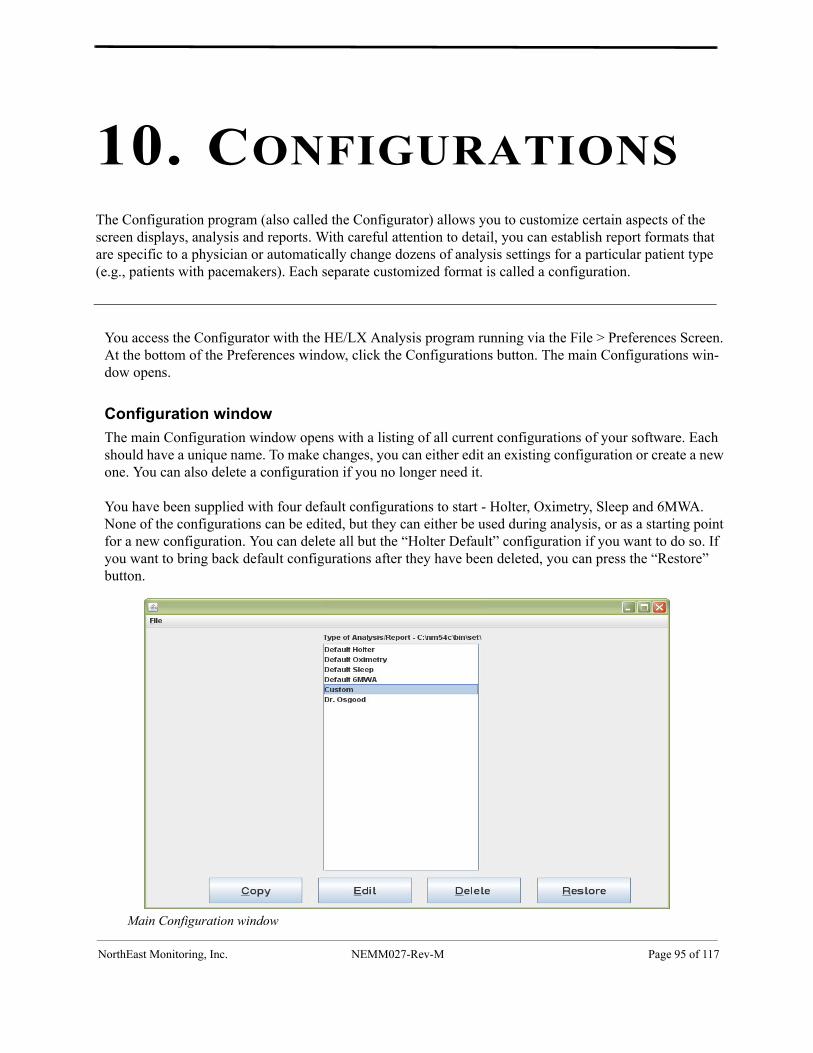
10. CONFIGURATIONS The Configuration program (also called the Configurator) allows you to customize certain aspects of the screen displays, analysis and reports. With careful attention to detail, you can establish report formats that are specific to a physician or automatically change dozens of analysis settings for a particular patient type (e.g., patients with pacemakers). Each separate customized format is called a configuration.
You access the Configurator with the HE/LX Analysis program running via the File > Preferences Screen. At the bottom of the Preferences window, click the Configurations button. The main Configurations win-dow opens.
Configuration window
The main Configuration window opens with a listing of all current configurations of your software. Each should have a unique name. To make changes, you can either edit an existing configuration or create a new one. You can also delete a configuration if you no longer need it.
You have been supplied with four default configurations to start - Holter, Oximetry, Sleep and 6MWA. None of the configurations can be edited, but they can either be used during analysis, or as a starting point for a new configuration. You can delete all but the “Holter Default” configuration if you want to do so. If you want to bring back default configurations after they have been deleted, you can press the “Restore” button.
Main Configuration window
NorthEast Monitoring, Inc. NEMM027-Rev-M Page 95 of 117

HE/LX Analysis Operator’s Manual Configurations:
NorthEa
To edit an existing configuration, click on the name associated with the configuration you want to change, and then click the Edit button.
To create a new configuration, click on the name associated with a configuration simi-lar to the one you want to create, and then click the Copy button.
To delete a configuration, click on the name associated with the configuration you want to eliminate, and then click the Delete button.
To restore the default configurations, click on the Restore button.
Configuration folders
A configuration consists of a series of fold-ers with tabs. Each folder contains the con-trols for a particular window or portion of the HE/LX Analysis software. Within the folders for a configuration, an entry in a field automatically populates that field for
a patient when you select the configuration or “Type of Analysis/Report”.
To display the fields in a particular folder, click on each of the tabs for that folder:
• Main - Includes the name or descrip-tion of the configuration, which appears in the Type of Analysis/Report list; the physician’s and interpreting physi-cian’s names associated with the con-figuration; the scan number; hookup technician; and analyst.
When you create a new configuration by using the Copy button, the Descrip-tion field in the Main folder reads ***New Type***. Be sure to type a new name for the configuration in the Description field to differentiate it from others you create. This is the name that will be visible on the Patient Informa-tion as Type of Analysis/Report.
The Main folder contains the Scan # field which controls the auto-sequenc-ing of the Scan number in the Patient
st Monitoring, Inc. NEMM027-Rev-M Page 96 of 117
Configuration folders
HE/LX Analysis Operator’s Manual Configurations:
NorthEa
Information window. To have the sys-tem automatically increment the scan number for each patient, enter $seq in the Scan # field; to include the date and/or time-of-day in the Scan # field, enter $date or $time, respectively. Use what-ever order you want the scan number to follow. Also, be sure to turn on the “Assign date and time to Scan #” fea-ture in the Preferences window.
Patient Type
The Main folder includes a field called Patient Type. There are three patient types to choose from:
1.) Holter - For all your Holter and Oxymetry Patients
2.) Sleep - For Sleep Patients. Apnea analysis is run automatically and the OSA/AHI front page is available for these patients.
3) 6MWA (6-Minute Walk Assess-ment) - For these patients, the 6MWA window off of Patient Information becomes available and the 6MWA front page is also available to choose from.
The rest of the folders are:
• Diary - Different diary entries can be added, and diary entries can be replaced with other text or deleted singly or all together. The diary entries appear in the drop-down list of choices in the Symp-tom field in File > Patient Information > Diary.
• How Often Strips Auto Save - This controls the settings that come up auto-matically in this window in Settings > How Often Strips Auto Save.
• Miscellaneous - This controls the beat-by-beat annotation, the ST segment
analysis location in the Preferences window, and some advanced file nam-ing fields.
• Oximetry - This controls the settings that come up automatically in the win-dow accessed by selecting Settings > Oximetry.
• Report - This controls the default report set for the configuration. Addi-tionally, you can customize the default report heading, front page, strip annota-tion, full disclosure, report summary, and saved strips fields in the Reports window. You can also change the com-pany’s name and address.
• Rhythm - Different rhythm types can be added, and rhythm types can be replaced with other text or deleted. Rhythm types appear in the Comment field in Tables > Edit. They do not appear in the printed report.
• Scanning Criteria - This controls the automatic settings that appear in the Scanning Criteria window. The window is accessible from the Patient Informa-tion window by clicking Settings > Scanning Criteria or from the main Holter menu under Settings > Scanning Criteria.
• Spectral Settings - This controls the automatic settings that appear in the Spectral Analysis window. The window appears when you select Settings > Spectral Analysis.
• Spectral HRV - This controls the the heart rate variability plots in the HRV menu.
• What Strips to Auto Save - This con-trols the settings that come up automati-cally in this window in Settings > What Strips to Auto Save.
• Page/Saved Strips/Critical Events/Superimposition/Calibration - This controls the appearance of some of the
st Monitoring, Inc. NEMM027-Rev-M Page 97 of 117
HE/LX Analysis Operator’s Manual Configurations:
NorthEa
Review windows, the settings in some fields, and whether the window initially appears in Expanded mode.
• Trend/Lorenz Plot - This controls the Type that is initially displayed.
• 12 Lead - This includes controls for 12-lead displays.
• 12 Lead Labels - This shows the text that appears in the list of choices when you add a 12-lead strip to the printed report. To see the list in 12 Lead Strips, click on Add/Del to open the Add/Del window, click on the Description text field, and then click on arrow at the right end of the field.
• SD360 - No longer used.
• 6MWA - This allows you to set up user defined lists that appear in the 6MWA window off of Patient Information.
Saving a configuration
For each configuration you create or edit, make changes in as many folders as you need to. When all folders reflect what you want to associate with that configuration, click the OK button at the bottom of the window. Your new configuration will be saved and the window closed; the main Configurator window then appears.
Canceling a configuration
To exit without saving the new configura-tion, click Cancel. The window closes and the main Configurator window appears.
To create or edit another configuration, use the Copy or Edit button again.
Exiting from the Configuration program
To exit from the Configuration program, click on the red Close button in the upper right corner of the window.
Using a configuration
The configuration is used when you start a new Holter test. When creating a new patient, the list of Configurations appears in the Type of Analysis/Report field on the Patient Information window.
By choosing a configuration, all of the items that were defined in the configurator will be applied automatically to your patient. Any of these settings can then be updated for your patient if you choose to do so, before or after analysis.
At any time you can go back and change the Type of Analysis/Report for a patient, but keep in mind that all settings will be reset to the new configuration and any editing you have already done to the patient will be lost.
st Monitoring, Inc. NEMM027-Rev-M Page 98 of 117
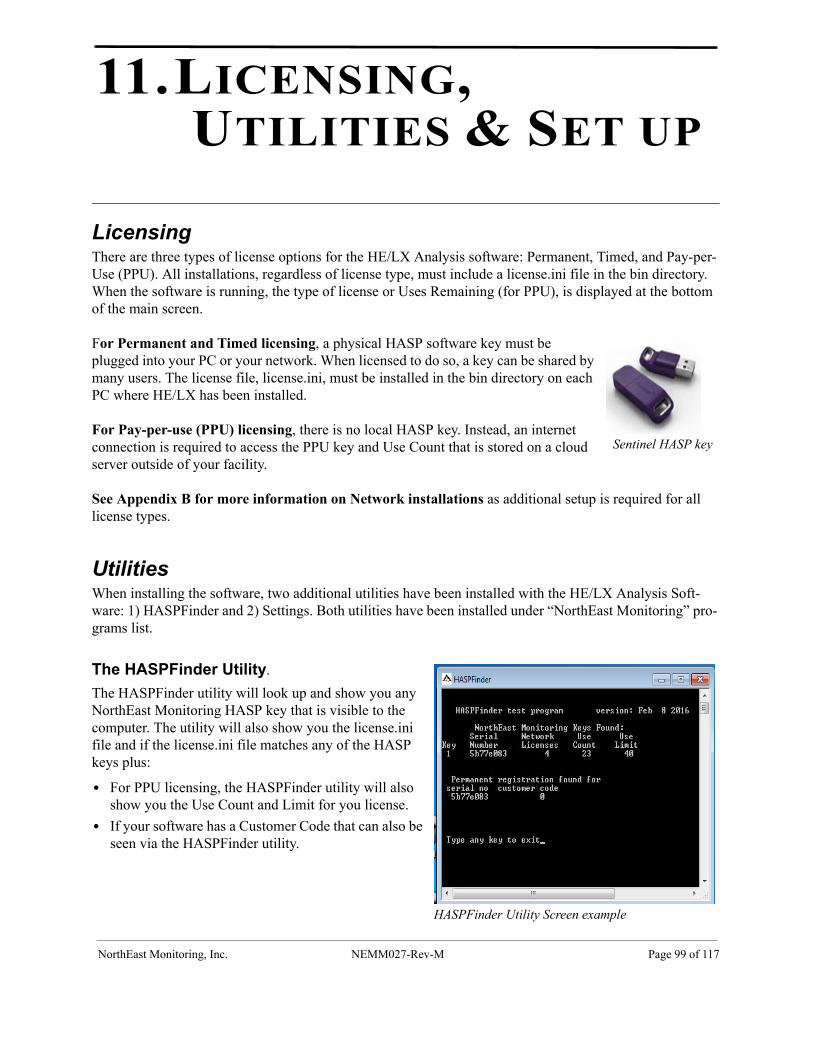
11.LICENSING, UTILITIES & SET UP
LicensingThere are three types of license options for the HE/LX Analysis software: Permanent, Timed, and Pay-per-Use (PPU). All installations, regardless of license type, must include a license.ini file in the bin directory. When the software is running, the type of license or Uses Remaining (for PPU), is displayed at the bottom of the main screen.
For Permanent and Timed licensing, a physical HASP software key must be plugged into your PC or your network. When licensed to do so, a key can be shared by many users. The license file, license.ini, must be installed in the bin directory on each PC where HE/LX has been installed.
For Pay-per-use (PPU) licensing, there is no local HASP key. Instead, an internet connection is required to access the PPU key and Use Count that is stored on a cloud server outside of your facility.
See Appendix B for more information on Network installations as additional setup is required for all license types.
UtilitiesWhen installing the software, two additional utilities have been installed with the HE/LX Analysis Soft-ware: 1) HASPFinder and 2) Settings. Both utilities have been installed under “NorthEast Monitoring” pro-grams list.
The HASPFinder Utility.
The HASPFinder utility will look up and show you any NorthEast Monitoring HASP key that is visible to the computer. The utility will also show you the license.ini file and if the license.ini file matches any of the HASP keys plus:
• For PPU licensing, the HASPFinder utility will also show you the Use Count and Limit for you license.
• If your software has a Customer Code that can also be seen via the HASPFinder utility.
Sentinel HASP key
HASPFinder Utility Screen example
NorthEast Monitoring, Inc. NEMM027-Rev-M Page 99 of 117

HE/LX Analysis Operator’s Manual Licensing, Utilities & Set up: Patient Directories
The Settings Utility
In Settings, you can enter the names of both your facility and the primary user of your Holter soft-ware, along with five lines for the name and address that appear in the Reports window when you print a Holter report.
Changing Language
The drop-down box will show the list of lan-guages that are currently supported in the soft-ware. To change the language used throughout HE/LX Analysis, make your selection from the drop-down menu.
Number of Patients
To change the number of directories stored on the Patient List, you can enter a different number here. If you choose to increase the number, addi-tional directories will be created, but if you need to decrease the number of directories, you will need Windows Explorer to do so, but be sure that the directories you are deleting are either empty or the patient data has already been archived.
NorthEast Monitoring recommends that you have no more than 500 patient directories, as when more than 500 exist, the speed of the system may be compromised. See Chapter 8 for more informa-tion on Archiving patient directories.
Go to and Restore Demo Patient buttons
If there is ever a time that you are unable to start the software because of a problematic patient record, you can use the Go to Demo Patient button to open the software. If for some reason the demo patient has been deleted, you can first restore it using the Restore Demo Patient button.
Patient DirectoriesStarting with Holter LX Analysis 5.4e, all patient files must exist in a single directory. The [PatientParentDir] denotes the directory location and size and can be found at the top of the h4w.ini file. By default, the pat directory will be created in the local application direc-tory. You can modify it to meet your needs. Below are some examples of how it can appear:
[PatientParentDir]c:\nm\pat, 100 ;default example
[PatientParentDir]c:\nm60\pat, 30;default when software installed in other than nm direc-tory, for example, nm60
[PatientParentDir]\\shared_dir\nm\pat, 30;Network example
Permanently Delete Patient Directories
If for some reason you would like to reduce the number of patient directories, you must first delete the patient records in the directories you will delete. You can do this by going to the Patient List, selecting the patients, and then clicking the Delete button. You will then need to go to the Settings Utility window to reduce the number of patient directories, and then use Windows Explorer to delete unwanted directories perma-nently. Use the Archive function to save patient directory prior to deleting directories.
Settings window
NorthEast Monitoring, Inc. NEMM027-Rev-M Page 100 of 117
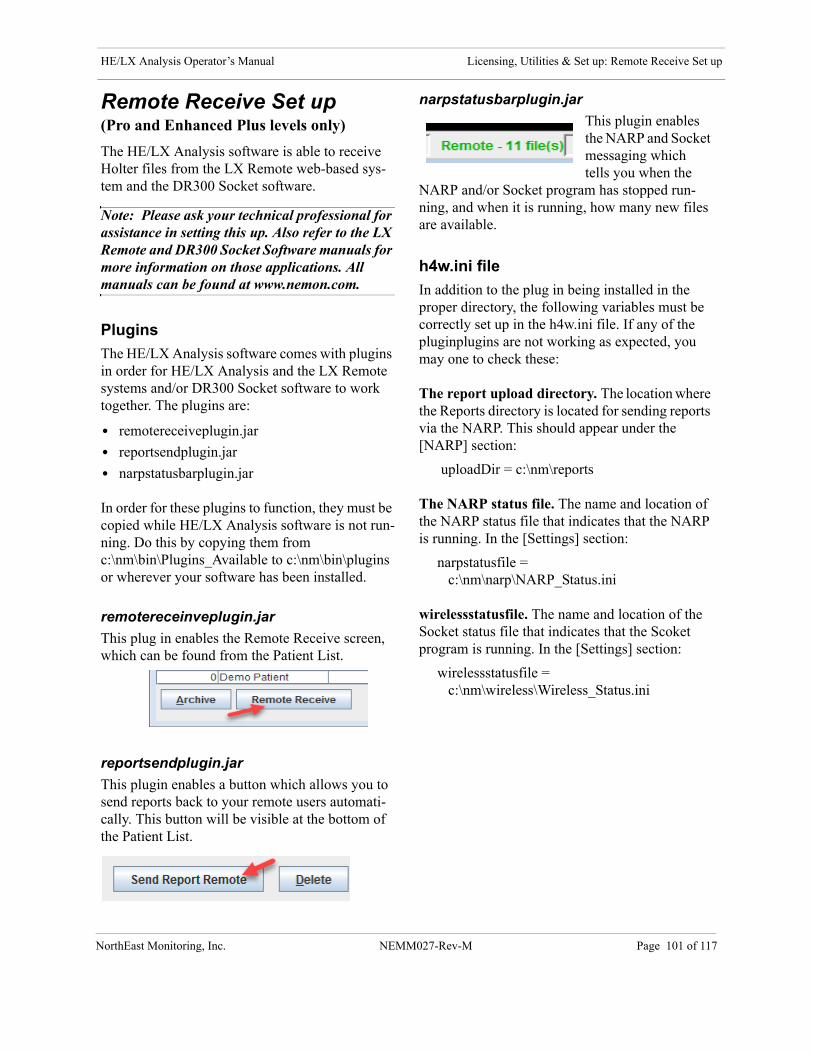
HE/LX Analysis Operator’s Manual Licensing, Utilities & Set up: Remote Receive Set up
Remote Receive Set up(Pro and Enhanced Plus levels only)
The HE/LX Analysis software is able to receive Holter files from the LX Remote web-based sys-tem and the DR300 Socket software.
Note: Please ask your technical professional for assistance in setting this up. Also refer to the LX Remote and DR300 Socket Software manuals for more information on those applications. All manuals can be found at www.nemon.com.
Plugins
The HE/LX Analysis software comes with plugins in order for HE/LX Analysis and the LX Remote systems and/or DR300 Socket software to work together. The plugins are:
• remotereceiveplugin.jar
• reportsendplugin.jar
• narpstatusbarplugin.jar
In order for these plugins to function, they must be copied while HE/LX Analysis software is not run-ning. Do this by copying them from c:\nm\bin\Plugins_Available to c:\nm\bin\plugins or wherever your software has been installed.
remotereceinveplugin.jar
This plug in enables the Remote Receive screen, which can be found from the Patient List.
reportsendplugin.jar
This plugin enables a button which allows you to send reports back to your remote users automati-cally. This button will be visible at the bottom of the Patient List.
narpstatusbarplugin.jar
This plugin enables the NARP and Socket messaging which tells you when the
NARP and/or Socket program has stopped run-ning, and when it is running, how many new files are available.
h4w.ini file
In addition to the plug in being installed in the proper directory, the following variables must be correctly set up in the h4w.ini file. If any of the pluginplugins are not working as expected, you may one to check these:
The report upload directory. The location where the Reports directory is located for sending reports via the NARP. This should appear under the [NARP] section:
uploadDir = c:\nm\reports
The NARP status file. The name and location of the NARP status file that indicates that the NARP is running. In the [Settings] section:
narpstatusfile = c:\nm\narp\NARP_Status.ini
wirelessstatusfile. The name and location of the Socket status file that indicates that the Scoket program is running. In the [Settings] section:
wirelessstatusfile = c:\nm\wireless\Wireless_Status.ini
NorthEast Monitoring, Inc. NEMM027-Rev-M Page 101 of 117

HE/LX Analysis Operator’s Manual Licensing, Utilities & Set up: Interface for Foreign (non-NEMon) Data Formats
Interface for Foreign (non-NEMon) Data FormatsThe HE/LX software can be used to process ECG data from foreign (non-NEMon) recorders that use their own unique file formats. To accomplish this one converts the foreign data into an intermediate binary format (IBF) which can then be processed by HE/LX Analysis.
The license for the HE/LX Analysis system must include the "Data" option. Note that this normally also requires the PPU (Pay-per-use) license option.
The following steps are necessary to enable a for-eign recorder interface:
1. The plugin must be enabled. The plugin foreignrecorderimportplugin.jar must be copied from c:\nm\bin\Plugins_Available to c:\nm\bin\plugins.
2. The foreign data must be converted to the IBF format. This conversion utility is the respon-sibility of the vendor supplying the foreign data. The IBF data format is defined as follows:
2.1 Up to three (3) channels of Holter data are supported. For each channel a separate binary file must be supplied. The files are to be named flashc0.dat, flashc1.dat and flashc2.dat for channels 1, 2, and 3 respectively. If fewer chan-nels are to be processed, only generate the first N files as required. These files are to be placed in the \<nm>\bin\tmp directory (replacing <nm> with the actual installed location). The data must be in the form of 16-bit binary values with the least significant byte first (little endian).
2.2 The least significant bit must be equivalent to a voltage at the electrodes of 12.5 micro-volts.
2.3 The sampling rate must be 180 samples per second.
2.4 The utility which produces or copies this data must be callable at the command line in a Windows-based system.
3.Pat.001 File. If additional information, such as patient name or patient ID, are to be passed to the HE/LX Analysis program at the same time as the ECG data, a file called pat.001 must be generated.
3.1 This is to be done by using a "blank" pat.001 file from the same version of the HE/LX Analysis system which will be used for analysis.
3.2 To generate this system file, select "File->New" and select an empty patient directory and note the path to this directory but do not select it yet, exit the new/open window.
3.3 Copy a flash.dat file into the empty direc-tory. This can be the file from c:\nm\pat\demo. Again in "File->Open/New" select the patient directory found previously.
3.4 Exit the program and get the pat.001 file which was generated in the directory selected above.3.5 Edit the line in the pat.001 file: IgnoreFlashFile = 0 to IgnoreFlashFile = 1
3.6 Typically (but not required) the patient name and patient ID are filled in by adding the information to the lines:PatientName =ScanNo =
3.7 If there are diaries for the recording, they can be added to the [Diary] section with the time being the offset from the beginning of the recording. An example:[Diary]10:46:06.367 Event10:53:03.900 Rapid HR11:33:03.811 PalpitationsCall technical support for more information.
NorthEast Monitoring, Inc. NEMM027-Rev-M Page 102 of 117
HE/LX Analysis Operator’s Manual Licensing, Utilities & Set up: Interface for Foreign (non-NEMon) Data Formats
4. A batch file must be created which does the fol-lowing:
4.1 Calls the vendor supplied conversion utility to generate the tmp\flashcx.dat (IBF) files.
4.2 Places the pat.001 file in the selected patient directory. The first argument to the batch file, which is accessed as %1, is the path to the cur-rent patient directory.
4.3 Places a "dummy" flash.dat file in the selected patient directory. This file must be a valid flash.dat file but will not be used for analy-sis. The file in \nm\pat\demo can be used.
4.4 Calls the utility unpackdc.exe as follows (missing flashcx.dat files are replaced with - ):
unpackdc %1\datacard.dat tmp\flashc0.dat tmp\flashc1.dat tmp\flashc2.dat 3
4.5 The batch file may be called userimport.bat and must be in the c:\nm\bin directory.
5. In the c:\nm\bin\h4w.ini file a line must be added after the [Settings] header and before the next [ ] section. The line is:
FRIImportCommand=userimport.bat $PatientDirectory
with the userimport.bat name replaced by the batch file name actually used above.
6. If the sampling rate and/or scaling of the data cannot be provided as specified, then it is possible within a limited range to have the unpackdc.exe utility make some adjustments. This is only recom-mended if the LSB of the data is less than 12.5 micro volts or the sampling rate is greater than 360 samples/second. Run the unpackdc.exe utility at the command line with no arguments to view the full set of instructions.
7. To start processing the data:
7.1 In the HE/LX Analysis program open File->Open/New.
7.2 Select an unused patient data slot and the "Import ECG" button which has been enabled.
7.3 Clicking on the "Import ECG" button will cause the batch file from above to be run and will then open the Patient Information screen to allow processing to be started.
8.Sample / example batch file
Here is a sample of the batch file. It assumes that a recorder manufacturer created a callable executable named TZMM.exe instead of userimport.bat.
TZMM.exe -c 1 -f helx -i tmp\tz -o tmp\flashc0.dat
TZMM.exe -c 2 -f helx -i tmp\tz -o tmp\flashc1.dat
TZMM.exe -c 3 -f helx -i tmp\tz -o tmp\flashc2.dat
unpackdc %1\datacard.dat tmp\flashc0.dat tmp\flashc1.dat tmp\flashc2.dat 3
copy \nm60a\pat\demo\flash.dat %1 /y
copy import_pat.001 %1\pat.001
In this case, the h4w.ini file should be modified as follows:
FRIImportCommand=TZMM.bat $PatientDirectory
NorthEast Monitoring, Inc. NEMM027-Rev-M Page 103 of 117

HE/LX Analysis Operator’s Manual Licensing, Utilities & Set up: Interface for Foreign (non-NEMon) Data Formats
NorthEa
Remote Receive for PPU
A special feature allows you to create patient directories in advance so that you can receive recordings remotely and assign them into the patient folders using the Remote feature.
This can be accomplished by:
1. Add variable HISRemoteReceive = 1 under [Settings] in h4w.ini.
2. Populate empty patient directories with an externally generated pat.001 file.
3. Then, using Remote Receive, copy the remote files into the populated patient directories.
st Monitoring, Inc. NEMM027-Rev-M Page 104 of 117
APPENDIX A - CALCULATION OF HEART RATE...
Types of heart rates
A variety of heart rate calculations are made by HE/LX Analysis. They include:
• Current heart rate
• Minute-by-minute heart rate
• Beat-by-beat heart rate
• Mean heart rate in intervals
• Mean heart rate for Holtered period
• Second heart rate
• AF Heart rate
• Heart rate strips
Current heart rate
This is a complex function that takes the current beat and the beats preceding it into account. This weighted average follows these rules:
1. If the differences between the adjacent beats of the preceding four RR intervals are no more than 12 percent of the average RR interval for the previous beat and the beats are all normal, then the new average RR interval is the simple average of the previous four RR intervals.
2. If the previous four RR intervals were NOT bigeminy, VTAC or SVT AND the current RR interval is within 25 percent of the previous average AND the previous two beats were not ventricular AND the previous 10 beats were not supraventricular, then the new average RR interval is 1/8 of the current RR interval plus 7/8 of the previous average.
3. If the previous four RR intervals were NOT bigeminy, VTAC or SVT AND the current RR interval is not within 25 percent of the previous average OR any of the previous two beats were ventricular OR any of the previous 10 beats were supraventricular, then the new average is 1/32 of the current RR interval plus 31/32 of the previous average.
4. If the previous four RR intervals were bigeminy, VTAC or SVT, then the average RR interval is changed by 0.000087 seconds. It is increased if the current interval is longer than the previous inter-val, otherwise it is decreased.
NorthEast Monitoring, Inc. NEMM027-Rev-M Page 105 of 117

HE/LX Analysis Operator’s Manual Appendix A - Calculation of Heart Rate
Once the current average RR interval is determined, the current heart rate is calculated as 60 divided by the current average RR interval, that is, current HR = 60/(current RR interval).
The current heart rate is used as the heart rate that appears in the heart rate data field for any displayed strip. This includes the heart rate associated with any strip in the Selected Strips window and in the printed report.
The current heart rate is also used to detect tachycardia and bradycardia. The onset of either is determined to be when the current heart rate reaches the tachycardia or bradycardia settings in the Scanning Criteria window.
The low and high heart rates reported in the Tables window and in the tables of the printed report refer to the lowest and highest current heart rate calculated during the interval.
Heart Rate calculation limits
The absolute limits are 20 and 300 (3 seconds to 0.2 seconds). If the “additional dead time” is not set to zero, then this upper limit can be lowered further. If the “additional dead time” is set to 0.1 or greater, then the HR upper limit is = 30 / (additional dead time).
Minute-by-minute heart rate
The heart rate plotted in the Trends window is a minute-by-minute heart rate. It is calculated as 60 times the number of beats processed in the minute divided by the sum of all RR intervals of beats processed in the minute (in seconds).
Beat-by-beat heart rate
The heart rate associated with each beat in expanded displays whenever the Annotation field in the Prefer-ences window is set to Heart Rate is the beat-by-beat heart rate. It is calculated based on the RR interval following the labeled beat. Beat-by-beat heart rate equals 60 divided by RR interval, that is, HR = 60/(RR).
Mean heart rate in intervals
In the tables (in Tables window and printed report), the mean heart rate within each interval is calculated by dividing the number of beats in that interval by the amount of time processed within the interval.
Mean heart rate for Holtered period
In the Report Summary (in the Report Summary window and printed report), the mean heart rate during the Holter test is the number of beats counted divided by the amount of time processed.
Second heart rate
The second heart rate is the heart rate associated with a run of VTAC or SVT. It is calculated as 120 divided by the sum of the current RR interval and the previous RR interval. The second heart rate appears in strips with VTAC or SVT in Selected Strips, the printed report, and the strip list, labeled HR2.
NorthEast Monitoring, Inc. NEMM027-Rev-M Page 106 of 117

HE/LX Analysis Operator’s Manual Appendix A - Calculation of Heart Rate
The second heart rate is used to determine where in the ventricular and supraventricular run tables a run of VTAC or SVT appears. The heart rate separating fast from slow runs is determined by the VTAC and SVT settings in Scanning Criteria, but the rate of each event is considered to be the second heart rate.
The second heart rate is also used to determine which run is identified as the fastest run of VTAC and SVT.
AF heart rate
The AF heart rate is used to determine the Fastest AF strip and is also the HR that appears on any AF type strip created by the software. The AF heart rate is calculated from the average of the RR intervals that are completely within +- 3.75 seconds of the current beat, which is the same as the standard 7.5 second strip.
Heart rate strips
In the Critical Events window, there is a choice in the Type field called “HR strips.” This displays all ECG from the Holter test divided into 7.5-second strips. Each strip includes a time-of-day and a Strip HR. That Strip heart rate is the total number of RR intervals (including partial ones, but excluding artifact) within the strip divided by the sum of the RR intervals.
Defining dead-time
Dead-time is the amount of time (in seconds) after a detected QRS complex during which the software will not look for another QRS complex. Generally, this helps to prevent the mis-identification of tall T-waves as QRS complexes.
The operator can add more time to the tail end of the dead-time using the Extra dead-time setting in the Scanning Criteria window. Because the recovery time (i.e., the width of the T-wave) varies with heart rate, the dead-time built into the software adjusts based on the current heart rate. At higher rates, the dead-time decreases, and at lower rates, the dead-time increases.
The heart rate determines the dead-time as shown in the following table:
TABLE 1. How Heart Rate Determines Dead-time
Heart rate
Dead-time
Heart rate
Dead-time
Heart rate
Dead-time
Heart rate
Dead-time
30 - 45 0.50000 80 0.23812 115 0.22000 150 0.20000
50 0.43500 85 0.22000 120 0.22000 155 0.19354
55 0.38727 90 0.22000 125 0.22000 160 0.18750
60 0.34750 95 0.22000 130 0.22000 165 0.18181
65 0.31384 100 0.22000 135 0.22000 170 0.17647
70 0.28500 105 0.22000 140 0.21428 175 0.17142
75 0.26000 110 0.22000 145 0.20689
NorthEast Monitoring, Inc. NEMM027-Rev-M Page 107 of 117

APPENDIX B - NETWORK INSTALLATIONS...
North
Network HASP Key InstallationFor Permanent and Timed licenses only.
System Requirements:
1. The network HASP key server should be a minimum of a Windows 7, which is visible (can be pinged) from each client computer.
2. The network HASP key server must have one USB port available.3. Port 1947 must be available on all computers for use by the Safenet drivers.
Installation:
1. Install the HASP User Setup on the network license server. During this installation, the installer will ask for permission to modify the firewall (if any) to allow network access to the Safenet drivers. This must be allowed.The current HASP installer is available at www.nemon.com on the Support page under “Technical Support Files.”
2. Put the HASP key in an available USB port on the server. Using USB hubs is allowed.3. On each client computer, install the HE/LX Analysis program, and the Adobe Reader if
prompted to do so. By default the HASPFinder utility will also be installed.4. Install the license.ini file on each client computer.5. Run the HASPFinder software on each client to verify that the HASP key can be seen
from each location. The HASPFinder should also see the local license.ini file and confirm that it matches the HASP key.
6. Run the HE/LX Analysis program to confirm installation is successful.
East Monitoring, Inc. NEMM027-Rev-M Page 108 of 117

HE/LX Analysis Operator’s Manual Appendix B - Network Installations
NorthE
Setting up Shared Network Patient DataBeware that this will slow down response time, depending on the speed of your network. If you choose to set up network patient data, do the following below.
First, determine the location and number of patient directories.
Then, on each client machine, open the h4w.ini file that is located in the c:\nm\bin directory and do the following:
1. Delete the following lines:[Current]LoadedPatient = C:\nm\pat\xxPatDir = C:\nm\pat\xxLastPatient = C:\nm\pat\xx
2. Modify the line that immediately follows [PatientParentDir]:from: c:\nm\pat, xxxto the network path for the base of the patient directories followed by a comma and the number of directories that you choose to have created initially.
Next, start the HE/LX Analysis software on a single client machine. It will create the number of directories you specified on the network machine. (The system may fail as there is no demo patient yet.)
Lastly, and very important, copy and paste the “demo” patient directory from the client machine to the patient directory on the network.
PPU Networks - Additional stepIn order to count Pay-per-Use (PPU) uses, the program will generate and update a file named procedure_history.dat in the bin directory.
If HE/LX Analysis is being run on more than one computer, you will need to create an envi-ronment variable called NEM_PROC_HIST. The value of the variable needs to include the a shared network location that all workstations can access and update.
This is done by going to Control Panel->System->Advanced system settings->Environment Variables->System variables->New then enter (the variable value is an example):
Variable name: NEM_PROC_HIST
Variable value:\\server_name\share_name\directory_ name\procedure_history.dat
Once the variable is create, re-boot the computer to make it effective. At command line, you can type “set” and all the settings should show.
ast Monitoring, Inc. NEMM027-Rev-M Page 109 of 117

HE/LX Analysis Operator’s Manual Appendix B - Network Installations
NorthEa
Windows 2008 Server Installation
First, each user needs a directory assigned to it in the form of “c:\user\test1” for user test1.
The user name should have no spaces. If there are spaces in the user name, then a logical redefinition will be required as the HE/LX Analysis program will not accept spaces in the path of the patient directories.
Then assuming the user names are of the form testxxx, the following has to be done:
1. Make a dummy installation of the HE/LX Analysis onto the C drive in the normal location c:\nm. This installation will not actually be used.
2. Copy the license.ini file into the c:\nm\bin directory.
3. Copy and paste the full directory (c:\nm) into each user directory c:\user\testxxxx, resulting in a bin path of the form c:\user\test1\nm\bin.
4. The file c:\user\test1\nm\bin\h4w.ini must be edited so that each instance of c:\nm\ is changed to c:\user\test1\nm\
5. See “Setting up Shared Network Patient Data” to allow for sharing of patient files
Now it should be possible to login to each user with "Remote Desktop Connection" and have all copies running at the same time up to the limit of licenses in the network key (dongle).
Once everything is up and running, if the number of users exceeds the number of licenses allowed, a message "no NEM dongle found" or a "no matching license" will appear.
If the space in user name limitation is a problem, it should be possible to use MKLINK to create a logical name which is acceptable.
It should be possible to create a script to do all this for each new user.
st Monitoring, Inc. NEMM027-Rev-M Page 110 of 117
APPENDIX C - HIS - HOSPITAL INFORMATION SYSTEM (PRO LEVEL)
NorthEas
The Pro level of software includes an interface to your hospital information sys-tem(HIS). Once a patient is completely analyzed using HE/LX Analysis, the user is able to save a copy of the patient data and final report in a location for your hospital informa-tion system to retrieve.
Once HIS Export is set up, a button can be found at the bottom of the Patient List. The button will be enabled only when a patient has a report that can be copied.
HIS Export Setup
The HIS export plugin - hisexportplugin.jar - must be copied into the Plugins directory (from Plugins_available) in order for the HIS Export button to be visible on the Patient List.
Additionally, the following variables must exist in your h4w.ini file and need to have the correct paths in order for the HIS Export to function properly:
HISExportCommand = cmd /c rephis.bat "$HISExportPath"HISExportPath = c:\HIS_Transfer\Pat-$IDNO-$DateRecorded-$CurrentTimeStamp
The HISExportPath determines where the files are saved. As per above, the files will appear in the user’s c:\HIS_Transfer directory. Each file name will begin with the fol-lowing format, Pat-$IDNO-$DateRecorded-$CurrentTimeStamp, unless you choose to do otherwise.
The HIS Export Process
The user creates the HIS files by going to the Patient List, clicking on one or more patients, and then clicking on the HIS Export button. The HIS Export button will only be enabled if the patients selected have a report to export. Three files are created for each patient during this process:
1. cmp - the existence of this file tells you that the other files are ready to be retrieved.2. pdf - the patient’s Holter report3. txt - a text file in an xlm format with the patient data.
t Monitoring, Inc. NEMM027-Rev-M Page 111 of 117
HE/LX Analysis Operator’s Manual Appendix D - LX Sleep - Apnea
NorthEa
The File Format
The txt file includes the following data ele-ments:
PATIENT INFORMATION
This information comes from the Patient Information window. Most of this informa-tion has been entered by the user.
• PatientName• PatientNameFirst• PatientNameMI• PatientNameLast• Physician• DOB• ScanNo• IdNo• DateRecorded• Age• AgeUnit• StatusDate• Sex• RecorderNo• Analyst• HookupTech• PhysicianInterp• Indication• Medication• height• heightunit• weight• weightunit• bmi
GENERAL SUMMARY
• Minimum-Heart-Rate• Average-Heart-Rate• Maximum-Heart-Rate• Total-Beats
PACED SUMMARY
From the Paced Table:
• Total-Beats-Paced• Percent-Beats-Paced• Beats-Atrial-Paced
• Percent-Beats-Atrial-Paced• Beats-Vent-Paced• Percent-Beats-Vent-Paced• Beats-AV-Paced• Percent-Beats-AV-paced• Paced-Capture-Failure• Paced-Sense-Failure• Paced-Inhibition
PACEMAKER TYPE SETTINGS
From Scanning Criteria:
• Pacemaker-Type• Minimum-Programmed-Heart-Rate• Maximum-Programmed-Heart-Rate• Maximum-Ventricular-to-R-interval• Maximum-atrial-to-R-interval
SUPRAVENTRICULAR SUMMARY
From the Supraventricular Table:
• Total-Time-Analyzed• Total-SVPB• SVPB-Single• SVPB-Pairs• Total-SVT-Events• Total-Beats-In-SVT• SVPB-Aberrant
From the Supraventricular Runs Table, where the HR is less than SET-Categorize-SVT-greater:
• SVPB-run3-less• SVPB-run4-less• SVPB-run5-less• SVPB-run69-less• SVPB-run10-less• SVPB-Beats-less (the total of all runs
less than the HR)
From the Supraventricular Runs Table, where the HR is greater than or equal to SET-Categorize-SVT-greater:
• SVPB-run3-greater• SVPB-run4-greater• SVPB-run5-greater
st Monitoring, Inc. NEMM027-Rev-M Page 112 of 117
HE/LX Analysis Operator’s Manual Appendix D - LX Sleep - Apnea
NorthEa
• SVPB-run69-greater• SVPB-run10-greater• SVPB-Beats-Greater (the total of all
runs greater than or equal to HR)• AF-Events• AF-Time
From trends:
• percent-SVPB-disabled-time
TACHY/BRADY SUMMARY
From Tachy/Brady Table:
• Beats-Bradycardia• Time-in-Bradycardia• Beats-Tachycardia• Time-in-Tachycardia
BIGEMINY SUMMARY
From Bigeminy Table:
• Bigeminy-Beats• Bigeminy-3Beats• Bigeminy-49Beats• Bigeminy-1024Beats• Bigeminy-25Beats
GENERAL INFORMATION
From General Profile:
• GP-Total-Time-Recorded• GP-Heart-Rate-MEAN• GP-Runs-VT• GP-Runs-SVT• GP-Pauses• GP-Notes
VENTRICULAR SUMMARY
From Ventricular Table:
• VENT-Total-Beats• VENT-Pairs• VENT-single-early-vpb• VENT-single-late-vpb• VENT-beats-VTAC• VENT-Ront
From the Ventricular Runs Table, where the HR is less than the setting SET-Catego-rize-VT-greater:
• VENT-run3-less• VENT-run4-less• VENT-run5-less• VENT-run69-less (runs from 6-9)• VENT-run10-less (runs with 10 or more
beats)• VENT-beats-less (the total of all runs
less than the HR)
From the Ventricular Runs Table, where the HR is greater than or equal to the set-ting SET-Categorize-VT-greater:
• VENT-run3-greater• VENT-run4-greater• VENT-run5-greater• VENT-run69-greater• VENT-run10-greater• VENT-beats-greater (the total of all
runs greater than or equal to HR)
SETTINGS
Settings found in Scanning Criteria:
• SET-Tachycardia-rates-greater• SET-Bradycardia-rates-less• SET-Pauses-greater• SET-Categorize-SVT-greater• SET-Categorize-VT-greater• SET-Signal-Quality• SET-Number-Channels-Processed• SET-Primary-Channel• SET-Alternate-Channel• SET-Automatic-Channel-Selection• SET-Automatic-ST-marker-selection• SET-Process-ST-Events• SET-Artifact-Filter• SET-Narrow-QRS• SET-Extra-Dead-Time• SET-Label-SVPB-prematurity• SET-Label-Early-VPB-prematurity
st Monitoring, Inc. NEMM027-Rev-M Page 113 of 117
HE/LX Analysis Operator’s Manual Appendix D - LX Sleep - Apnea
NorthEa
ST EPISODE REPORT SUMMARY
• ST-EPISODE-Elevation-Duration• ST-EPISODE-Elevation-MM-Baseline• ST-EPISODE-Elevation-MM-ISO-
ELEC• ST-EPISODE-Elevation-Integral• ST-EPISODE-Depression-Duration• ST-EPISODE-Depression-MM-Base-
line• ST-EPISODE-Depression-MM-ISO-
ELEC• ST-EPISODE-Depression-Integral
APNEA, IF DATA EXISTS
If AHI is calculated for this patient, this data will be included.
• Apnea-AHI• APNEA-sleep-start• APNEA-sleep-stop• APNEA-sleep-time• APNEA-heart-rate-min• APNEA-heart-rate-mean• APNEA-heart-rate-max• APNEA-spo2-level-min• APNEA-spo2-level-mean• APNEA-spo2-level-max• APNEA-epochs• APNEA-desat-intervals• APNEA-max-desat-length• APNEA-spo2-total• APNEA-spo2-artifact• APNEA-spo2-%artifact
6MWA, IF DATA EXISTS
All of this data is entered manually by the user and appears on the 6MWA window.
• 6MWA-starttime• 6MWA-basehr• 6MWA-basebp• 6MWA-basespo2• 6MWA-baseo2• 6MWA-basedysdesc• 6MWA-basefatdesc• 6MWA-stoptime
• 6MWA-posthr• 6MWA-postbp• 6MWA-postspo2• 6MWA-posto2• 6MWA-postdysdesc• 6MWA-postfatdesc• 6MWA-testnum• 6MWA-testtot• 6MWA-totaldistance• 6MWA-totaldistanceunits• 6MWA-walkpace• 6MWA-numstops• 6MWA-reasons
HIS Import OptionHospitals can choose to save LX Remote flash.dat files to pre-loaded patient directo-ries, by inserting the following variable into the h4w.in file under [Settings]:
HISRemoteReceive = 1
If this option is chosen, then Remote files can only be saved in pre-populated patient directories that are loaded via an external process.
st Monitoring, Inc. NEMM027-Rev-M Page 114 of 117
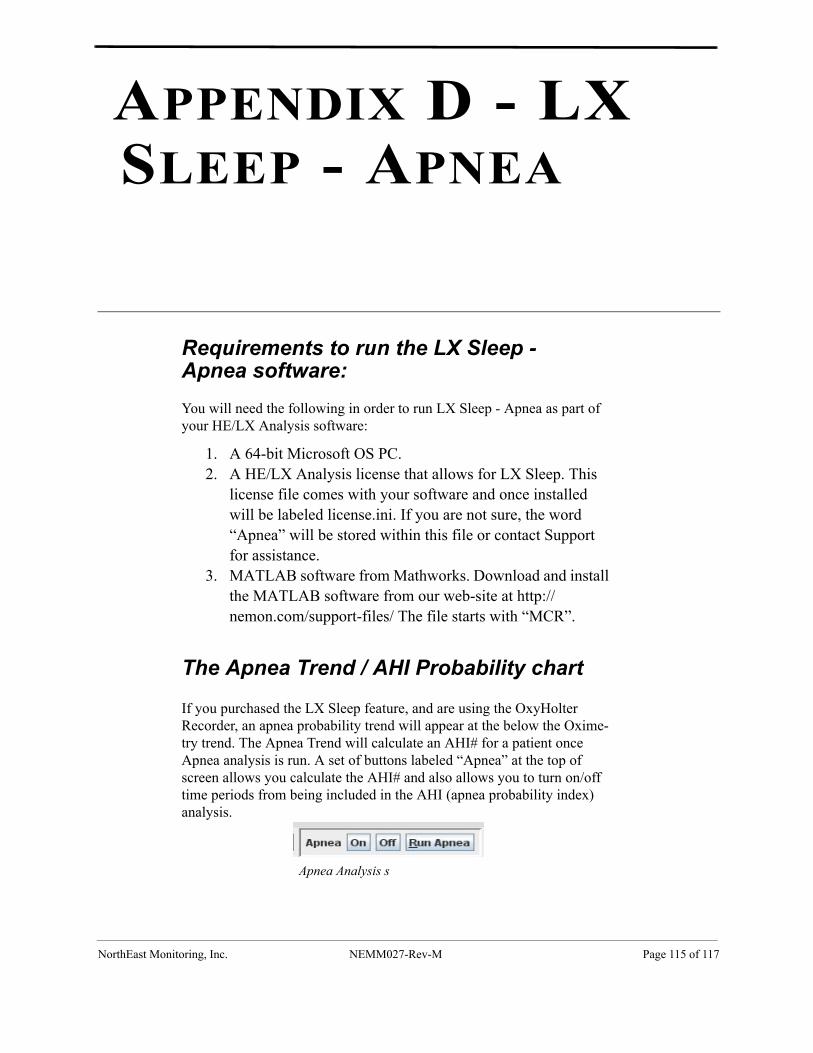
APPENDIX D - LX SLEEP - APNEA...
NorthEast Mon
Requirements to run the LX Sleep - Apnea software:
You will need the following in order to run LX Sleep - Apnea as part of your HE/LX Analysis software:
1. A 64-bit Microsoft OS PC.2. A HE/LX Analysis license that allows for LX Sleep. This
license file comes with your software and once installed will be labeled license.ini. If you are not sure, the word “Apnea” will be stored within this file or contact Support for assistance.
3. MATLAB software from Mathworks. Download and install the MATLAB software from our web-site at http://nemon.com/support-files/ The file starts with “MCR”.
The Apnea Trend / AHI Probability chart
If you purchased the LX Sleep feature, and are using the OxyHolter Recorder, an apnea probability trend will appear at the below the Oxime-try trend. The Apnea Trend will calculate an AHI# for a patient once Apnea analysis is run. A set of buttons labeled “Apnea” at the top of screen allows you calculate the AHI# and also allows you to turn on/off time periods from being included in the AHI (apnea probability index) analysis.
Apnea Analysis s
itoring, Inc. NEMM027-Rev-M Page 115 of 117
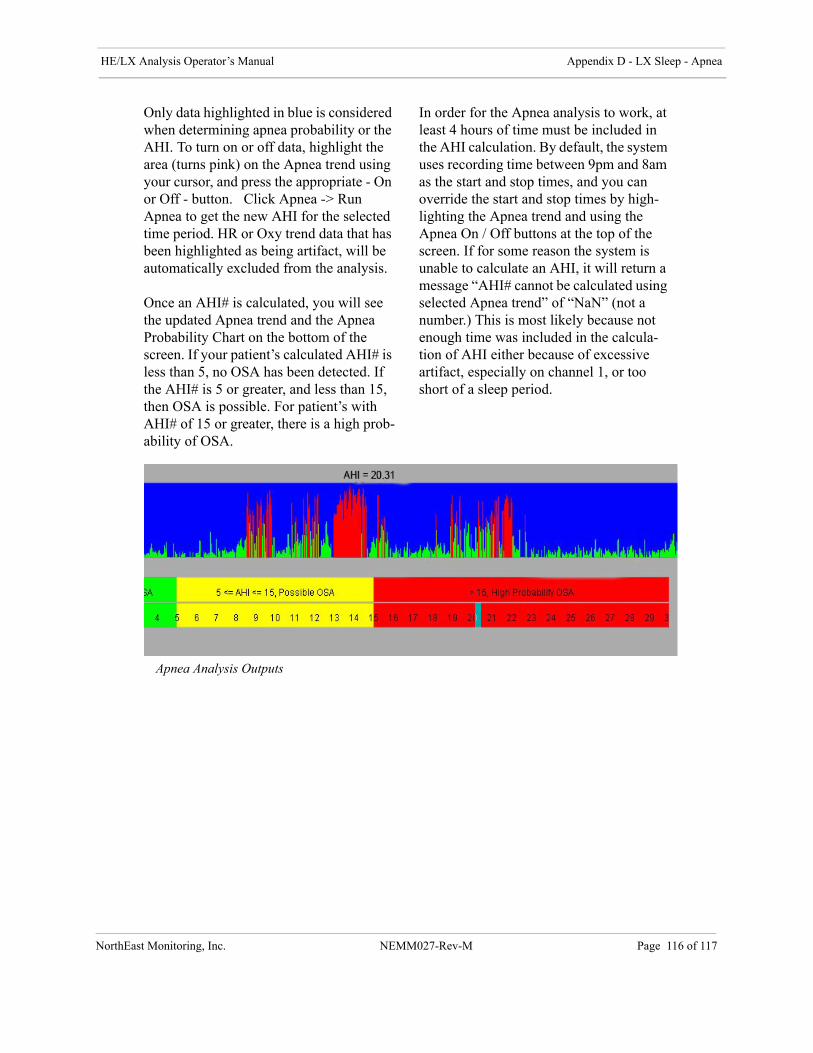
HE/LX Analysis Operator’s Manual Appendix D - LX Sleep - Apnea
NorthEa
Only data highlighted in blue is considered when determining apnea probability or the AHI. To turn on or off data, highlight the area (turns pink) on the Apnea trend using your cursor, and press the appropriate - On or Off - button. Click Apnea -> Run Apnea to get the new AHI for the selected time period. HR or Oxy trend data that has been highlighted as being artifact, will be automatically excluded from the analysis.
Once an AHI# is calculated, you will see the updated Apnea trend and the Apnea Probability Chart on the bottom of the screen. If your patient’s calculated AHI# is less than 5, no OSA has been detected. If the AHI# is 5 or greater, and less than 15, then OSA is possible. For patient’s with AHI# of 15 or greater, there is a high prob-ability of OSA.
In order for the Apnea analysis to work, at least 4 hours of time must be included in the AHI calculation. By default, the system uses recording time between 9pm and 8am as the start and stop times, and you can override the start and stop times by high-lighting the Apnea trend and using the Apnea On / Off buttons at the top of the screen. If for some reason the system is unable to calculate an AHI, it will return a message “AHI# cannot be calculated using selected Apnea trend” of “NaN” (not a number.) This is most likely because not enough time was included in the calcula-tion of AHI either because of excessive artifact, especially on channel 1, or too short of a sleep period.
Apnea Analysis Outputs
st Monitoring, Inc. NEMM027-Rev-M Page 116 of 117

APPENDIX E - TEST ISSUES.
The following is a list of test issues that have been identified in this version of the software:
NorthEast M
1. When modifying the front page, a user cannot cut and paste from Microsoft Word. The user can cut and paste from Notepad.
2. If you use installer to Modify software, the desktop links may break. Running the installer again in Repair mode will fix the links.
3. The status window may not appear while analyzing local patients. 4. Calibration on Oxy and 12-lead patient will cause the system to not recognize the
recording type until an update is performed. An Update can be performed at any time from Review on the toolbar.
5. For Sleep patients, if the user changes the times that are included in Full Disclo-sure on the Reporting screen, the AHI# will have to be recalculated.
6. For Sleep patients, if the user updates the trend, you will need to do a manual Update before calculating AHI# as the system will update the data again once you leave the trend screen and the AHI calculation will be lost.
7. 12-lead strips labels are in English for Russian translations. Unicode characters cannot appear in these fields.
8. For network installations, if oximetry desaturation is turned on or off, the system will become very slow.
9. When the operating system is set to a region that uses commas instead of periods to reflect decimal points, the Spectral Analysis will be unable to create 24-Hour Plot and the Frequency Domain Table.
10. Some screen preferences are lost after doing an update or reanalyzing. This includes Morphology on the Page screen, as it always reverts to Single mode.
11. Desaturation Table - Right clicking and double-clicking on a line does not func-tion as advertised.
12. Once a part of the recording has been labeled as Desat, it will stay as Desat even if oxymetry settings are changed. The only way to fix this is to manually relabel the trend to not be desat.
13. 24 hour plot fails when Spectral Size is set to 100 secs in Settings.14. SVPB counts on the Critical Event screen are not being updated properly when a
change in the Scanning Criteria > SVPB prematurity causes the SVPB counts to go down. This can only be fixed by reanalyzing.
15. Irregular RR strips are not being created. Strips can be saved manually from Crit-ical Events.
onitoring, Inc. NEMM027-Rev-M Page 117 of 117