help in defined contribution plans: 2006 through 2010
TRANSCRIPT

Help in Defined Contribution Plans: 2006 Through 2010
September 2011
Which type of helpis best for me?
Is getting help worth it? Am I on the
right track?
Markets are dropping.What should I do?

Help in Defined Contribution Plans: 2006 Through 2010 | 1
Table of ContentsExecutive Summary 3
IntroductionAbout This Report 5Data Sample Information 6Defining Help 8
ResultsParticipants Using Help Are Better Off 9Non-Help Participants Have Higher Risk Levels 11Non-Help Participants Have Wider Risk Ranges 13Inappropriate Risk Levels Negatively Impact Returns 15Inefficient Portfolios Negatively Impact Returns 19A Closer Look at 2009: Non-Help Participant Behavior Hurt Results 24
UsageHelp Usage Is Growing 29Help Usage Varies by Plan 31Automatics and Plan Design Have the Biggest Impact on Help Usage 32 Case Study: Improving Help Usage and Portfolios Through Plan Design 33
ProfilesWho Is Using Help? Who Is Not? 35Type of Help Used Varies by Age 37Type of Help Used Varies by Account Balance 38Predicting Type of Help Usage 39
Conclusion 41
Implications 42
Methodology AppendixResults 44Usage and Profiles 50

Help in Defined Contribution Plans: 2006 Through 2010 | 3
Executive SummaryThis report, Help in Defined Contribution Plans: 2006 Through 2010, looks at the impact of professional investment help—target-date funds, managed accounts, and online advice, collectively referred to as “Help” throughout this report—in employer-sponsored defined contribution plans. It includes analysis of eight large 401(k) plans representing more than 425,000 individual participants with $25 billion in plan assets. By linking participant Help usage with actual results, we were able to observe how participant behavior affected portfolio risk and returns during the five-year period between January 1, 2006 and December 31, 2010, which was one of the most volatile periods in the stock market’s history. This analysis extends the first edition of the report (Help in Defined Contribution Plans: Is It Working and for Whom? (2010)), which examined the period between 2006 and 2008.
The following are the key findings of our analysis:
Participants that use Help are significantly better off than those who go it alone.•Acrossallagegroupsandarangeofmarketconditions,participantsusingHelp
(“Help Participants”) experienced higher returns with lower risk than those not using Help (“Non-Help Participants”).
•Sincethelastreport,theannualinvestmentperformancegapbetweenHelpPartici-pants and Non-Help Participants grew from 1.86% to 2.92%, net of fees.1 This report includes the same plans plus others and analyzes results over a longer time period.
•ThereturnsgapbetweenHelpandNon-HelpParticipantswasgreatestduring2009whenthemarketwasrecoveringfromthefinancialcrisisof2008.Specifically, investing mistakes and market timing behaviors observed in the Non-Help population had a particularly negative impact on Non-Help Participant investment performance in 2009.
More participants are using Help; automatic enrollment into qualified default investment alternatives (QDIAs) and plan re-enrollment have the biggest impact.•Nearlyone-third(30%)of401(k)participantsusedprofessionalHelpbytheendof
2010, up from a quarter (25%) of participants from the first edition of this report.2
1 All returns reported in this research are net of fees, including fund-specific management and expense fees, and managed account fees where applicable.
2 In the first edition of this report, the data for Help usage were taken from the period between April and July 2009. Usage data in this report were taken between July 2010 and January 2011.
4 | Help in Defined Contribution Plans: 2006 Through 2010
•Moreplansponsorscurrentlyauto-enrollnewhiresintheir401(k)plans.Seven out of eight had auto-enrollment in this report compared to five out of seven in the previous report.
•Re-enrollingallplanparticipantsintoaQDIA3 can have a significant positive impact on Help usage. For example, one plan sponsor that re-enrolled their entire plan into managedaccountssawHelpusageofmorethan50%.Asaresult,theyexperiencedsignificant improvement in the risk and diversification of Help Participant portfolios.
Age is the strongest predictor of Help usage.•Youngerparticipantswithsmalleraccountbalancesaremostlikelytousetarget-date
funds, while younger participants with larger account balances are more likely to use online advice. Near-retirees are most likely to use managed accounts.
•MultipleformsofHelparerequiredtoreachadiverseparticipantpopulation. Plan sponsors not offering all three types of Help risk missing significant population segments.
Near-retirees are in the most need of Help.•Morethananyotheragegroup,BabyBoomersusedprofessionalHelpthemost
(44% of Help users were Boomers).
•Non-HelpParticipants,particularlythosenearretirement(age50andolder),had inappropriate glide paths. Near-retirees had the widest variability in risk levels with someinthisagegrouphavingrisklevelsabovethatoftheS&P500index.Thefailuretoreduce risk as they age could potentially threaten participants’ ability to retire should the market suddenly decline, as it did in 2008, or go through a particularly volatile period, such as the third quarter of 2011.
•Near-retireesnotusingHelpshowedthehighestincidenceof“panic”duringthe2008downturn with trading activity that led to significantly worse investment performance results in 2009.
3 A “qualified default investment alternative,” is defined in the Department of Labor’s final rule: Default Invest-ment Alternatives Under Participant Directed Individual Account Plans, 72 Fed. Reg. 60452 (Oct. 24, 2007).
Help in Defined Contribution Plans: 2006 Through 2010 | 5
Introduction: About This ReportThis report analyzes the impact and use of employer-provided professional investment help in defined contribution plans.
It builds upon the first edition of this research Help in Defined Contribution Plans: Is It Working and for Whom?,whichAonHewittandFinancialEnginespublishedinearly2010. While the previous edition of this report included seven large plan sponsors and looked at the period between 2006 and 2008, this report includes eight large plan sponsors and examines the five-year period from 2006 through 2010.
This period—particularly 2008 through 2010—was one of the most volatile periods in recent market history, and includes both the financial crisis of 2008 and the subsequent recovery in 2009. While the previous edition found that participants using professional investment help were better off than those who did not use Help, we wanted to evaluate whether the results held up over a longer period of time and across more 401(k) plans.
Sinceitscreationmorethan30yearsago,the401(k)hasevolvedtobecomethecorner-stoneofthenation’sretirementsystem.WithmostAmericansnolongerabletorelyuponadefinedbenefitpensionplan,manywillrelyontheir401(k)accountsandSocialSecurityas their primary sources of retirement income. To that end, plan sponsors and public policymakers have been focused on making the 401(k) as effective as possible. The recent movementtoautomaticenrollmentandthedesignationofQDIAshashelpedsponsors assist participants who are unable or unwilling to make investment decisions on their own.
Over the last 15 years, employers have been steadily offering more types of professional in-vestment help to defined contribution participants. Today, the majority of large employers offer some type of professional help to participants, often in combination with automatic enrollment.AccordingtoAonHewitt’sTrends and Experience in Defined Contribution Plans 2011 study of more than 500 employers, 81% of employers currently offer target-date funds, up from 71% in 2009. In addition, one-third (37%) offer online advice, up from 32% in 2009, and the number of plans offering managed accounts has nearly tripled in the last three years, increasing from 11% in 2007 to 29% in 2011.
ThisreporthasbeenacollaborativeeffortbetweenAonHewittandFinancialEngines.Eachcompanycontributedcomplementaryparticipantdata,financialtechnology,andportfolio analytics, which helped make this report possible. It is our hope that plan sponsors, providers, and policymakers will find this data useful and use it to help more Americanworkersachievesecureretirements.

6 | Help in Defined Contribution Plans: 2006 Through 2010
Introduction: Data Sample InformationUsage and Profiles
The data included in this report are drawn from eight large 401(k) plans; the sponsors oftheseplansarejointclientsofAonHewittandFinancialEngines.The401(k)plansincluded vary in size from 8,200 to more than 145,000 participants. Collectively, the plans represent more than 425,000 participants with over $25 billion in assets.
AlleightplansmetthecriterionofhavingallthreeformsofHelp(target-datefunds,managed accounts, and online advice) available to their plan participants, although they introducedthematdifferenttimes.SevenoftheeightplansinthisreportwerealsointheUsage and Profiles section of the first edition of this report.
In terms of plan design, seven of the eight plan sponsors automatically enroll new employees in the 401(k) plan and automatically invest employees in a target-date fund or managed account.
The following table provides a general overview of the plans included in the study:
Plan Feature
Auto-Enrollment
Target-Date Funds as Default Investment
Managed Account as Default Investment
Plans with Feature
7
6
1
Company Stock as Investment Option 7
Plan Implementation of...
Target-Date Funds
Target-Date Funds as Default
Managed Accounts
Date Range
April 2005–December 2008
June 2007–December 2008
September 2004–February 2010
Managed Accounts as Default February 2010
Online Advice July 2000–February 2010
The Usage and Profiles sections of the report rely on 401(k) account and savings data collected between July 3, 2010 and January 4, 2011. We determined each individual participant’s Help classification based on the form of Help, if any, the participant was usingwhenthedatasnapshotoftheparticipant’s401(k)accountwastaken.Similarly, plan design information (such as company stock being an investment option) was based on the rules in place during the same 2010 time frame.
Help in Defined Contribution Plans: 2006 Through 2010 | 7
Results
TheResultssectionfocusesonparticipantportfolioreturnsandrisklevelsfromJanuary 2006throughDecember2010.FortheResultssectioninthepreviouseditionofthisreport, there were four plans that met the criterion of having returns data for at least one formofHelpavailablefortheentirespanof2006–2008.FortheResultssectioninthisreport, eight plans, including the four from the original report, met the criterion of having returns data for at least one form of Help available for the entire span of 2006–2010.
8 | Help in Defined Contribution Plans: 2006 Through 2010
4 Trends and Experience in 401(k) Plans 2011, Aon Hewitt. 5 The Usage and Profiles sections of the report rely on 401(k) account and savings data collected between July 3,
2010, and January 4, 2011. To be considered an online advice Help user, the participant would have had to use online advice in the 12-month period prior to this date range.
Introduction: Defining Help This report focuses on three of the most prevalent and fastest-growing types of professional investment help provided by employers in defined contribution plans today:4
•Target-datefunds
•Managedaccounts
•Onlineadvice
Throughout this report, we refer to all three types of professional investment help collectively as “Help.” In addition, we have applied the following requirements to each type of Help:
Target-date funds—Target-date funds are generally intended to be used for a participant’s entire 401(k) account holding. Therefore, for workers to qualify as receiving Help through target-date funds in this analysis, participants were required to have 95% or more of their 401(k) accounts invested in one or two target-date funds. Participants with less than 95% in target-date funds were categorized in the Non-Help group.
Managed accounts—Participants who enroll in a managed account program have their 401(k) accounts professionally managed by the managed account provider, relieving the participant from having to make ongoing investment decisions. To qualify as using Help through managed accounts, participants had to be currently enrolled in a managed account program.
Online advice—Online advice provides participants with specific savings and investment recommendations for their 401(k) accounts. It’s up to the participant to implement the advice. For workers to qualify as receiving online advice Help in this analysis, participants had to have used online advice within the last 12 months.5 Participants whose last usage of online advice was more than 12 months ago were categorized in the Non-Help group.
Non-Help Participants—Participants not using any of the three types of Help and those using one of the types of Help but failing to use it appropriately were placed in the Non-Help group.

Help in Defined Contribution Plans: 2006 Through 2010 | 9
6 Three types of help are evaluated in this report—target-date funds, managed accounts, and online advice. 7 Help in Defined Contribution Plans: Is It Working and for Whom?, 2010. 8 100 basis points = 1%. 9 All returns reported in this research are net of fees, including fund-specific management and expense fees, and
managed account fees where applicable. 10 Comparing the performance of individual Help methods would require additional data observations to create
a statistically valid estimate because some forms of Help, specifically target-date funds and online advice, were not well represented across all companies and all years in the five year sample. However, using the same methodology, based on a slightly smaller managed account sample than used in Figure 1, the annual investment performance improvement of the managed account member population was 18 bps higher than for all Help users combined, net of fees.
Results: Participants Using Help Are Better OffIn this section, we compare portfolio returns and risk levels of 401(k) participants using Help6 (Help Participants) with those not using Help (Non-Help Participants) at eight companiesoverthefive-yearperiodfrom2006through2010.Similartothefirsteditionofthis report published in 20107, we again found that across all age groups, Help Participant portfolios performed better than those of Non-Help Participants.
Age
Annu
al R
etur
n
14%
12%
10%
8%
6%
4%
2%
FIGURE 1: MEDIAN RETURNS
25-30 30-35 35-40 40-45 45-50 50-55 55-60 > 60
Help Non-Help
Figure 1 shows the median returns by age group for both Help and Non-Help Participants. When considering the difference in median returns across the different age groups, Help Participants, on average, experienced returns nearly 3% (292 basis points)8 higher than Non-Help Participants, net of fees.9, 10 The performance difference ranged from 2.53% to 3.40% across the age groups.
It’s important to note that the returns shown in Figure 1 are median annual returns where each annual return for each participant is considered an observation. Thus, a

10 | Help in Defined Contribution Plans: 2006 Through 2010
11 The previous report examined the annual returns of participants in four companies in the years 2006–2008. This report includes annual returns of participants in eight companies and adds years 2009 and 2010. Thus, the previous report included the severe downturn in 2008 but not the dramatic rebound in 2009.
participant who is in the analysis for all five years will have five separate observations inthedataset.Aparticipantwhoisintheanalysisforonlytwoyearswillhavetwo observations in the data set, and a participant who is in the analysis for only one year will have one observation in the data set. We equal-weight the years, so that increases and any decreases in the number of participants across the years do not skew the results.
This is different from mean (or average) compound returns, which would have one obser-vation for each participant. This would be calculated by compounding each participant’s returns over the five years in the report. Note that this would limit the data set to only those participants who have data available for all five years—a significant and potentially distorting limitation.
These results are similar to the previous edition of this report, in which we found that Help Participant portfolios outperformed those of Non-Help Participants by 1.86% (186 basis points), net of fees.
Aswelookatthetimeperiodanalyzedinthisreport,itisimportanttonotethatboth2008 and 2009 were particularly volatile years in terms of market performance, with the market going down precipitously in 2008 and rebounding dramatically in 2009.11 If we remove 2009, the overperformance of Help Participant portfolios, while still significant, is reduced to 2.19% (219 basis points). The unique circumstances of 2009 will be covered in detail at the end of this section.
The Value of Help
The investment performance difference of Help can have a meaningful impact on wealth accumulation over time. For example, using the return difference of 2.92% (292 basis points), suppose that two participants—one using Help and one not using Help—both invest$10,000atage45.Assumingthatbothparticipantsreceivethemedianreturns identified above in this analysis, the Help Participant could have 70% more wealth at age 65 ($71,400) than the Non-Help Participant ($42,100). Using the more modest return difference of 2.19% (219 basis points), and the same assumptions, the Help Participant could have 55% more wealth at age 65 ($48,900) than the Non-Help Participant ($31,500).
There are two primary reasons behind the poor portfolio performance of Non-Help Participants: inappropriate risk levels and inefficient portfolios.
We’ll further illustrate the impact of these common investing mistakes in the following sections.

Help in Defined Contribution Plans: 2006 Through 2010 | 11
12 All reported risk levels are forward-looking annual standard deviation values. Additional details can be found in the Methodology Appendix.
13 The Stock Index portfolio is based on the Standard and Poor’s S&P 500 Index and represents a diversified all-equity portfolio. The Bond Index portfolio is based on the Barclay’s Capital U.S. Aggregate Bond Index and represents a diversified all-fixed income portfolio. Additional details can be found in the Methodology Appendix.
Results: Non-Help Participants Have Higher Risk LevelsManagingportfolioriskisacriticalcomponentofinvesting,andNon-HelpParticipantsfrequentlyhaveportfolioswithinappropriatelevelsofrisk.Sometakeonfartoomuchrisk near retirement, while others are too conservative early in their careers.
One of the most common ways of measuring investment risk is to look at the standard deviation of returns, which indicates the likely variability of returns over a given time period.12 Using this as our measure of risk, we plotted the median risk levels of both Help and Non-Help Participants in Figure 2. For context, we also plotted the risk levels for two referenceportfolios:aStockIndexportfolioandaBondIndexportfolio.13
19%
13%
15%
11%
9%
7%
17%
FIGURE 2: MEDIAN PORTFOLIO RISK
> 60
Bond Index
55-6050-5545-5040-4535-4030-3525-30
Ris
k (A
nnua
l Sta
ndar
d D
evia
tion)
Age
Stock Index
Help
Non-Help
Asillustratedabove,HelpParticipantstendedtofollowanappropriateglidepathinwhichrisk starts out high for participants early in their careers and steadily “glides” downward for participants nearing retirement. In contrast, risk levels for Non-Help Participants actually increased in the 30–35 age range and did not show meaningful decreases until the 50–55 age range.
12 | Help in Defined Contribution Plans: 2006 Through 2010
Acrossallagegroups,HelpParticipantshadmedianrisklevelsrangingfrom10.6%to15.7%, while Non-Help Participants had median risk levels ranging from 14.2% to 16.7%. For participants age 60 and older, the difference in the risk levels between Help and Non-Help Participants was especially pronounced, highlighting the fact that older participants are in particular need of Help.
These results are consistent with our findings in the first edition of this report.
Help in Defined Contribution Plans: 2006 Through 2010 | 13
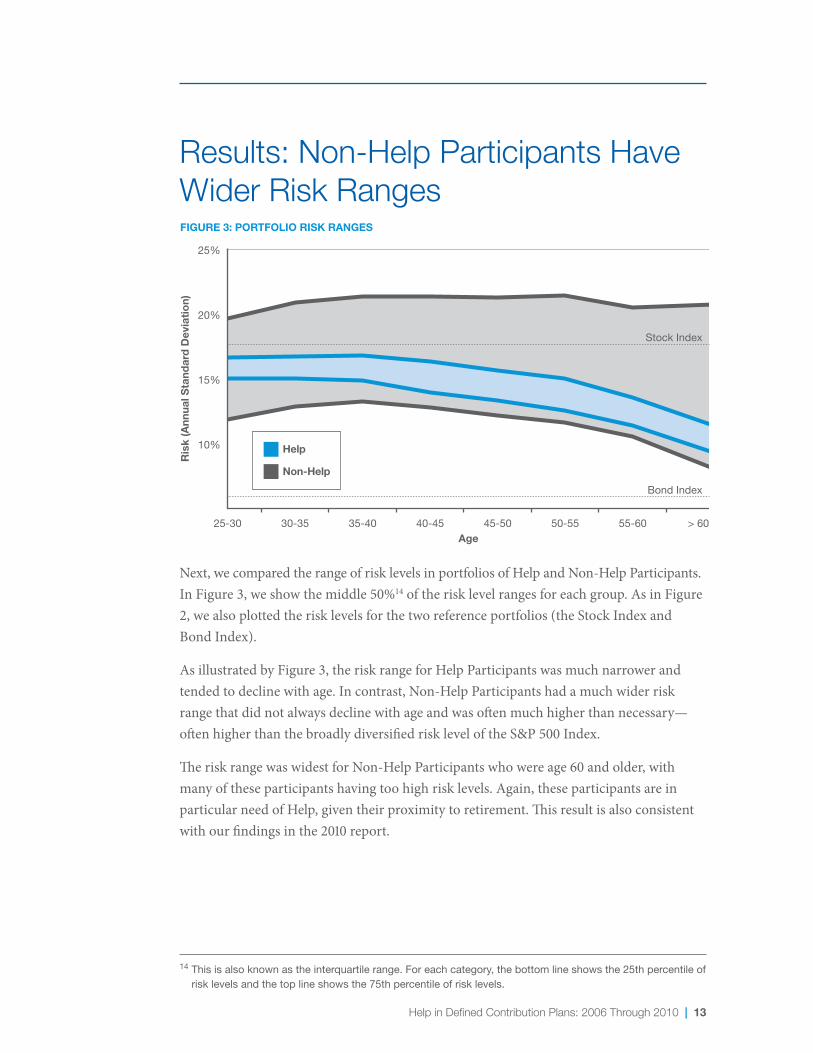
14 This is also known as the interquartile range. For each category, the bottom line shows the 25th percentile of risk levels and the top line shows the 75th percentile of risk levels.
Results: Non-Help Participants Have Wider Risk Ranges
25%
15%
10%
20%
FIGURE 3: PORTFOLIO RISK RANGES
> 60
Bond Index
55-6050-5545-5040-4535-4030-3525-30
Ris
k (A
nnua
l Sta
ndar
d D
evia
tion)
Age
Stock Index
Help
Non-Help
Next, we compared the range of risk levels in portfolios of Help and Non-Help Participants. In Figure 3, we show the middle 50%14oftherisklevelrangesforeachgroup.AsinFigure2,wealsoplottedtherisklevelsforthetworeferenceportfolios(theStockIndexandBond Index).
AsillustratedbyFigure3,theriskrangeforHelpParticipantswasmuchnarrowerandtended to decline with age. In contrast, Non-Help Participants had a much wider risk range that did not always decline with age and was often much higher than necessary— oftenhigherthanthebroadlydiversifiedriskleveloftheS&P500Index.
The risk range was widest for Non-Help Participants who were age 60 and older, with manyoftheseparticipantshavingtoohighrisklevels.Again,theseparticipantsareinparticular need of Help, given their proximity to retirement. This result is also consistent with our findings in the 2010 report.

14 | Help in Defined Contribution Plans: 2006 Through 2010
Based on these wider risk ranges, we can draw two main insights regarding the portfolios of Non-Help Participants:
1. Non-Help Participants, particularly near-retirees, have inappropriate glide paths Manyofthoseage50andoldertookasmuchriskastheiryoungercounterparts. The failure to reduce risk as Non-Help Participants get close to retirement could potentially threaten their ability to retire and generate needed income from their 401(k) should the market suddenly decline as it did in 2008 and again in 2011. In contrast, Help Participants have appropriate glide paths that reduce risk as they age.
2. Non-Help Participants have widely varying investment strategies Given the significantly wider risk ranges, Non-Help Participants across all age groups appeared to have far less consistency in their investment strategies. In addition, many Non-Help Participants had portfolios with risk levels significantly above that of a well-diversified all-equity portfolio. In contrast, Help Participants had much narrower risk ranges and tended to avoid the wide variances seen in the portfolios of Non-Help Participants.
Help in Defined Contribution Plans: 2006 Through 2010 | 15
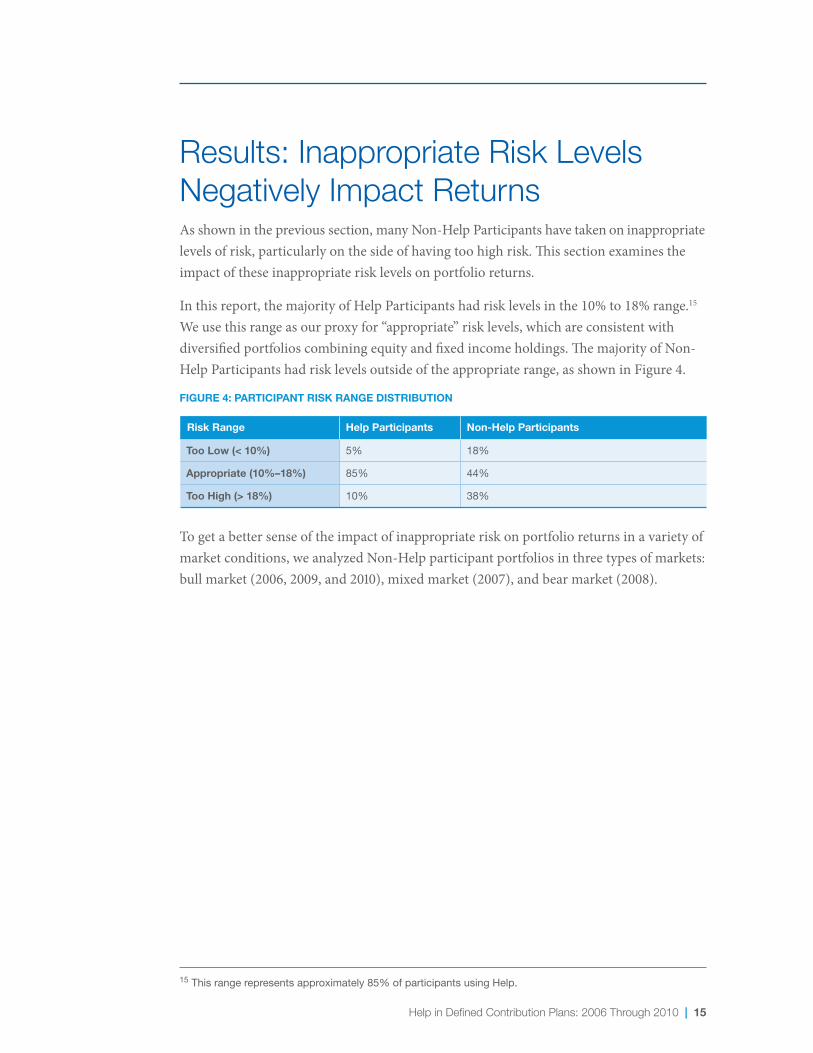
Results: Inappropriate Risk Levels Negatively Impact ReturnsAsshownintheprevioussection,manyNon-HelpParticipantshavetakenoninappropriatelevels of risk, particularly on the side of having too high risk. This section examines the impact of these inappropriate risk levels on portfolio returns.
In this report, the majority of Help Participants had risk levels in the 10% to 18% range.15 We use this range as our proxy for “appropriate” risk levels, which are consistent with diversified portfolios combining equity and fixed income holdings. The majority of Non-Help Participants had risk levels outside of the appropriate range, as shown in Figure 4.
FIGURE 4: PARTICIPANT RISK RANGE DISTRIBUTION
Risk Range Help Participants
Too Low (< 10%)
Appropriate (10%–18%)
Too High (> 18%)
5%
85%
10%
Non-Help Participants
18%
44%
38%
To get a better sense of the impact of inappropriate risk on portfolio returns in a variety of market conditions, we analyzed Non-Help participant portfolios in three types of markets: bull market (2006, 2009, and 2010), mixed market (2007), and bear market (2008).
15 This range represents approximately 85% of participants using Help.

16 | Help in Defined Contribution Plans: 2006 Through 2010
Bull Market (Rising)
25%
20%
15%
10%
5%
FIGURE 5: NON-HELP PARTICIPANT RETURNS (2006, 2009, 2010)16
30%27%24%21%18%15%12%9%6%3%
Annu
al R
etur
n
Risk Range
AppropriateRisk Range
During the bull market years of 2006, 2009, and 2010,17 Non-Help Participants taking on too low risk had returns that were significantly lower than Non-Help Participants with appropriate risk levels. Non-Help Participants with too high risk levels (beyond 18%) were not rewarded with higher returns. Therefore, Non-Help Participants with risk levels that were too high were taking on uncompensated risk. In other words, they did not receive higher returns for taking on additional risk.
These results are consistent with our findings in the first edition of this report.
16 To calculate the returns in Figure 5, we first computed the within-year median for each risk subcategory. Then we averaged these medians across the three years within risk subcategories. The same qualitative findings hold for each of the three years individually.
17 S&P total returns in 2006, 2009, and 2010 were 16%, 27%, and 15% respectively (Source: Standard and Poor’s Financial Services LLC).

Help in Defined Contribution Plans: 2006 Through 2010 | 17
Mixed Market (Flat)
10%
9%
7%
5%
3%
1%
8%
6%
4%
2%
FIGURE 6: NON-HELP PARTICIPANT RETURNS (2007)
30%27%24%21%18%15%12%9%6%3%
Annu
al R
etur
n
Risk Range
AppropriateRisk Range
In a mixed market (2007),18 Non-Help Participant returns were largely unrelated to underlying portfolio risk, with returns being generally flat across all risk levels.19 In general, the market neither rewarded nor punished participants for taking on higher levels of risk in 2007.20
18 The total return for the S&P 500 Index was 5% in 2007 (Source: Standard and Poor’s Financial Services LLC).19 Additional details can be found in the Methodology Appendix.20 We note increased volatility in the 21%–24% range. This is attributable to fewer observations within this range.
18 | Help in Defined Contribution Plans: 2006 Through 2010
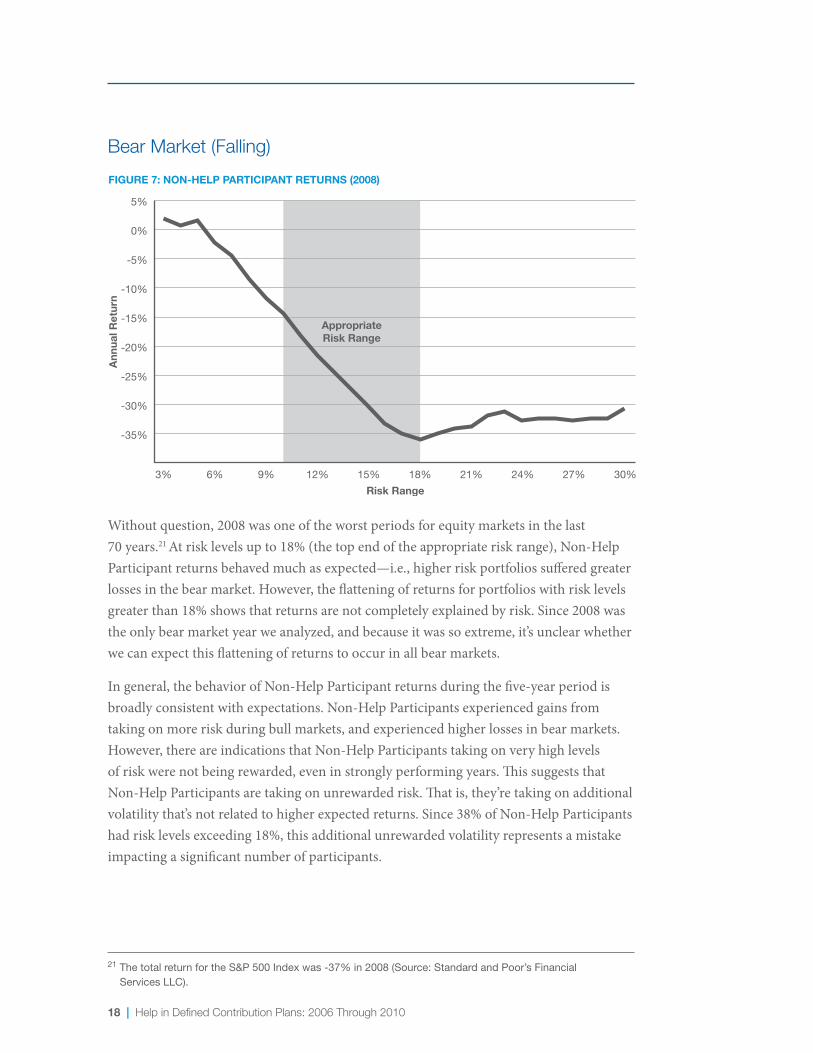
Bear Market (Falling)
5%
-5%
-15%
-25%
-35%
0%
-10%
-20%
-30%
FIGURE 7: NON-HELP PARTICIPANT RETURNS (2008)
30%27%24%21%18%15%12%9%6%3%
Annu
al R
etur
n
Risk Range
AppropriateRisk Range
Without question, 2008 was one of the worst periods for equity markets in the last 70 years.21 Atrisklevelsupto18%(thetopendoftheappropriateriskrange),Non-HelpParticipant returns behaved much as expected—i.e., higher risk portfolios suffered greater losses in the bear market. However, the flattening of returns for portfolios with risk levels greaterthan18%showsthatreturnsarenotcompletelyexplainedbyrisk.Since2008wasthe only bear market year we analyzed, and because it was so extreme, it’s unclear whether we can expect this flattening of returns to occur in all bear markets.
In general, the behavior of Non-Help Participant returns during the five-year period is broadly consistent with expectations. Non-Help Participants experienced gains from taking on more risk during bull markets, and experienced higher losses in bear markets. However, there are indications that Non-Help Participants taking on very high levels of risk were not being rewarded, even in strongly performing years. This suggests that Non-Help Participants are taking on unrewarded risk. That is, they’re taking on additional volatilitythat’snotrelatedtohigherexpectedreturns.Since38%ofNon-HelpParticipantshad risk levels exceeding 18%, this additional unrewarded volatility represents a mistake impacting a significant number of participants.
21 The total return for the S&P 500 Index was -37% in 2008 (Source: Standard and Poor’s Financial Services LLC).
Help in Defined Contribution Plans: 2006 Through 2010 | 19
Results: Inefficient Portfolios Negatively Impact ReturnsThe other major mistake Non-Help Participants often made was having inefficient portfolios.Aninefficientportfolioisaportfoliothat’sexpectedtoreceivelowerreturns for a given risk level than is possible given the available investment options. Inefficient portfolios can be caused by a variety of factors, including making poor asset class selections or selecting poor asset combinations within an asset class.22
To analyze inefficiency separately from inappropriate risk levels, we focused on Non- Help Participants that had constructed portfolios at appropriate risk levels—through either luck or skill. Given this assumption, we were able to determine the efficiency (or inefficiency) of their portfolios relative to portfolios with similar risk levels in the Help Participant population.
To conduct an apples-to-apples comparison, we separated the data so that the portfolios held by the two groups were as similar to each other as possible. This required three steps. First, we grouped portfolios into 1% risk level ranges.23Second,wecontrolledforany effects introduced by company stock holdings.24 Given the relatively small number of plan sponsors and years analyzed, unusually high or low individual company stock returns could significantly distort the comparison. To control for the wide range of company stock annual performance in this sample (in excess of -70% to +70%), we restricted our analysis to Help and Non-Help Participants who held 20% or less of their portfolios in company stock.25 In addition, we restricted our analysis to the risk level range in which Help is de-signed to function (between 10% and 18%).26 This risk range is consistent with diversified portfolios that combine equity and fixed income allocations.
22 For example, two common investment mistakes are the “1/N strategy” (in which participants invest an equal amount in available investment option regardless of suitability) and the “barbell strategy” (in which participants invest half in the highest risk option and half in the lowest risk option, mistakenly believing that it “averages out”).
23 All reported risk levels are forward-looking annual standard deviation values. Additional details can be found in the Methodology Appendix.
24 Seven of the plans in the Results portion of this report offered company stock as an investment option within their 401(k) plans, and one plan matched participant contributions in company stock.
25 In our sample, 47% of Non-Help Participants have company stock holdings over 20% when we equal weight each plan within each year and then equal weight each year.
26 Additionally, limited data on Help Participants beyond this range makes accurate comparisons difficult.
20 | Help in Defined Contribution Plans: 2006 Through 2010
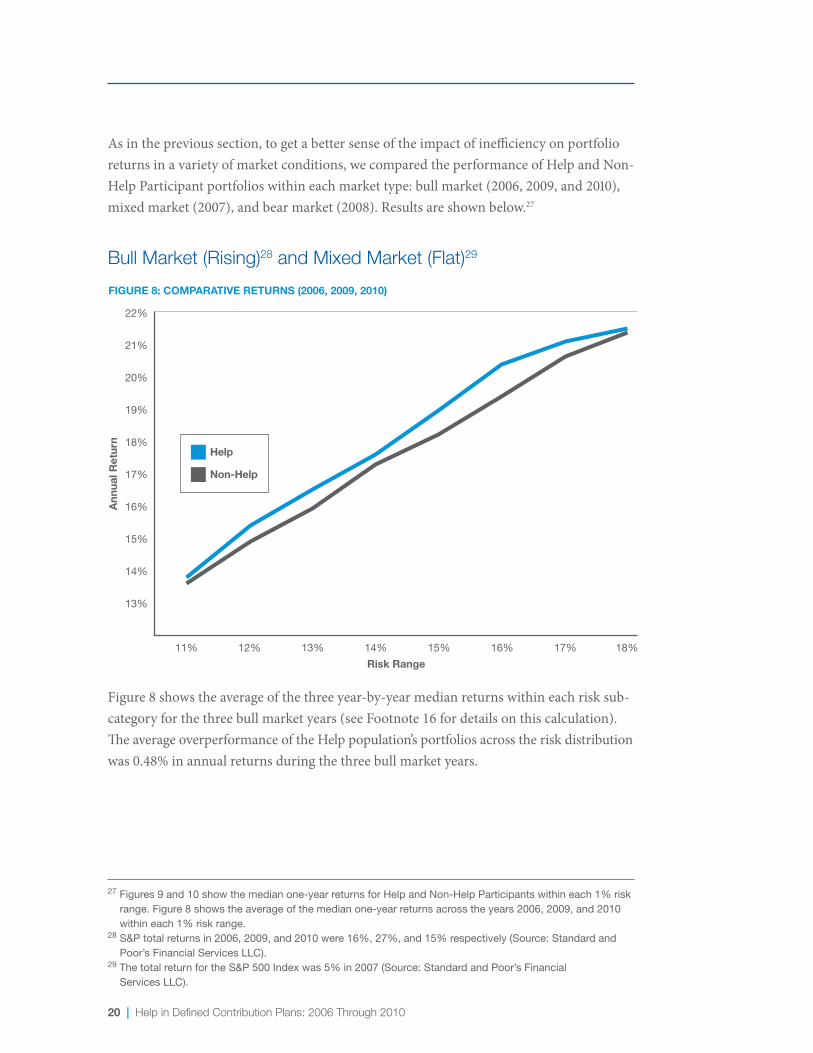
Asintheprevioussection,togetabettersenseoftheimpactofinefficiencyonportfolioreturns in a variety of market conditions, we compared the performance of Help and Non-Help Participant portfolios within each market type: bull market (2006, 2009, and 2010), mixedmarket(2007),andbearmarket(2008).Resultsareshownbelow.27
Bull Market (Rising)28 and Mixed Market (Flat)29
22%
18%
16%
14%
13%
15%
17%
19%
21%
20%
FIGURE 8: COMPARATIVE RETURNS (2006, 2009, 2010)
18%17%16%15%14%13%12%11%
Annu
al R
etur
n
Risk Range
Help
Non-Help
Figure 8 shows the average of the three year-by-year median returns within each risk sub-category for the three bull market years (see Footnote 16 for details on this calculation). The average overperformance of the Help population’s portfolios across the risk distribution was 0.48% in annual returns during the three bull market years.
27 Figures 9 and 10 show the median one-year returns for Help and Non-Help Participants within each 1% risk range. Figure 8 shows the average of the median one-year returns across the years 2006, 2009, and 2010 within each 1% risk range.
28 S&P total returns in 2006, 2009, and 2010 were 16%, 27%, and 15% respectively (Source: Standard and Poor’s Financial Services LLC).
29 The total return for the S&P 500 Index was 5% in 2007 (Source: Standard and Poor’s Financial Services LLC).
Help in Defined Contribution Plans: 2006 Through 2010 | 21
7.0%
6.0%
5.0%
5.5%
6.5%
FIGURE 9: COMPARATIVE RETURNS (2007)
18%17%16%15%14%13%12%11%
Annu
al R
etur
n
Risk Range
Help
Non-Help
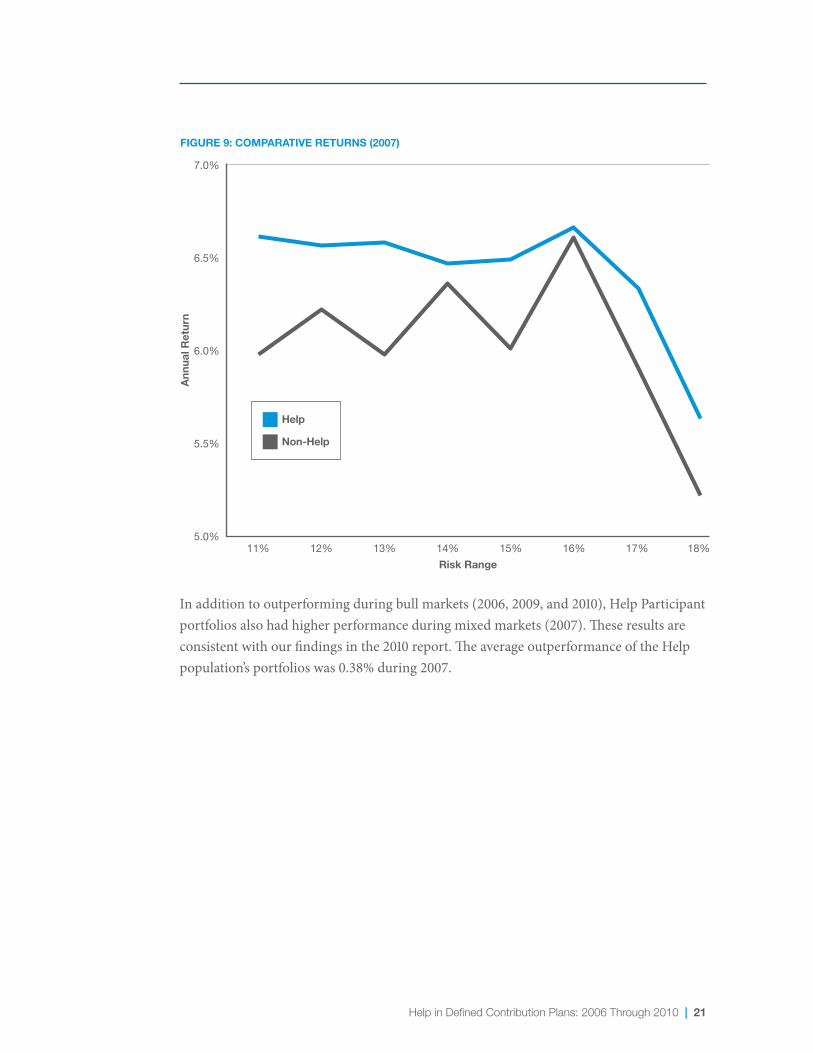
In addition to outperforming during bull markets (2006, 2009, and 2010), Help Participant portfolios also had higher performance during mixed markets (2007). These results are consistent with our findings in the 2010 report. The average outperformance of the Help population’s portfolios was 0.38% during 2007.
22 | Help in Defined Contribution Plans: 2006 Through 2010
Bear Market (Falling)30
-20%
-30%
-40%
-35%
-25%
FIGURE 10: COMPARATIVE RETURNS (2008)
18%17%16%15%14%13%12%11%
Annu
al R
etur
n
Risk Range
Help
Non-Help
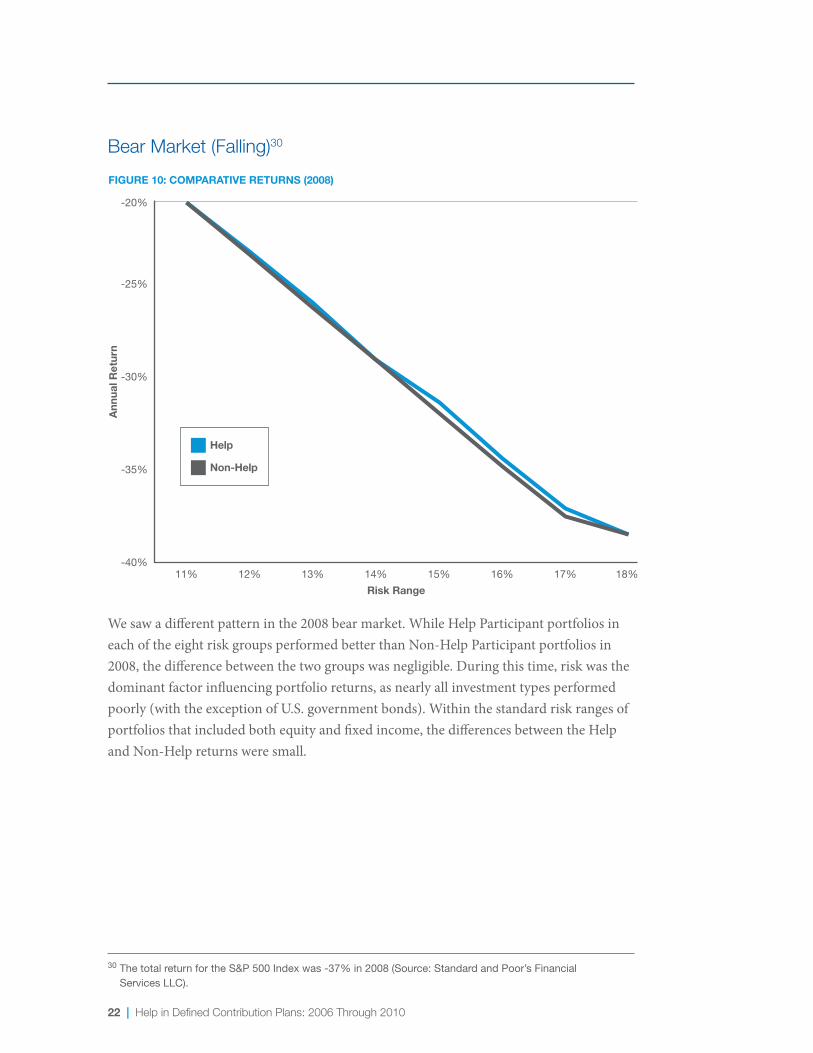
We saw a different pattern in the 2008 bear market. While Help Participant portfolios in each of the eight risk groups performed better than Non-Help Participant portfolios in 2008, the difference between the two groups was negligible. During this time, risk was the dominant factor influencing portfolio returns, as nearly all investment types performed poorly(withtheexceptionofU.S.governmentbonds).Withinthestandardriskrangesofportfolios that included both equity and fixed income, the differences between the Help and Non-Help returns were small.
30 The total return for the S&P 500 Index was -37% in 2008 (Source: Standard and Poor’s Financial Services LLC).
Help in Defined Contribution Plans: 2006 Through 2010 | 23
Risk-Adjusted Help Participant Returns Exceeded Non-Help Participant Returns 87% of the Time
To analyze the overall effectiveness of Help versus Non-Help, we looked at each risk range combination (10% to 11%, 11% to 12%, ... , up to 17% to 18%) for each year in the five-year period between 2006 and 2010, for a total of 40 comparison categories over five years. Help Participant portfolios outperformed Non-Help Participant portfolios in 35 out of the 40 risk-year categories, or 87% of the time.
24 | Help in Defined Contribution Plans: 2006 Through 2010
Results: A Closer Look at 2009: Non-Help Participant Behavior Hurt Results The year 2009 provided a unique environment in which to analyze participant behavior, as it was a strong bull market following a very bad bear market. Unfortunately, we found that two common errors made by Non-Help Participants became more pronounced during 2009. First, they suffered significantly lower returns due to holding inefficient portfolios. Second,thenumberofNon-HelpParticipantsholdingfartooconservativeportfoliosincreased immediately prior to the bull market of 2009. These examples highlight the importance and value of Help even in good market conditions.
Inefficient Portfolios
Muchlike2008,2009provedtobeaverybumpyrideforinvestors.However,unliketheprevious year, 2009 generated highly positive market returns. Typically, investors who hold higher portfolio risk during bull markets tend to get rewarded with higher returns. However, as we illustrated earlier, Non-Help Participant portfolios typically underper-formed those of Help Participants on a risk-adjusted basis. We made this determination by comparing the risk-adjusted returns of Help vs. Non-Help Participants in bull, bear, and mixed markets while excluding participants with large company stock holdings.
Help in Defined Contribution Plans: 2006 Through 2010 | 25
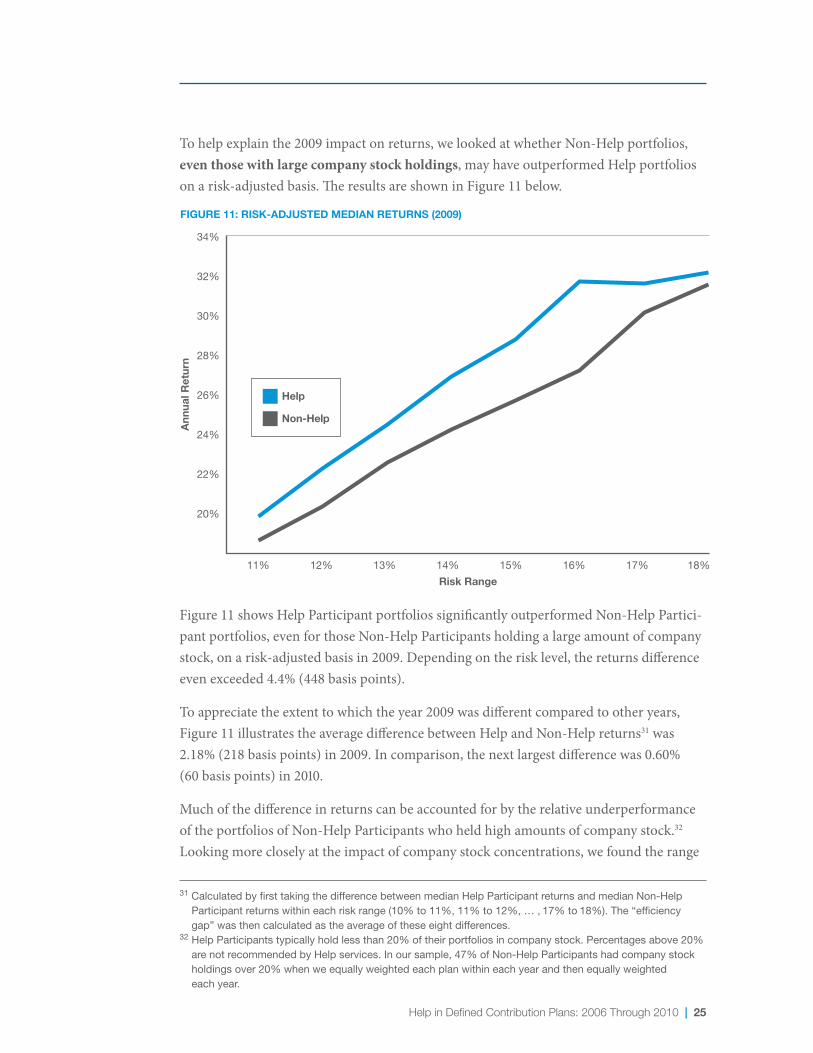
To help explain the 2009 impact on returns, we looked at whether Non-Help portfolios, even those with large company stock holdings, may have outperformed Help portfolios on a risk-adjusted basis. The results are shown in Figure 11 below.
34%
30%
20%
22%
26%
24%
28%
32%
FIGURE 11: RISK-ADJUSTED MEDIAN RETURNS (2009)
18%17%16%15%14%13%12%11%
Annu
al R
etur
n
Risk Range
Help
Non-Help
Figure 11 shows Help Participant portfolios significantly outperformed Non-Help Partici-pant portfolios, even for those Non-Help Participants holding a large amount of company stock, on a risk-adjusted basis in 2009. Depending on the risk level, the returns difference even exceeded 4.4% (448 basis points).
To appreciate the extent to which the year 2009 was different compared to other years, Figure 11 illustrates the average difference between Help and Non-Help returns31 was 2.18% (218 basis points) in 2009. In comparison, the next largest difference was 0.60% (60 basis points) in 2010.
Muchofthedifferenceinreturnscanbeaccountedforbytherelativeunderperformanceof the portfolios of Non-Help Participants who held high amounts of company stock.32 Looking more closely at the impact of company stock concentrations, we found the range
31 Calculated by first taking the difference between median Help Participant returns and median Non-Help Participant returns within each risk range (10% to 11%, 11% to 12%, … , 17% to 18%). The “efficiency gap” was then calculated as the average of these eight differences.
32 Help Participants typically hold less than 20% of their portfolios in company stock. Percentages above 20% are not recommended by Help services. In our sample, 47% of Non-Help Participants had company stock holdings over 20% when we equally weighted each plan within each year and then equally weighted each year.
26 | Help in Defined Contribution Plans: 2006 Through 2010
of the annual returns varied widely among the stocks offered in the employer 401(k) plans in this report.33Acrossallfiveyears,annualreturnsofthesestocksvariedinexcessof +/-70%.Incontrast,therangeoftheS&P500Indexannualreturnoverthesameperiodvaried from -37% to +27%. In other words, individual company stocks represented a much more risky form of investment compared to a diversified fund.
Non-Help portfolios underperformed Help portfolios with the same risk in four out of five analyzed years, with 2009 being the year when Non-Help Participants’ portfolios did especially poorly on a risk-adjusted basis.34AstherewererelativelyfewNon-HelpParticipants who held the majority of their assets in stocks that outperformed the market, overall, Help Participant portfolios outperformed the Non-Help Participant portfolios by a large margin when comparing median returns.
33 Seven of the eight plans in the Results section of this report offer company stock in their defined contribution plan.
34 Non-Help Participants within an appropriate risk level (i.e., in the 10%–18% range) that also had large company stock holdings would have underperformed the same risk portfolios belonging to Help Participants because in order to fall within the 10%–18% range, Non-Help Participants would have had to offset company stock holdings by extremely low risk investments such as a money market fund. Such portfolios are often called “barbell portfolios” because of the high concentrations in the ends of the risk spectrum.
Help in Defined Contribution Plans: 2006 Through 2010 | 27
35 Total return for the S&P 500 Index. 36 Barclays Capital U.S. Aggregate Bond Index.
Extremely Conservative Portfolios
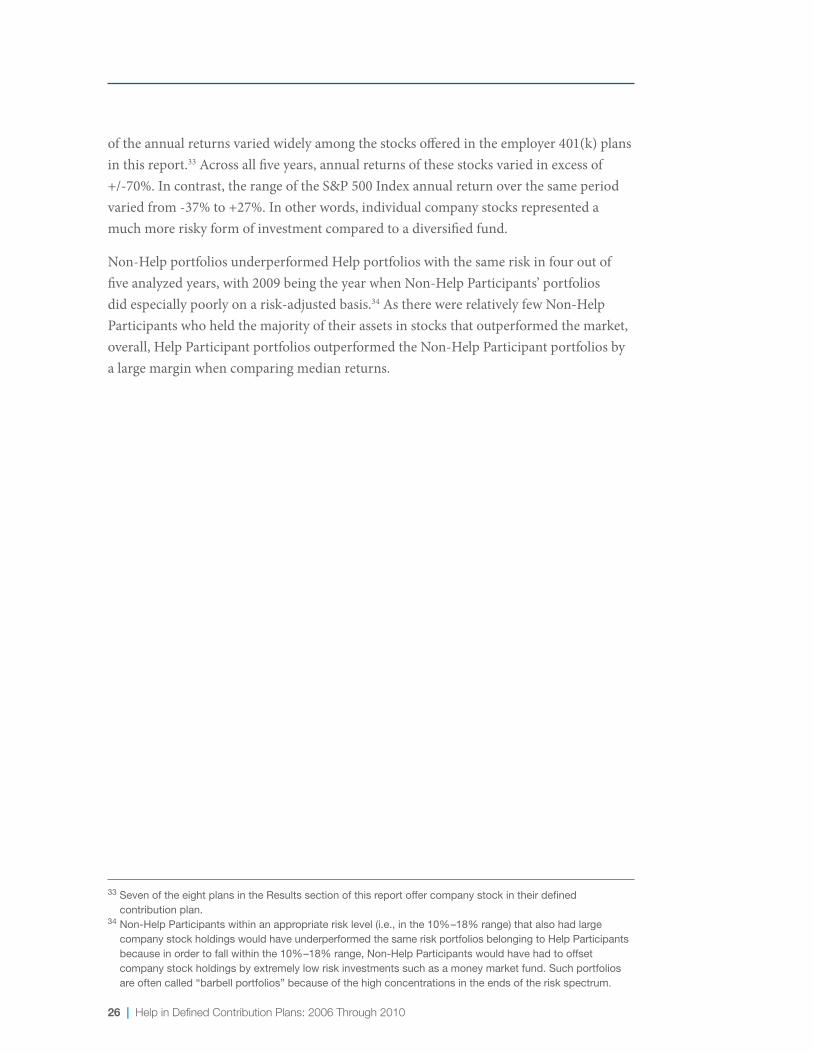
For this section, we looked at the percentage of Non-Help Participants who had less than 5% of their portfolios invested in equities, our proxy for “too conservative”. This was calculated for each age group as of the end of each year. The results showed troubling pat-terns over the years analyzed. Looking at the end of 2005, 2006, and 2007, the percentage of Non-Help Participants (within each age group) who were too conservative remained relatively stable. By the end of 2008, there were significant increases, especially for the oldest age groups. By the end of 2009, the percentage of Non-Help Participants with too conservative portfolios had decreased slightly but was still above end-of-2007 levels. Resultsfortheendof2007totheendof2009areshownbelow.
Age
Non
-Hel
p Pa
rtic
ipan
ts
20%
18%
16%
14%
12%
10%
8%
6%
4%
2%
FIGURE 12: VERY CONSERVATIVE NON-HELP PARTICIPANT PORTFOLIOS (2007-2009)
2007
2008
2009
> 6055-6050-5545-5040-4535-4030-3525-30
One major reason for the large increase in too conservative portfolios between the end of 2007andtheendof2008istherelativereturnofequityandfixedincomemarkets.Equitymarkets returned -37.00%35 in 2008 while fixed income markets returned +5.24%.36 If participants simply held on to their existing investments (i.e., followed a buy-and-hold strategy), we would expect to see a larger percentage falling below the 5% equity threshold as the equity portion of their portfolio decreased in value while the value of the fixed income portion increased.
28 | Help in Defined Contribution Plans: 2006 Through 2010
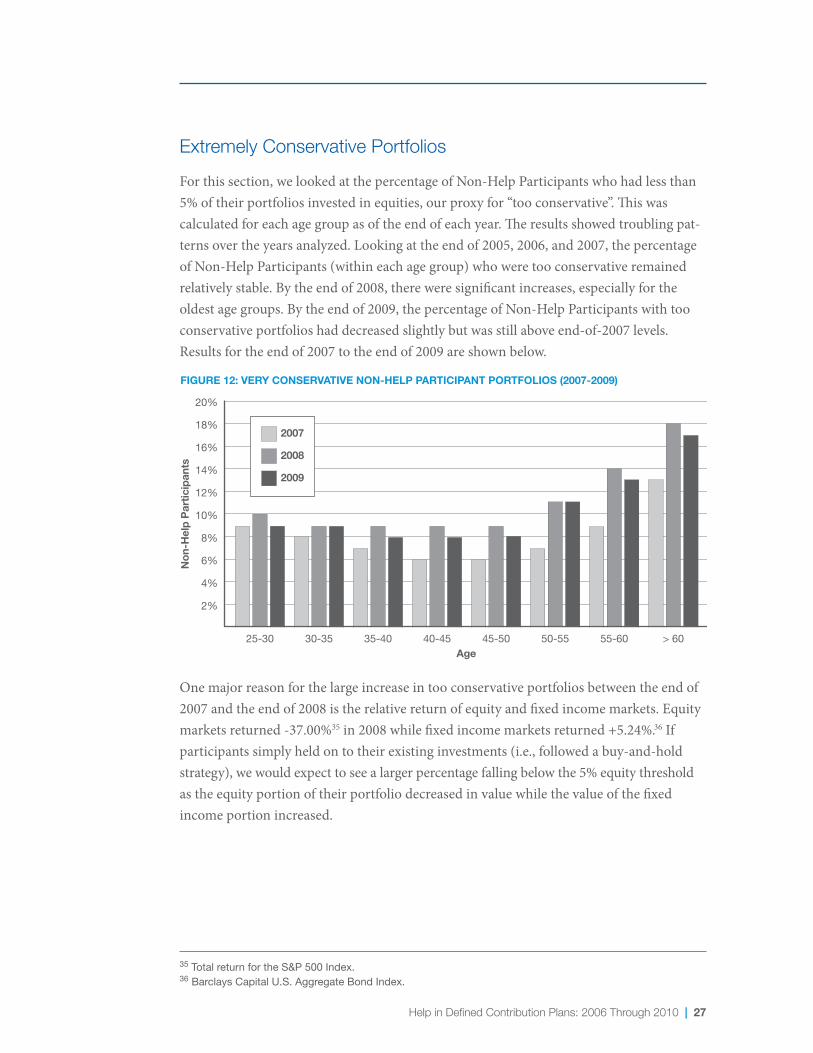
To eliminate changes due to market movement, we created an even more stringent test by calculating the percentage of Non-Help Participants who held 100% of their assets in eithercashorbonds.Resultsasoftheendof2007,2008,and2009areshownbelowinFigure 13.
Age
Non
-Hel
p Pa
rtic
ipan
ts
20%
18%
16%
14%
12%
10%
8%
6%
4%
2%
FIGURE 13: NON-HELP PARTICIPANT PORTFOLIOS HOLDING NO EQUITIES (2007-2009)
2007
2008
2009
> 6055-6050-5545-5040-4535-4030-3525-30
Applyingthismorestringenttestreduced,butdidnoteliminate,theincreaseinNon-HelpParticipants with very conservative portfolios between the end of 2007 and the end of 2008. From this, we conclude that the increase in too conservative portfolios was at least partially due to conscious decisions by the Non-Help Participants. This market timing behaviorwasgreatestamongnear-retirees(thoseage50andolder).Andbecauseend-of-2008 values were essentially unchanged by the end of 2009, these very conservative Non-Help Participants failed to benefit from the market recovery in 2009—a year when the equity market did particularly well.37
The increase in Non-Help Participants with unusually conservative portfolios was due to either a failure to rebalance their portfolios even during the most volatile market condi-tions, or because participants panicked and chose to get out of the equity market. In most years, the majority of participants don’t rebalance, and this inertia can mean lower returns due to inappropriate risk levels or poorly diversified allocations.38 In this analysis, we see evidence that a fraction of participants did seem to trade, but in a way that hurt them in 2009. Figure 12 illustrates that the net impact of these participants’ behavior is that a sizeable fraction had very conservative portfolios at the beginning of a very strong market recovery in 2009.39
37 The total return for the S&P 500 Index was 27% in 2009. 38 See Aon Hewitt’s Benchmark Universe 2011 report.39 Disentangling the cause of overly conservative allocations into these two contributing factors is of secondary
interest but beyond the scope of this analysis.
Help in Defined Contribution Plans: 2006 Through 2010 | 29
40 Total target-date fund usage (appropriate and inappropriate) is 54.5% when looking at Help and Non-Help Participants.
41 Total online advice usage (including less frequent users) is 13.6%.
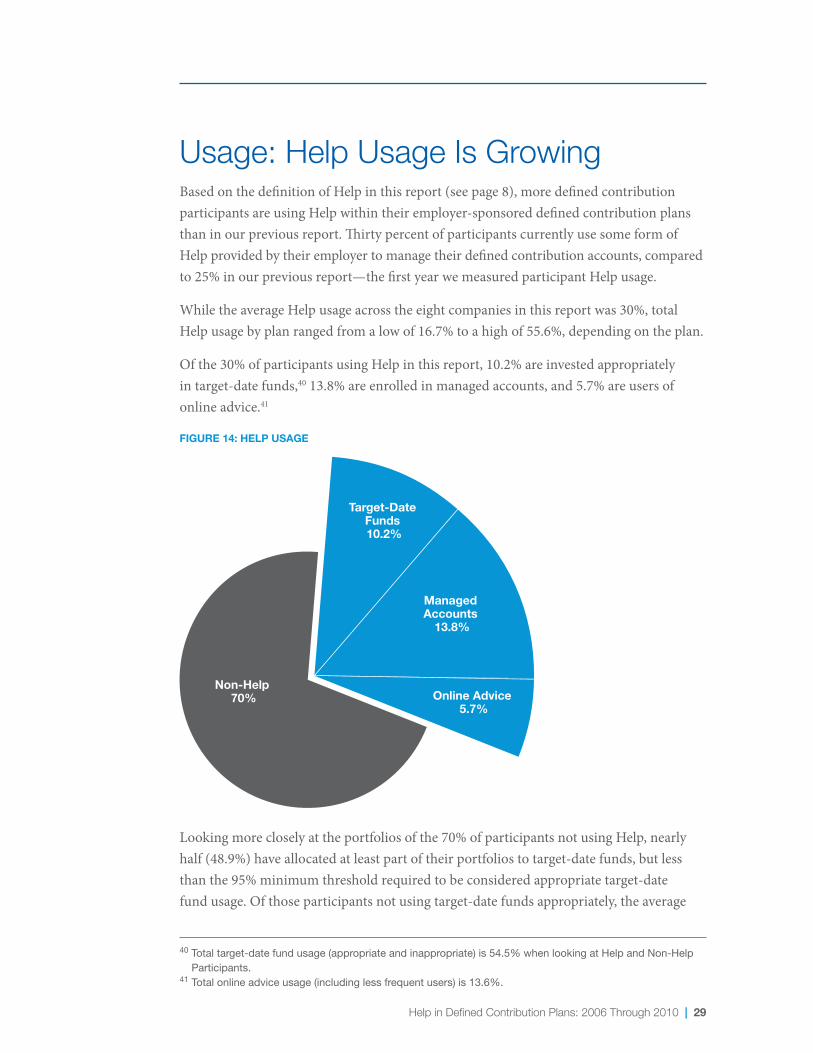
Usage: Help Usage Is Growing Based on the definition of Help in this report (see page 8), more defined contribution participants are using Help within their employer-sponsored defined contribution plans than in our previous report. Thirty percent of participants currently use some form of Help provided by their employer to manage their defined contribution accounts, compared to 25% in our previous report—the first year we measured participant Help usage.
While the average Help usage across the eight companies in this report was 30%, total Help usage by plan ranged from a low of 16.7% to a high of 55.6%, depending on the plan.
Of the 30% of participants using Help in this report, 10.2% are invested appropriately in target-date funds,40 13.8% are enrolled in managed accounts, and 5.7% are users of online advice.41
Non-Help 70% Online Advice
5.7%
Managed Accounts
13.8%
Target-Date Funds 10.2%
FIGURE 14: HELP USAGE
Looking more closely at the portfolios of the 70% of participants not using Help, nearly half (48.9%) have allocated at least part of their portfolios to target-date funds, but less than the 95% minimum threshold required to be considered appropriate target-date fund usage. Of those participants not using target-date funds appropriately, the average
30 | Help in Defined Contribution Plans: 2006 Through 2010
42 In the first edition of this report, the data for Help usage were taken from the period between April and July 2009. Usage data in this report were taken between July 2010 and January 2011.
43 For more information, see “The Accidental Investor: Baby Boomers on Retirement”, 2010, published by Financial Engines.
target-date fund portfolio allocation was 36%, the same allocation percentage as in the 2010 report. This suggests that many participants continue to see target-date funds as simply additional fund options in their plans, not as an all-in-one fund solution. In addi-tion, another 7.9% of participants have used online advice at some point, but not within the last year.
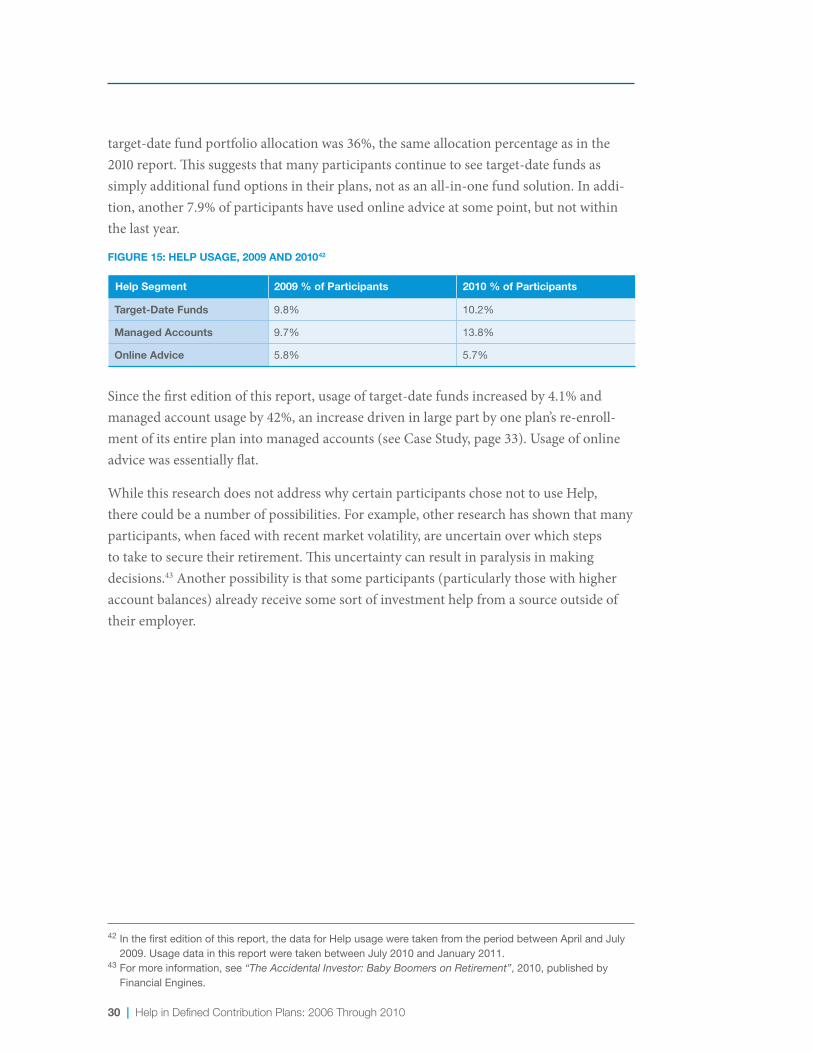
FIGURE 15: HELP USAGE, 2009 AND 201042
Help Segment 2009 % of Participants 2010 % of Participants
Target-Date Funds
Managed Accounts
Online Advice
9.8% 10.2%
9.7% 13.8%
5.8% 5.7%
Sincethefirsteditionofthisreport,usageoftarget-datefundsincreasedby4.1%andmanaged account usage by 42%, an increase driven in large part by one plan’s re-enroll-mentofitsentireplanintomanagedaccounts(seeCaseStudy,page33).Usageofonlineadvice was essentially flat.
While this research does not address why certain participants chose not to use Help, there could be a number of possibilities. For example, other research has shown that many participants, when faced with recent market volatility, are uncertain over which steps to take to secure their retirement. This uncertainty can result in paralysis in making decisions.43Anotherpossibilityisthatsomeparticipants(particularlythosewithhigheraccount balances) already receive some sort of investment help from a source outside of their employer.
Help in Defined Contribution Plans: 2006 Through 2010 | 31
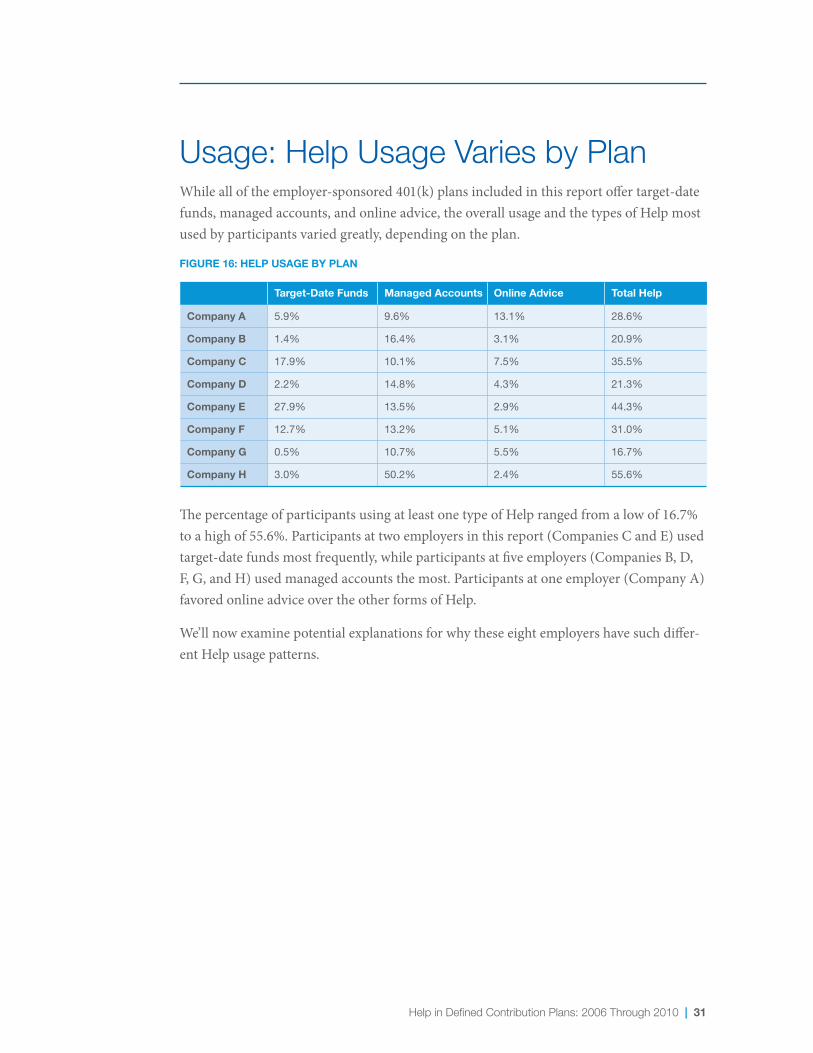
Usage: Help Usage Varies by PlanWhile all of the employer-sponsored 401(k) plans included in this report offer target-date funds, managed accounts, and online advice, the overall usage and the types of Help most used by participants varied greatly, depending on the plan.
FIGURE 16: HELP USAGE BY PLAN
Target-Date Funds Managed Accounts Online Advice Total Help
Company A 5.9% 9.6% 13.1% 28.6%
Company B 1.4% 16.4% 3.1% 20.9%
Company C 17.9% 10.1% 7.5% 35.5%
Company D 2.2% 14.8% 4.3% 21.3%
Company E 27.9% 13.5% 2.9% 44.3%
Company F 12.7% 13.2% 5.1% 31.0%
Company G 0.5% 10.7% 5.5% 16.7%
Company H 3.0% 50.2% 2.4% 55.6%
The percentage of participants using at least one type of Help ranged from a low of 16.7% toahighof55.6%.Participantsattwoemployersinthisreport(CompaniesCandE)usedtarget-date funds most frequently, while participants at five employers (Companies B, D, F,G,andH)usedmanagedaccountsthemost.Participantsatoneemployer(CompanyA)favored online advice over the other forms of Help.
We’ll now examine potential explanations for why these eight employers have such differ-ent Help usage patterns.

32 | Help in Defined Contribution Plans: 2006 Through 2010
Usage: Automatics and Plan Design Have the Biggest Impact on Help UsageBased on the employers included in this report, there appear to be three main factors driving Help usage in defined contribution plans, including plan design, time, and participant demographics.
1. Plan Design—Plan design is a significant factor when it comes to driving participant Helpusage.Specifically,automaticenrollmentorre-enrollmentintoaqualifieddefaultinvestmentalternative(QDIA)candramaticallyimproveparticipantHelpusagewithinashortperiodoftime(seeCaseStudy,page33).
ThePensionProtectionActof2006encouragedemployerstoprovideadvicetopar-ticipants and to automatically enroll new hires—or the entire employee population—into the 401(k) plan. With automatic enrollment, employers typically automatically enroll new hires unless they opt out into the company’s 401(k) plan, with the goal of increasing 401(k) plan participation.
In 2008, the Department of Labor issued guidance to employers, which established target-datefunds,managedaccounts,andbalancedfundsasQDIAs.Employers thatautomaticallyenrollnewemployees,convertparticipantsinanon-QDIA investmentdefaultfundtoaQDIA,orre-enrollexistingparticipantsintoaQDIAare provided safe harbor protection.
Sixoftheeightplansinthisstudyautomaticallyenrollnewemployeesinthe401(k)plan and automatically invest employees in a target-date fund. One plan automati-cally enrolls new employees into a managed account.
We estimate that approximately 12% of Help Participants using target-date funds were defaulted into them by their employers. The others most likely selected target-date funds on their own.44
Oneplan,CompanyE,convertedtheirplandefaultandmappedparticipantassetsfrom a stable value fund to a target-date fund.
Finally, Company H re-enrolled all of its plan participants—those that had been in the plan’s investment default and those that had actively chosen their own invest-ments—intomanagedaccounts.(seeCaseStudy,onpage33).
44 Additional details can be found in the Methodology Appendix.
Help in Defined Contribution Plans: 2006 Through 2010 | 33
Case Study: Improving Help Usage and Portfolios Through Plan Design45 Plan design—and specifically, defaulting participants into a qualified default investment alternative(QDIA)—candriveparticipantHelpusagein401(k)plansandsignificantlyimprove overall plan health.
FollowingthepassageofthePensionProtectionActof2006andthesubsequentU.S. DepartmentofLaborregulationonQDIAs,oneoftheplansponsorsinthisreport decided to re-enroll their entire plan participant population into managed accounts (one oftheDOL-approvedQDIAs).Aspartoftheplanre-enrollment,theemployerconducteda robust communication program.
Improved Risk and Diversification of Participant Portfolios
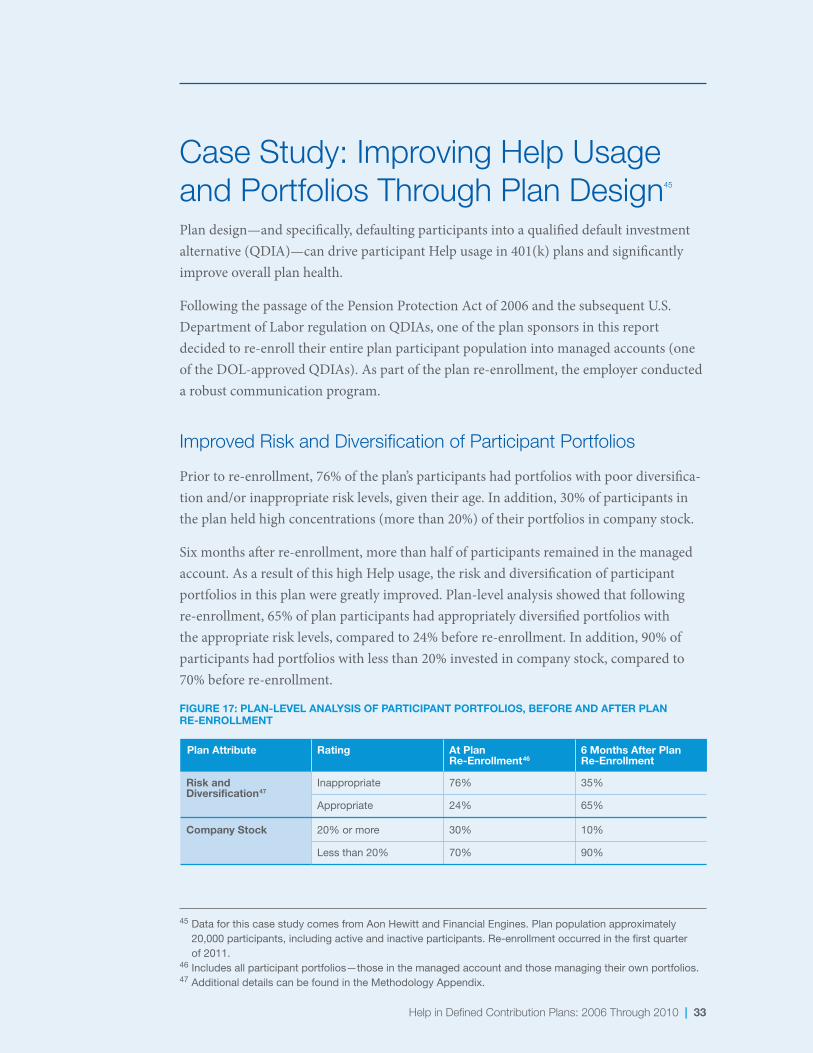
Prior to re-enrollment, 76% of the plan’s participants had portfolios with poor diversifica-tion and/or inappropriate risk levels, given their age. In addition, 30% of participants in the plan held high concentrations (more than 20%) of their portfolios in company stock.
Sixmonthsafterre-enrollment,morethanhalfofparticipantsremainedinthemanagedaccount.AsaresultofthishighHelpusage,theriskanddiversificationofparticipantportfolios in this plan were greatly improved. Plan-level analysis showed that following re-enrollment, 65% of plan participants had appropriately diversified portfolios with the appropriate risk levels, compared to 24% before re-enrollment. In addition, 90% of participants had portfolios with less than 20% invested in company stock, compared to 70% before re-enrollment.
FIGURE 17: PLAN-LEVEL ANALYSIS OF PARTICIPANT PORTFOLIOS, BEFORE AND AFTER PLAN RE-ENROLLMENT
Plan Attribute Rating
Risk and Diversification47
Company Stock
Inappropriate
Appropriate
At Plan Re-Enrollment46
76%
24%
30%
6 Months After PlanRe-Enrollment
35%
65%
10%20% or more
Less than 20% 70% 90%
45 Data for this case study comes from Aon Hewitt and Financial Engines. Plan population approximately 20,000 participants, including active and inactive participants. Re-enrollment occurred in the first quarter of 2011.
46 Includes all participant portfolios—those in the managed account and those managing their own portfolios.47 Additional details can be found in the Methodology Appendix.
34 | Help in Defined Contribution Plans: 2006 Through 2010
2. Time—Generally speaking, the usage of Help in 401(k) plans grows over time. The plan sponsors in this report introduced various forms of Help to participants at different times. For example, plan sponsors in the sample began offering target-datefundsbetweenApril2005andDecember2008,managedaccountsbetweenSeptember2004andFebruary2010,andonlineadvicebetweenJuly2000and February 2010.
3. Participant Demographics—Anemployer’sparticipantdemographicscanalsoplaya significant role in the types of Help most often used by participants. It’s also the most independent variable, since a plan sponsor can change plan design or the types of Help offered to participants, but not the participant’s age. How close participants are to retirement and how much money they have “at stake” in their 401(k) accounts can strongly influence whether or not they seek Help in the first place and the type of Help most attractive to them.
Next, we’ll examine how participant demographics affect Help usage.
Help in Defined Contribution Plans: 2006 Through 2010 | 35
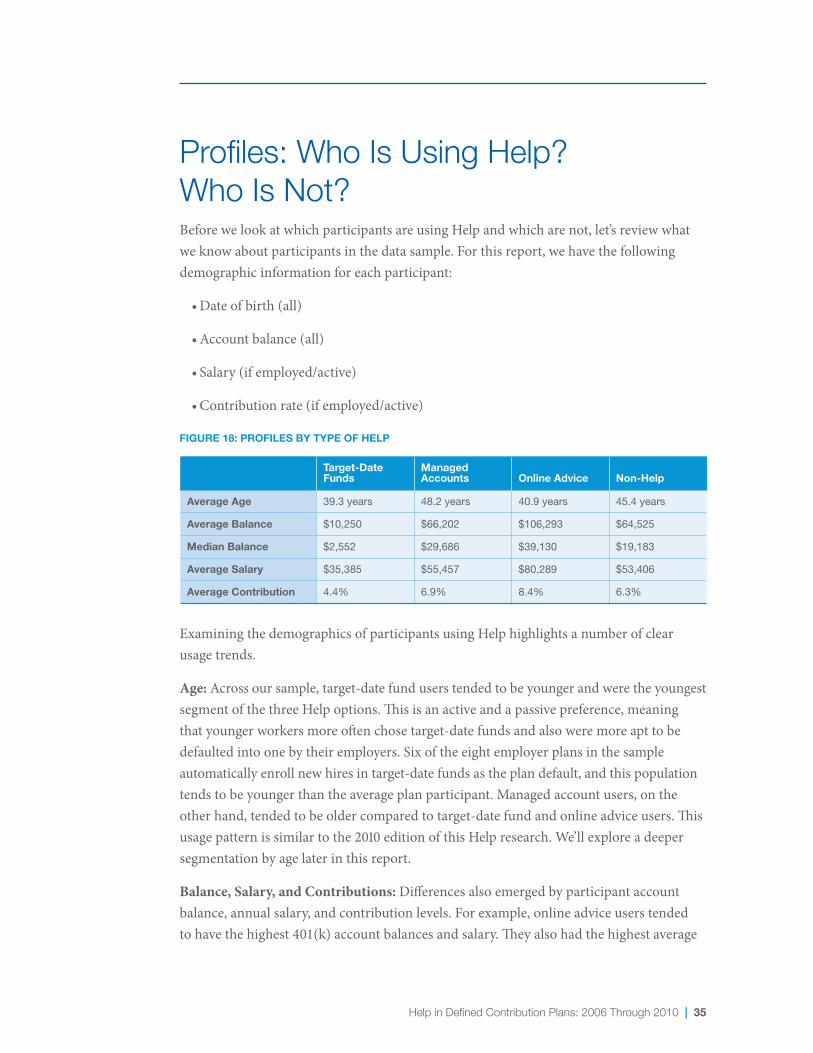
Profiles: Who Is Using Help? Who Is Not?Before we look at which participants are using Help and which are not, let’s review what we know about participants in the data sample. For this report, we have the following demographic information for each participant:
•Dateofbirth(all)
•Accountbalance(all)
•Salary(ifemployed/active)
•Contributionrate(ifemployed/active)
FIGURE 18: PROFILES BY TYPE OF HELP
Target-Date Managed Funds Accounts Online Advice Non-Help
Average Age 39.3 years 48.2 years 40.9 years 45.4 years
Average Balance $10,250 $66,202 $106,293 $64,525
Median Balance $2,552 $29,686 $39,130 $19,183
Average Salary $35,385 $55,457 $80,289 $53,406
Average Contribution 4.4% 6.9% 8.4% 6.3%
ExaminingthedemographicsofparticipantsusingHelphighlightsanumberofclear usage trends.
Age: Acrossoursample,target-datefunduserstendedtobeyoungerandweretheyoungestsegment of the three Help options. This is an active and a passive preference, meaning that younger workers more often chose target-date funds and also were more apt to be defaultedintoonebytheiremployers.Sixoftheeightemployerplansinthesampleautomatically enroll new hires in target-date funds as the plan default, and this population tendstobeyoungerthantheaverageplanparticipant.Managedaccountusers,ontheother hand, tended to be older compared to target-date fund and online advice users. This usage pattern is similar to the 2010 edition of this Help research. We’ll explore a deeper segmentation by age later in this report.
Balance, Salary, and Contributions: Differences also emerged by participant account balance, annual salary, and contribution levels. For example, online advice users tended to have the highest 401(k) account balances and salary. They also had the highest average

36 | Help in Defined Contribution Plans: 2006 Through 2010
contribution rates. In contrast, target-date fund users had the lowest account balances, salaries,andcontributionrates.Again,thispatternissimilartowhatweobservedinthe2010 Help research.
Next, we’ll take a closer look at the demographic factor that seems to have the greatest impactonthetypeofHelpparticipantsarelikelytouse—Age.
Help in Defined Contribution Plans: 2006 Through 2010 | 37
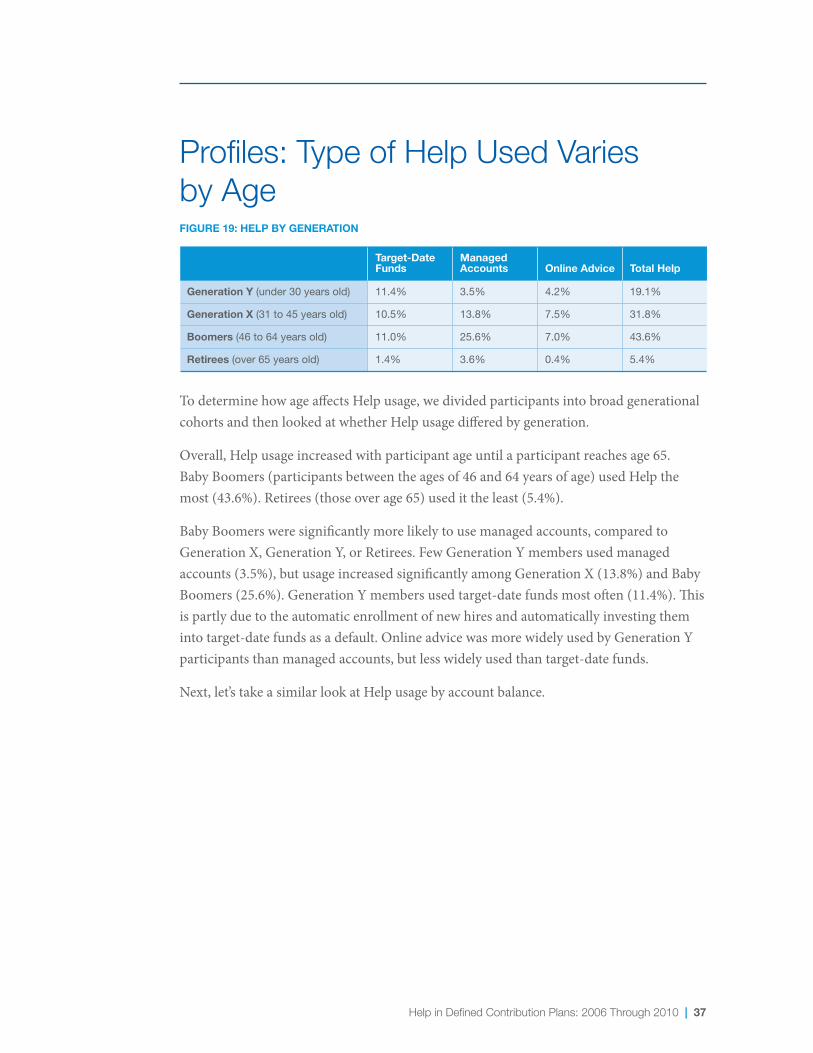
Profiles: Type of Help Used Varies by AgeFIGURE 19: HELP BY GENERATION
Target-Date Managed Funds Accounts Online Advice Total Help
Generation Y (under 30 years old) 11.4% 3.5% 4.2% 19.1%
Generation X (31 to 45 years old) 10.5% 13.8% 7.5% 31.8%
Boomers (46 to 64 years old) 11.0% 25.6% 7.0% 43.6%
Retirees (over 65 years old) 1.4% 3.6% 0.4% 5.4%
To determine how age affects Help usage, we divided participants into broad generational cohorts and then looked at whether Help usage differed by generation.
Overall, Help usage increased with participant age until a participant reaches age 65. Baby Boomers (participants between the ages of 46 and 64 years of age) used Help the most(43.6%).Retirees(thoseoverage65)usedittheleast(5.4%).
Baby Boomers were significantly more likely to use managed accounts, compared to GenerationX,GenerationY,orRetirees.FewGenerationYmembersusedmanaged accounts (3.5%), but usage increased significantly among Generation X (13.8%) and Baby Boomers(25.6%).GenerationYmembersusedtarget-datefundsmostoften(11.4%).Thisis partly due to the automatic enrollment of new hires and automatically investing them intotarget-datefundsasadefault.OnlineadvicewasmorewidelyusedbyGenerationYparticipants than managed accounts, but less widely used than target-date funds.
Next, let’s take a similar look at Help usage by account balance.

38 | Help in Defined Contribution Plans: 2006 Through 2010
Profiles: Type of Help Used Varies by Account BalanceFIGURE 20: HELP BY ACCOUNT BALANCE
Target-Date Managed Funds Accounts Online Advice Total Help
Under $5,000 24.3% 5.4% 2.7% 32.4%
$5,000–$15,000 6.0% 9.9% 3.2% 19.1%
$15,000–$50,000 2.8% 14.6% 4.6% 22.0%
$50,000–$100,000 0.7% 7.7% 2.8% 11.2%
$100,000–$250,000 0.4% 6.6% 3.4% 10.4%
Over $250,000 0.2% 2.4% 2.3% 4.9%
In general, participants with 401(k) account balances under $5,000 tended to use Help the most(dueinparttoautomaticenrollmentintoQDIAs),whileparticipantswithaccountbalances over $250,000 tended to use Help the least. Participants with large account balances could be getting Help from a source outside of their employer.
The lower the 401(k) account balance, the higher the likelihood of high target-date fund usage.Again,defaultingnewhiresintotarget-datefundsislikelyafactorhere.Higher balances correlated with increased usage of online advice. Online advice was the second most widely used form of Help for participants with defined contribution account balances between $15,000 and $250,000+. For balances above $15,000, managed accounts were the most widely used form of Help with the highest usage (14.6%) among participants with 401(k) account balances between $15,000 and $100,000.
Help in Defined Contribution Plans: 2006 Through 2010 | 39
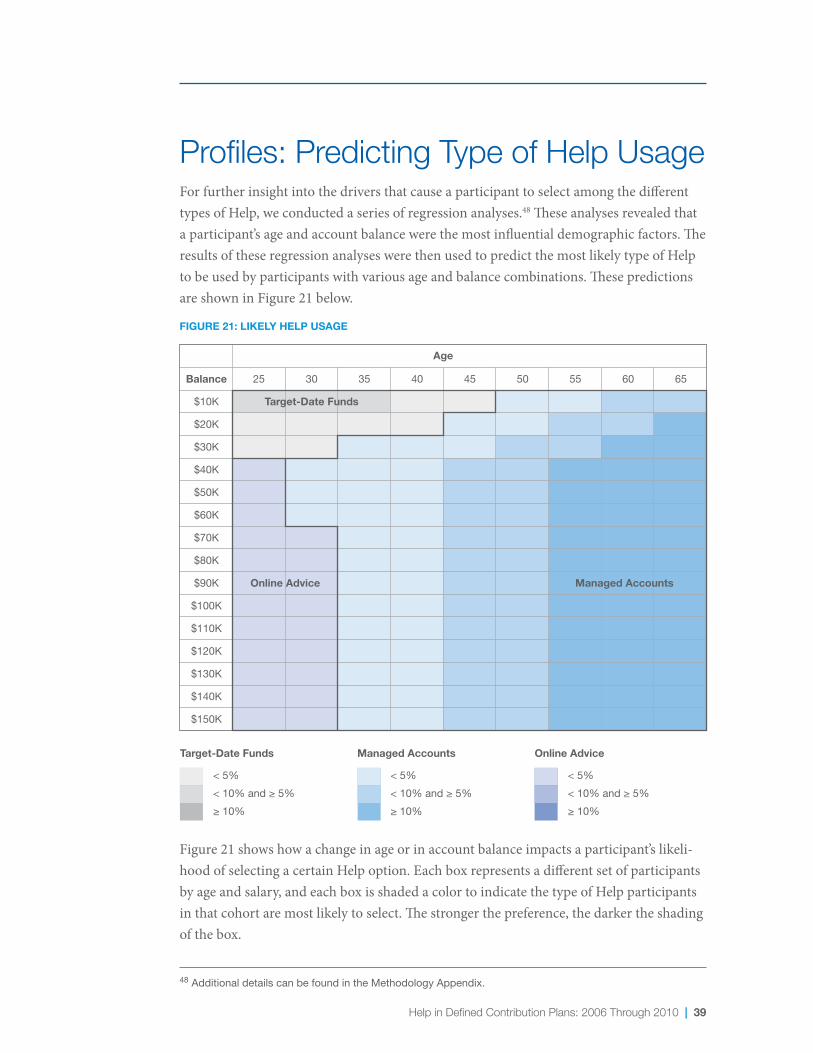
Profiles: Predicting Type of Help UsageFor further insight into the drivers that cause a participant to select among the different types of Help, we conducted a series of regression analyses.48 These analyses revealed that a participant’s age and account balance were the most influential demographic factors. The results of these regression analyses were then used to predict the most likely type of Help to be used by participants with various age and balance combinations. These predictions are shown in Figure 21 below.
< 5%< 10% and ≥ 5%≥ 10%
Age
< 5%< 10% and ≥ 5%≥ 10%
Target-Date Funds
Balance 25 30 35 40 45 50 55 60 65
$150K
Online AdviceManaged Accounts
< 5%< 10% and ≥ 5%≥ 10%
$140K
$130K
$120K
$110K
$100K
$90K
$80K
$70K
$60K
$50K
$40K
$30K
$20K
$10K
FIGURE 21: LIKELY HELP USAGE
Online Advice Managed Accounts
Target-Date Funds
Figure 21 shows how a change in age or in account balance impacts a participant’s likeli-hoodofselectingacertainHelpoption.Eachboxrepresentsadifferentsetofparticipantsby age and salary, and each box is shaded a color to indicate the type of Help participants in that cohort are most likely to select. The stronger the preference, the darker the shading of the box.
48 Additional details can be found in the Methodology Appendix.
40 | Help in Defined Contribution Plans: 2006 Through 2010
There are three key findings from Figure 21:
•Target-datefundsappealtoyounger,lowerbalanceparticipants—These participants are likely to be new to the workforce and have much more homogeneous investing profiles.Assuch,theone-size-fits-allapproachoftarget-datefundsmaybesuitable for them.
•Onlineadviceappealstoyounger,higherbalanceparticipants—These participants tend to be more engaged, comfortable with technology, and want to control how their portfolio is invested.
•Managedaccountsappealstoolderand/orhigherbalanceparticipants—These participants may have more complex needs and personal considerations, as well as less time and inclination to manage their own investments.
Age Has the Greatest Influence on the Type of Help Used
While both age and account balance affect the type of Help participants use, based on further analysis, age appears to be the stronger driver of the two when it comes to the type of Help participants select.49 The type of Help participants are likely to use appears to change as they age and as their financial picture grows more complex.
Given that no single type of Help is preferred by all participant groups at all account balance levels, these findings continue to suggest that a range of Help offerings is necessary to meet the retirement needs of a diverse workforce.
49 Additional details can be found in the Methodology Appendix.

Help in Defined Contribution Plans: 2006 Through 2010 | 41
ConclusionIn summary, defined contribution participants using Help earned higher returns than peers not using Help in all age groups and across a range of market conditions during the period from 2006 through 2010. Help Participants had higher returns and lower portfolio risk than participants managing their defined contribution accounts without the benefit of Help. On average, Help Participants had median annual returns nearly 3% higher (2.92%) than Non-Help Participants, net of fees—a significant difference, especially over the course of a career. In 2009, the gap between Help and Non-Help Participants widened to its greatest point, as many Non-Help Participants either had portfolios with too much risk in the form of company stock or had portfolios with too little risk and failed to benefit from the stock market recovery in 2009. Holding inappropriate risk levels, inefficient portfolios, and market timing were the most common mistakes made by Non-Help Participants.
On a positive note, more participants are using Help in this report (30%) than in our previousreport(25%).AutomaticenrollmentintoaQDIAisimpactingHelpusage, especiallyforyoungerparticipants.Re-enrollingtheentireplanintoaQDIAcanhaveadramatic effect on the percentage of participants using Help. One plan sponsor in this report re-enrolled their entire population into managed accounts and, as a consequence, the plan’s Help usage exceeded 50% and the overall health of their participant portfolios improved significantly.
When Help is offered to participants, participant age is the strongest predictor of which typeofHelptheparticipantismostlikelytouse.Youngerparticipantswithlower accountbalancespreferredusingtarget-datefunds.Youngerparticipantswithhigheraccount balances were more likely to use online advice. Near-retirees preferred using managed accounts. These findings highlight that reaching all participant groups requires offering multiple Help options, as no one form of Help appears to meet the needs of all participant segments.
Finally, of all participant groups, near-retirees (those age 50 and older) both use and need Help the most. This group had the widest range in risk levels and tended to panic the most during the economic downturn of 2008—attempting to time the market. With limited time to recover from losses and build back their savings, helping these participants is critical.Re-enrollingnear-retireesintoaQDIAhasprovedtobeasuccessfulstrategytoget Help to these vulnerable participants.

42 | Help in Defined Contribution Plans: 2006 Through 2010
ImplicationsFor Plan Sponsors
Looking at Help from a broad perspective, this report provides additional evidence that Help works in a range of market conditions. While 2008 and 2009 were particularly volatile years in terms of market activity, Help protected participants from engaging in market timing. Based on recent market activity, market volatility could be the new normal for some time. Plan sponsors not yet offering Help should consider offering this important benefit.And,plansponsorsalreadyofferingHelpsolutionsshouldconsiderleveragingplan design to maximize participant utilization.
Thankstoplansponsorsembracingtheautomatic401(k)andQDIAs,younger401(k)participants have a better chance to achieve a successful retirement. They are starting off on the right investing track and have the most time to grow their retirement savings.
Unfortunately, older participants are not as fortunate. During times of market volatility, near-retirees tend to be hurt the most by market timing and holding inappropriate risk levels. Volatility can cause significant losses before retirement without effective Help, resulting in reductions in standard of living, early depletion of assets, or delayed retire-ments. To best meet the needs of this demographic, plan sponsors should consider Help solutions that offer income protection to help protect from sizable losses right before retirement.Plansponsorsshouldalsoconsiderdefaultingthisat-riskgroupintoaQDIAso that they can receive the same advantage that many new employees receive as part of the automatic 401(k).
Plan sponsor encouragement of Help utilization through communication, education, and a well designed participant experience is critical to the success of Help.
Finally, this report highlights the need for plan sponsors to fully understand the nuances oftheirparticipantdemographics.Aswe’veseeninthisresearch,notalltypesofHelparepreferred by all participants. Plan sponsors that do not offer all three types of Help (target-date funds, managed accounts, and online advice) risk not reaching significant segments of their participant population.
Help in Defined Contribution Plans: 2006 Through 2010 | 43
For Policymakers
TheU.S.DepartmentofLabor(DOL)shouldbecommendedforprovidingincentivesforemployers to adopt automatic features in their 401(k) plans. Help is making a material difference, and this report demonstrates that those incentives are indeed having the desired effect.Asaresult,moreparticipantsarestartingoffsavingandinvestingintherightway.Thatsaid,QDIAsarebeneficialonlyifparticipantsareinvestedinthem.ToincreasetheimpactofQDIAs,someleadingcompaniesarere-enrollingallparticipantsintoaQDIA.AnyadditionalincentivestheDOLcouldprovideforthere-enrollmentofentirepartici-pant populations would benefit participants and sponsors.
In addition, extending the automatic 401(k) into retirement to help participants generate retirement income will increase the span and duration of the effectiveness of theQDIAeffortforplanparticipants.Supportingincomesolutionadoption,aswellasdetermining which retirement income solutions are appropriate as a default, will be key policy decisions.
We encourage the DOL to continue to support broad plan sponsor adoption of Help while ensuring the Help received by participants is designed without bias, in the best interest of plan participants.
For Participants
Manyparticipantsgrowanxiousduringperiodsofeconomicturmoil,anditcanbe challenging for them to “stay the course” when getting out of the market feels like the “safest” strategy. Participants worried about current market conditions should maintain a long-termperspectivewhenfacedwithunpredictableevents.Asthisreportshows,markettiming can be detrimental to overall savings goals. Instead, participants should be focused on creating an appropriately diversified portfolio that is consistent with their time horizons andriskpreferences.Studyafterstudyhasshownthatadisciplinedapproachproducesbetter long-term results than trying to time the market with each short-term event.
44 | Help in Defined Contribution Plans: 2006 Through 2010
Methodology Appendix: ResultsResults: Definitions of Variables (pages 9–28)InboththeResultssectionandtheUsageandProfilessections,weclassifyparticipantsaseitherHelpParticipantsorNon-HelpParticipants.IntheResultssection,however,theclassificationmethodology is slightly different to account for the fact that we are looking at historical rather thancontemporaneousdata.Specifically,HelpParticipant/Non-HelpParticipantstatusisassignedon a yearly basis, and it is possible for a given participant to change his or her status over the five years analyzed.
Participant statuses are all set based on start-of-year values.
•Participantsareconsideredmanagedaccountmembersiftheywereenrolledinthemanagedaccount program as of January 1 of any given year.
•Wedefinedtarget-datefundusersasthosewhohadatleast95%oftheirnon-brokerage holdings invested in target-date funds and who were invested in not more than two target-date funds.
•Onlineadviceparticipantsweredefinedasthosewhoreceivedonlineinvestmentadvice sometime within the previous calendar year.
AllthreeofthesecategoriesarecombinedtogiveusallHelpParticipants50, and all other participants are classified as Non-Help Participants.
In addition to the Help Participant/Non-Help Participant classification, several new variables are introduced in this section. These are described in detail below.
Portfolio balances—Portfolio balances are tabulated for each participant at the start of each year. Balances are calculated both at an aggregate level (i.e., total holdings for a participant) and at the assetlevel(e.g.,totalholdingsforaspecificmutualfund).Specificportfolioholdingswerenotavailable for brokerage accounts; portfolio balances for this study are therefore exclusive of any holdings in brokerage windows offered through the plan’s 401(k). Portfolios with aggregate balances of less than $100 are excluded from the analyses.
Portfolio returns—For each participant, annual portfolio returns are calculated for each year. These returns are internal rates of return, which account for portfolio contributions (including reinvested dividends and distributions), withdrawals, and reallocations throughout the course of the year.
50 These values are mutually exclusive and assigned in the order listed. The order of assignment has no impact on our results, though, as all Help Participants are grouped together for the purposes of our analysis.

Help in Defined Contribution Plans: 2006 Through 2010 | 45
51 For example, company stock as an offering in the 401(k) plan, performance of each stock in a given year, or type of default instruments.
52 This controls for changes in participation levels within a sponsor across the sample years as well as market performance in different years.
Weighting factors—One of the challenges inherent in using a relatively small and disparate set of plans is that plan-specific circumstances51 can significantly influence the results. This situation can be further exacerbated if the specific circumstance is present in a large plan whose participants represent a disproportionately large percentage of the total. To account for such potential problems, we apply a weighting factor to each participant.
This weighting factor is constructed by first dividing the entire sample into Help Participant and Non-Help Participant categories. Within each Help and either risk or age subcategory, the weighting factor is constructed such that each plan is equal weighted within each year and then each year is equal weighted as well. In other words, all plans are considered to be of equal importance, and all years are also considered to be of equal importance.52
Allpercentilesreportedincorporatetheseweightingfactors(i.e.,theyareweightedpercentiles).Using weighting factors is a conservative approach and actually results in a smaller difference between Help and Non-Help Participants. Without weighting, the analysis in Figure 1 results in median returns for Help Participants being 450 basis points higher than Non-Help Participants (as opposed to 292 basis points when using weighting).
Age—This value is calculated as of the start of each year, and as such a participant who is present in more than one year of the study will have different ages in different years and may appear in a different age subcategory in different years.
Risk—The risk of each participant portfolio is calculated as of the start of each year. This risk is based on the portfolio holdings (excluding brokerage holdings) described above and measures howthevalueoftheportfoliocouldvaryovertime.Specifically,theriskistheestimatedstandarddeviation of the portfolio based on market conditions as of the start of the given year. In other words, it is a forward-looking measure of risk.
The estimated standard deviation of the portfolio is based on the estimated standard deviations, covariances, and values of the individual assets within the portfolio. These are estimated using a mutual fund (or stock) analysis model that takes the correlations and covariances generated from a generic asset class model and generates fund-specific projected risk characteristics. Using modified returns-based style analysis techniques and other methods, a baseline risk profile is determined by mapping the fund onto the generic asset classes. The result, called the fund’s “style,” serves as the baseline for the estimated risk characteristics of the fund.
This style exposure is augmented with additional risk adjustments. These are estimated by comparing a fund’s historical performance with that of its estimated average style. The difference is the residual or fund-specific return, the volatility of which is examined to estimate the amount of additional risk, above and beyond the style risk, an investor will likely face when investing in this fund.
46 | Help in Defined Contribution Plans: 2006 Through 2010
Figure 1: Annualized Return Calculations (page 9)The values in Figure 1 were calculated as follows.
1. We divided the data into five-year age range subcategories based on the number of years until retirement for participants whose horizon was up to 40 years.53
2. We divided participants within each age subcategory into Help and Non-Help categories.
3. Within each age subcategory, we looked at the participants belonging to each company/year/Help category and made sure that there were at least 50 participants with valid data. If the total number of participants was fewer than 50, within either the Help or the Non-Help category, then all participants associated with that company/year combination were excluded from the analysis in both Help and Non-Help categories.
4. Within each age subcategory and Help category, we first equal weighted participants belonging to each company, within each year, and then we equal weighted participants belonging to different years.
5. Within each age subcategory, we calculated the weighted median return of participants belonging to Help and Non-Help categories separately.
6. Within each age subcategory, we calculated the difference between the weighted median return of the Help and Non-Help categories.
7. Finally, we calculated the average of that difference across all eight age subcategories; the average of these eight values is reported as the average median difference of 292 basis points.
The Value of Help (page 10) The values in the example on page 10 were calculated as follows. Both Help Participants and Non-Help Participants are assumed to invest a lump sum of $10,000 on their 45th birthday (i.e., at the start of year 45). They make no additional contributions, but their portfolios grow at annual rates equal to the median returns as shown in Figure 1. For example, for the first five years the Help Par-ticipant’s portfolio grows at a compounded rate of 11.93% and the Non-Help Participant’s portfolio grows at a compounded rate of 9.40%. For the next five years, the participants’ portfolios grow at the rates we calculated for ages 50–55, and so forth until 20 years have elapsed and they reach retirement at age 65.
51 Each of the eight age range subcategories includes ages that are greater than or equal to the lower bound and less than the upper bound. Each age subcategory spans five years. Similarly, each risk range subcategory includes risk that is greater than or equal to the lower bound and less than the upper bound. Each risk subcategory is 1%.
Help in Defined Contribution Plans: 2006 Through 2010 | 47
54 This is an important distinction. It would be incorrect for us to calculate retrospective (or ex post) risk values based on currently available data, as that would imply we had perfect foresight regarding future market events.
55 This index provides a broad measure of the taxable U.S. bond market, including most Treasury, agency, corporate, mortgage-backed, asset-backed, and international dollar-denominated issues, all with investment-grade ratings (rated Baa3 or above by Moody’s) and maturities of one year or more (Source: The Vanguard Group Inc.).
56 This index provides a single gauge of the large capitalization U.S. equities market. The index includes 500 leading companies in leading industries of the U.S. economy, capturing 75% coverage of U.S. equities (Source: Standard & Poor’s Financial Services LLC).
Figure 2: Calculating Median Portfolio Risk by Age (page 11)The values in Figure 2 were calculated as follows:
1. The risk of each participant portfolio was calculated as of the start of each year. This risk is based on the portfolio holdings described above and measures how the value of the portfolio couldvaryovertime.Specifically,theriskistheestimatedstandarddeviationoftheportfoliobased on market conditions as of the start of the given year.54
2. Participants were then separated into Help Participant/Non-Help Participant categories and age subcategories following the first four steps of the methodology used in Figure 1.
3. Weighted median (50th percentile) risk values were calculated and reported for each of these Help Participant/Non-Help Participant and age subcategories.
TherisklevelfortheBondIndexisbasedontheriskleveloftheBarclaysCapitalU.S.AggregateBond Index55,andtherisklevelfortheS&P500IndexisbasedontheriskleveloftheStandardandPoor’sS&P500Index.56
Figure 3: Calculating Risk Ranges by Age (page 13) This figure is based on the same underlying data as Figure 2, except that the weighted 25th and 75th percentiles for each age subcategory are reported (as opposed to the 50th percentile reported in Figure 2).
Figures 5, 6, and 7: Calculating Returns by Risk Level (pages 16–18)The values in Figures 5, 6, and 7 were calculated as follows:
1. Participant observations were sorted according to year.
2. Participants were divided into Help and Non-Help categories; Help Participants were excluded.
48 | Help in Defined Contribution Plans: 2006 Through 2010
3. The Non-Help Participants were then sorted into risk subcategories, in which each subcategory represents a standard deviation range of 1% (e.g., 2%–3%, 3%–4%, etc.).57
4. Within each risk subcategory, we looked at the participants belonging to each company and made sure that there were at least 50 participants with valid data. If the total number of participants was fewer than 50, then all participants associated with that company were excluded from the analysis for the risk subcategory.
5. Within each risk subcategory we equal weighted participants belonging to each company.
6. Within each risk subcategory, we calculated the weighted median return of participants.
For the years 2006, 2009, and 2010 (bull market), we calculated the average return across the three years within each risk subcategory.
Figures 8, 9, and 10: Calculating Returns by Risk Level (pages 20–22)The values in each of these Figures were calculated as follows:
1. First, participants were sorted according to year.
2. The Help Participants and Non-Help Participants were sorted into risk subcategories, in which each subcategory represents a standard deviation range of 1% (e.g., 10%–11%, 11%–12%, etc.). To ensure accurate comparisons, the range of risks is limited to 10%–18%, which is the range over which Help is designed to function.58
3. We divided participants within each risk subcategory into Help Participant and Non-Help Participant categories.
4. Allparticipantswithcompanystockholdingsgreaterthan20%(asofthestartofthegivenyear) were removed.59
5. Within each risk subcategory, we looked at the participants belonging to each company/Help category and made sure that there were at least 50 participants with valid data. If the total number of participants was fewer than 50, within either the Help or the Non-Help category, all participants associated with that company were excluded from the analysis in both Help and Non-Help categories for the risk subcategory.
6. Within each risk subcategory and Help category, we equal weighted participants belonging to each company.
57 No participants have risk values below 2%.58 Additionally, Help Participant data is limited beyond this range making accurate comparisons difficult.59 Help Participants are typically limited to a maximum of 20% company stock holdings, so this provides for
an equivalent comparison. In our sample, 47% of Non-Help Participants have company stock holdings over 20% when we equal weight each plan within each year and then equal weight each year.
Help in Defined Contribution Plans: 2006 Through 2010 | 49
7. Within each risk subcategory, we calculated the weighted median return of participants belonging to Help and Non-Help categories separately.
For the years 2006, 2009, and 2010 (bull market), we calculated the average return of the three year-by-year median returns within each risk and Help group.
Figure 11: Risk-Adjusted Median Returns, 2009 (page 25)We used the same methodology as used for Figures 8–10, but we did not exclude participants whose company stock holdings were greater than 20%. Our analysis was constrained to 2009 data.
Figure 12: Very Conservative Non-Help Participant Portfolios, 2007–2009 (page 27)First, we divided the participants into separate age groups and calculated the percentage of Non-Help Participants whose portfolios were at least 95% invested in bond or cash funds. We then calculated the average percentage of Non-Help Participants across all companies that had at least 50 valid observations within each age subcategory.
Figure 13: Non-Help Participant Portfolios Holding No Equities, 2007–2009 (page 28)We used the same methodology used for Figure 12. Here we calculated the percentage of Non-Help Participants whose portfolios were 100% invested in bond or cash funds.
50 | Help in Defined Contribution Plans: 2006 Through 2010
Methodology Appendix: Usage and Profiles Figure 14: Overlap in Help Usage (page 29)The three types of Help, as defined in this report with regard to appropriate usage, are generally intended to be mutually exclusive, meaning participants cannot engage with more than one at the same time. By definition, since managed accounts is discretionary, users are not able to use online advice for reallocation or other purposes and similarly cannot self-direct to a holding of 95%+ in target-date funds. However, while infrequent, it’s possible to be a user of online advice and hold 95%+intarget-datefunds.SinceourprimaryfocusisonHelpversusNon-Help,anysmalloverlapbetween these two groups is not a concern for this research, as both online advice and target-date funds are forms of Help.
Figure 16: Automatic Enrollment, Default Investment (page 31) Sevenoftheeightplansinthisstudyautomaticallyenrollnewhires.Sixoftheplansusetarget-datefunds as the default investment. (The remaining plan automatically enrolls new hires into a managed account,and,asdescribedintheCaseStudyonpage33,thisplandidare-enrollmentoftheirentire plan, re-enrolling all participants into managed accounts).
Participants classified in the target-date fund Help category either elected their allocation or were defaulted into their holding. The data on how the Help participant came to hold the target-date position is not available across all years in the study. We therefore created a proxy to estimate how many of the participants in the Help target-date fund category were defaulted into that holding.
For the remaining five plans, for each participant in the target-date fund Help group, the hire date was compared with the date on which target-date funds were made the default. If the hire date was after the default date, we assumed the person was defaulted into his or her position. Conversely, if the hire date preceded the default date, we assumed the participant elected his or her target-date fundholding(s).Averagingtheresultsacrossthefiveplans,weestimatethat12%ofparticipantsinthe target-date fund Help group were defaulted and the remaining 88% proactively chose their position.
Aswithanydataproxy,therearesomelimitationstothisapproachworthnoting.Thisproxy methodology cannot account for conversions that mapped existing participant balances into target-date funds, which one sponsor in the sample implemented when also making target-date fundsthedefaultfornewhires.Suchuserswouldbemisleadinglyclassifiedas“non-default,” implying that they chose their position, so this sponsor was also excluded from the analysis. Despite these limitations, we believe the hire date proxy allows us to generate the most robust estimate of the split between default and non-default in the target-date fund category.
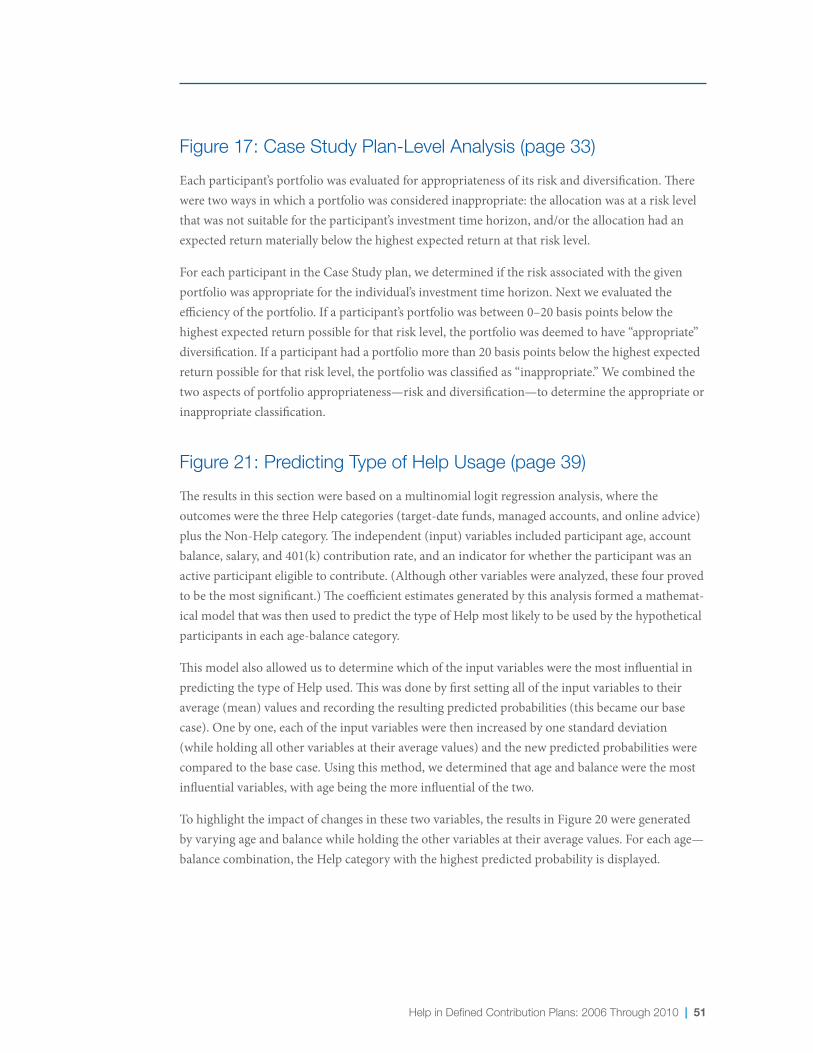
Help in Defined Contribution Plans: 2006 Through 2010 | 51
Figure 17: Case Study Plan-Level Analysis (page 33) Eachparticipant’sportfoliowasevaluatedforappropriatenessofitsriskanddiversification.Therewere two ways in which a portfolio was considered inappropriate: the allocation was at a risk level that was not suitable for the participant’s investment time horizon, and/or the allocation had an expected return materially below the highest expected return at that risk level.
ForeachparticipantintheCaseStudyplan,wedeterminediftheriskassociatedwiththegivenportfolio was appropriate for the individual’s investment time horizon. Next we evaluated the efficiency of the portfolio. If a participant’s portfolio was between 0–20 basis points below the highest expected return possible for that risk level, the portfolio was deemed to have “appropriate” diversification. If a participant had a portfolio more than 20 basis points below the highest expected return possible for that risk level, the portfolio was classified as “inappropriate.” We combined the two aspects of portfolio appropriateness—risk and diversification—to determine the appropriate or inappropriate classification.
Figure 21: Predicting Type of Help Usage (page 39)The results in this section were based on a multinomial logit regression analysis, where the outcomes were the three Help categories (target-date funds, managed accounts, and online advice) plus the Non-Help category. The independent (input) variables included participant age, account balance, salary, and 401(k) contribution rate, and an indicator for whether the participant was an activeparticipanteligibletocontribute.(Althoughothervariableswereanalyzed,thesefourprovedto be the most significant.) The coefficient estimates generated by this analysis formed a mathemat-ical model that was then used to predict the type of Help most likely to be used by the hypothetical participants in each age-balance category.
This model also allowed us to determine which of the input variables were the most influential in predicting the type of Help used. This was done by first setting all of the input variables to their average (mean) values and recording the resulting predicted probabilities (this became our base case). One by one, each of the input variables were then increased by one standard deviation (while holding all other variables at their average values) and the new predicted probabilities were compared to the base case. Using this method, we determined that age and balance were the most influential variables, with age being the more influential of the two.
To highlight the impact of changes in these two variables, the results in Figure 20 were generated by varying age and balance while holding the other variables at their average values. For each age—balance combination, the Help category with the highest predicted probability is displayed.
52 | Help in Defined Contribution Plans: 2006 Through 2010
About Aon Hewitt Aon Hewitt is the global leader in human resource consulting and outsourcing solutions. The company partners with organizations to solve their most complex benefits, talent and related financial challenges, and improve business performance. Aon Hewitt designs, implements, communicates, and administers a wide range of human capital, retirement, investment manage-ment, health care, compensation and talent management strategies. With more than 29,000 professionals in 90 countries, Aon Hewitt makes the world a better place to work for clients and their employees. For more information on Aon Hewitt, please visit www.aonhewitt.com.
About Aon Aon Corporation (NYSE: AON) is the leading global provider of risk management services, insurance and reinsurance brokerage, and human resources solutions and outsourcing. With more than 59,000 colleagues worldwide, Aon unites to deliver distinctive client value via innovative and effective risk management and workforce productivity solutions. Aon’s industry-leading global resources and technical expertise are delivered locally in more than 120 countries. Named the world’s best broker by Euromoney magazine’s 2008, 2009 and 2010 Insurance Survey, Aon also ranked highest on Business Insurance’s listing of the world’s insurance brokers based on commercial retail, wholesale, reinsurance and personal lines brokerage revenues in 2008 and 2009. A.M. Best deemed Aon the number one insurance broker based on revenues in 2007, 2008 and 2009, and Aon was voted best insurance intermediary 2007–2010, best reinsurance intermediary 2006–2010, best captives manager 2009–2010, and best employee benefits consulting firm 2007–2009 by the readers of Business Insurance. Visit www.aon.com for more information on Aon and www.aon.com/manchesterunited to learn about Aon’s global partnership and shirt sponsorship with Manchester United.
About Financial EnginesFinancial Engines (NASDAQ: FNGN) is a leading independent investment advisor committed to providing everyone the trusted retirement help they deserve. The company helps investors with their total retirement picture by offering personalized retirement plans for saving, investment, and retirement income. To meet the needs of different investors, Financial Engines offers both Online Advice and Professional Management. Co-founded in 1996 by Nobel Prize-winning economist Bill Sharpe, Financial Engines works with America’s leading employers and retirement plan providers to make retirement help available to millions of American workers. For more information, please visit www.financialengines.com.

This report is provided for informational and evaluative purposes only, and does not constitute and should
not be construed as legal, investment, tax advice, testimonial, or as an offer of advisory services or any
specific recommendation to buy, sell, or hold any investment. The report is based upon information and
data we believe to be reliable, but we do not guarantee its accuracy or completeness.
Within the Help group, online advice and professional management are provided by Financial Engines.
Neither Aon Hewitt nor Financial Engines guarantee future results, and a diversified risk-adjusted portfolio
is not a guarantee against loss.
Financial Engines provides advisory services through Financial Engines Advisors L.L.C., a federally
registered investment advisor and wholly owned subsidiary of Financial Engines, Inc. Financial Engines®
and Retirement Help for Life® are registered trademarks or service marks of Financial Engines, Inc.

© 2011. All rights reserved. Financial Engines® and Retirement Help for Life® are registered trademarks or service marks of Financial Engines, Inc. All advisory services provided by Financial Engines
Advisors L.L.C., a federally registered investment advisor and wholly owned subsidiary of Financial Engines, Inc. Neither Aon Hewitt nor Financial Engines guarantees future results.