helicopter borne emag mag rpt
TRANSCRIPT
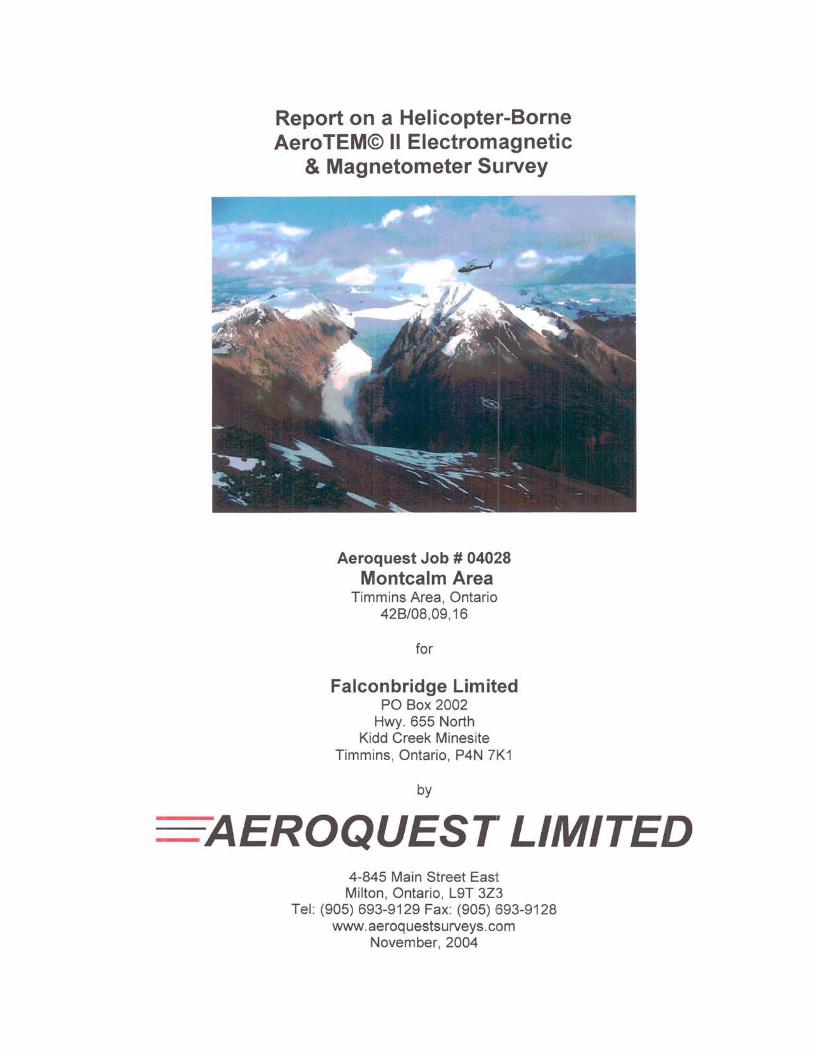
Report on a Helicopter-Borne AeroTEM© II Electromagnetic
& Magnetometer Survey
Aeroquest Job # 04028 Montcalm Area
Timmins Area, Ontario 42B/08 ,09 ,16
for
Falconbridge Limited PO Box 2002
Hwy. 655 North Kidd Creek Minesite
Timmins, Ontario, P4N 7K1
by
-~EROQUEST LIMITED 4-845 Main Street East Milton, Ontario, L9T 3Z3
Tel: (905) 693-9129 Fax: (905) 693-9128 www.aeroquestsurveys.com
November, 2004
2.29'770 RECEIVED
GEOSCIENCf ASSESSMENT OffiCE
Report on a Helicopter-Borne AeroTEM© II Electromagnetic and Magnetic Survey
Aeroquest Job # 04028 Montcalm Area
Timmins Area, Ontario 428/08 ,09 ,16
for
Falconbridge Limited PO 8ag 2002
Hwy. 655 North Kidd Creek Minesite
Timmins, Ontario, P4N 7K1
by
-~EROQUEST LIMITED 4-845 Main Street East Milton, Ontario, L9T 3Z3
Tel : (905) 693-9129 Fax: (905) 693-9128 www.aeroquestsurveys.com
November, 2004

1. TABLE OF CONTENTS
1. TABLE OF CONTENTS ................................................................................................................. 1 1.1. List of Figures .......................................................................................................................... 1 1.2. Appendices ............................................................................................................................... 2 1.3. List of Maps (1:20,000) ........................................................................................................... 2
2. INTRODUCTION ........................................................................................................................... 3 3. SURVEY AREA .............................................................................................................................. 3 4. REGIONAL GEOLOGY (after Falconbridge, 2004) .................................................................... 10
4.1. Bedrock Geology ................................................................................................................... 10 4.2. Overburden Geology .............................................................................................................. 10
5. SURVEY SPECIFICATIONS AND PROCEDURES .................................................................. 12 6. AIRCRAFT AND EQUIPMENT .................................................................................................. 14
6.1. Aircraft ................................................................................................................................... 14 6.2. Magnetometer ........................................................................................................................ 14 6.3. Electromagnetic System ......................................................................................................... 14 6.4. PROTODAS Acquisition System .......................................................................................... 15 6.5. RMS DGR-33 Acquisition System ........................................................................................ 16 6.6. Magnetometer and GPS Base Station .................................................................................... 17 6.7. Radar Altimeter ...................................................................................................................... 18 6.8. GPS Navigation System ......................................................................................................... 18 6.9. Digital Acquisition System .................................................................................................... 18
7. PERSONNEL ................................................................................................................................. 19 8. DELIVERABLES .......................................................................................................................... 19 9. DATA PROCESSING AND PRESENTATION ........................................................................... 19
9.1. Base Map ................................................................................................................................ 20 9.2. Flight Path & Terrain Clearance ............................................................................................ 20 9.3. Electromagnetic Data ............................................................................................................. 20 9.4. Magnetic Data ........................................................................................................................ 21
10. RESULTS AND INTERPRETATION ...................................................................................... 21 10.1. Overview ............................................................................................................................ 21 10.2. 'Groundhog' - Survey Block A .......................................................................................... 22 10.3. 'Mine' - Survey Blocks B and C - ..................................................................................... 22 10.4. 'Nova' - Survey Block C ................................................................................................... 22 10.5. 'Belford' - Survey Block C ................................................................................................ 23 10.6. 'Watson' - Survey Block E ................................................................................................ 23 10.7. 'Strachan' - Survey Block F ............................................................................................... 23 10.8. 'Montcalm North' - Survey Block G ................................................................................. 23
1.1. List of Figures Figure 1. Regional location map of the Montcalm area showing the road access ................................... 4 Figure 2. Overview map Aeroquest survey blocks and Falconbridge claim blocks (projects) ............... 5 Figure 3 .Mining claims within the Montcalm North and Mine Blocks .................................................. 6 Figure 4. Mining claims within the Groundhog South and Strachan Blocks .......................................... 7
AeroQuest Limited - Report on an AeroTE'v! II Airborne Geophysical Survey 1
Figure 5. Mining claims within the Mine, Nova and Belford Blocks ...................................................... 8 Figure 6. Mining claims within the Watson Block. ................................................................................. 9 Figure 7. Regional geology ofthe Montcalm Area ............................................................................... 11 Figure 8. The magnetometer bird (foreground) and AeroTEM II EM bird ........................................... 14 Figure 9. AeroTEM II Instrument Rack ................................................................................................. 15 Figure 10. Schematic of Transmitter and Receiver waveformss ........................................................... 17
1.2. Appendices
Appendix 1: Survey Block Co-ordinates Appendix 2: Property Ownership Appendix 3: Description of Database Fields Appendix 4: Technical Paper: "Mineral Exploration with the AeroTEM System" Appendix 5: Instrumentation Specification Sheet Appendix 6: Statement of Qualifications Appendix 7: Statement of Expenses
1.3. List of Maps (1:20,000)
Groundhog South, Map 1: Total Magnetic Intensity - Groundhog South Project Groundhog South, Map 2: EM Profiles and Anomalies - Groundhog South Project Mine, Map 1: Total Magnetic Intensity ~ Mine Project Mine, Map 2: EM Profiles and Anomalies - Mine Project Nova, Map 1: Total Magnetic Intensity - Nova Project Nova, Map 2: EM Profiles and Anomalies - Nova Project Belford, Map 1: Total Magnetic Intensity - Belford Project Belford, Map 2: EM Profiles and Anomalies - Belford Project Watson, Map 1: Total Magnetic Intensity ~ Watson Project Watson, Map 2: EM Profiles and Anomalies - Watson Project Strachan, Map 1: Total Magnetic Intensity - Strachan Project Strachan, Map 2: EM Profiles and Anomalies Strachan Project Montcalm North, Map 1: Total Magnetic Intensity - Montcalm North Project Montcalm North, Map 2: EM Profiles and Anomalies - Montcalm North Project
AeroQuest Limited - Report on an AeroTEM II Airborne Geophysical Survey 2
2. INTRODUCTION
This report describes a helicopter-borne geophysical survey carried out on behalf of Falconbridge Limited (Falconbridge) on the Montcalm Project, near Timmins, Ontario.
The principal geophysical sensor is Aeroquesfs exclusive AeroTEM© II time domain helicopter electromagnetic system which is employed in conjunction with a high-sensitivity cesium vapour magnetometer. Ancillary equipment includes a real-time differential GPS navigation system, radar altimeter, video recorder, and a base station magnetometer. Full-waveform streaming EM data is recorded at 37,800 samples per second. The streaming data comprise the transmitted waveform, and the X component and Z component of the resultant field at the receivers. A secondary acquisition system (RMS) records the ancillary data.
The total line kilometres flown on the Montcalm Project is 5,478 km based on a minimum survey line length of 3 km. The survey flying described in this report took place between November 25th and December 10th, 2004 and between February 4 and 10, 2005. The survey flying conducted in February was due to re-flights required by Falconbridge over some portions of the survey area. The survey lines that were reflown are not included in the total line-kilometre figures.
Bedrock EM anomalies were picked and classified as either a "thick" or "thin" conductor based on the response of the Z- and X-component profiles. The targets were then graded according to the calculated 'on-time' conductance. This report describes the survey logistics, the data processing, presentation, and provides a brief interpretation of the results.
3. SURVEY AREA
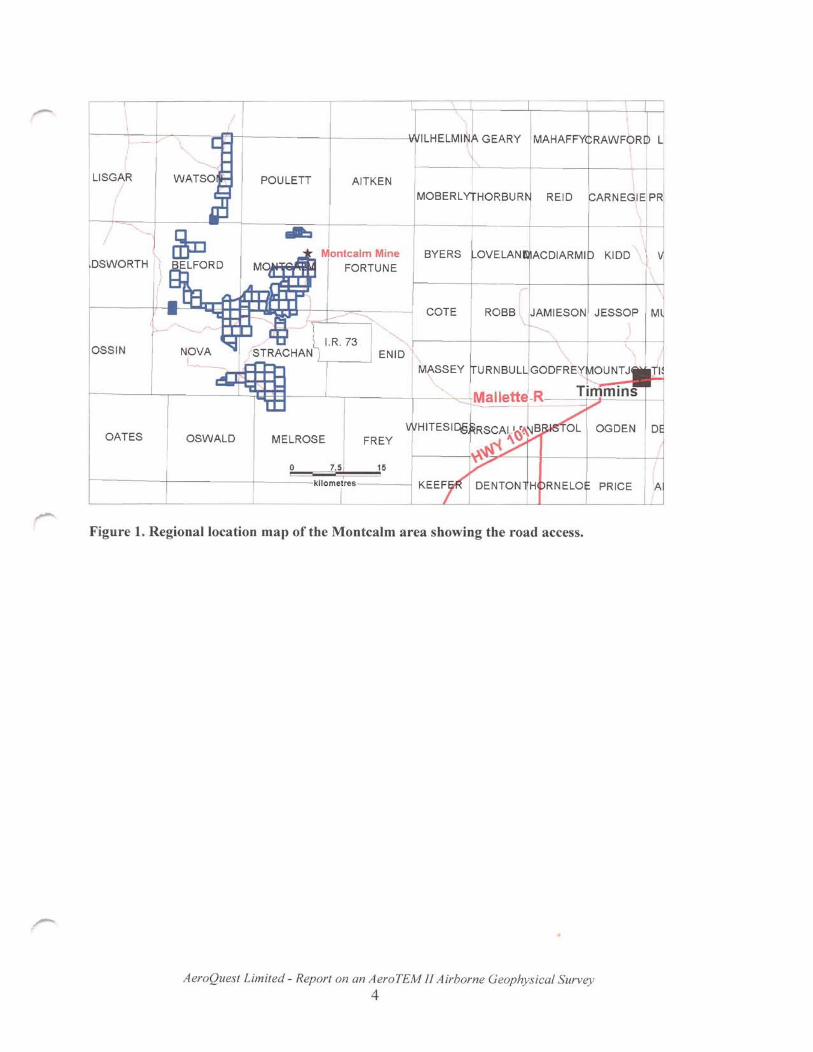
The Montcalm Area (Figure 1) is defined as a continuous block of six townships (Watson, Belford, Nova, Montcalm, Strachan, and Melrose) approximately 91 kilometers northwest of the City of Timmins, Ontario. The Area is reached from Timmins via Hwy 101 West, to the Mallette logging gravel road. An existing network of other gravel roads provides direct access to most of the Area.
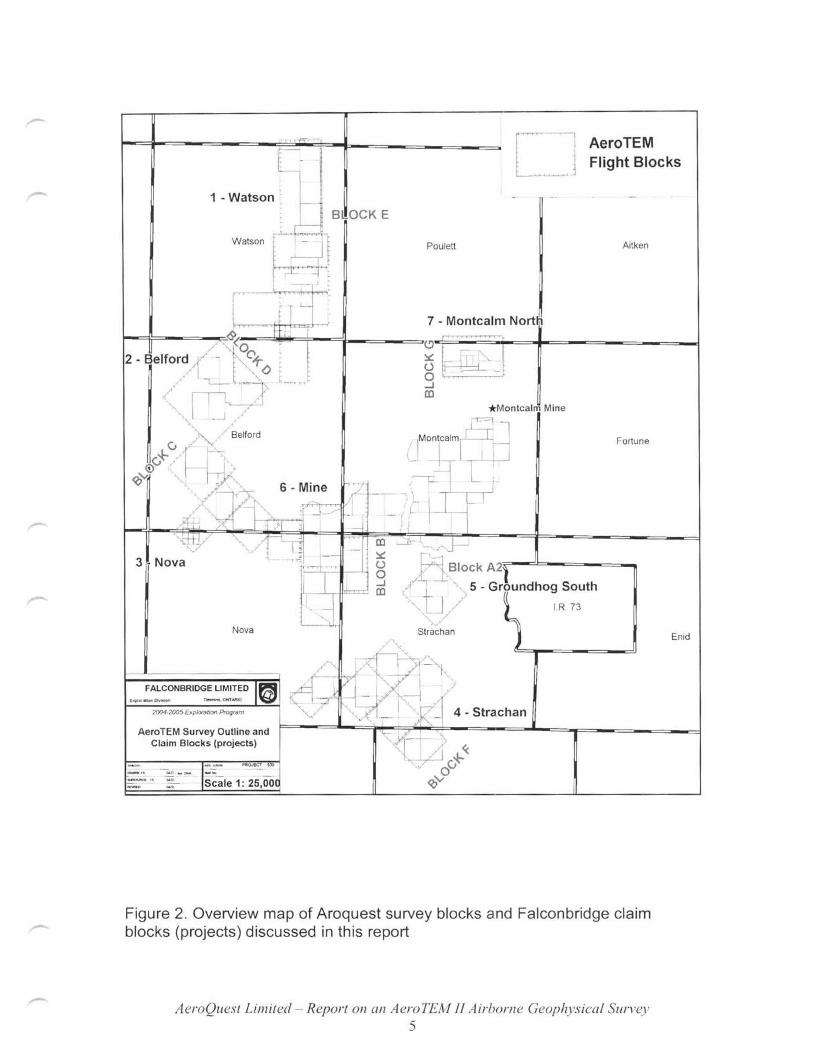
The surveying conducted on the Montcalm Project was divided into eight survey blocks. Figure 2 shows the spatial relationship of the claim blocks to the AeroTEM flight blocks. Appendix 1 lists the survey block boundary information.
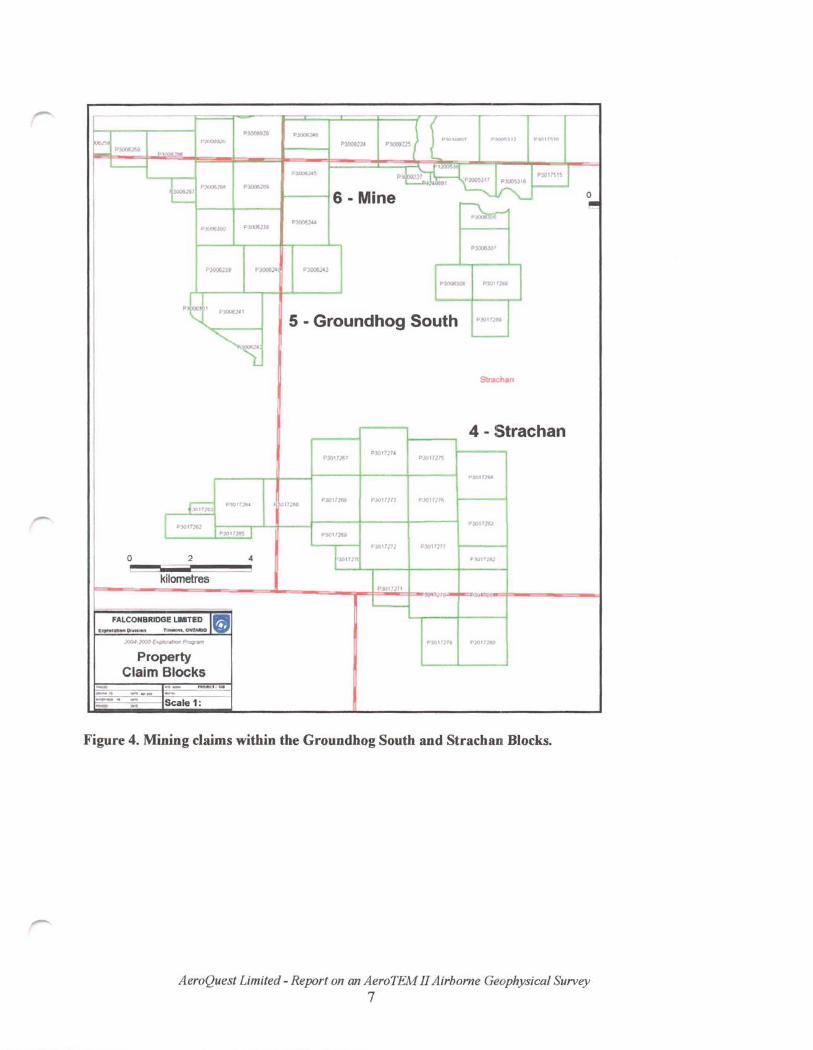
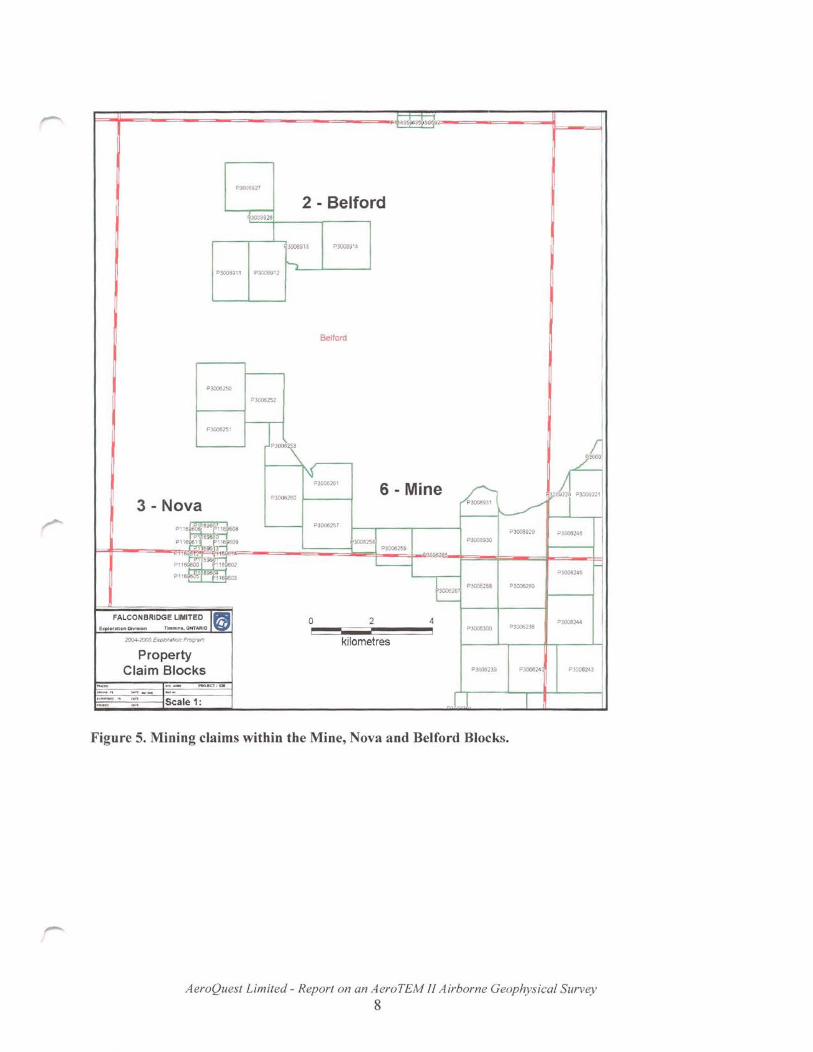
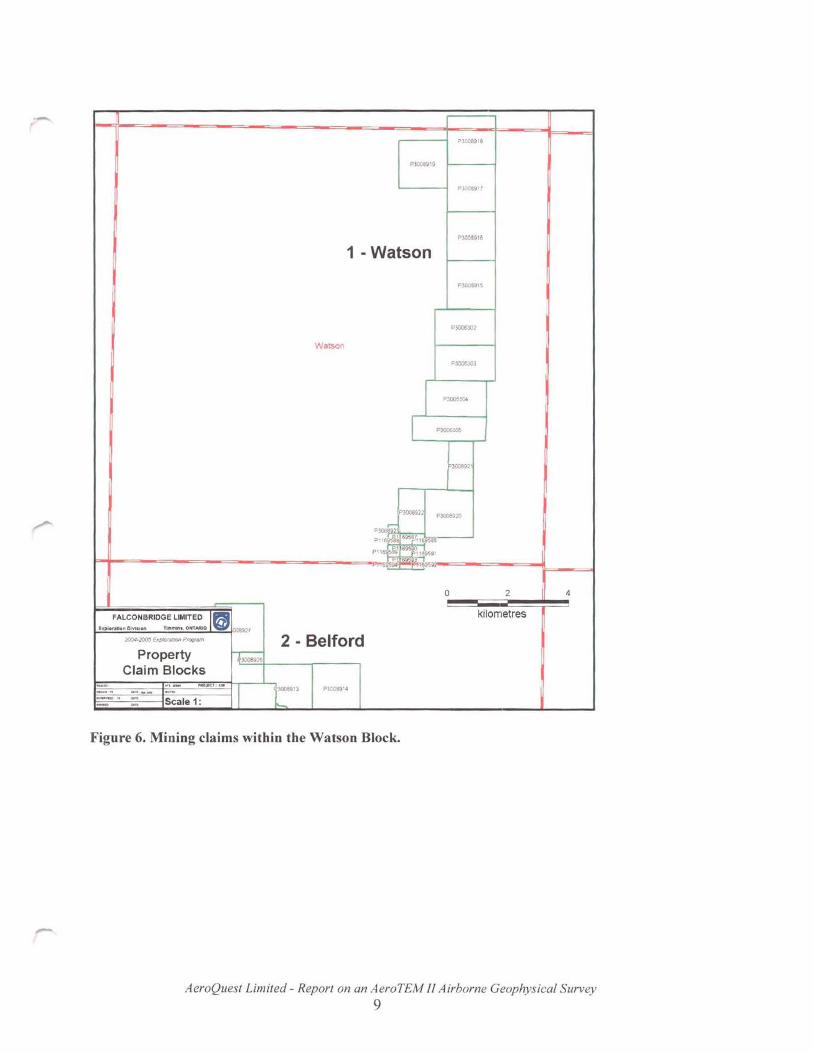
The claim blocks (Figures 3 to 6 ) may be located on NTS 1 :50,000 map sheets 42B/08,09 and 16. Appendix 2 lists the claim numbers and their ownership.
The survey crew was accommodated at the Howard Johnson Motel (formerly the Ramada Inn and Conference Centre) in Timmins and the helicopter was based at the Gateway Helicopters hangar west of the Kamiskotia Highway on Kamiskotia Lake. A summation of the expenditures for this survey appears in Appendix 6.
AeroQuest Limited - Report on an AeroTEM II Airborne Geophysical Survey
3
\ ,
L1SGAR WAT POUlETT AITKEN MOBERl '{fHORBUR
I
~
DSWORTH I: BYERS
COTE
N ENID MASSEY
\
OATES OSWALD MELROSE FREY
Figure 1. Regional location map of the Montcalm area showing the road access.
AeroQuest Limited - Report on an AeroTEM II Airborne Geophysical Survey 4
l
--
, .,--T"'I-
c- [~l AeroTEM Flight Blocks
1 - Watson :
r'---Watson f tJ!
r*·-tt
Nova
2004·2005 ExpJomtlOfl Program
AeroTEM Survey Oulline and Claim Blocks (projects)
~- .. r·· .~. '''''''''' '" "- - - - - -o.on ... ~ _ _
"E - Scale 1: 25,OO(
BI!OCK E
Poulett Aitken
7 - Montcalm Nortlii
* Montcalm Mine
Fortune
Figure 2. Overview map of Aroquest survey blocks and Falconbridge claim blocks (projects) discussed in this report
AeroQuest Limited - Report on an AeroTEM II Airborne Geophysical Survey 5
Enid

~
7 - Montcalm l P30'O"0 f~"" North "d P 10 ' 1" 30' 71
P3I), '04 P30' O'. 130 ' 59 I P3010112
,J, ,,-.J.re3U.lD.'" P301 163 -
~ IJJ. I J
W I I '
'-'-i I ~Montca~-M....i.ne
: I .1 J Lw24oa .... 1 1
P30010020
P3Q01Co021 J P30 1 0027
Montcalm P 10028
II t---
r '001 P30010023 300.30
P30010025 P30010022 P3010:J29
300531 P3005311
'-- P30010024 P po. 0 , P3D 1C\8Q.4 ,
.;1,] P'!>os3~ ' 6 - Mine
P30053 1g P301080J P3OQ53'IS
11 "-"I "A:: 03:)10305 ~ P300922 1 P30)9223 PW05313
V
9 P3006Z4e
P3009215 } P3009224 PlOl0807 P3005J12 P 30175 H5
~ P30062.4 5 PJogz21 P30 17S1 5
9 ~t g' 3005317 P300S31G t---0 2 4
~~ I I
FALCON BRIDGE LIMITED U kilometres hplor-abon O,v.slon TlII""'"'. ONTARIO
2004·~ &r;.rotetlOn Pf'09r8m
~ Property P3005307
Claim Blocks I p~~ P3017288 ~
, ... -- I'M>..IlCl : WIll 5 - Groundhog South _ .. ,. .. _- --
~- . ". Scale 1: ·u -- ~
Figure 3 .Mining claims within the Montcalm North and Mine Blocks.
AeroQuest Limited - Report on an AeroTEM II Airborne Geophysical Survey 6
- - - - - -- ---- -
C] P3M~ P3OOl9~ PJOOe;loIS
P!OOtl.~ ) '·J(lOIJ»..~ PSOOO22-t P\iHNII'H P'J{JtI",\" P)I'llT""1
~ l .,., L-
p4>m~1 P3O"''' 1 .,..,.,..
t:: ~~}M P>005J09 I P~11 p.~.lIe
6-Mine ~ J 0 -P~2-U
"""""" PltXJl5.tj.8
pJOO8J(lr
p~t PlI;U;;" PXIOO.l4l I p-~ I PlO! 1111
·tt PJOue)'1
5 - Groundhog South t::J ~
StracMn
4 - Strachan P3011~1
PlOl7114 PJ(l1111~ -.-
P30I'~
~ PJ017;>r.1. """ .. P3O';268 PJQI1}lJ PJCl11/f5
l PX\tl18J PlOI7;"6)
PJOIl26S I P301t2'Si
~"''''' J:'JOI71n PS017Jl1
0 2 4 F·.~1111J
C :::::s kilometres
PJOI1i11 3il1 ,
"---- -FALCONBRIDGE LMT£O ,18
~DM,*, r~owrMtO
;~~C~ __ P,..", plOt'~T9 P.\I}l1_ 0
Property Claim Blocks - -- - ,-- " - • "'--1:--- " ::: Scale 1: -
Figure 4. Mining claims within the Groundhog South and Strachan Blocks.
AeroQuest Limited - Report on an A ero TEM II Airborne Geophysical Survey 7
P3008927
2 - Belford
300e913 P300Sg'4
Belford
P3OOl!250
P3005252
P30062!it
6 - Mine 3 - Nova
P3006250 r-----.,
p'~6~e;.Pw8
~F-~~_'~~"~" 's"6~~~-==-~~~ __ ~~~ P116G16/X) tle~)2
Pl' 116~
FALCONBRIOGE LIMITED
Property Claim Blocks
Scale 1:
Figure 5. Mining claims within the Mine, Nova and Belford Blocks.
AeroQuest Limited - Report on an AeroTEM II Airborne Geophysical Sun1e.y
8
I
--P3008919
P3008V19
PlOO~'1
P30~9i6
1 - Watson
P300S915
P3006302
W atson
P3OC6J03
P3OC6304
l P30C<;3Q5
f'3ooa32
P30089' P3{X)8920
p~ P1 ~69~~ &958,1116
~I~: p" _ ~959 1
""'6 5 :$ 695
0 2 4
FALCONBRIDGE LIMITED> Ie kilometres hplor_n DlvI'lon nnlllin • • ONTARIO 7
2004-200!1 fx.DIot9 /10n Pf09IBm 2 - Belford Property I ~30089"
Claim Blocks .. - -.aCl " •
I r'" P3.CC89' 4 _ .. ~ -- -. - -.. Scale 1: - ..
Figure 6. Mining claims within the Watson Block.
-AeroQuest Limited - Report on an AeroTEM /I Airborne Geophysical Survey
9
4. REGIONAL GEOLOGY (after Faiconbridge, 2004)
4.1. Bedrock Geology
The Montcalm Area is underlain by Archean intrusions and supracrustal rocks within the Abitibi Subprovince, structurally bound to the west by the Kapuskasing Structural Zone (Figure V). Falconbridge Ltd. properties mainly cover ultramafic to mafic intrusions in the Area; most notably the Montcalm Gabbroic Complex (MGC) which hosts the Ni-Cu-Co massive sulphide deposits at the Montcalm Mine.
The MGC is a sub-vertical, crudely layered mafic to ultramafic intrusion of Archean age with a uranium-lead age of2702 ± 2 Ma. A granite dyke that cuts both the complex and the sulphide mineralization at the Montcalm Mine has a uranium-lead age of2700 ± 2 Ma (Barrie and Naldrett, 1990). Due to limited outcrop exposure, no detailed, intrusion-wide lithological or structural study has been completed. Based on limited mapping information, drill hole data and airborne geophysical surveys, the MGC is sub-divided into at least three zones: a basal Pyroxenite Zone, a middle Gabbro (Norite)-Anorthositic Gabbro Zone and an upper Ferroan Gabbro Zone (Barrie, 1990). The zones are interpreted to broadlylndicate a northwest to southeast iron-enrichment fractionation trend. Several dyke suites also cut the Complex. Other ultramafic-mafic intrusions occur within the Area that are presumed to be stratigraphically equivalent to the MGC.
The Montcalm Ni-Cu-Co massive sulphide deposit is hosted within the middle Gabbro/ Norite Zone. The deposit consists of four separate ore zones that mainly strike north-south and dip steeply west to near vertical. The "West Zone", with over half of the deposit's tonnage, strikes north-south over 250m. The ''Northwest Zone", the smallest of the four, subcrops beneath a clay-rich overburden cover.
4.2. Overburden Geology
The Montcalm area lies within the Abitibi Uplands on the southwestern margin of the Abitibi Clay Belt. The area was once covered by Lake Barlow-Ojibway, a Wisconsin-age glacial lake. The irregular bedrock surface has been mantled by tills, glacio-fluvial sands and gravels, thick sequences of varved clays, and outwash and deltaic sands. Overburden thickness varies across the Area from 0 to 40m.
AeroQuest Limited - Report on an A ero TEM II Airborne Geophysical Survey
10

FORTUNE
ENID
10
OSWALD
Figure 7. Regional geology of the Montcalm Area. Falconbridge Ltd. property outlines are shown in red. Legend displayed on following page.
AeroQuest Limited - Report on an A eroTEM 11 Airborne Geophysical Survey 11
LITHOLOGY
• 15 Diabase Dikes
o 13 Alkalic Intrusion
O 12 Felsic to Intermediate Intrusion
o 11 Felsic Porphyry 10 Mafic Intrusion
9 Ultramafic Intrusion
D T~miSkaming-type Metasediments
• 6,emical Metasedimentary Rocks
o 6 Clastic Metasedimentary Rocks
o A~kaliC Metavolcanic Rocks
O 4 Felsic Metavolcanic Rocks/Intrusions
o I;termediate Metavolcanic Rocksllntrusions
• 2 Mafic Metavolcanic Rocks/Intrusions
o Uitramafic-MafiC Metavolcanic Rocks/Intrusions
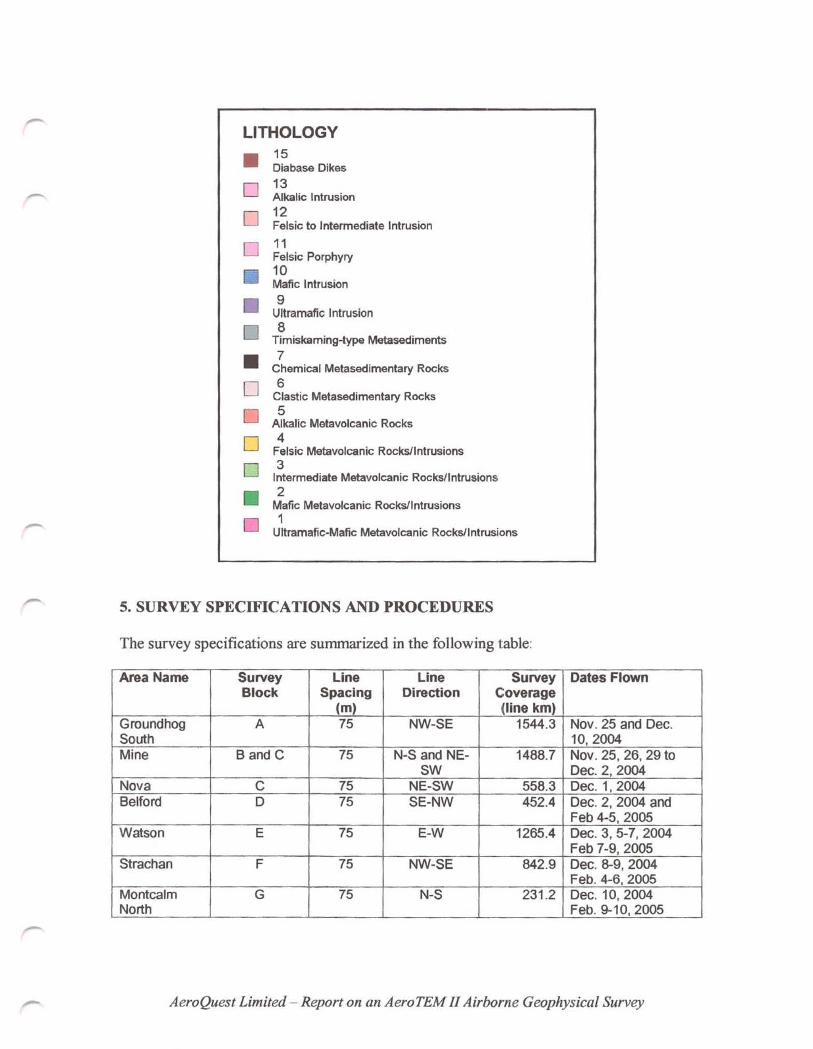
5. SURVEY SPECIFICATIONS AND PROCEDURES
The survey specifications are summarized in the following table:
Area Name Survey Line Line Survey Block Spacing Direction Coverage
(m) (line km) Groundhog A 75 NW-SE 1544.3 South Mine Band C 75 N-S and NE- 1488.7
SW Nova C 75 NE-SW 558.3 Belford 0 75 SE-NW 452.4
Watson E 75 E-W 1265.4
Strachan F 75 NW-SE 842.9
Montcalm G 75 N-S 231.2 North
Dates Flown
Nov. 25 and Dec. 10,2004 Nov. 25,26,29to Dec. 2,2004 Dec. 1,2004 Dec. 2, 2004 and Feb 4-5, 2005 Dec. 3,5-7, 2004 Feb 7-9, 2005 Dec. 8-9, 2004 Feb. 4-6, 2005 Dec. 10,2004 Feb. 9-10,2005
AeroQuest Limited - Report on an Aero TEM II Airborne Geophysical Survey
The survey coverage is calculated by adding the survey and control (tie) line lengths as presented in the final Geosoft database. All the survey lines were flown with a spacing of 75m The control (tie) lines were flown perpendicular to the survey lines with a spacing of 750m.
The nominal EM bird terrain clearance is 30m (98 ft). The magnetometer sensor is mounted in a smaller bird connected to the tow rope 21 metres above the EM bird and 17 metres below the helicopter. Nominal survey speed is 75 kmIhr. Scan rates for ancillary data acquisition is 0.1 second for the magnetometer and ahimeter, and 0.2 second for the GPS detennined position. The EM data area acquired as a data stream at a sampling rate of38,400 samples per second and is processed to generate final data at 10 samples per second. The 10 samples per second translates to a geophysical reading about every 2-3 metres along the flight path.
Navigation is carried out using a GPS receiver, an AGNA V2 system for navigation control, and an RMS data acquisition system which records the GPS co-ordinates. The xy-zposition of the aircraft, as reported by the GPS, is recorded at 0.2 second intervals.
Unlike frequency domain electromagnetic systems, the AeroTEM IT system has negligIble drift due to thermal expansion. The system static offset is removed by high altitude zero calibration lines and employing local leveling corrections where necessary.
The operator is responsible for ensuring the instrument is properly warmed up prior to departure and that the instruments are operated properly throughout the flight. He also maintains a detailed flight log during the survey noting the times of the flight and any lUlUSUal geophysical or topographic features.
On return of the pilot and operator to the base usually after each flight, the ProtoDAS streaming EM data and the RMS data are carried on removable hard drives and FlashCards, respectively and transferred to the data processing work station. At the end of each day, the base station magnetometer data on FlashCard is retrieved from the base station unit.
Data verification and quality control includes a comparison of the acquired GPS data with flight plan; verification and conversion of the RMS data to an ASCIT format XYZ file, verification of the base station magnetometer data and conversion to ASCIT format XYZ data; and loading, processing and conversion of the streaming EM data from the removable hard drive. All data are then merged to an ASCIT XYZ format file which is then imported to an Oasis database for further QAlQC and for the production of preliminary EM, magnetic contour, and flight path maps.
Survey lines which show excessive deviation from the intended flight path are re-flown. Any line or portion of a line on which the data quality did not meet the contract specification was noted and reflown.
AeroQuest Limited Report on an AeroTEM n Airborne Geophysical Survey

6. AIRCRAFT AND EQUIPMENT
6.1. Aircraft A Eurocopter (Aerospatiale) AS350B2 "A-Star" helicopter - registration C-FBTW was used as survey platform. The helicopter was owned and operated by Gateway Helicopters Limited, Sudbury, Ontario. Installation of the geophysical and ancillary equipment was carried out by AeroQuest Limited in Timmins at the Gateway hangar. The survey aircraft was flown at a nominal terrain clearance 0[220 ft (70 m).
Figure 8. The magnetometer bird (foreground) and AeroTEM II EM bird
6.2. Magnetometer
The Aero Quest airborne survey system employs the Geometrics G-823A cesium vapour magnetometer sensor installed in a two metre towed bird airfoil attached to the main tow line, 17 metres below the helicopter. The sensitivity of the magnetometer is 0.001 nanoTesla at a 0.1 second sampling rate. The nominal ground clearance of the magnetometer bird is 51 metres (170 ft .). The magnetic data is recorded at 10Hz by the RMS DGR-33.
6.3. Electromagnetic System The electromagnetic system is an Aero Quest AeroTEM© II time domain towed-bird system. The current AeroTEM© transmitter dipole moment is 38.8 kNIA. The AeroTEM© bird is towed 38 m (125 ft) below the helicopter. More technical details of the system may be found in Appendix 4.
AeroQuest Limited - Report on an AeroTEM II Airborne Geophysical Survey 14
_ The wave-form is triangular with a symmetric transmitter on-time pulse of 1.150 ms and a base frequency of 150 Hz. The current alternates polarity every on-time pulse. During every Tx on-off cycle (300 per second), 126 contiguous channels ofraw x and z component (and a transmitter current monitor, itx) of the received waveform are measured. Each channel width is 26.455 microseconds starting at the beginning of the transmitter pulse. This 126 channel data is referred to as the raw streaming data. The AeroTEM© system has two separate EM data recording streams, the conventional RMS DGR-33 and the PROTODAS system which records the full waveform.
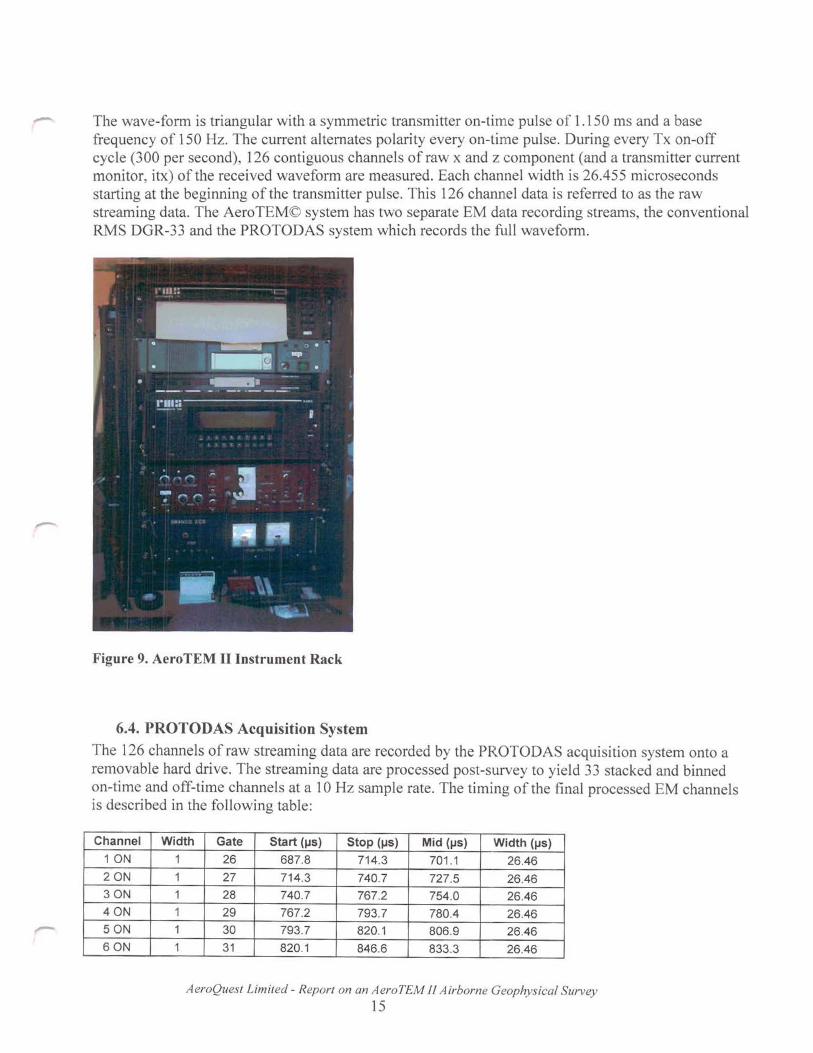
Figure 9. AeroTEM II Instrument Rack
6.4. PROTODAS Acquisition System The 126 channels of raw streaming data are recorded by the PROTODAS acquisition system onto a removable hard drive. The streaming data are processed post-survey to yield 33 stacked and binned on-time and off-time channels at a 10Hz sample rate. The timing of the final processed EM channels is described in the following table:
Channel
10N
20N
30N
40N
50N
60N
Width Gate Start (I-Is) Stop (I-Is) Mid (I-Is) Width (I-Is)
1
1
1
1
1
1
26 687.8 714.3 701 .1 26.46
27 714.3 740.7 727.5 26.46
28 740.7 767.2 754.0 26.46
29 767.2 793.7 780.4 26.46
30 793.7 820.1 806.9 26.46
31 820.1 846.6 833.3 26.46
AeroQuest Limited - Report on an AeroTEM 1/ Airborne Geophysical Survey 15

I
!
I
I
!
70N 1 32 846.6 873.0 859.8 26.46
80N 1 33 873.0 899.5 886.2 26.46 I
90N 1 34 899.5 925.9 912.7 26.46
10 ON 1 35 925.9 952.4 939.2 26.46
110N 1 36 952.4 978.8 965.6 26.46
12 ON 1 37 978.8 1005.3 992.1 26.46
130N 1 38 1005.3 1031.7 1018.5 26.46
140N 1 39 1031.7 1058.2 1045.0 26.46
150N 1 40 1058.2 1084.7 1071.4 26.46
16 ON 1 41 1084.7 1111.1 1097.9 26.46
OOFF 1 44 1164.0 1190.5 1177.2 26.46
1 OFF 1 45 1190.5 1216.9 1203.7 26.46
2 OFF 1 46 1216.9 1243.4 1230.2 26.46
30FF 1 47 1243.4 1269.8 1256.6 26.46
40FF 1 48 1269.8 1296.3 1283.1 26.46
50FF 1 49 1296.3 1322.8 1309.5 26.46
60FF 1 50 1322.8 1349.2 1336.0 26.46 ; 7 OFF 1 51 1349.2 1375.7 1362.4 26.46
80FF 1 52 1375.7 1402.1 1388.9 26.46
90FF 1 53 1402.1 1428.6 1415.3 26.46 !
10 OFF 1 54 1428.6 1455.0 1441.8 26.46
11 OFF 1 55 1455.0 1481.5 1468.3 26.46 I
120FF 1 56 1481.5 1507.9 1494.7 26.46
130FF 4 57 1507.9 1613.8 1560.8 105.82
140FF 8 61 1613.8 1825.4 1719.6 211.64
150FF 16 69 1825.4 2248.7 2037.0 423.28
160FF 32 85 2248.7 3095.2 2672.0 846.56
6.5. RMS DGR-33 Acquisition System
In addition to the magnetics, altimeter and position data, six channels of real time processed off-time EM decay in the Z direction and one in the X direction are recorded by the RMS DGR-33 acquisition system at 10 samples per second and plotted real-time on the analogue chart recorder. These channels are derived by a binning, stacking and filtering procedure on the raw streaming data. The primary use of the RMS EM data (Zl to Z6, Xl) is to provide for real-time QAlQC on board the aircraft.
The channel window timing of the RMS DGR-33 6 channel system is described in the table below.
RMSChannel
Z1, X1 Z2 Z3 Z4 Z5 Z6
Start time End time Width Streaming Noise (microsec) {microsec} (microsec) Channels tolerance
1269.8 1322.8 52.9 48-50 20ppb 1322.8 1455.0 132.2 50-54 20 ppb 1428.6 1587.3 158.7 54-59 15 ppb 1587.3 1746.0 158.7 60-65 15 ppb 1746.0 2063.5 317.5 66-77 10Qpb 2063.5 2698.4 634.9 78-101 10 ppb
AeroQuest Limited - Report on an AeroTEM II Airborne Geophysical Survey 16

-
6.6. Magnetometer and GPS Base Station An integrated GPS and magnetometer base station is set up to monitor the static position GPS errors to permit differential post-processing and to record the diurnal variations of the Earth's magnetic field. Each sensor, GPS and magnetic, receiver/signal processor was attached to a dedicated laptop computer for purposes of instrument control and/or data display and recording. The laptops are, in turn, linked together to provide a common recording time reference using the GPS clock.
The base magnetometer was a Gem Systems GSM-19 overhauser magnetometer coupled with a Picodas MEP-71 0 frequency counter/decoupler. Data logging and magnetometer control was provided by the Picodas basemag.exe software. The logging was configured to measure at 1.0 second intervals. Digital recording resolution was 0.1 nT. The sensor was placed on a tripod away from potential noise sources near the camp. A continuously updated profile plot of the base station values is available for viewing on the base station display.
The GPS base station employed a Leica Mx9212 12 channel GPS receiver with external antenna mounted near the magnetometer sensor. Although the GPS receiver was controlled by the Picodas cdu510.exe software, logging was not engaged as the aircraft employed a real-time differential GPS receiver. The base GPS was used only for the GPS clock for synchronization purposes.
12 ON-TIME CHANNELS
/
0.5
CURRENT WAVEFORM
1.5
16 OFF-TIME CHANNELS
2 2.5 3
TIME (msecs)
L-~'---""" HIGH CONDUCTANCE RESPONSE
LOW CONDUCTANCE RESPONSE ·1
Figure 10. Schematic of Transmitter and Receiver waveformss
AeroQuest Limited - Report on an AeroTEM [[ Airborne Geophysical Survey 17
6.7. Radar Altimeter
A Terra TRA 3500/TRI-30 radar altimeter is used to record terrain clearance. The antenna was mounted on the outside of the helicopter beneath the cockpit. The recorded data represents the height of the antenna, i.e. helicopter, above the ground. The Terra altimeter has an altitude accuracy of +/- 1.5 metres.
Video Tracking and Recording System A high resolution colour VHS/8mm video camera is used to record the helicopter ground flight path along the survey lines. The video is digitally annotated with GPS position and time and can be used to verify ground positioning information and cultural causes of anomalous geophysical responses.
6.S. GPS Navigation System The navigation system consists of an Ag-Nav Incorporated AG-NA V2 GPS navigation system comprising a PC-based acquisition system, navigation software, a deviation indicator in front ofthe aircraft pilot to direct the flight, a full screen display with controls in front ofthe operator, a Mid-Tech RX400p W AAS-enabled GPS receiver mounted on the instrument rack and an antenna mounted on the magnetometer bird. W AAS (Wide Area Augmentation System) consists of approximately 25 ground reference stations positioned across the United States that monitor GPS satellite data. Two master stations, located on the east and west coasts, collect data from the reference stations and create a GPS correction message. This correction accounts for GPS satellite orbit and clock drift plus signal delays caused by the atmosphere and ionosphere. The corrected differential message is then broadcast
/- through one of two geostationary satellites, or satellites with a fixed position over the equator. The corrected position has a published accuracy of under 3 metres. A recent static ground test of the MidTech W AAS GPS yielded a standard deviation in x and y of under 0.6 metres and for z under 1.5 metres over a two-hour period.
Survey co-ordinates are set up prior to the survey and the information is fed into the airborne navigation system. The co-ordinate system employed in the survey design was WGS84 [World] using the UTM zone 18N projection. The real-time differentially corrected GPS positional data was recorded by the RMS DGR-33 in geodetic coordinates (latitude and longitude using WGS84) at 0.2 second intervals.
6.9. Digital Acquisition System The AeroTEM© received waveform sampled during on and off-time at 126 channels per decay, 300 times per second, was logged by the proprietary PROTODAS data acquisition system. The channel sampling commences at the start of the Tx cycle and the width of each channel is 26.445 microseconds. The streaming data was recorded on a removable hard-drive and was later backed-up onto DVD-ROM from the field-processing computer.
The RMS Instruments DGR33A data acquisition system was used to collect and record the analogue data stream, i.e. the positional and secondary geophysical data, including processed 6 channel EM, magnetics, radar altimeter, GPS position, and time. The data was recorded on 128Mb capacity FlashCard. The RMS output was also directed to a thermal chart recorder.
AeroQuest Limited - Report on an A eroTEM II Airborne Geophysical Survey
18
7. PERSONNEL
The following Aero Quest personnel were involved in the project: • Manager of Operations: Bert Simon • Field Data Processors: Rory Kutluoglu, Steve Balch, Jonathan Rudd • Field Operators: Chris Kozak, Barry Levy • Data Interpretation and Reporting: Jonathan Rudd, Matthew Pozza
The survey pilot, Bruno Prieur, was employed directly by the helicopter operator - Gateway Helicopters Ltd.
8. DELIVERABLES
The report includes a set of fourteen geophysical maps plotted at a scale of 1 :20,000. Each of the seven project areas has two maps described as follows:
• Map 1: Line contoured Total Magnetic Field with EM anomalies • Map 2: EM Plan Profiles, Z4, Z8 & Z12 off-time profiles with EM anomalies
All geophysical data presented on the maps have been windowed to the claim block outlines. The coordinate/projection system for the maps is NAD27 Canada Mean Universal Transverse Mercator Zone 17 north. For reference, the latitude and longitude in NAD27 are also noted on the maps. All the maps show flight path trace, skeletal topography, and conductor picks represented by an anomaly symbol classified according to calculated on-time conductance. The anomaly symbol is accompanied by postings denoting the calculated on-time conductance, a thick or thin classification and an anomaly identifier labeL The anomaly symbol legend is given in the margin of the maps. The magnetic field data is presented as superimposed line contours with a minimum contour interval of 5 nT. Bold contour lines are separated by 100 nT.
The geophysical profile data is archived digitally in a Geosoft GDB binary format database. The database contains the processed streaming data, the RMS data, the base station data, and all processed channels. A description of the contents of the individual channels in the database can be found in Appendix 3. This digital data is archived at the Aeroquest head office in Milton.
9. DATA PROCESSING AND PRESENTATION
All in-field and post-field data processing was carried out using Aeroquest proprietary data processing software, and Geosoft Oasis montaj software. Maps were generated using 36-inch wide Hewlett Packard ink-jet plotters.
AeroQuest Limited - Report on an AeroTEM II Airborne Geophysical Survey 19
9.1. Base Map The geophysical maps accompanying this report are based on positioning in the datum ofNAD27 Canada Mean. The survey geodetic GPS positions have been projected using the Universal Transverse Mercator projection in Zone 17 North. A summary of the map datum and projection specifications are as follows:
• Ellipse: Clark 1866 • Ellipse major axis: 6378206.4m eccentricity: 0.082271854 • Datum: North American 1927 - Canada Mean • Datum Shifts (x,y,z) : 10, -158, -187 metres • Map Projection: Universal Transverse Mercator Zone 17 (Central Meridian 81 0 W) • Central Scale Factor: 0.9996 • False Easting, Northing: 500,000m, Om
The skeletal topography was derived from the Federal Government's I: 50,000 NTS map series.
9.2. Flight Path & Terrain Clearance The position of the survey helicopter was directed by use of the Global Positioning System (GPS). Positions were updated five times per second (5Hz) and expressed as WGS84 latitude and longitude calculated from the raw pseudo range derived from the CIA code signal. The instantaneous GPS flight path, after conversion to UTM co-ordinates, is drawn using linear interpolation between the xly positions. The terrain clearance was maintained with reference to the radar altimeter. The raw Digital Terrain Model (DTM) was derived by taking the GPS survey elevation and subtracting the radar altimeter terrain clearance values. The calculated topography elevation values are relative and are not tied in to surveyed geodetic heights.
Each flight included at least two high elevation 'background' checks. During the high elevation checks, an internal 5 second wide calibration pulse in all EM channels was generated in order to ensure that the gain of the system remained constant and within specifications.
9.3. Electromagnetic Data The raw streaming data, sampled at a rate of 38,400 Hz (126 channels, 300 times per second) was reprocessed using a proprietary software algorithm developed and owned by Aeroquest Limited. Processing involves the compensation of the X and Z component data for the primary field waveform. Coefficients for this compensation for the system transient are determined and applied to the stream data. The stream data are then pre-filtered, stacked, binned to the 33 on and off-time channels and checked for the effectiveness ofthe compensation and stacking processes. The stacked data is then filtered, leveled and split up into the individual line segments. Further base level adjustments may be carried out at this stage.
The filtering of the stacked data is designed to remove or minimize high frequency noise that can not be sourced from the geology. An overburden stripped response was generated by subtracting the offtime response from the on-time response for the Xl to X16 and Zl to Z16 channels. New RMS
AeroQuest Limited - Report on an Aero TEM [J Airborne Geophysical Survey 20
emulation channel windows, ZINew to Z6New and XINew, were calculated based on the original 6 zcomponent and 1 x-component channels that the AeroTEM I system recorded in order to provide for compatibility and comparisons with earlier AeroTEM surveys.
The picked EM anomalies plotted on the survey maps were hand interpreted with the aid of an automated pick of the stream data. Apparent bedrock EM anomalies were characterized as either thick or thin conductors based on excursions in the Z and X channel responses. These picked anomalies were then reviewed and edited by a geophysicist to determine the conductor type (thick or thin) as well as to discriminate between bedrock and overburden sources.
In addition, a conductance value has been calculated based on a horizontal plate source model for those data points along the line where the response amplitude is sufficient to yield an acceptable estimate. The conductance was computed based on both the on-time and off-time channels. The ontime data provide a more accurate measure of the conductance of high-conductance sources.
The final processing step was to merge the processed EM data with the other data sets into a Geosoft GDB file. The EM fiducial is used to synchronize the two datasets. The processed channels are labeled in the "streaming" database as Zonl to Zonl6, ZoffO to Zoff16, Xonl to Xonl6, and XoffO to Xoff16.
Each conductor pick has been given an identification letter label, classified as either a thick (K) or thin (N) conductor and has also been classified according to a set of seven ranges of calculated on-time conductance values. The anomalies were then plotted on the plan maps with one of seven symbols reflecting that classification level.
9.4. Magnetic Data Prior to any leveling the magnetic data was subjected to a lag correction of -0.1 seconds and a spike removal filter. The filtered aeromagnetic data were then corrected for diurnal variations using the magnetic base station and the intersections of the tie lines. No corrections for the regional reference field (IGRF) were applied. The corrected profile data were interpolated on to a grid using a random grid technique with a grid cell size of 15 metres. The final leveled grid provided the basis for threading the presented contours which have a minimum contour interval of 5 nT.
to.RESULTS AND INTERPRETATION
10.1. Overview The survey was successful in mapping the magnetic and conductive properties of the geology throughout the survey area. The magnetic data provide a high resolution map of the distribution of the magnetic minerals. The sources for anomalous magnetic responses are generally thought to be predominantly magnetite because of the relative abundance and strength of response (high magnetic susceptibility) of magnetite over other magnetic minerals such as pyrrhotite. The magnetic data ranges from lows of approximately 56500 nT to highs of up to 59,800 nT with an average background of 57,500 nT.
AeroQuest Limited - Report on an AeroTEM 11 Airborne Geophysical Survey
21
The most prominent magnetic features in the Survey area are strong curvilinear to oblate magnetic highs. These features are interpreted to reflect mafic to ultramafic flows or intrusions and, as such, represent a significant marker for Ni-Cu-PGE exploration as many such deposits occur within or at the margin of ultra-mafic bodies. The separated nature of the anomaly peaks within the intrusion is suggestive orthogonal faulting or fracturing ofthe intrusive complex.
A second distinct magnetic pattern is a series of linear magnetic highs which generally trend slightly west of north. These features are narrower and of a lower magnetic amplitude than the dominant features mentioned above and are interpreted to reflect mafic to ultramafic dykes which crosscut the geology. Some of these dykes appear to exploit lineaments interpreted to trend north northwest. These dykes are not considered to be particularly significant for Ni-Cu-PGE exploration, but nevertheless may add to the structural understanding of the area.
The EM data is dominated by the response from a ubiquitous covering of clay-rich sediment. This response is seen as a high amplitude response in the early on- and off-time Z component responses. The response decays rapidly indicating a relatively low conductance typical of overburden of this type. The areas where the response persists to the later channels may indicate a local increase in bedrock conductance but may also indicate the presence of a thicker (or more clay rich) sequence of overburden. Cases in which there is a lack of an accompanying x-component response favour the latter interpretation. The x-component is useful for the detection of lateral inhomogeneity in the conductivity structure of the geology.
The AeroTEM II system penetrates to depths of up to 250m for large conductive bedrock sources. The EM responses interpreted as originating from bedrock sources have been identified and plotted on the maps. A few good conductors have been identified, particularly in the Watson area. However most of the features identified are too low in conductance to reflect prospective Ni-Cu targets. Nevertheless, given the general prospectivity of the area, the conductivity may be reflecting mineralization in a favourable geologic environment and as such may be worthy of follow-up.
10.2. 'Groundhog South' - Survey Block A
The most interesting feature of the Groundhog area is a linear trend of EM anomalies within claim block P3017289. The anomaly picks parallel a northeast trending magnetic feature, and show low calculated conductance values (less than 13 S).
10.3. 'Mine' - Survey Blocks B and C-The comparatively large 'Mine' survey area is dominated by the high amplitude magnetic response associated with the Montcalm Gabbroic Complex (MGC). Numerous weak (1-5 S) EM anomalies have been identified on or near the margins of high amplitude magnetic responses related to the intrusion (i.e. claims P3006251, P3006289). Anomaly C on line 20580 showed the highest calculated "on-time" conductance of to.7 S and is interpreted as a steeply-dipping thin conductor.
10.4. 'Nova' - Survey Block C Line 30710 over claim block P1169802 shows a moderately good conductor (34.2 S). This response is located near the peak of a 400 nT oblate magnetic anomaly. A clustering of EM picks showing lower calculated conductance (-10 S) are also in this vicinity. Directly north of the Nova claim boundary are several northwest-trending EM responses which vary in conductance along strike (2-25 S).
AeroQuest Limited - Report on an AeroTEM II Airborne Geophysical Survey
22
10.5. 'Belford' - Survey Block C The strongest EM response in the Belford block is on lines 4551,4561 and 4571 (within claim block P3008927). The source of the anomalies is of relatively low conductance (7-13 S) as indicated by both the on- and off-time data sets. The EM anomalies occur near the margin a north-northwest trending magnetic feature, which parallels the intrusive complex to the south.
10.6. 'Watson' - Survey Block E The EM data in the southern portion ofthe Watson area (P1169856) shows an area of high conductivity (as high as 40 S) on lines 1911 and 1921. These EM anomalies show a corresponding magnetic response of approximately 100 nT.
Other targets of interest occur in the northern portion ofthe Watson block on Lines 71 to 161. The EM picks here have a linear trend which parallel a large northeast trending magnetic feature to the South. Line 141 (Anomaly B) shows the highest calculated "on-time" conductance of 42.9 S.
The magnetic response of the Watson area is dominated by the MGC, which is generally trending North-South in the area. Like the Mine area, there are numerous weak (1-5 S) EM anomalies on or near the margins of the high amplitude magnetic anomalies related to the intrusion.
10.7. 'Strachan' - Survey Block F The bedrock with the Strachan Block is highly resistive with the exception of a single moderately weak "thin" conductor detected on line 931. The anomaly shows a calculated conductance of 3.9 S and occurs on the margin of a high amplitude magnetic feature interpreted to be an ultramafic dyke.
10.8. 'Montcalm North' - Survey Block G Montcalm North contains several very-weak to weak: conductors located near the margins of lowamplitude east-west trending magnetic lineaments (Le. the anomaly picks within claim block P301Ol63, on lines 71 through 131.) The anomaly on line 101 is located on the margin ofamagnetic high and has the highest calculated conductance in the Montcalm North Area (9.1 S). In contrast Lines 311 and 321 show a weak EM conductor located directly on high amplitude magnetic anomaly related to a north-south trending mafic intrusion.
Respectfully submitted,
~ ~ Jonathan Rudd, P.Eng. Aeroquest Limited November 12,2004
AeroQuest Limited - Report on an AeroTEM II Airborne Geophysical Survey 23
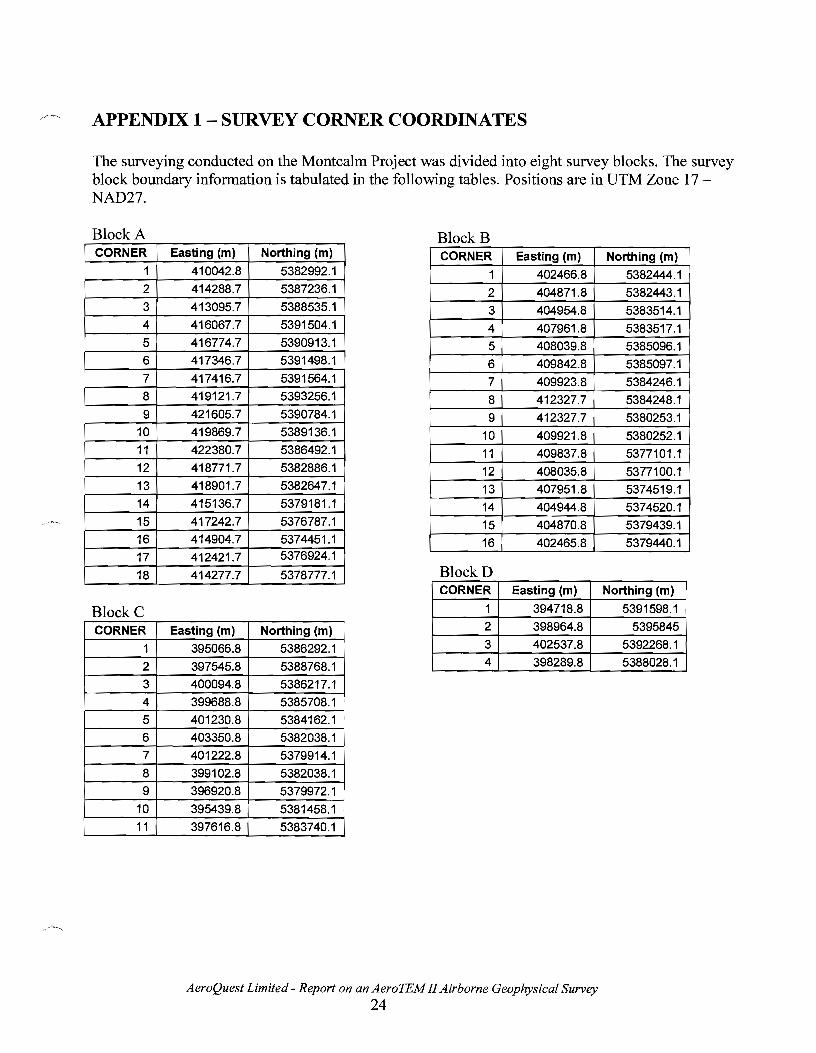
APPENDIX 1 - SURVEY CORNER COORDINATES
The surveying conducted on the Montcalm Project was divided into eight survey blocks. The survey block boundary information is tabulated in the following tables. Positions are in UTM Zone 17 NAD27.
Block A CORNER
1 2 3 4
5 6 7 8
9 10 11
12 13 14
15 16
17
18
Block C CORNER
1 2 3
4 5 6 7
8 9
10 11
BlockB Easting (m) Northing (m) CORNER Easting (m)
410042.8 5382992.1 1 402466.8 414288.7 5387236.1 2 404871.8 413095.7 5388535.1 3 404954.8 416067.7 5391504.1 4 407961.8 416774.7 5390913.1 5 408039.8 417346.7 5391498.1 6 409842.8 417416.7 5391564.1 7 409923.8 419121.7 5393256.1 8 412327.7 421605.7 5390784.1 9 412327.7 419869.7 5389136.1 10 409921.8 422380.7 5386492.1 11 409837.8 418771.7 5382886.1 12 408035.8 418901.7 5382647.1 i 13 407951.8 415136.7 5379181.1 14 404944.8 417242.7 5376787.1 15 404870.8 414904.7 5374451.1 16 402465.8 412421.7 5376924.1 I
414277.7 5378777.1 BlockD CORNER Easting (m)
1 394718.8 2 398964.8 Easting (m) Northing (m)
!
395066.8 5386292.1 : 3 402537.8
397545.8 5388768.1 4 398289.8
400094.8 5386217.1 399688.8 5385708.1 i 401230.8 5384162.1 J 403350.8 5382038.1 i
401222.8 5379914.1 399102.8 5382038.1 396920.8 5379972.1 . 395439.8 5381458.1 397616.8 5383740.1
AeroQuest Limited - Report on an A eroTEM II Airborne Geophysical Survey
24
Northing (m) j 5382444.1
5382443.1 5383514.1
5383517.1 J 5385096.1 J 5385097.1 J 5384246.1
5384248.1 I 5380253.1 i 5380252.1 I 5377101.1 I 5377100.1 I
5374519.1 5374520.1 5379439.1
5379440.1
Northing (m)
5391598.1
5395845 5392268.1 5388028.1
BlockE CORNER
1
2
3
4
5
6
7
8
9
10
11
12
13
BlockF CORNER
1
2
3
4
5
6
7
8
9
10
11
12
13
14
BlockG CORNER
1
2
3
4
Easting (m) Northing (m)
399968.8 5399349
402982.8 5399442
403005.8 540371 OJ
403510.8 5403791 I
403510.8 5410690 I 406516.8 5410688
406517.8 5403791 • 407028.8 5403710
407029.8 5401309
407000.8 5396956
405486.8 5396882 .
405484.8 5392677.1
399968.8 5392676.1
Easting (m) Northing (m)
404078.8 5369066.2
406906.8 5371895.1
408391.8 5370410.2
411577.7 5373495.1
413484.7 5371574.2
414269.7 5372247.1
416388.7 5370128.2 '
413984.7 5367582.2
415690.7 5365860.2
413557.7 5363758.2
409670.8 5367645.2
409242.8 5367332.2
407335.8 5369243.2
405563.8 5367581.2
Easting (m) Northing (m)
415490.7 5396064
419984.7 5396077
420006.7 5393064.1 I
415490.7 5393065.1
AeroQuest Limited - Report on an AeroTEM II Airborne Geophysical Survey
25

/~ APPENDIX 2 - PROPERTY OWNERSHIP Appendix 1 The Montcalm Area consists of seven separate mining claim blocks south of the Montcalm Minesite owned 100% by Falconbridge Limited (Figure Z):
CLAIM# UNITS TOWNSHIP DUE_DATE CLAIM BLOCK
P3008911 15 BELFORD 20051010 Belford
P3008912 15 BELFORD 20051010 Belford
P3008913 13 BELFORD 20051010 Belford
P3008914 16 BELFORD 20051010 Belford I P3008926 2 BELFORD 20051010 Belford I
I
P3008927 16 BELFORD 20051010 Belford I
P3006306 7 STRACHAN 20050428 Groundhog South
P3006307 12 STRACHAN 20050428 Groundhog South
P3006308 9 STRACHAN 20050428 Groundhog South
P3017288 12 STRACHAN 20061118 Groundhog South
P3017289 9 STRACHAN 20061118 Groundhog South J P1200538 2 STRACHAN 20081220 Mine
P1240890 2 MONTCALM 20060317 Mine
P1240891 1 STRACHAN 20050624 Mine
P30010020 8 MONTCALM 20051125 Mine
P300 1002 1 8 MONTCALM 20051125 Mine
P300 1 0022 16 MONTCAI,M 20061118 Mine
P3 00 10023 16 MONTCALM 20061118 Mine
P30010024 16 MONTCAIJM 20051125 Mine
P30010025 16 MONTCALM 20061118 Mine
P30010026 6 MONTCALM 20061118 Mine
. P3005309 8 MONTCALM 20050423 Mine
P3005310 4 MONTCALM 20050423 Mine
P3005311 16 MONTCALM 20050423 Mine
, P3005312 16 MONTCALM 20050423 Mine
P3005313 16 MONTCAI~\1 20050423 Mine
P3005314 6 MONTCALM 20050423 Mine
I P3005315 16 MONTCALM 20050423 Mine
P3005316 8 STRACHAN 20050423 Mine
P3005317 8 STRACHAN 20050423 Mine
P3005318 4 MONTCALM 20050423 Mine I P3005319 15 MONTCALM 20050423 Mine
P3005320 2 MONTCALM 20050423 Mine
P3005321 1 MONTCALM 20050423 Mine
P3006238 12 NOVA 20050428 Mine
P3006239 16 NOVA 20050428 Mine
P3006240 16 STRACHAi\f 20050428 Mine
P3006241 15 NOVA 20050428 Mine
P3006242 6 NOVA 20050428 Mine
: P3006243 16 STRACHAN 20050428 Mine
P3006244 16 STRACHAN 20050428 Mine
AeroQuest Limited - Report on an AeroTEM II Airborne Geophysical Survey 26

CLAIM# UNITS TOWNSHIP DUE_DATE CLAIM BLOCK P3006245 16 MONTCALM 20050428 Mine
P3006246 12 MONTCALM 20050428 Mine
P3006250 16 BELFORD 20050428 Mine
P3006251 12 BELFORD 20050428 Mine
P3006252 12 BELFORD 20050428 Mine
P3006253 8 BELFORD 20050428 Mine
P3006257 16 BELFORD 20050428 Mine
P3006258 4 BELFORD 20050428 Mine
P3006259 9 BELFORD 20050428 Mine
P3006260 15 BELFORD 20050428 Mine
P3006261 12 BELFORD 20050428 Mine
P3006286 16 BELFORD 20050428 Mine
P3006287 4 NOVA 20050428 Mine
P3006288 12 NOVA 20050428 Mine
P3006289 16 NOVA 20050428 Mine
P3006300 9 NOVA 20050428 Mine
P3006301 2 NOVA 20050428 Mine
P3008929 15 BELFORD 20051010 Mine
P3008930 9 BELFORD 20051010 Mine
P3008931 6 BELFORD 20051010 Mine
P3009220 5 MONTCALM 20050428 Mine
P3009221 12 MONTCALM 20050428 Mine
P3009222 4 MONTCALM 20050428 Mine
P3009223 12 MONTCALM 20050428 Mine
P3009224 16 MONTCALM 20050428 Mine
P3009225 16 MONTCALM 20050428 Mine
P3009226 16 MONTCALM 20050428 Mine
P3009227 3 STRACHAN 20050428 Mine
P30 1 0027 12 MONTCALM 20050423 Mine
P3010028 2 MONTCALM 20050423 Mine
P3010029 9 MONTCALM 20050423 Mine
P3010803 8 MONTCALM 20051125 Mine
. P3010804 6 MONTCALM 20051125 Mine
P3010805 12 MONTCALM 20051125 Mine
P3010806 4 MONTCALM 20051125 Mine
P3010807 16 MONTCALM 20061118 Mine
P3017515 6 STRACHAN 20060406 Mine
P3017516 12 MONTCALM 20060406 Mine
P3010163 3 MONTCALM 20050626 Montealm North
i P3010164 3 MONTCALM 20050626 Montcalm North
P3010166 2 MONTCALM 20050626 Montcalm North
P3010167 2 MONTCALM 20050626 Montcalm North
P3010168 2 MONTCALM 20050626 Montcalm North
P3010169 2 MONTCALM 20050626 Montcalm North
P3010170 3 MONTCALM 20050626 Montcalm North
P3010171 3 MONTCALM 20050626 Montcalm North
P3010172 7 MONTCALM 20050626 Montcalm North
PI 169600 1 NOVA 20051009 Nova
AeroQuest Limited - Report on an AeroTEMl! Airborne Geophysical Survey 27
i
I
!
i

CLAIM# UNITS TOWNSHIP DUE_DATE CLAIM BLOCK
P1169601 1 NOVA 20051009 Nova
P1169602 1 NOVA 20051009 Nova
P1l69603 I NOVA 20051009 Nova
P1l69604 1 NOVA 20051009 Nova
P1169605 1 NOVA 20051009 Nova
P1169606 1 BELFORD 20051009 Nova
P1169607 1 BELFORD 20051009 Nova
P1169608 I BELFORD 20051009 Nova
P1l69609 I BELFORD 20051009 Nova
PI 169610 1 BELFORD 20051009 Nova
P1l69611 1 BELFORD 20051009 Nova
P1l69612 1 NOVA 20051009 Nova
P1169613 1 NOVA 20051009 Nova
P1169614 1 NOVA 20051009 Nova
P3017262 8 NOVA 20061117 Strachan
P3017263 2 NOVA 20061117 Strachan
P3017264 16 NOVA 20061117 Strachan
P3017265 3 NOVA 20061117 Strachan
P3017266 16 STRACHAN 20061117 Strachan
P3017267 12 STRACHAN 20061117 Strachan
P3017268 16 STRACHAN 20061117 Strachan
P3017269 8 STRACHAN 20061117 Strachan
P3017270 4 STRACHAN 20061117 Strachan
P3017271 9 STRACHAN 20061117 Strachan
P3017272 16 STRACHAN 20061117 Strachan
P3017273 16 STRACHAN 20061117 Strachan
P3017274 16 STRACHAN 20061117 Strachan
P3017275 12 STRACHAN 20061117 Strachan
P3017276 16 STRACHAN 20061117 Strachan
P3017277 16 STRACHAN 20061117 Strachan
P3017278 16 STRACHAN 20061117 Strachan
P3017279 12 MELROSE 20061117 Strachan
P3017280 16 MELROSE 20061117 Strachan
P3017281 16 STRACHAN 20061117 Strachan
P3017282 8 STRACHAN 20061117 Strachan
P3017283 16 STRACHAN 20061117 Strachan
P3017284 16 STRACHAN 20061117 Strachan
P1169586 1 WATSON 20051009 Watson
P1169587 1 WATSON 20051009 Watson
P1169588 1 WATSON 20051009 Watson
PI 169589 1 WATSON 20051009 Watson
P1169590 1 WATSON 20051009 Watson
P1l69591 1 WATSON 20051009 Watson
P1169592 1 BELFORD 20051009 Watson
i P1169593 1 BELFORD 20051009 Watson
PI 169594 1 BELFORD 20051009 Watson
P3 0063 02 15 WATSON 20050428 Watson
P3006303 15 WATSON 20050428 Watson
AeroQuest Limited - Report on an Aero TEM II Airborne Geophysical Survey 28
I
I

CLAIM# U!'.1JTS TOWNSHIP DUE_DATE CLAIM BLOCK
P3006304 15 WATSON 20050428 Watson
P3006305 12 WATSON 20050428 Watson
P3008915 16 WATSON 20051010 Watson
P3008916 16 WATSON 20051010 Watson
P3008917 16 WATSON 20051010 Watson
P3008918 16 GRlFFIN 20051010 Watson
P3008919 16 WATSON 20051010 Watson
P3008920 16 WATSON 20051010 Watson
P3008921 8 WATSON 20051010 Watson
P3008922 8 WATSON 20051010 Watson
P3008923 1 WATSON 20051010 Watson
APPENDIX 3 - Description of Database Fields
The GDB file is a Geosoft binary database. In the database, the Survey lines, Tie Lines, and High AltitudelIntemal Q coil lines are prefixed with an "L" for "Line" and "T" for "Tie".
Database (04028 _Falconbridge _Montaclm_final.gdb):
Column Units Description emfid PROTODAS Fiducial utctime hh:mm:ss.ss UTCtime x m UTM Easting (NAD27, zone 17N)
lY m UTM Northing (NAD27, zone 17N) bheight m Terrain clearance of EM bird dtm m Digital Terrain Model magf nT Final leveled total magnetic intensity basemaJlf nT Base station total magnetiC intensity ZOn1-Z0n16 nTIs Processed Streaming On-Time Z component Channels 1-16 ZOffO-ZOff16 nTIs Processed Streaming Off-Time Z component Channels 0-16 XOn1-XOn16 nTIs Processed Streaming On-Time X component Channels 1-16 XOffO-XOff16 nTIs Processed Streaming Off-Time X component Channels 0-16 Anom labels Letter label of conductor pick Thick Thin Letter label of thick (K) or thin (N) conductor type on con S On-time conductance off con S Off-time conductance grade Classification from 1-7 based on conductance of conductor
pick
AeroQuest Limited - Report on an AeroTEM II Airborne Geophysical Survey
29
i
- .. AQL AEROQUEST LIMITED
Design Considerations
Advanced airborne technology ...
Helicopter-borne EM systems offer an advantage that cannot be matched from a fixed-wing platform. The ability to fly at a slower speed and collect data with high spatial resolution , and with great accuracy, means that helicopter EM systems provide more detail than any other EM configuration, airborne or ground-based. Spatial resolution is especially important in areas of complex geology and in the search for discrete conductors. With the advent of helicopter-borne high-moment time domain EM systems the fixed-wing platforms are losing their only advantage -depth penetration .
Advantage 1 - Spatial Resolution
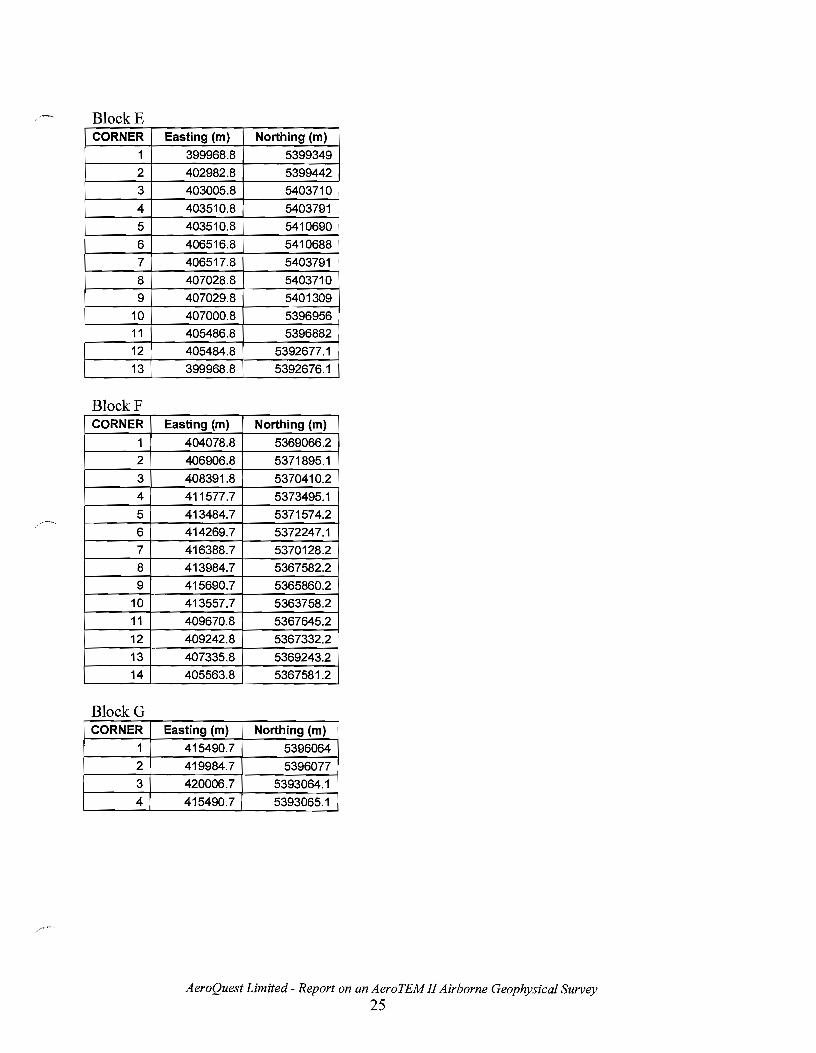
The AeroTEM system is specifically designed to have a small footprint This is accomplished through the use of concentric transmitter-receiver coils and a relatively small diameter transmitter coil (5 m). The result is a highly focused exploration footprint, which allows for more accurate "mapping" of discrete conductors. Consider the transmitter primary field images shown in Figure 1, for AeroTEM versus a fixed-wing transmitter.
The footprint of AeroTEM at the earth's surface is roughly 50 m on either side of transmitter.
The footprint of a fixed-wing system is roughly 150 m on either side of the transmitter.
Figure 1. A comparison of the footprint between AeroTEM and a fixed-wing system, highlights the greater resolution that is achievable with a transmitter located closer to the earth's surface. The AeroTEM footprint is one third that of a fixed-wing system and is symmetric, while the fixed-wing system has even lower spatial resolution along the flight line because of the separated transmitter and receiver configuration.
At first glance one may want to believe that a transmitter footprint that is distributed more evenly over a larger area is of benefit in mineral exploration . In fact, the opposite is true; by energizing a larger surface area, the ability to energize and detect discrete conductors is reduced. Consider, for example, a comparison between AeroTEM and a fixed-wing system over the Mesamax Deposit (1,450,000 tonnes of 2.1% Ni, 2.7% Cu, 5.2 g/t PtlPd). In a test survey over three flight lines spaced 100 m apart, AeroTEM detected the Deposit on all three flight lines. The fixed-wing system detected the Deposit only on two flight lines. In exploration programs that seek to expand the flight line spacing in an effort to reduce the cost of the airborne survey, discrete conductors such as the Mesamax Deposit can go undetected. The argument often put forward in favor of using fixed-wing systems is that because of their larger footprint, the flight line spacing can indeed be widened. Many fixed-wing surveys are flown at 200 m or 400 m. Much of the survey work performed by Aeroquest has been to survey in areas that were previously flown at these wider line spacings. One of the reasons for AeroTEM's impressive discovery record has been the strategy of flying closely spaced lines and finding all the discrete near-surface conductors. These higher resolution surveys are being flown within existing mining camps, areas that improve the chances of discovery.
..1

-
---AQL Advanced airborne technology ...
AEROQUEST LIMITED
250 58250
200 58200
150 58150
I=" .:. E en C- u
.eo 100 58100 j::: w
" z w C)
'" " 50 58050
0 58000
·50 -I-------~----~----~----~----__,----__+ 57950
6826000 6826500 6827000 6827500 6828000 6828500 6829000
350 - 58050 ,
JOO +----------~-------H--------------~
58000
250 +--------~-~-----~~+_------------~
57950 200 +-T-~~------~-~~----~~-~-----------~ i='
.s ~ w ~ u .s 150 +I-----\-----.. >r--fR-- --'..-----+---II-- +--,/--'\-----------__+ 57900 tii ~ z w C)
100 +-------------~
57850
50 +--------------fU~~~H~.----------~I~----------------~ 7L-~~
57800
~0 .-----~-----,-----r-----._----_,----__+ 57750
6826000 6826500 6827000 6827500 6828000 6828500 6829000
NORTHING (m)
'" ~
Figure 2. Fixed-wing (upper) and AeroTEM (lower) comparison over the eastern limit of the Mesamax Deposit, a Ni-Cu-PGE zone located in the Raglan nickel belt and owned by Canadian Royalties. Both systems detected the Deposit further to the west where it is closer to surface.
..2
- .. AQL AEROQUEST UMITED
Advanced airborne technology ...
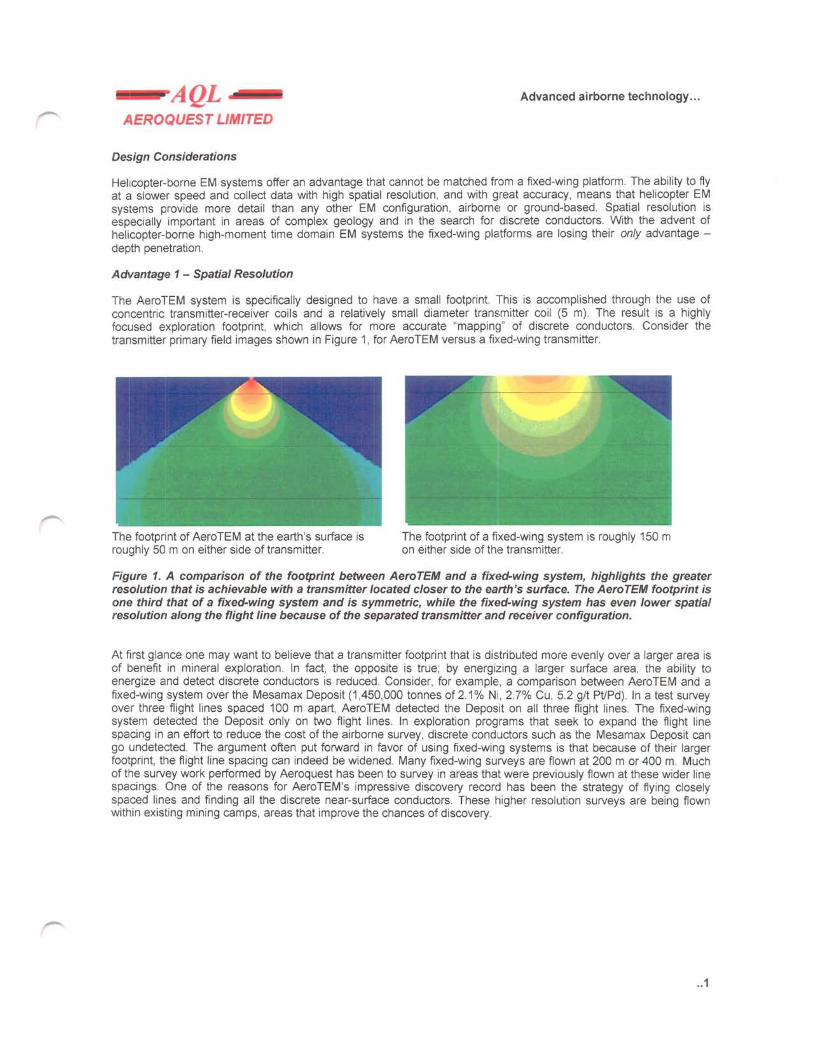
The small footprint of AeroTEM combined with the high signal to noise ratio (SIN) makes the system more suitable to surveying in areas where local infrastructure produces electromagnetic noise, such as power lines and railways. In 2002 Aeroquest flew four exploration properties in the Sudbury Basin that were under option by FNX Mining Company Inc. from Inco Limited. One such property, the Victoria Property, contained three major power line corridors .
The resulting AeroTEM survey identified all the known zones of Ni-Cu-PGE mineralization , and detected a response between two of the major power line corridors but in an area of favorable geology. Three boreholes were drilled to test the anomaly, and all three intersected sulphide. The third borehole encountered 1.3% Ni, 6.7% Cu, and 13.3 glt TPMs over 42.3 ft. The mineralization was subsequently named the Powerline Deposit.
The success of AeroTEM in Sudbury highlights the advantage of having a system with a small footprint, but also one with a high SIN. This latter advantage is achieved through a combination of a high-moment (high signal) transmitter and a rigid geometry (lOW noise) . Figure 3 shows the Powerline Deposit response and the response from the power line corridor at full scale. The width of power line response is less than 75 m.
1000
~ w ~ ·1000 o ... <II W 0::
-ISOO
-2000
-2500
-3000 5139000
A THIN FORMATIONAL /
"1 CONDUCTOR
/ POWERLINE CORRIDOR
5139500 5140000
NORTHING (m)
/ POWERUNE DEPOSIT
•
AJl . ~
" POWERUNE CORRIDOR
-- +--75m
5140500 5141000 5141500
Figure 3. The Powerline Deposit is located between two major power line corridors, which make EM surveying problematic. Despite the strong response from the power line, the anomaly from the Deposit is clearly detected. Note the thin formational conductor located to the south. The only way to distinguish this response from that of two closely spaced conductors is by interpreting the X-axis coil response.
Advantage 2 - Conductance Discrimination
The AeroTEM system features full waveform recording and as such is able to measure the on-time response due to high conductance targets. Due to the processing method (primary field removal) , there is attenuation of the response with increasing conductance, but the AeroTEM on-time measurement is still superior to systems that rely on lower base frequencies to detect high conductance targets, but do not measure in the on-time.
..3
- .. AQL AEROQUEST LIMITED
Advanced airborne technology ...
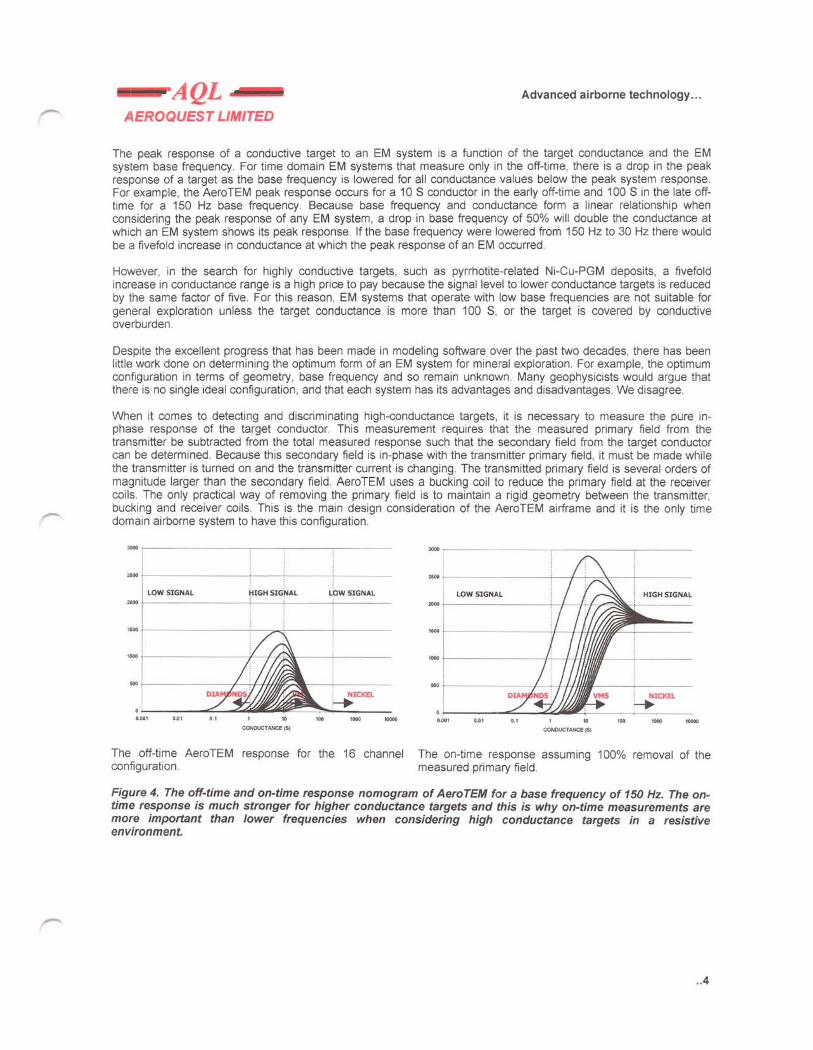
The peak response of a conductive target to an EM system is a function of the target conductance and the EM system base frequency , For time domain EM systems that measure only in the off-time, there is a drop in the peak response of a target as the base frequency is lowered for all conductance values below the peak system response, For example, the AeroTEM peak response occurs for a 10 S conductor in the early off-time and 100 S in the late offtime for a 150 Hz base frequency, Because base frequency and conductance form a linear relationship when considering the peak response of any EM system, a drop in base frequency of 50% will double the conductance at which an EM system shows its peak response, If the base frequency were lowered from 150 Hz to 30 Hz there would be a fivefold increase in conductance at which the peak response of an EM occurred,
However, in the search for highly conductive targets, such as pyrrhotite-related Ni-Cu-PGM deposits, a fivefold increase in conductance range is a high price to pay because the signal level to lower conductance targets is reduced by the same factor of five, For this reason, EM systems that operate with low base frequencies are not suitable for general exploration unless the target conductance is more than 100 S, or the target is covered by conductive overburden ,
Despite the excellent progress that has been made in modeling software over the past two decades, there has been little work done on determining the optimum form of an EM system for mineral exploration , For example, the optimum configuration in terms of geometry, base frequency and so remain unknown, Many geophysicists would argue that there is no single ideal configuration , and that each system has its advantages and disadvantages. We disagree,
When it comes to detecting and discriminating high-conductance targets , it is necessary to measure the pure inphase response of the target conductor, This measurement requires that the measured primary field from the transmitter be subtracted from the total measured response such that the secondary field from the target conductor can be determined, Because this secondary field is in-phase with the transmitter primary field, it must be made while the transmitter is turned on and the transmitter current is changing. The transmitted primary field is several orders of magnitude larger than the secondary field , AeroTEM uses a bucking coil to reduce the primary field at the receiver coils, The only practical way of removing the primary field is to maintain a rigid geometry between the transmitter, bucking and receiver coils . This is the main design consideration of the AeroTEM airframe and it is the only time domain airborne system to have this configuration,
»OO ,-____________ ~----~----~--------
aoo r-------------~----~----~-------
LOW SIGNAL LOW SIGNAL
~00 r--------------+----~----~--------
1600 r-------------~--~:'------__;_--------
1000 r---------------.-,.---.{-r~'----~--------
~ r_-----------r~r+.~~r~---+--------
0.001 G., G.' 10
CONDUCTANCE (5) '00 1000 tOOOO
The off-time AeroTEM response for the 16 channel configuration,
»OO r-------------~----,-----~--------
~ r_------------~--+-~~---~--------
LOW SIGNAL HIGH SIGNAL
, ... r_---------------;-Jf----H"+hlflll.~--;--------
'000 r_-------------,h--+-.I+H
... r_-----------/--+-H+J ; NICKEL
~ 0.001 G., G,' , 10 '00 'OGO , ....
CONDUCTANCE ($1
The on-time response assuming 100% removal of the measured primary field ,
Figure 4. The off-time and on-time response nomogram of AeroTEM for a base frequency of 150 Hz. The ontime response is much stronger for higher conductance targets and this is why on-time measurements are more important than lower frequencies when considering high conductance targets in a resistive environment.
..4
-
_rAQL "-. Advanced airborne technology ...
AEROQUEST LIMITED
Advantage 3 - Multiple Receiver Coils
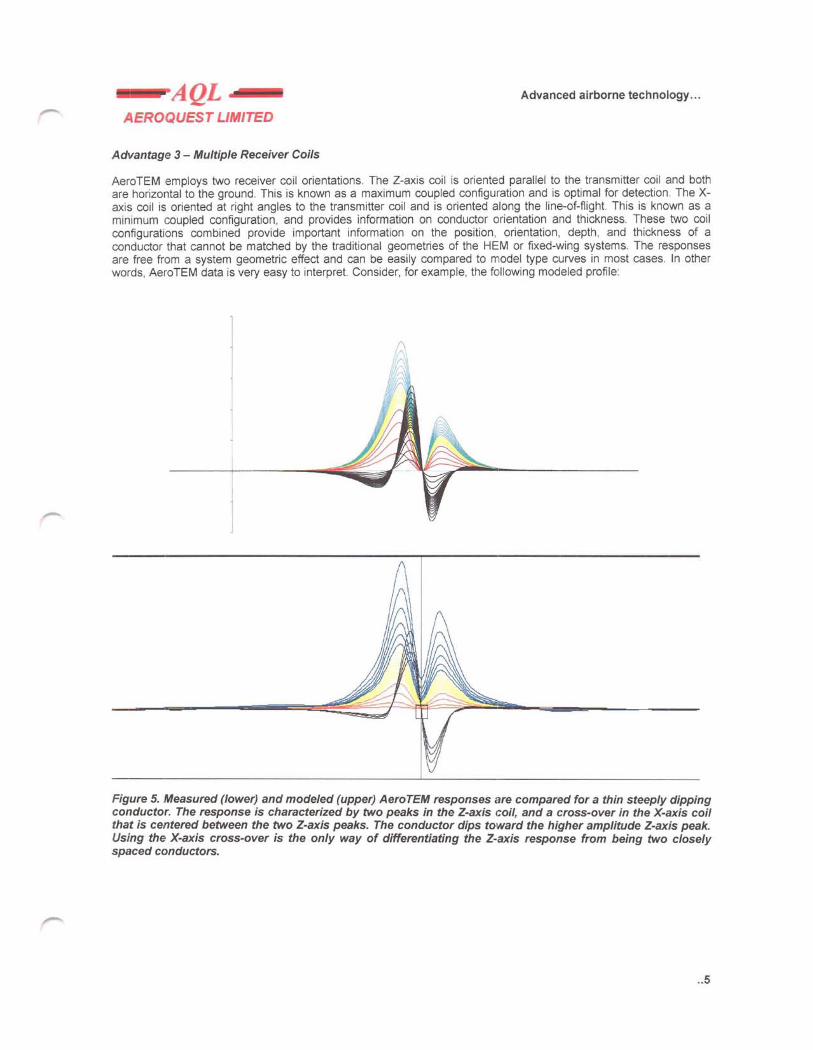
AeroTEM employs two receiver coil orientations. The Z-axis coil is oriented parallel to the transmitter coil and both are horizontal to the ground. This is known as a maximum coupled configuration and is optimal for detection. The Xaxis coil is oriented at right angles to the transmitter coil and is oriented along the line-of-flight. This is known as a minimum coupled configuration, and provides information on conductor orientation and thickness. These two coil configurations combined provide important information on the position, orientation, depth, and thickness of a conductor that cannot be matched by the traditional geometries of the HEM or fixed-wing systems. The responses are free from a system geometric effect and can be easily compared to model type curves in most cases. In other words, AeroTEM data is very easy to interpret. Consider, for example, the following modeled profile:
Figure 5. Measured (lower) and modeled (upper) AeroTEM responses are compared for a thin steeply dipping conductor. The response is characterized by two peaks in the Z-axis coil, and a cross-over in the X-axis coil that is centered between the two Z-axis peaks. The conductor dips toward the higher amplitude Z-axis peak. Using the X-axis cross-over is the only way of differentiating the Z-axis response from being two closely spaced conductors.
..5

-
- .. AQ AEROQUEST LIMITED
HEM versus AeroTEM
Advanced airborne technology ...
Traditional helicopter EM systems operate in the frequency domain and benefit from the fact that they use narrowband as opposed to wide-band transmitters. Thus all of the energy from the transmitter is concentrated in a few discrete frequencies. This allows the systems to achieve excellent depth penetration (up to 100 m) from a transmitter of modest power. The Aeroquest Impulse system is one implementation of this technology.
The AeroTEM system uses a wide-band transmitter and delivers more power over a wide frequency range. This frequency range is then captured into 16 time channels, the early channels containing the high frequency information and the late time channels containing the low frequency information down to the system base frequency. Because frequency domain HEM systems employ two coil configurations (coplanar and coaxial) there are only a maximum of three comparable frequencies per configuration, compared to 16 AeroTEM off-time and 12 AeroTEM on-time channels.
Figure 6 shows a comparison between the Dighem HEM system (900 Hz and 7200 Hz coplanar) and AeroTEM (Zaxis) from surveys flown in Raglan, in search of highly conductive Ni-Cu-PGM sulphide. In general, the AeroTEM peaks are sharper and better defined, in part due to the greater SIN ratio of the AeroTEM system over HEM, and also due to the modestly filtered AeroTEM data compared to HEM. The base levels are also better defined in the AeroTEM data. AeroTEM filtering is limited to spike removal and a 5-point smoothing filter. Clients are also given copies of the raw, unfiltered data.
r'\ ,I
Figure 6. Comparison between Dighem HEM (upper) and AeroTEM (lower) surveys flown in the Raglan area. The Aero TEM responses appear to be more discrete, suggesting that the data is not as heavily filtered as the HEM data. The SIN advantage of AeroTEM over HEM is about 5:1.
Aeroquest Limited is grateful to the following companies for permission to publish some of the data from their respective surveys: Wolfden Resources, FNX Mining Company Inc, Canadian Royalties, Nova West Resources, Aurogin Resources, Spectrem Air. Permission does not imply an endorsement of the AeroTEM system by these companies.
..6

APPENDIX 4: AeroTEM Design Considerations
AeroQuest Limited - Report on an A eroTEM II Airborne Geophysical Survey 30

APPENDIX 5: AeroTEM Instrumentation Specification Sheet
-~EROQUEST LIMITED Tel: +1 905878-5616. Fax: +1 905876-0193. Email: [email protected]
AEROTEM Helicopter Electromagnetic System
System Characteristics
• Transmitter: Triangular Pulse Shape Base Frequency 30 or 150 Hz • Tx On Time - 5,750 (30Hz) or 1,150 (l50Hz) Ils • Tx Off Time - 10,915 (30Hz) or 2,183 (l50Hz) Ils • Loop Diameter - 5 m • Peak Current - 250 A • Peak Moment - 38,800 NIA • Typical Z Axis Noise at Survey Speed 8 ppb peak • Sling Weight: 270 Kg • Length of Tow Cable: 40 m • Bird Survey Height: 30 m or less nominal
Receiver
• Three Axis Receiver Coils (x, y, z) positioned at centre of transmitter loop • Selectable Time Delay to start of first channel 21.3 ,42.7, or 64.0 ms
Display & Acquisition
• PROTODAS Digital recording at 126 samples per decay curve at a maximum of 300 curves per second (26.455 IlS channel width)
• RMS Channel Widths: 52.9,132.3, 158.7, 158.7,317.5,634.9 IlS • Recording & Display Rate = 10 readings per second. • On-board display - six channels Z-component and 1 X-component
System Considerations
Comparing a fixed-wing time domain transmitter with a typical moment of 500,000 NIA flying at an altitude of 120 m with a Helicopter TDEM at 30 m, notwithstanding the substantial moment loss in the airframe of the fixed wing, the same penetration by the lower flying helicopter system would only require a sixty-fourth ofthe moment. Clearly the AeroTEM system with nearly 40,000 NIA has more than sufficient moment. The airframe of the fixed wing presents a response to the towed bird, which requires dynamic compensation. This problem is non-existent for AeroTEM since transmitter and receiver positions are fixed. The AeroTEM system is completely portable, and can be assembled at the survey site within half a day.
AeroQuest Limited - Report on an AeroTEM II Airborne Geophysical Survey 31
APPENDIX 6: Statement of Qualifications
Jonathan Rudd, P .Eng.
1. I am a full-time employee of Aeroquest Limited, based in Milton, Ontario, Canada.
2. My residence is at 54 Alona Avenue, Cambridge, Ontario, N3C 3Y4. 3. I graduated with an honours B.Sc.E. in Geological Engineering in Geophysics,
1988, from Queen's University, Kingston, ON. 4. I have been practicing continuously as an exploration geophysicist for 16
years. 5. I am a registered as a Professional Engineer and am entitled to engage in the
practice of professional engineering in the province of Ontario under the terms of the Professional Engineers Act, Revised Statutes of Ontario, 1990, Chapter p 28. ,
6. Non-professional affiliations: Society of Exploration Geophysicists, Prospectors and Developers Association of Canada, Sudbury Prospectors and Developers Association, Sudbury Geological Discussion Group, Ontario Prospectors Association
7. I directly supervised the airborne geophysical work as described in this report.
AeroQuest Limited Report on an AeroTEM II Airborne Geophysical Survey 32
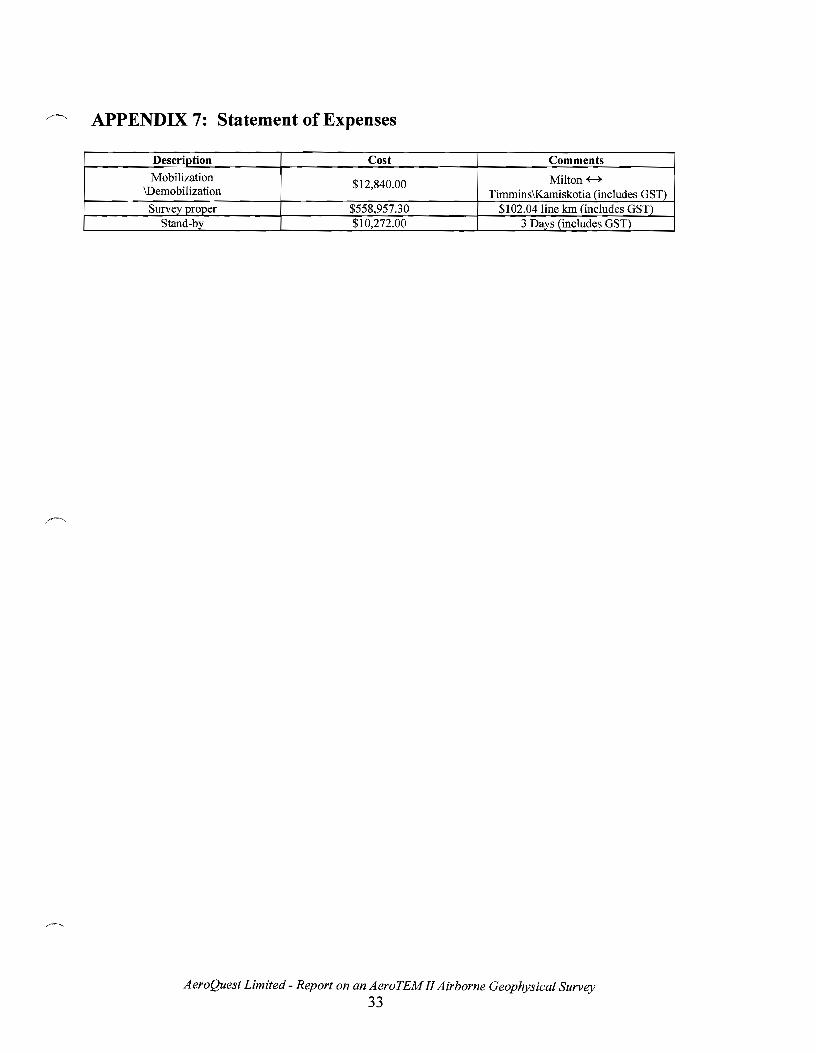
APPENDIX 7: Statement of Expenses
Description Cost Comments
Mobilization $12,840.00 Milton +-+
\Demobilization Timmins\Kamiskotia (includes GST) Survey proper $558,957.30 $102.04 line kin (includes GST)
Stand-by $10,272.00 3 Days (includes GSn
AeroQuest Limited - Report on an AeroTEM II Airborne Geophysical Survey
33