heesoo lee 3d em applications specialist agilent eesof eda · 3d em applications specialist agilent...
TRANSCRIPT

1
HeeSoo Lee
3D EM Applications Specialist
Agilent EEsof EDA
© Agilent Technologies, 2010
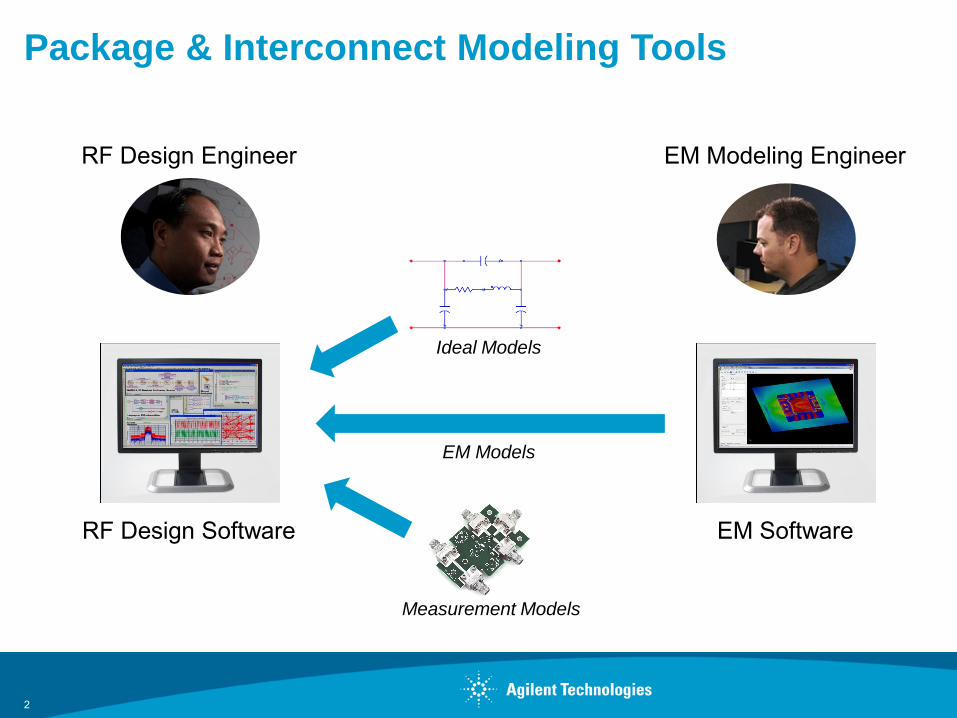
Package & Interconnect Modeling Tools
2
RF Design Engineer EM Modeling Engineer
RF Design Software EM Software
EM Models
Ideal Models
Measurement Models
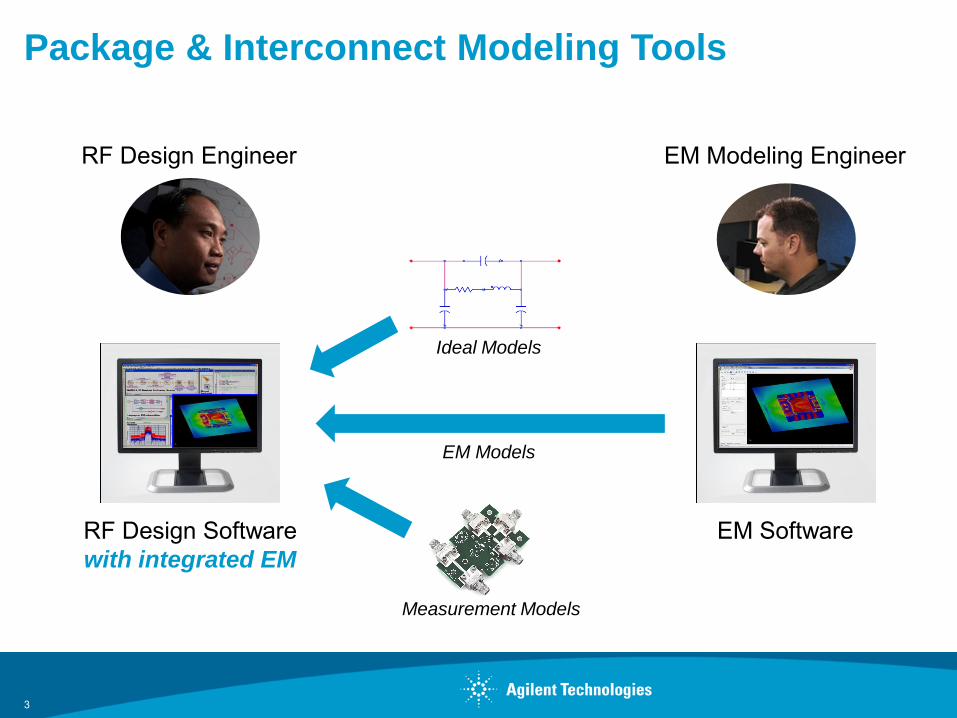
Package & Interconnect Modeling Tools
3
RF Design Engineer EM Modeling Engineer
RF Design Software
with integrated EM
EM Software
EM Models
Ideal Models
Measurement Models

How Accurate is My EM Model?
4
Physical Prototype Virtual Prototype
Measurement Environment = Simulation Environment ?

Packages and Interconnects
Transitions, discontinuities, and parasitics can no longer be ignored in
modern RF/Microwaves and high speed digital designs
As such, smaller form factor (higher pin counts/smaller pitch size) and
higher operating frequency increase design challenges
Package
Connectors
Interconnect
Transitions
Transitions
Interconnect
DUT Board

Four Types of Models for Packages and
Interconnects
1. Lumped Models
2. Measured Data Models
3. Electro-Magnetic (EM) Models
4. Broadband Spice Models
Connector’s Cross-Section
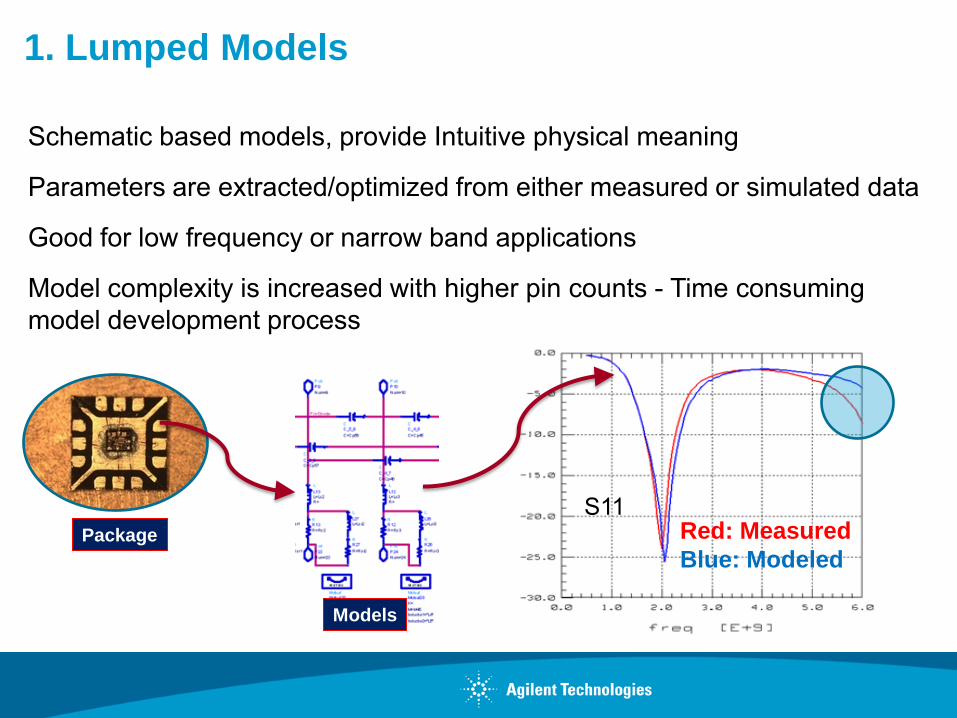
1. Lumped Models
Schematic based models, provide Intuitive physical meaning
Parameters are extracted/optimized from either measured or simulated data
Good for low frequency or narrow band applications
Model complexity is increased with higher pin counts - Time consuming
model development process
Red: Measured
Blue: Modeled
S11Package
Models

What Affects the Lumped Model’s Accuracy
Accuracy of measured or simulated data
Accuracy of circuit models
• Topology and complexity
• Number of ports/pins for packages
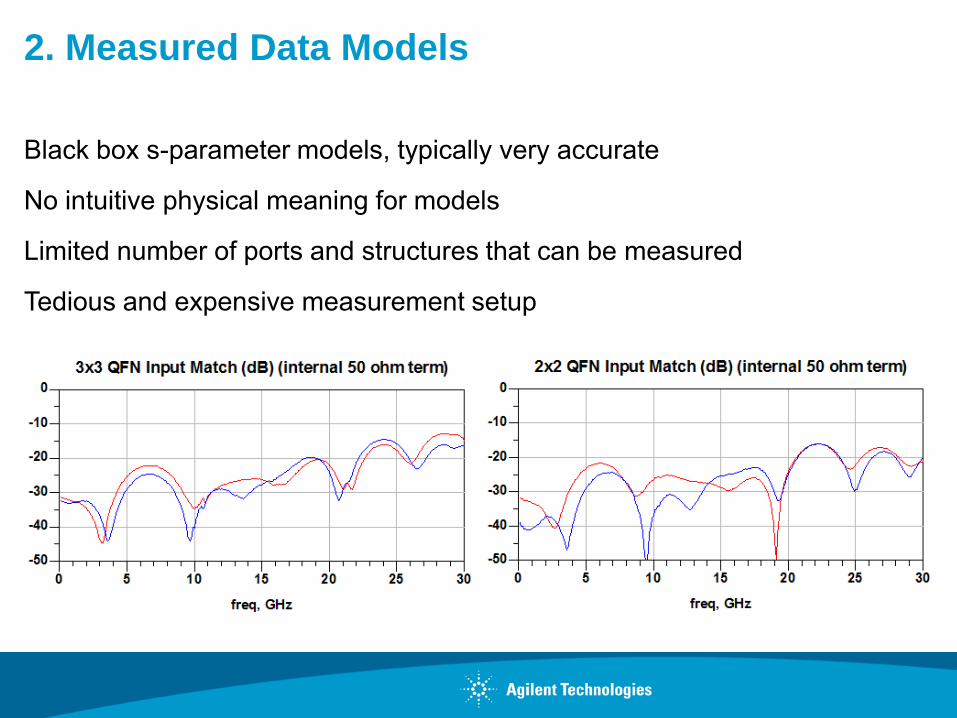
2. Measured Data Models
Black box s-parameter models, typically very accurate
No intuitive physical meaning for models
Limited number of ports and structures that can be measured
Tedious and expensive measurement setup
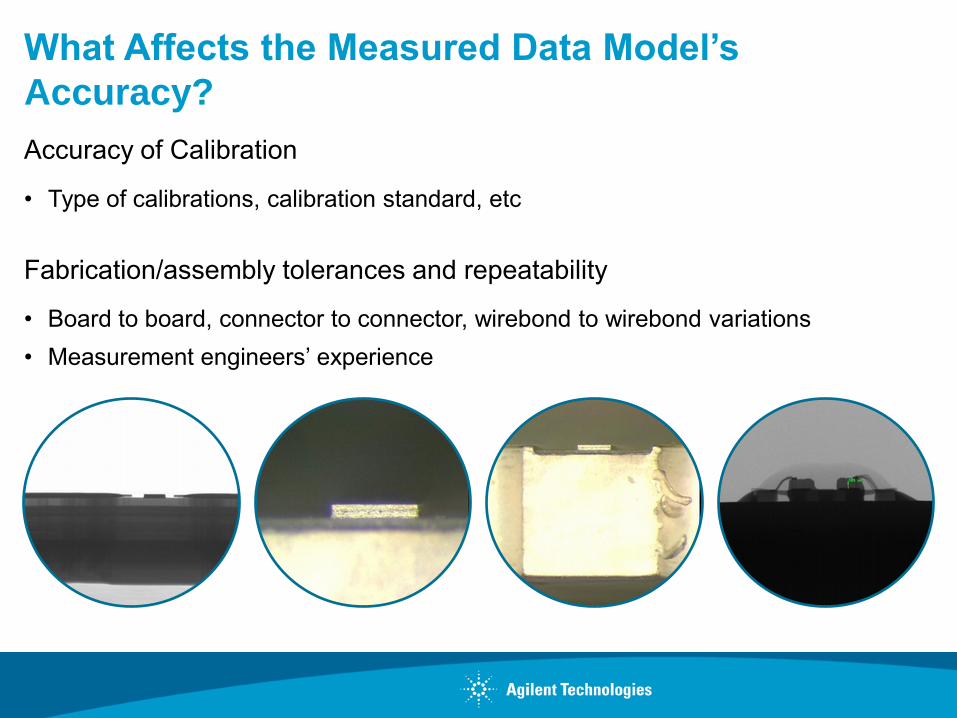
What Affects the Measured Data Model’s
Accuracy?
Accuracy of Calibration
• Type of calibrations, calibration standard, etc
Fabrication/assembly tolerances and repeatability
• Board to board, connector to connector, wirebond to wirebond variations
• Measurement engineers’ experience

= Pre-measurement error correction
= Post-measurement error correction
Most
Accurate
Easiest
S-Parameter De-embedding
Port ExtensionTime Domain Gating
Normalization
Reference Plane Calibration
Thru-Reflect-Line (TRL)
Line-Reflect-Match (LRM)
Short-Open-Load-Thru (SOLT)
Typical Fixture Error Correction Techniques for
Measurements

3. Electro-Magnetic (EM) Models
Electro-Magnetic (EM) simulation based accurate s-parameter models
No limitation on number of ports and structures
Allows to easily model fabrication/assembly tolerances with parametric
analysis for DFM (design for manufacturing) or design centering
Versatile EM visualization provides an extra benefit to visually inspect
designs for performance enhancements

FDTD
FEM MoM3D Planar structures
Full Wave and Quasi-Static
Dense & Compressed Solvers
Frequency Domain
Multiport simulation at
no additional cost
High Q
3D Arbitrary Structures
Full Wave EM Simulation
Direct, Iterative Solvers
Frequency Domain EM
Multiport simulation at
no additional cost
High Q
3D arbitrary structures
Full Wave EM simulations
Handles much larger and complex problems
Time Domain EM
Simulate full size cell phone antennas
EM simulations per each port
GPU based hardware acceleration
FDTD ( Finite Difference Time Domain )
FEM ( Finite Element Method )
MoM ( Method of Moment )
3DEM Simulation Technologies
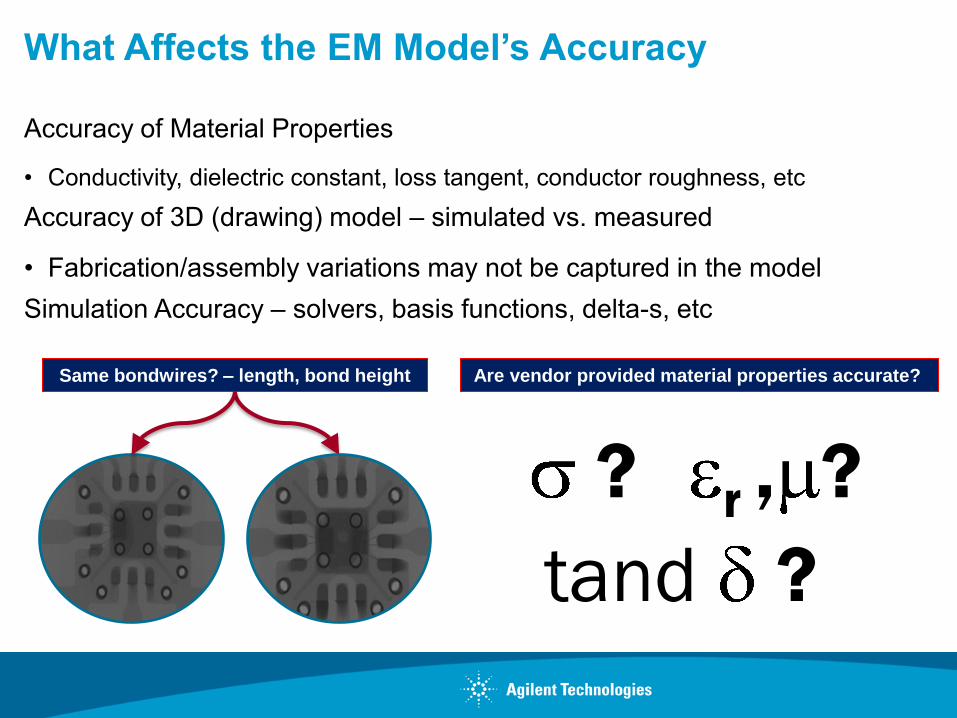
What Affects the EM Model’s Accuracy
Accuracy of Material Properties
• Conductivity, dielectric constant, loss tangent, conductor roughness, etc
Accuracy of 3D (drawing) model – simulated vs. measured
• Fabrication/assembly variations may not be captured in the model
Simulation Accuracy – solvers, basis functions, delta-s, etc
Same bondwires? – length, bond height Are vendor provided material properties accurate?
tand ?
? r , ?

Example 1: EM Models - Thru Line
1 inch long, simple 50 ohm transmission line
Roger’s 4350B PC board: εr=3.66, TanD= 0.0037
Southwest 1492-04A-5 End Launch 2.4mm connectors
EMPro 3D Model
Without
Connectors
Real Board Assembly

Measured Data For Thru Line
Measured various sample combinations of thru line boards and connectors
up to 50GHz
Less S11 variations at lower frequencies but a bit more at higher frequencies
More Variations
on
Higher Frequencies
10+dB
S11 measured data

Factors on Measurement Variations
Connector to board ground contacts
Connector launch on board trace
Cleanness of plated side board contact to connectors
Copper thickness and etching (over, under) variations
Solder joint thickness and void (coverage)
Poor wetting
Assembly variations
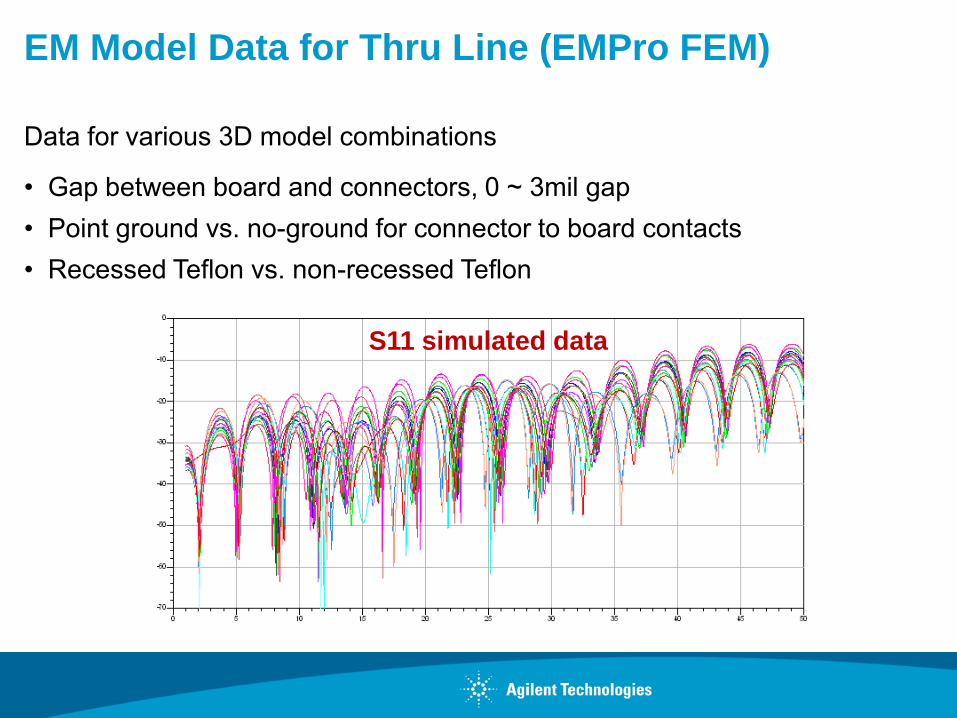
EM Model Data for Thru Line (EMPro FEM)
Data for various 3D model combinations
• Gap between board and connectors, 0 ~ 3mil gap
• Point ground vs. no-ground for connector to board contacts
• Recessed Teflon vs. non-recessed Teflon
S11 simulated data

S11 Modeled vs. Measured
Excellent agreement up to 20GHz
Very good agreement for 30-40GHz
Diverging more at
Higher Frequencies
Thick Black Trace (EM)

Factors on Measured vs. EM Data Differences
Are modeled (drawn) vs. measured (assembled) the same?
• Connector to board gap and ground contacts
• Cleanness of plated side board contact to connectors
• Copper thickness and etching (over or under?)
• Measured includes the connector but not in modeled
Are material properties accurate at higher frequencies?
• Conductivity, dielectric constant, loss tangent
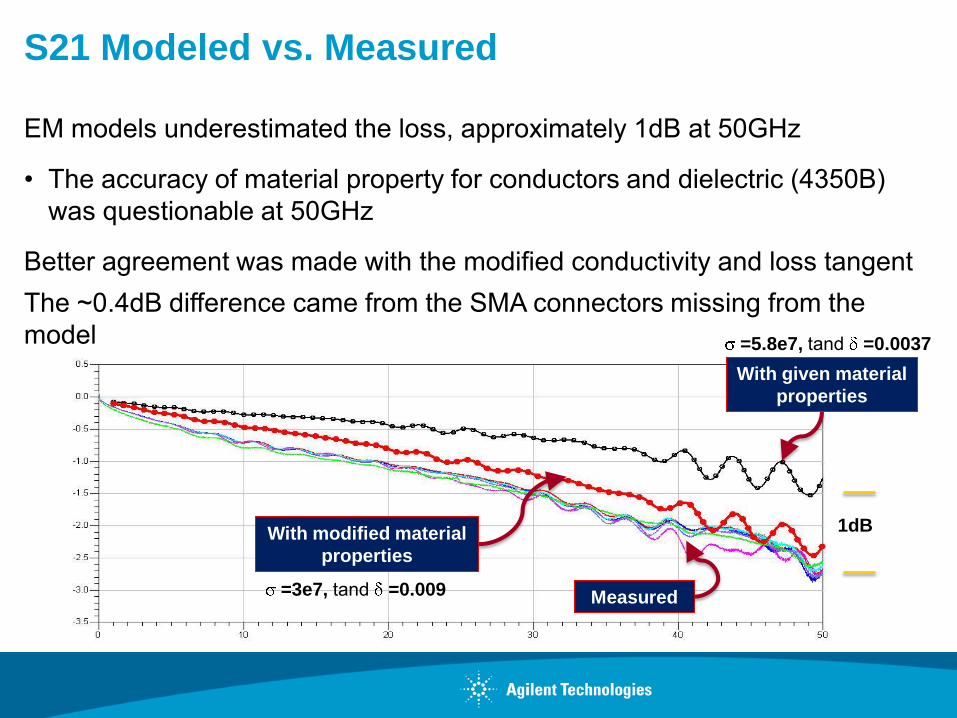
EM models underestimated the loss, approximately 1dB at 50GHz
• The accuracy of material property for conductors and dielectric (4350B)
was questionable at 50GHz
Better agreement was made with the modified conductivity and loss tangent
The ~0.4dB difference came from the SMA connectors missing from the
model
S21 Modeled vs. Measured
With given material
properties
1dBWith modified material
properties
Measured=3e7, tand =0.009
=5.8e7, tand =0.0037
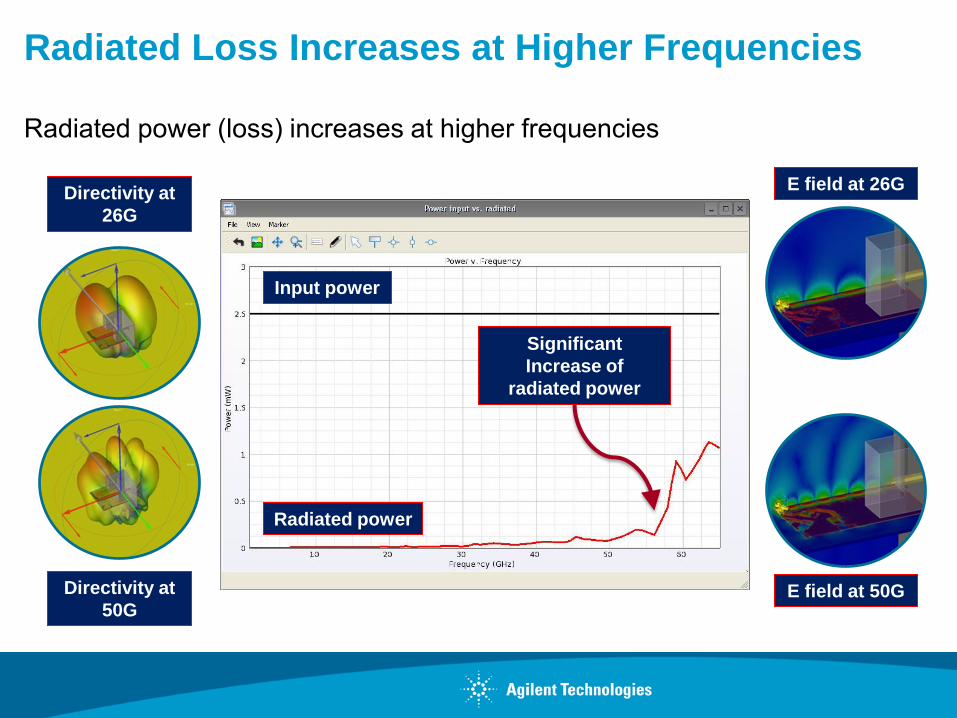
Radiated Loss Increases at Higher Frequencies
Radiated power (loss) increases at higher frequencies
Significant
Increase of
radiated power
Input power
Radiated power
E field at 26G
E field at 50G
Directivity at
26G
Directivity at
50G

Example 2: 50 Ohm Termination on QFN2x2
50 ohm termination (parallel two 100 thin-film resistors) on QFN 2mm X
2mm package
EMPro 3D Model Without Connectors

S11 Modeled vs. Measured
Reasonable agreement
Measured
Samples
Thick Black Trace (EM)
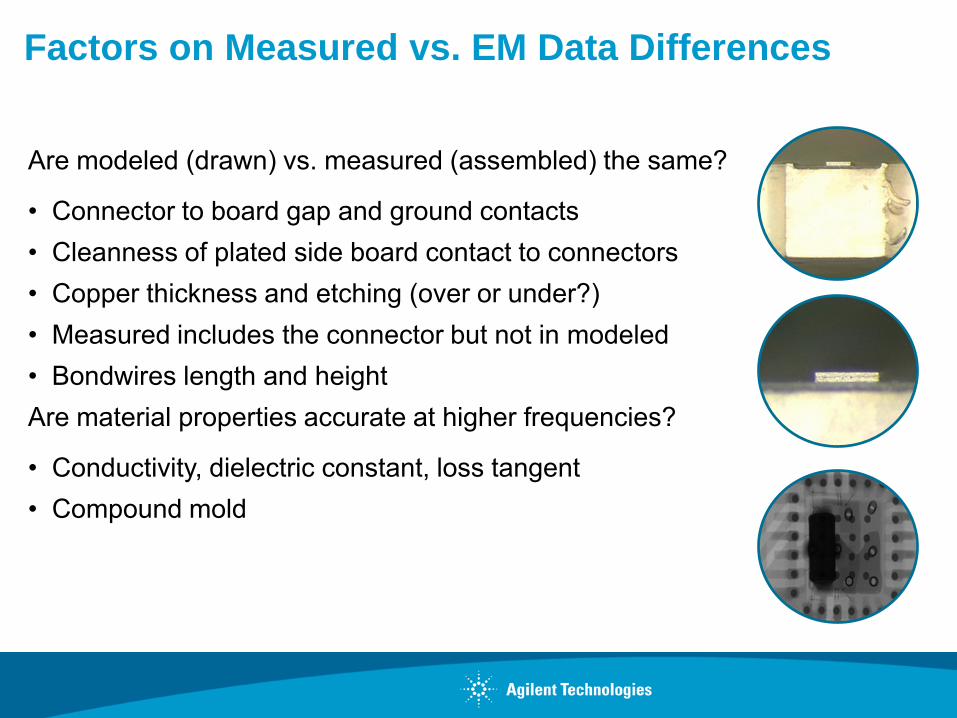
Factors on Measured vs. EM Data Differences
Are modeled (drawn) vs. measured (assembled) the same?
• Connector to board gap and ground contacts
• Cleanness of plated side board contact to connectors
• Copper thickness and etching (over or under?)
• Measured includes the connector but not in modeled
• Bondwires length and height
Are material properties accurate at higher frequencies?
• Conductivity, dielectric constant, loss tangent
• Compound mold

4. Broadband Spice Models
Netlist based circuit models that
include R,L,C, and sources
Broadband performance
Very fast model generation
Various netlist formats supported
• Hspice
• Spectre
• Spice 2 and Spice3
• ADS

What Affects the Broadband Spice Model’s
Accuracy
Accuracy of Input data (modeled or measured)
Accuracy of engine’s algorithm
Generally BB models are very accurate not only for magnitude but also offers
excellent phase match
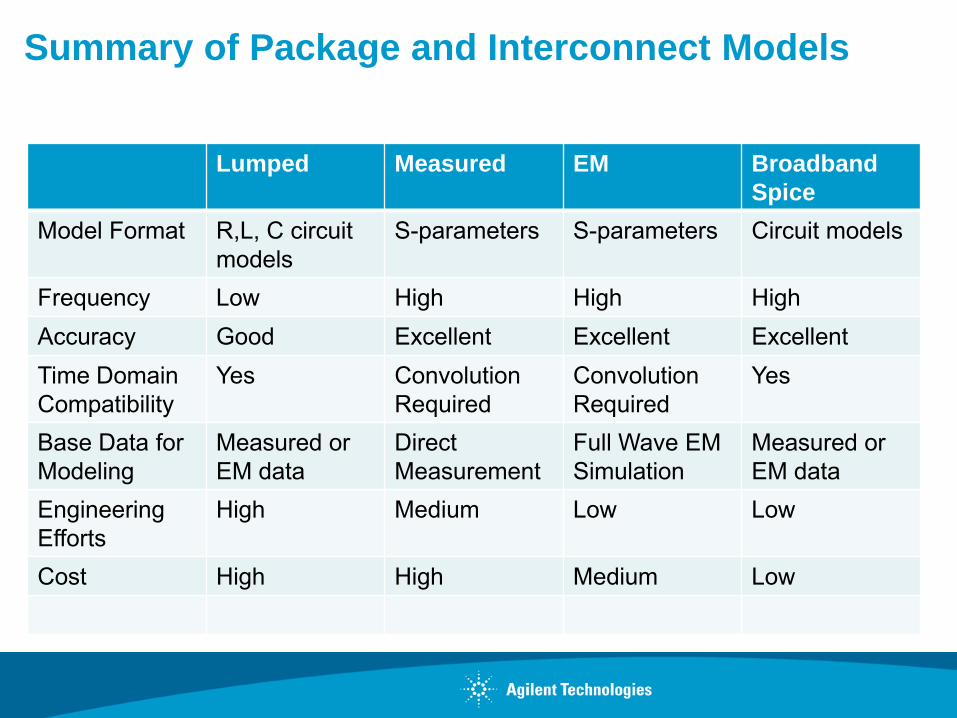
Summary of Package and Interconnect Models
Lumped Measured EM Broadband
Spice
Model Format R,L, C circuit
models
S-parameters S-parameters Circuit models
Frequency Low High High High
Accuracy Good Excellent Excellent Excellent
Time Domain
Compatibility
Yes Convolution
Required
Convolution
Required
Yes
Base Data for
Modeling
Measured or
EM data
Direct
Measurement
Full Wave EM
Simulation
Measured or
EM data
Engineering
Efforts
High Medium Low Low
Cost High High Medium Low

Summary
Each of four types of packages and interconnect models has its own
strengths and weaknesses
The accuracy of models depends on various factors such as material
properties, fabrication/assembly tolerances
Corner case, worst-case, or even statistical models may be required for
packages and interconnect to take into account those variations
EM and Broadband spice models offer the most economical solution from
the accuracy and cost perspectives
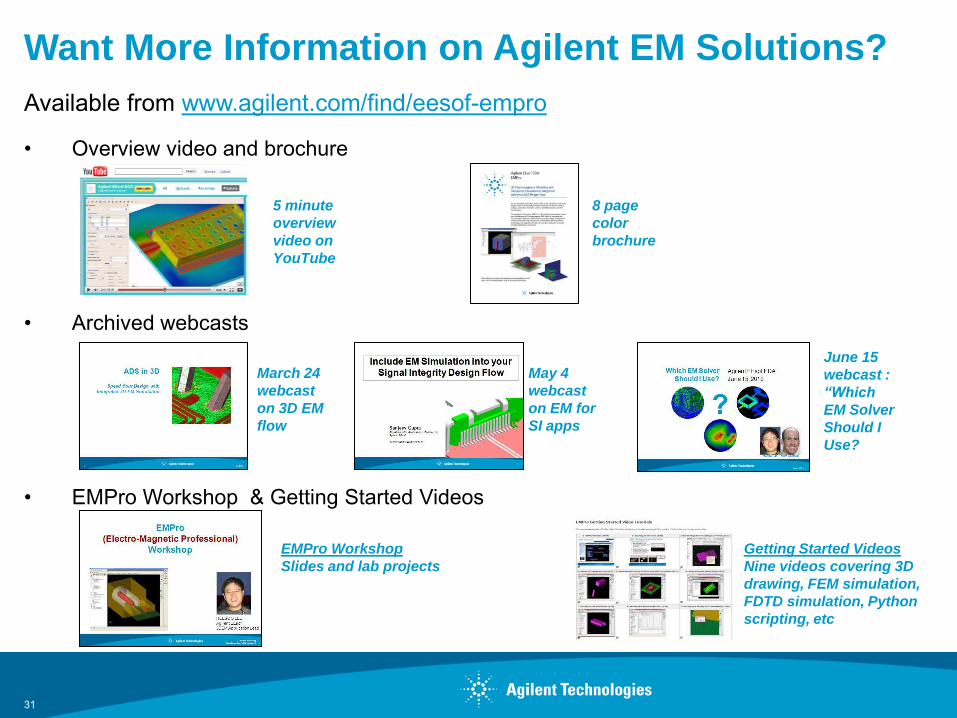
Want More Information on Agilent EM Solutions?
Available from www.agilent.com/find/eesof-empro
• Overview video and brochure
• Archived webcasts
• EMPro Workshop & Getting Started Videos
5 minute
overview
video on
YouTube
8 page
color
brochure
March 24
webcast
on 3D EM
flow
May 4
webcast
on EM for
SI apps
EMPro Workshop
Slides and lab projects
June 15
webcast :
“Which
EM Solver
Should I
Use?
Getting Started Videos
Nine videos covering 3D
drawing, FEM simulation,
FDTD simulation, Python
scripting, etc
31