heavy metals in colorado and chinese oil shale...
TRANSCRIPT

Published: June 29, 2011
r 2011 American Chemical Society 3522 dx.doi.org/10.1021/ef2006386 | Energy Fuels 2011, 25, 3522–3529
ARTICLE
pubs.acs.org/EF
Heavy Metals in Colorado and Chinese Oil Shale Semicoke: DisposalIssues, Impediments to Byproduct ConversionBeatriz Datangel† and Jillian L. Goldfarb*,‡
†Department of Chemistry, Simmons College, 300 The Fenway, Boston, Massachusetts 02115, United States‡Department of Chemical Engineering, University of New Hampshire, 33 Academic Way, Durham, New Hampshire 03824,United States
ABSTRACT:Oil shale, a fine-grained sedimentary rock, contains a proportionally large amount of kerogen, which can be convertedinto oil by thermal degradation of the compacted rock. The primary byproduct of current oil shale oil extraction processes issemicoke. Its landfill deposition presents a possible threat to the environment and represents a waste of a potentially useablebyproduct. In this work, we explore the heavymetal content of oil shale semicoke pyrolyzed at 500 and 1000 �C to better understandthe risks posed by disposal of oil shale processing waste on the nearby environment, as well as impediments to potential byproductconversion. The greatest potential obstruction to byproduct conversion and the greatest environmental risk posed by open airdisposal of oil shale semicoke is likely due to relatively high arsenic concentrations; using X-ray fluorescence spectroscopy, wefind arsenic concentrations in semicoke (pyrolyzed at 500 �C) ranging from 25 ppm for Chinese oil shale from the Huadian mine(class C) to 79 ppm for Green River, Colorado, 50 gallons per ton (GPT) of oil shale. Other heavy metal elements analyzed,including barium, copper, lead, manganese, and iron, are well below the United States Environmental Protection Agency (U.S. EPA)regional screening limits.
1. INTRODUCTION
Over the past several decades, concerns over dwindling fossilfuel resources have prompted a surge in research and develop-ment of alternative energy technologies. Although scientists,politicians, and ordinary citizens alike agree with the need todevelop new energy generation technologies, the choice amongspecific alternative energy sources available is a hot topic fordebate. In North America, where tar sand and oil shale depositsare vast, experimentation is ongoing in the areas of alternativefossil fuels. Oil shale is a low-grade solid fuel with high ashcontent. A fine-grained sedimentary rock, oil shale contains aproportionally large amount of kerogen, which can be convertedinto oil by thermal degradation of the compacted rock.
Worldwide deposits of oil in shale are estimated at upward of2.8 trillion barrels of recoverable oil.1,2 Historically, the cost of oilproduced from oil shale is markedly higher than that of conven-tional oil processes, such as drilling, and this has inhibitedcountries, such as Australia and the United States, from devel-oping an oil shale industry.3 Interest in oil shale in the UnitedStates was piqued in the 1970s when the price of oil peaked.However, when oil prices fell, research toward oil productionfrom shale markedly decreased. However, with oil prices onceagain setting record highs, oil shale is back at the forefront ofmany discussions as a stopgap fossil fuel source between ourreliance on the pipelines of the Middle East and a renewableenergy future.
There are several barriers to commercial use of oil shale as adomestic source for oil. These include overcoming process waterrequirements and ground swelling issues, long-term stability ofthe manufactured oil, and dealing with the veritable mountainsof oil shale semicoke produced.4,5 This paper addresses thelatter issue. The two primary utilization pathways for oil shale
are electricity generation by power stations and oil production.5
Electricity production generates ash as the primary waste, a silica-based powder with little to no volatile organics present, as thecompacted rock is burned directly in a combustion chamber. Oilextraction from oil shale creates semicoke as a byproduct viapyrolysis of the shale rock to extract the oil. In this scenario, therock is compacted to increase the available surface area (toincrease oil yield) and heated upward of 500 �C under an inertgas to prevent oxidation and combustion of the fuel whileextracting the oil. The oil yield primarily depends upon theamount of kerogen originally present in the shale, as well as thepyrolysis temperature. Whereas ash from electricity generationhas low carbon content (less than 0.1% by mass of solidmaterial), semicoke has a relatively high amount of organicchar present, depending upon the aforementioned shale andextraction conditions.
Previous work shows that oil shale semicokes have relativelyhigh overall surface areas despite a 2�18% organic char fraction(and thus have high specific surface areas, upward of 300 m2 g�1,unactivated), leading us to posit a potential use of oil shalesemicoke as a sorbent material.6 Similar to conventional fossilfuels, oil shale is a mixture of inorganic and organic compoundsformed during prehistoric times. It is these inorganic compoundsthat lead us to question whether heavy metals present in the oilshale rock remain within the semicoke after processing. This is apotential impediment to using the semicoke as an in situ sorbent.If there are a sufficient amount of metals present, the semicokemay require extensive pretreatment and nullify the byproduct
Received: April 25, 2011Revised: June 27, 2011
3523 dx.doi.org/10.1021/ef2006386 |Energy Fuels 2011, 25, 3522–3529
Energy & Fuels ARTICLE
conversion benefits of disposal cost reduction and environmentalmitigation. The presence of heavy metals represents a potentialissue to the open-air disposal of the semicoke, because thesemetals could leach into groundwater and transport through theenvironment. Fathoni et al. note that issues of semicoke storageand disposal surpass concerns over the stability of extracted oil.4
By investigating a variety of oil shale semicoke samples fromChina and the United States, we probe the feasibility of waste-to-byproduct conversion of semicoke, as well as storage and disposalissues because of entrained heavy metals as a function of the shaleorigin and pyrolysis temperature.
Prior studies document the presence of heavy metals in oilshale fly ash. In some parts of China, for example, studiesdemonstrate an accumulation of lead, cadmium, zinc, thallium,barium, and arsenic in oil shale fly ash.7 These metals are humancarcinogens and are categorized by the United States Environ-mental Protection Agency (U.S. EPA) as priority heavy metalsbecause of their toxic effects on humans. As a result of opendisposal, large quantities of heavy metals could enter waterreserves, be it groundwater or surface water, and deterioratethe quality of the environment. Metal compounds change theirphases rather than break down and can be transported by air orland to water through seepage and runoff from the sediment.7 AsNei et al. detail, in Estonia, large quantities of cadmium, copper,zinc, lead, and other metals are present in oil shale waste; thesemetals enter soil and water compartments as ions.8
A secondary pollution exposure pathway may exist whenworking with or prolonged exposure to products like cement,which contain a significant fraction of spent fuel to increase thelong-term stability of the cement. Heavy metals present in the oilshale ash and semicoke must be quantified to model the effects ofexposure on those who use potential byproducts in concrete andother constructionmaterials or spend prolonged time near disposalsites.9,10 The ability to convert the semicoke waste to a useablebyproduct, such as a sorbent material, could also be hindered bythese heavy metals in a similar manner. The metals could eitherleach out of the semicoke during adsorption/absorption or possiblyvolatilize, causing harm to workers using the semicoke.
The disposal and/or byproduct conversion of oil shale semi-coke may be detrimental to both the environment and humanhealth because of entrained heavy metals. This study aims todetermine levels of heavy metals present in oil shale and itssemicoke in several samples from China and the United States tounderstand the obstacles that these metals pose to the wide-spread commercialization of energy from oil shale.
2. EXPERIMENTAL SECTION
2.1. Sample Preparation. Five oil shale samples were investigatedin this work. Two originated from theMaoming mine in the Guangdongprovince of southwest China, with the local Chinese classification (orgrade) of A and C. One sample was obtained from the Huadian mine inthe Jilin province of northeast China (grade C). Two samples wereobtained from the Green River, Colorado (U.S.A.) deposits: one a highoil yield [50 gallons per ton (GPT)] sample and the other a lower oilyield (19 GPT) sample. All oil shale samples examined in this work wererepresentatively sampled from larger scale mining exercises; each sampleset investigated was further representatively sampled from 25 kg buckets.Each oil shale was ground and sieved in 100�200 g batches to yieldsamples with a particle size between 45 and 75 μm.
Approximately 5 g of each oil shale sample was pyrolyzed in alaboratory tube furnace maintained at either of two temperatures, 500
and 1000 �C, monitored with an Omega type K thermocouple directlyabove the sample accurate to (0.5 K under a helium flow of approxi-mately 300 cm3 min�1 in a porcelain crucible. The mass loss from thepyrolysis procedure is attributed mostly to the removal of volatile matter(kerogen) and then, to a lesser extent, water removal and the decom-position of calcite and dolomite in the mineral portion of the shale. TheColorado 50GPT andChineseMaomingmine class A samples were alsoheated in an oxidative environment to yield 100% ash burnoff samplesfor testing to mimic the waste produced from firing or co-combusting oilshale and semicoke (because of sample size limitations, we could onlyperform the 100% burnoff for these two samples). Organic char contentsand Brunauer�Emmett�Teller (BET) surface areas of samples pyro-lyzed at 500 and 1000 �C are reported in previous work.6
2.2. X-ray Fluorescence (XRF) Measurements. A ThermoFisher Scientific Niton Hand-held XL3t XRF analysis instrument wasused to characterize the presence of metals. Because each element has adistinct set of energy levels, it emits X-rays at a unique set of energies.The set of energies allows the instrument to measure the elementalcomposition of a sample. XRF spectroscopy is rapid and does notdamage or alter the sample, making it a preferred method for a variety ofapplications, such as metal and alloy analysis, mining and geochemicalexploration, art and archeology, and quality control of consumer goods.Environmental applications specifically pertain to soil, dust, air filters,and drywall testing.11
We programmed the XRF to follow EPA method 6200 for “fieldportable XRF spectrometry for the determination of elemental concen-trations in soil and sediment” for both in situ and ex situ soil samples.12
This method was employed because it represents the closest in samplecharacteristics to the oil shale semicokes. The analytes measured in thismethod include the eight Resource Conservation and Recovery Act(RCRA) metals of arsenic, barium, cadmium, chromium, lead, selenium,and silver. The other elements measured using the XRF includemolybdenum, strontium, zirconium, rubidium, throium, zinc, copper,iron, manganese, vanadium, titanium, scandium, potassium, sulfur, andcalcium. The lowest detection limit of the XRF instrument is 9.2 mg/kg;for all of the oil shale samples, silver, cadmium, chromium, and seleniumwere below the lower detection limit (LOD) and are therefore notreported in the data tables.
Each time a sample is run in the XRF, the equipment takes threereadings and tabulates the average parts per million (ppm) concentra-tion of each metal along with 1 standard deviation. Each oil shale samplewas measured 3 times to ensure reproducibility. The results discussed inthis research are the average of the 3 runs (3 data points per run times 3runs = 9 data points). The average of the three confidence intervals isreported as the overall confidence interval for each data set to preservethe magnitude of the margin of error. The results given in Table 1 are theconcentration in ppm of metal in shale and respective confidenceinterval of 95% or (2 standard deviations.
Each oil shale sample is loaded into a clean 31 mm diameterpolyethylene sample cup with a clear window Mylar thin film(ThermoFischer gauge 0.000 24); the sample cup is filled approximately1 cm high with oil shale/semicoke. The sample is lightly compacted withfilter paper and cotton and sealed with a polyethylene cap. The samplewas placed in the XRF stand and covered to absorb any excess X-rays.After the instrument was calibrated, the resolution was automatically setat 167.6 (keV) with an E scale of 7.4550. Prior to the sample runs, the“RCRA” soil sample standard, prepared in the samemanner as the shale/semicoke samples, was used to standardize the instrument.
3. RESULTS AND DISCUSSION
XRF data are presented in Table 1 as ppm of eachmetal per oilshale sample with its 95% confidence interval. Our XRF resultsshow heavy metal content similar to six Turkish oil shale samples

3524 dx.doi.org/10.1021/ef2006386 |Energy Fuels 2011, 25, 3522–3529
Energy & Fuels ARTICLE
Table1.
XRFDataforHeavy
MetalCon
centration
sin
OilShaleSamples
inpp
mwith95%Con
fidenceIntervala
sample
arsenic
bariu
mcalcium
copper
iron
potassium
manganese
molybdenum
lead
Colorado50
GPT
oilshale
67.9(2.2
<LOD
106573
(5329
54.3(6.6
15217(173
17596(80182.0
182.0(64.2
29.2(4.1
42.4(7.8
Colorado50
GPT
500�C
pyrolysis
79.4(9.1
<LOD
95561(4778
59.9(
19.1
19108(377
14505(725
293.5(14.5
31.4(2.1
45.8(8.7
Colorado50
GPT
1000
�Cpyrolysis
104.3(4.8
81.5(
2.0
98860(4943
91.7(22.7
25842(647
15142(757
353.7(88.6
39.0(2.6
<LOD
Colorado50
GPT
100%
burnoff
101.7(9.1
176.6(
4.0
72453(3623
93.0(35.0
24585(732
10092(505
319.8(90.6
38.3(5.9
61.6(10.6
Colorado19
GPT
oilshale
30.2(4.3
219.8(42.3
121425
(6071
32.9(4.5
14925(428
27413(1371
282.9(
126
11.8(3.4
27.7(1.0
Colorado19
GPT
500�C
pyrolysis
33.1(6.3
118.2(
8.0
56534(2827
41.3(18.0
17673(86
12923(646
297.9(59.0
14.6(3.7
31.8(4.3
Colorado19
GPT
1000
�Cpyrolysis
40.4(4.5
338.6(
29.3
57460(2873
44.7(17.7
24471(198
18528(926
376.8(33.2
18.5(1.3
22.4(2.6
MaomingAoilshale
22.3(5.7
<LOD
27646(1382
42.7(12.5
32744(732
3396
(170
678.3(
61.7
<LOD
18.4(
3.5
MaomingA500�C
pyrolysis
28.0(6.8
<LOD
22462(1123
42.3(20.1
39967(884
3177
(159
795.6(50.8
<LOD
25.6(6.3
MaomingA1000
�Cpyrolysis
36.0(6.3
275.4(39.6
28427(1421
53.3(26.0
49391(352
988.6(179
988.6(
179
<LOD
<LOD
MaomingA100%
burnoff
41.6(9.1
350.4(68.4
22685(1134
63.4(14.0
53522(
991
3211
(161
1086.0(148
<LOD
33.7(8.3
MaomingCoilshale
30.7(4.6
<LOD
14199(710
32.0(12.8
72761(338
15662(783
1085.8(112
<LOD
33.1(4.1
MaomingC500�C
pyrolysis
41.2(2.6
168.7(10.5
6023
(301
<LOD
93338(732
5822
(291
1527.4(153
<LOD
47.8(3.6
MaomingC1000
�Cpyrolysis
32.5(
5.8
227.5(16.5
8205
(410
53.1(28.6
100462
(732
8595
(430
1585.9(74.6
<LOD
15.3(5.8
Huadian
oilshale
20.0(8.1
<LOD
1051
(52.5
36.4(3.5
28137(403
8790
(440
139.9(24.1
<LOD
39.6(1.1
Huadian
500�C
pyrolysis
25.5(5.9
<LOD
1207
(60.4
50.1(27.4
37427(152
10334(517
204.7(76.6
<LOD
55.0(6.7
Huadian
1000
�Cpyrolysis
24.3(7.2
<LOD
1331
(66.5
61.0(17.4
39359(123
12680(634
194.3(51.4
<LOD
<LOD
sample
rubidium
sulfur
scandium
strontium
throium
titanium
vanadium
zinc
zirconium
Colorado50
GPT
oilshale
52.1(4.3
159023
(7951
171.4(27.5
532.1(11.0
<LOD
1488
(90.2
145.8(22.2
64.8(3.3
58.0(7.0
Colorado50
GPT
500�C
pyrolysis
66.4(5.1
117831
(5892
<LOD
664.5(
13.2
<LOD
1222
(96.0
120.6(100.4
78.1(17.3
66.6(8.3
Colorado50
GPT
1000
�Cpyrolysis
81.8(6.3
127531
(6377
<LOD
876.2(
16.7
14.2(6.2
1344
(96.0
186.1(6.3
<LOD
85.8(10.3
Colorado50
GPT
100%
burnoff
80.9(6.2
111522
(5576
<LOD
826.7(
16.1
13.0(7.5
929.3(96.0
155.7(26.8
88.4(11.3
82.9(4.0
Colorado19
GPT
oilshale
59.3(4.7
52368(2618
150.4(27.5
653.2(5.8
<LOD
1766
(131
136.1(22.5
50.2(2.8
70.8(5.9
Colorado19
GPT
500�C
pyrolysis
66.3(4.8
24363(
1218
115.1(27.5
744.4(6.5
<LOD
809.4(127
<LOD
60.1(7.1
75.8(8.1
Colorado19
GPT
1000
�Cpyrolysis
90.0(6.1
43210(
2161
220.6(27.5
1000
(7.0
10.8(6.8
1177
(96.0
95.8(30.0
27.3(9.9
104.2(10.3
MaomingAoilshale
53.5(4.3
102375
(5119
<LOD
423.0(9.7
11.6(5.0
1002
(96.0
<LOD
55.4(11.4
119.7(5.2
MaomingA500�C
pyrolysis
66.8(4.8
82539(4127
<LOD
499.1(6.6
12.9(5.3
938.8(96.0
<LOD
78.3(9.8
133.2(8.4
MaomingA1000
�Cpyrolysis
82.4(5.7
145799
(7290
<LOD
602.8(
6.2
15.8(5.9
1179
(96.0
58.3(30.4
<LOD
164.3(9.8
MaomingA100%
burnoff
81.2(5.8
113500
(5675
<LOD
637.1(8.9
15.8(6.2
934.6(96.0
<LOD
94.2(16.9
183.7(7.0
MaomingCoilshale
123.3(6.2
148089
(7404
<LOD
189.6(6.8
34.6(6.7
2390
(96.0
<LOD
54.0(8.6
111.1(4.4
MaomingC500�C
pyrolysis
161.9(7.9
62148(3107
<LOD
231.5(8.4
50.7(8.6
937.2(96.0
<LOD
68.5(16.9
125.3(6.4
MaomingC1000
�Cpyrolysis
165.5(8.2
85443(
4272
<LOD
257.6(
9.1
43.9(8.4
1368
(73.8
<LOD
<LOD
142.9(9.0
Huadian
oilshale
151.5(6.2
42789(2139
<LOD
102.4(3.5
45.0(6.7
1755
(96.0
95.7(1.9
80.5(9.7
132.0(
2.2
Huadian
500�C
pyrolysis
192.0(7.6
37403(1870
<LOD
131.5(5.7
55.6(8.0
2029
(96.0
132.4(12.9
103.7(16.9
182.7(
4.6
Huadian
1000
�Cpyrolysis
203.4(7.8
38882(1944
<LOD
139.7(5.9
58.4(8.0
1978
(96.0
141.4(63.8
<LOD
170.2(8.5
a<L
ODindicatesno
detection/belowdetectablelim
itof
9.2ppm.
3525 dx.doi.org/10.1021/ef2006386 |Energy Fuels 2011, 25, 3522–3529
Energy & Fuels ARTICLE
analyzed by Kara-Gulbay and Korkmaz.13 For example, Kara-Gulbayand Korkmaz find zinc levels in shales ranging from 0.10 to95 ppm; we find LOD to 104 ppm.We find no detectable silver inour samples; they detect no more than 70 parts per billion (ppb)(below the LOD of the XRF).
Of the samples investigated herein, only the Colorado shalesshowed any detectable scandium and the Colorado 50 GPTpyrolyzed and 100% burnoff showed no Sc, whereas the 19GPTsamples showed between 115 and 220 ppm in each sample.Scandium’s average concentration in Earth’s crust is 22 ppm,dispersed among other common rock-forming minerals.14
Likewise, the Colorado shales were also the only samples withdetectable molybdenum, commonly encountered in coal andcoal fly ash. The Chinese shale samples were all higher in bothrubidium and zirconium than the Colorado samples, and all setsof samples saw increasing rubidium and zirconium concentra-tions as the samples were progressively heat-treated (and volatileorganics removed). Concentrations of thorium were also higherin the Chinese samples than in the Colorado samples andincreased slightly with successive heat treatment, to be expectedgiven it has the highest (known) melting point of all oxides in itsmost stable 4+ oxidative state, where it readily appears as ThO2
and is responsible for most of Earth’s internal heating.15
Raave et al. find that fresh oil shale semicoke is toxic to variousplant seeds, although the toxic properties of semicoke decreaseover time, attributed to weathering of the semicoke.16 Theyremark that the cause of the phytotoxicity of oil shale semicoke toseeds is unknown, given the variable composition of inorganicand organic compounds of oil shale. However, Raave et al. notethat it is doubtful that the phenols and polycyclic aromatichydrocarbons present “cause the inhibition of seed germination”,suggesting instead that “investigations published so far havepaid no attention to the very high content of soluble inorganiccompounds in the oil shale semi-coke”. The authors suggest that
it is more likely the effect of high concentrations of calcium-,magnesium-, and sulfur-containing compounds that result in theinhibition of seed germination. Saether et al. note that the mostcommon mineral ingredients (of import to agriculture) compris-ing oil shale ash are CaO, representing 30�44%, followed bySiO2 (27�32%), K2O (2.7�7.0%), and Fe2O3 (5.2�5.5%).17
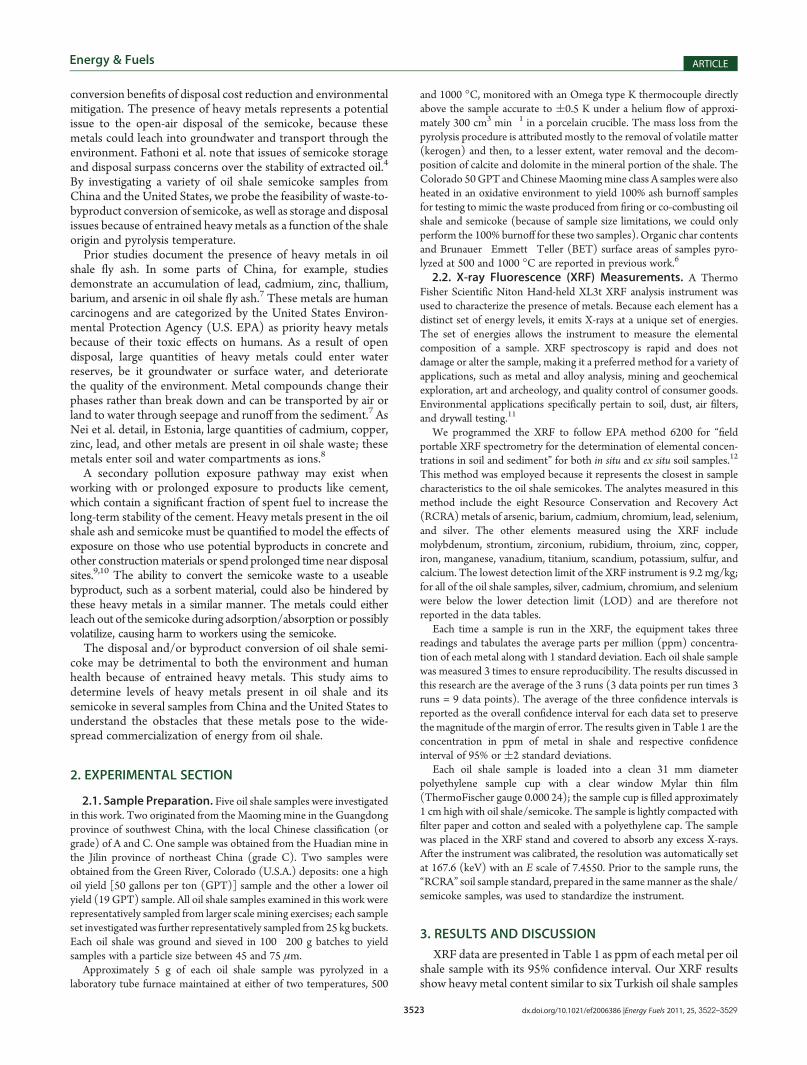
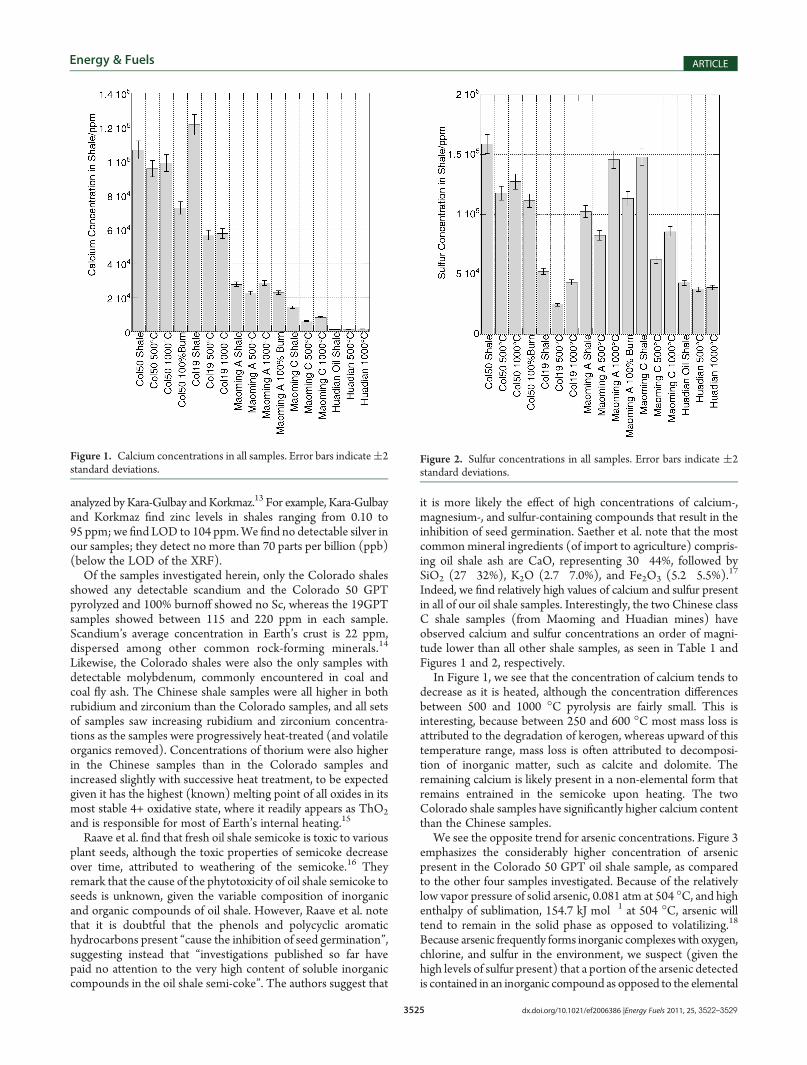
Indeed, we find relatively high values of calcium and sulfur presentin all of our oil shale samples. Interestingly, the two Chinese classC shale samples (from Maoming and Huadian mines) haveobserved calcium and sulfur concentrations an order of magni-tude lower than all other shale samples, as seen in Table 1 andFigures 1 and 2, respectively.
In Figure 1, we see that the concentration of calcium tends todecrease as it is heated, although the concentration differencesbetween 500 and 1000 �C pyrolysis are fairly small. This isinteresting, because between 250 and 600 �C most mass loss isattributed to the degradation of kerogen, whereas upward of thistemperature range, mass loss is often attributed to decomposi-tion of inorganic matter, such as calcite and dolomite. Theremaining calcium is likely present in a non-elemental form thatremains entrained in the semicoke upon heating. The twoColorado shale samples have significantly higher calcium contentthan the Chinese samples.
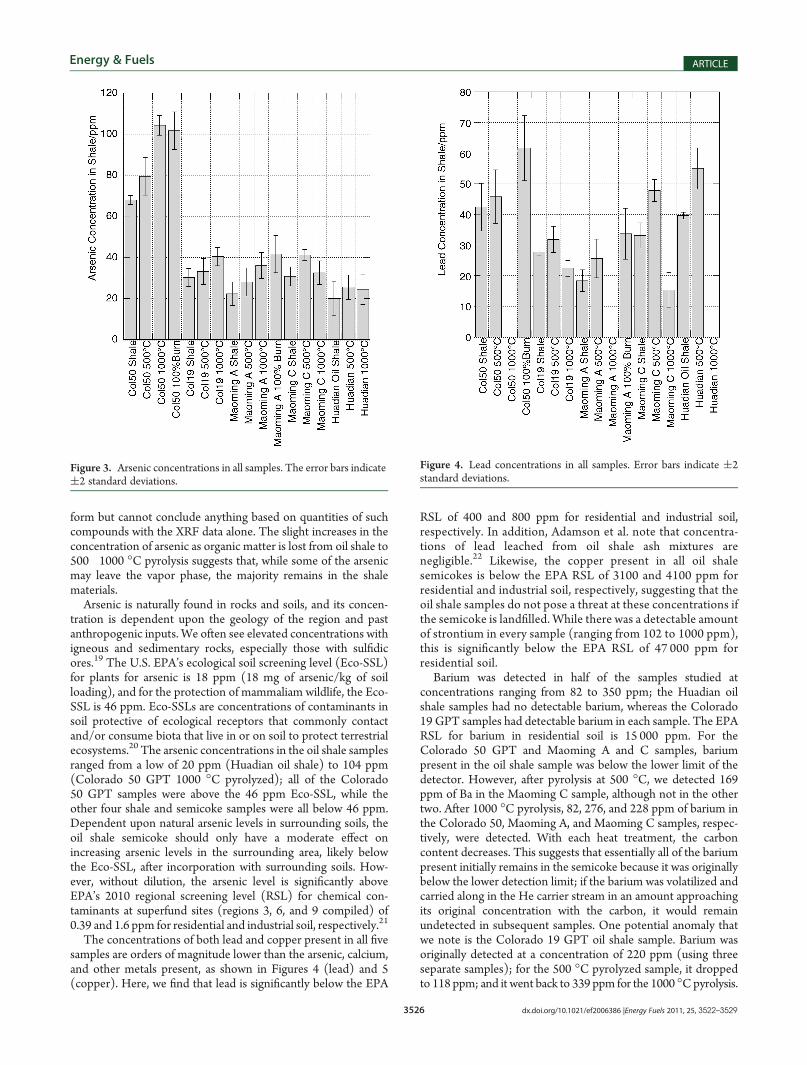
We see the opposite trend for arsenic concentrations. Figure 3emphasizes the considerably higher concentration of arsenicpresent in the Colorado 50 GPT oil shale sample, as comparedto the other four samples investigated. Because of the relativelylow vapor pressure of solid arsenic, 0.081 atm at 504 �C, and highenthalpy of sublimation, 154.7 kJ mol�1 at 504 �C, arsenic willtend to remain in the solid phase as opposed to volatilizing.18
Because arsenic frequently forms inorganic complexes with oxygen,chlorine, and sulfur in the environment, we suspect (given thehigh levels of sulfur present) that a portion of the arsenic detectedis contained in an inorganic compound as opposed to the elemental
Figure 1. Calcium concentrations in all samples. Error bars indicate(2standard deviations.
Figure 2. Sulfur concentrations in all samples. Error bars indicate (2standard deviations.
3526 dx.doi.org/10.1021/ef2006386 |Energy Fuels 2011, 25, 3522–3529
Energy & Fuels ARTICLE
form but cannot conclude anything based on quantities of suchcompounds with the XRF data alone. The slight increases in theconcentration of arsenic as organic matter is lost from oil shale to500�1000 �C pyrolysis suggests that, while some of the arsenicmay leave the vapor phase, the majority remains in the shalematerials.
Arsenic is naturally found in rocks and soils, and its concen-tration is dependent upon the geology of the region and pastanthropogenic inputs. We often see elevated concentrations withigneous and sedimentary rocks, especially those with sulfidicores.19 The U.S. EPA’s ecological soil screening level (Eco-SSL)for plants for arsenic is 18 ppm (18 mg of arsenic/kg of soilloading), and for the protection of mammaliam wildlife, the Eco-SSL is 46 ppm. Eco-SSLs are concentrations of contaminants insoil protective of ecological receptors that commonly contactand/or consume biota that live in or on soil to protect terrestrialecosystems.20 The arsenic concentrations in the oil shale samplesranged from a low of 20 ppm (Huadian oil shale) to 104 ppm(Colorado 50 GPT 1000 �C pyrolyzed); all of the Colorado50 GPT samples were above the 46 ppm Eco-SSL, while theother four shale and semicoke samples were all below 46 ppm.Dependent upon natural arsenic levels in surrounding soils, theoil shale semicoke should only have a moderate effect onincreasing arsenic levels in the surrounding area, likely belowthe Eco-SSL, after incorporation with surrounding soils. How-ever, without dilution, the arsenic level is significantly aboveEPA’s 2010 regional screening level (RSL) for chemical con-taminants at superfund sites (regions 3, 6, and 9 compiled) of0.39 and 1.6 ppm for residential and industrial soil, respectively.21
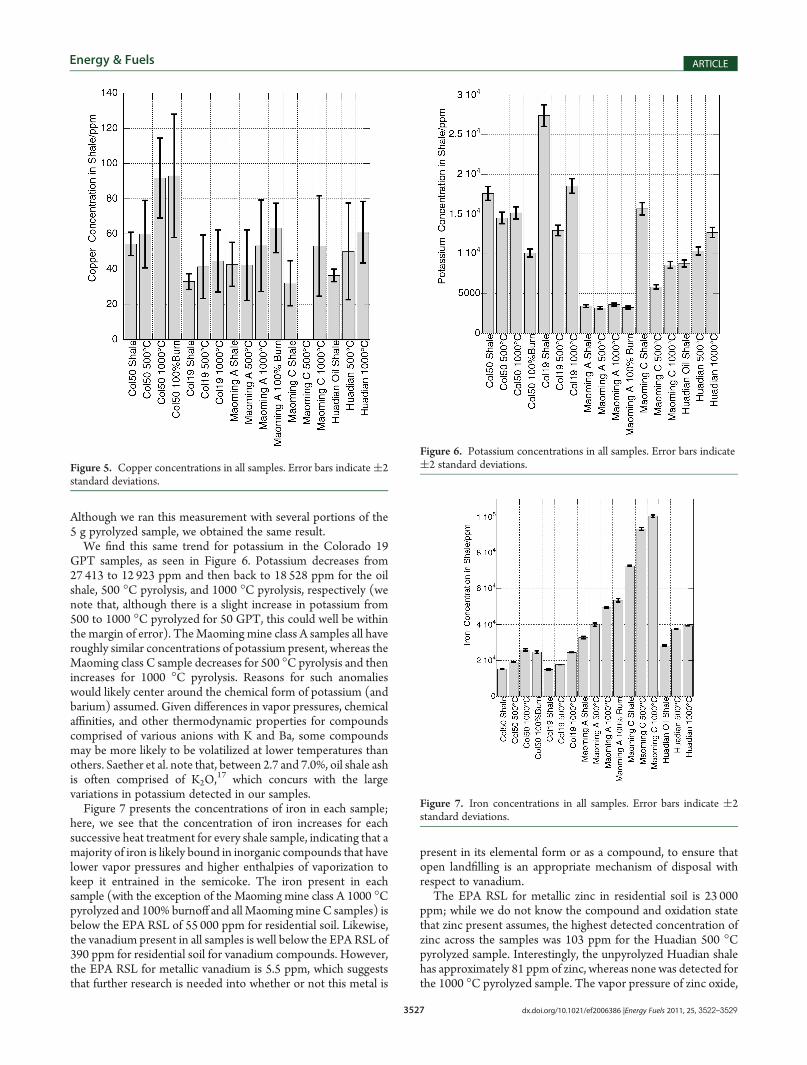
The concentrations of both lead and copper present in all fivesamples are orders of magnitude lower than the arsenic, calcium,and other metals present, as shown in Figures 4 (lead) and 5(copper). Here, we find that lead is significantly below the EPA
RSL of 400 and 800 ppm for residential and industrial soil,respectively. In addition, Adamson et al. note that concentra-tions of lead leached from oil shale ash mixtures arenegligible.22 Likewise, the copper present in all oil shalesemicokes is below the EPA RSL of 3100 and 4100 ppm forresidential and industrial soil, respectively, suggesting that theoil shale samples do not pose a threat at these concentrations ifthe semicoke is landfilled. While there was a detectable amountof strontium in every sample (ranging from 102 to 1000 ppm),this is significantly below the EPA RSL of 47 000 ppm forresidential soil.
Barium was detected in half of the samples studied atconcentrations ranging from 82 to 350 ppm; the Huadian oilshale samples had no detectable barium, whereas the Colorado19 GPT samples had detectable barium in each sample. The EPARSL for barium in residential soil is 15 000 ppm. For theColorado 50 GPT and Maoming A and C samples, bariumpresent in the oil shale sample was below the lower limit of thedetector. However, after pyrolysis at 500 �C, we detected 169ppm of Ba in the Maoming C sample, although not in the othertwo. After 1000 �C pyrolysis, 82, 276, and 228 ppm of barium inthe Colorado 50, Maoming A, and Maoming C samples, respec-tively, were detected. With each heat treatment, the carboncontent decreases. This suggests that essentially all of the bariumpresent initially remains in the semicoke because it was originallybelow the lower detection limit; if the barium was volatilized andcarried along in the He carrier stream in an amount approachingits original concentration with the carbon, it would remainundetected in subsequent samples. One potential anomaly thatwe note is the Colorado 19 GPT oil shale sample. Barium wasoriginally detected at a concentration of 220 ppm (using threeseparate samples); for the 500 �C pyrolyzed sample, it droppedto 118 ppm; and it went back to 339 ppm for the 1000 �Cpyrolysis.
Figure 4. Lead concentrations in all samples. Error bars indicate (2standard deviations.
Figure 3. Arsenic concentrations in all samples. The error bars indicate(2 standard deviations.
3527 dx.doi.org/10.1021/ef2006386 |Energy Fuels 2011, 25, 3522–3529
Energy & Fuels ARTICLE
Although we ran this measurement with several portions of the5 g pyrolyzed sample, we obtained the same result.
We find this same trend for potassium in the Colorado 19GPT samples, as seen in Figure 6. Potassium decreases from27 413 to 12 923 ppm and then back to 18 528 ppm for the oilshale, 500 �C pyrolysis, and 1000 �C pyrolysis, respectively (wenote that, although there is a slight increase in potassium from500 to 1000 �C pyrolyzed for 50 GPT, this could well be withinthe margin of error). TheMaoming mine class A samples all haveroughly similar concentrations of potassium present, whereas theMaoming class C sample decreases for 500 �C pyrolysis and thenincreases for 1000 �C pyrolysis. Reasons for such anomalieswould likely center around the chemical form of potassium (andbarium) assumed. Given differences in vapor pressures, chemicalaffinities, and other thermodynamic properties for compoundscomprised of various anions with K and Ba, some compoundsmay be more likely to be volatilized at lower temperatures thanothers. Saether et al. note that, between 2.7 and 7.0%, oil shale ashis often comprised of K2O,
17 which concurs with the largevariations in potassium detected in our samples.
Figure 7 presents the concentrations of iron in each sample;here, we see that the concentration of iron increases for eachsuccessive heat treatment for every shale sample, indicating that amajority of iron is likely bound in inorganic compounds that havelower vapor pressures and higher enthalpies of vaporization tokeep it entrained in the semicoke. The iron present in eachsample (with the exception of the Maoming mine class A 1000 �Cpyrolyzed and 100% burnoff and all MaomingmineC samples) isbelow the EPA RSL of 55 000 ppm for residential soil. Likewise,the vanadium present in all samples is well below the EPA RSL of390 ppm for residential soil for vanadium compounds. However,the EPA RSL for metallic vanadium is 5.5 ppm, which suggeststhat further research is needed into whether or not this metal is
present in its elemental form or as a compound, to ensure thatopen landfilling is an appropriate mechanism of disposal withrespect to vanadium.
The EPA RSL for metallic zinc in residential soil is 23 000ppm; while we do not know the compound and oxidation statethat zinc present assumes, the highest detected concentration ofzinc across the samples was 103 ppm for the Huadian 500 �Cpyrolyzed sample. Interestingly, the unpyrolyzed Huadian shalehas approximately 81 ppm of zinc, whereas none was detected forthe 1000 �C pyrolyzed sample. The vapor pressure of zinc oxide,
Figure 5. Copper concentrations in all samples. Error bars indicate(2standard deviations.
Figure 6. Potassium concentrations in all samples. Error bars indicate(2 standard deviations.
Figure 7. Iron concentrations in all samples. Error bars indicate (2standard deviations.
3528 dx.doi.org/10.1021/ef2006386 |Energy Fuels 2011, 25, 3522–3529
Energy & Fuels ARTICLE
a plausible form for the zinc to assume, is quite high, upward of4 Pa at 1000 �C.23 Conversely, the vapor pressure of zinc sulfideis approximately 0.001 Pa at the same temperature,24 demon-strating a lower capacity to volatilize from the oil shale sample.
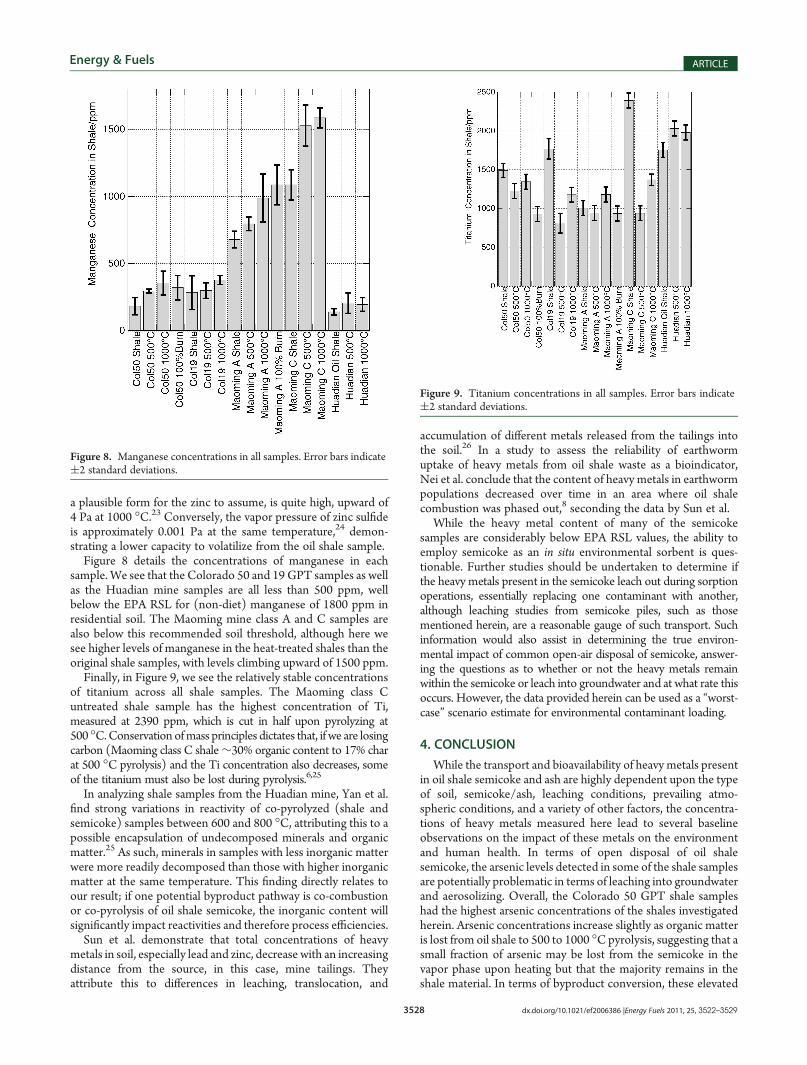
Figure 8 details the concentrations of manganese in eachsample. We see that the Colorado 50 and 19 GPT samples as wellas the Huadian mine samples are all less than 500 ppm, wellbelow the EPA RSL for (non-diet) manganese of 1800 ppm inresidential soil. The Maoming mine class A and C samples arealso below this recommended soil threshold, although here wesee higher levels of manganese in the heat-treated shales than theoriginal shale samples, with levels climbing upward of 1500 ppm.
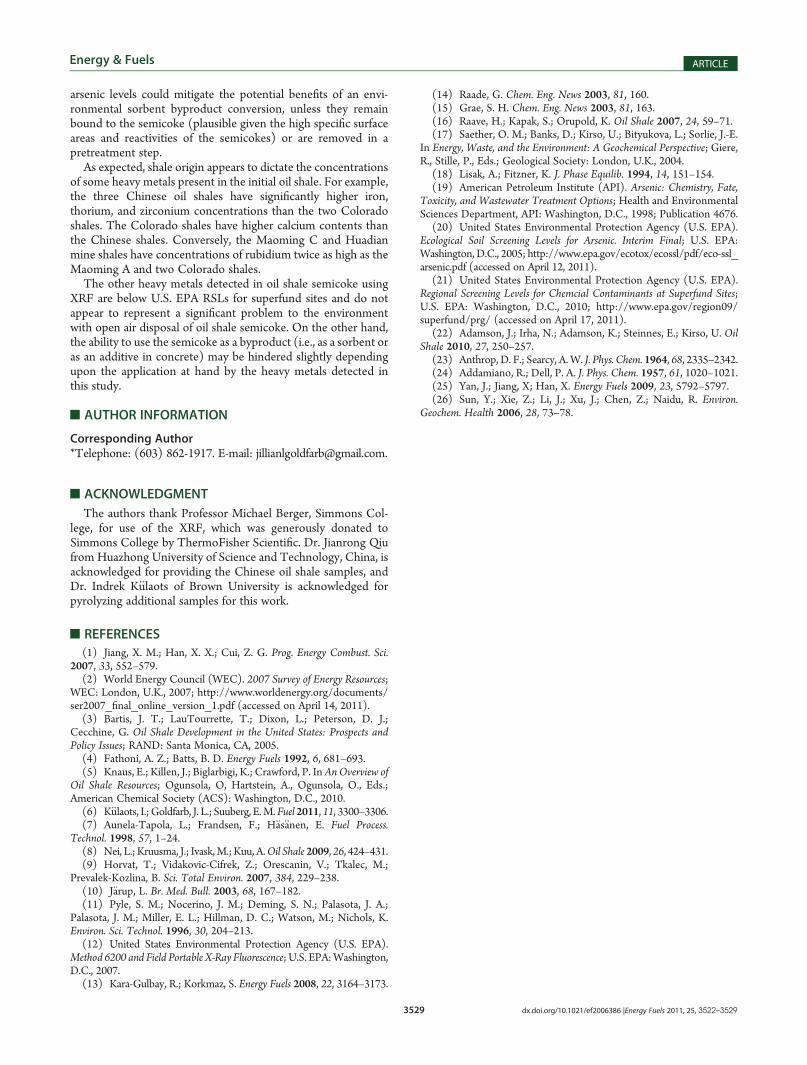
Finally, in Figure 9, we see the relatively stable concentrationsof titanium across all shale samples. The Maoming class Cuntreated shale sample has the highest concentration of Ti,measured at 2390 ppm, which is cut in half upon pyrolyzing at500 �C.Conservation ofmass principles dictates that, if we are losingcarbon (Maoming class C shale∼30% organic content to 17% charat 500 �C pyrolysis) and the Ti concentration also decreases, someof the titanium must also be lost during pyrolysis.6,25
In analyzing shale samples from the Huadian mine, Yan et al.find strong variations in reactivity of co-pyrolyzed (shale andsemicoke) samples between 600 and 800 �C, attributing this to apossible encapsulation of undecomposed minerals and organicmatter.25 As such, minerals in samples with less inorganic matterwere more readily decomposed than those with higher inorganicmatter at the same temperature. This finding directly relates toour result; if one potential byproduct pathway is co-combustionor co-pyrolysis of oil shale semicoke, the inorganic content willsignificantly impact reactivities and therefore process efficiencies.
Sun et al. demonstrate that total concentrations of heavymetals in soil, especially lead and zinc, decrease with an increasingdistance from the source, in this case, mine tailings. Theyattribute this to differences in leaching, translocation, and
accumulation of different metals released from the tailings intothe soil.26 In a study to assess the reliability of earthwormuptake of heavy metals from oil shale waste as a bioindicator,Nei et al. conclude that the content of heavy metals in earthwormpopulations decreased over time in an area where oil shalecombustion was phased out,8 seconding the data by Sun et al.
While the heavy metal content of many of the semicokesamples are considerably below EPA RSL values, the ability toemploy semicoke as an in situ environmental sorbent is ques-tionable. Further studies should be undertaken to determine ifthe heavy metals present in the semicoke leach out during sorptionoperations, essentially replacing one contaminant with another,although leaching studies from semicoke piles, such as thosementioned herein, are a reasonable gauge of such transport. Suchinformation would also assist in determining the true environ-mental impact of common open-air disposal of semicoke, answer-ing the questions as to whether or not the heavy metals remainwithin the semicoke or leach into groundwater and at what rate thisoccurs. However, the data provided herein can be used as a “worst-case” scenario estimate for environmental contaminant loading.
4. CONCLUSION
While the transport and bioavailability of heavy metals presentin oil shale semicoke and ash are highly dependent upon the typeof soil, semicoke/ash, leaching conditions, prevailing atmo-spheric conditions, and a variety of other factors, the concentra-tions of heavy metals measured here lead to several baselineobservations on the impact of these metals on the environmentand human health. In terms of open disposal of oil shalesemicoke, the arsenic levels detected in some of the shale samplesare potentially problematic in terms of leaching into groundwaterand aerosolizing. Overall, the Colorado 50 GPT shale sampleshad the highest arsenic concentrations of the shales investigatedherein. Arsenic concentrations increase slightly as organic matteris lost from oil shale to 500 to 1000 �Cpyrolysis, suggesting that asmall fraction of arsenic may be lost from the semicoke in thevapor phase upon heating but that the majority remains in theshale material. In terms of byproduct conversion, these elevated
Figure 8. Manganese concentrations in all samples. Error bars indicate(2 standard deviations.
Figure 9. Titanium concentrations in all samples. Error bars indicate(2 standard deviations.
3529 dx.doi.org/10.1021/ef2006386 |Energy Fuels 2011, 25, 3522–3529
Energy & Fuels ARTICLE
arsenic levels could mitigate the potential benefits of an envi-ronmental sorbent byproduct conversion, unless they remainbound to the semicoke (plausible given the high specific surfaceareas and reactivities of the semicokes) or are removed in apretreatment step.
As expected, shale origin appears to dictate the concentrationsof some heavy metals present in the initial oil shale. For example,the three Chinese oil shales have significantly higher iron,thorium, and zirconium concentrations than the two Coloradoshales. The Colorado shales have higher calcium contents thanthe Chinese shales. Conversely, the Maoming C and Huadianmine shales have concentrations of rubidium twice as high as theMaoming A and two Colorado shales.
The other heavy metals detected in oil shale semicoke usingXRF are below U.S. EPA RSLs for superfund sites and do notappear to represent a significant problem to the environmentwith open air disposal of oil shale semicoke. On the other hand,the ability to use the semicoke as a byproduct (i.e., as a sorbent oras an additive in concrete) may be hindered slightly dependingupon the application at hand by the heavy metals detected inthis study.
’AUTHOR INFORMATION
Corresponding Author*Telephone: (603) 862-1917. E-mail: [email protected].
’ACKNOWLEDGMENT
The authors thank Professor Michael Berger, Simmons Col-lege, for use of the XRF, which was generously donated toSimmons College by ThermoFisher Scientific. Dr. Jianrong Qiufrom Huazhong University of Science and Technology, China, isacknowledged for providing the Chinese oil shale samples, andDr. Indrek K€ulaots of Brown University is acknowledged forpyrolyzing additional samples for this work.
’REFERENCES
(1) Jiang, X. M.; Han, X. X.; Cui, Z. G. Prog. Energy Combust. Sci.2007, 33, 552–579.(2) World Energy Council (WEC). 2007 Survey of Energy Resources;
WEC: London, U.K., 2007; http://www.worldenergy.org/documents/ser2007_final_online_version_1.pdf (accessed on April 14, 2011).(3) Bartis, J. T.; LauTourrette, T.; Dixon, L.; Peterson, D. J.;
Cecchine, G. Oil Shale Development in the United States: Prospects andPolicy Issues; RAND: Santa Monica, CA, 2005.(4) Fathoni, A. Z.; Batts, B. D. Energy Fuels 1992, 6, 681–693.(5) Knaus, E.; Killen, J.; Biglarbigi, K.; Crawford, P. InAnOverview of
Oil Shale Resources; Ogunsola, O, Hartstein, A., Ogunsola, O., Eds.;American Chemical Society (ACS): Washington, D.C., 2010.(6) K€ulaots, I.; Goldfarb, J. L.; Suuberg, E.M.Fuel2011, 11, 3300–3306.(7) Aunela-Tapola, L.; Frandsen, F.; H€as€anen, E. Fuel Process.
Technol. 1998, 57, 1–24.(8) Nei, L.; Kruusma, J.; Ivask,M.; Kuu, A.Oil Shale 2009, 26, 424–431.(9) Horvat, T.; Vidakovic-Cifrek, Z.; Orescanin, V.; Tkalec, M.;
Prevalek-Kozlina, B. Sci. Total Environ. 2007, 384, 229–238.(10) J€arup, L. Br. Med. Bull. 2003, 68, 167–182.(11) Pyle, S. M.; Nocerino, J. M.; Deming, S. N.; Palasota, J. A.;
Palasota, J. M.; Miller, E. L.; Hillman, D. C.; Watson, M.; Nichols, K.Environ. Sci. Technol. 1996, 30, 204–213.(12) United States Environmental Protection Agency (U.S. EPA).
Method 6200 and Field Portable X-Ray Fluorescence; U.S. EPA:Washington,D.C., 2007.(13) Kara-Gulbay, R.; Korkmaz, S. Energy Fuels 2008, 22, 3164–3173.
(14) Raade, G. Chem. Eng. News 2003, 81, 160.(15) Grae, S. H. Chem. Eng. News 2003, 81, 163.(16) Raave, H.; Kapak, S.; Orupold, K. Oil Shale 2007, 24, 59–71.(17) Saether, O. M.; Banks, D.; Kirso, U.; Bityukova, L.; Sorlie, J.-E.
In Energy, Waste, and the Environment: A Geochemical Perspective; Giere,R., Stille, P., Eds.; Geological Society: London, U.K., 2004.
(18) Lisak, A.; Fitzner, K. J. Phase Equilib. 1994, 14, 151–154.(19) American Petroleum Institute (API). Arsenic: Chemistry, Fate,
Toxicity, and Wastewater Treatment Options; Health and EnvironmentalSciences Department, API: Washington, D.C., 1998; Publication 4676.
(20) United States Environmental Protection Agency (U.S. EPA).Ecological Soil Screening Levels for Arsenic. Interim Final; U.S. EPA:Washington, D.C., 2005; http://www.epa.gov/ecotox/ecossl/pdf/eco-ssl_arsenic.pdf (accessed on April 12, 2011).
(21) United States Environmental Protection Agency (U.S. EPA).Regional Screening Levels for Chemcial Contaminants at Superfund Sites;U.S. EPA: Washington, D.C., 2010; http://www.epa.gov/region09/superfund/prg/ (accessed on April 17, 2011).
(22) Adamson, J.; Irha, N.; Adamson, K.; Steinnes, E.; Kirso, U. OilShale 2010, 27, 250–257.
(23) Anthrop, D. F.; Searcy, A.W. J. Phys. Chem. 1964, 68, 2335–2342.(24) Addamiano, R.; Dell, P. A. J. Phys. Chem. 1957, 61, 1020–1021.(25) Yan, J.; Jiang, X; Han, X. Energy Fuels 2009, 23, 5792–5797.(26) Sun, Y.; Xie, Z.; Li, J.; Xu, J.; Chen, Z.; Naidu, R. Environ.
Geochem. Health 2006, 28, 73–78.