heavy metal pollution of soils affected by the guadiamar toxic flood
TRANSCRIPT
BioMed CentralBMC Nephrology
ss
Open AcceResearch articleGene expression profiles in developing nephrons using Lim1 metanephric mesenchyme-specific conditional mutant miceYou-Tzung Chen1, Akio Kobayashi1, Kin Ming Kwan1, Randy L Johnson2 and Richard R Behringer*1Address: 1Department of Molecular Genetics, University of Texas M. D. Anderson Cancer Center, Houston, Texas 77030, USA and 2Department of Biochemistry and Molecular Biology, University of Texas M. D. Anderson Cancer Center, Houston, Texas 77030, USA
Email: You-Tzung Chen - [email protected]; Akio Kobayashi - [email protected]; Kin Ming Kwan - [email protected]; Randy L Johnson - [email protected]; Richard R Behringer* - [email protected]
* Corresponding author
AbstractBackground: Lim1 is a homeobox gene that is essential for nephrogenesis. During metanephrickidney development, Lim1 is expressed in the nephric duct, ureteric buds, and the inducedmetanephric mesenchyme. Conditional ablation of Lim1 in the metanephric mesenchyme blocks theformation of nephrons at the nephric vesicle stage, leading to the production of small, non-functional kidneys that lack nephrons.
Methods: In the present study, we used Affymetrix probe arrays to screen for nephron-specificgenes by comparing the expression profiles of control and Lim1 conditional mutant kidneys.Kidneys from two developmental stages, embryonic day 14.5 (E14.5) and 18.5 (E18.5), wereexamined.
Results: Comparison of E18.5 kidney expression profiles generated a list of 465 nephron-specificgene candidates that showed a more than 2-fold increase in their expression level in control kidneyversus the Lim1 conditional mutant kidney. Computational analysis confirmed that this screenenriched for kidney-specific genes. Furthermore, at least twenty-eight of the top fifty (56%)candidates (or their vertebrate orthologs) were previously reported to have a nephron-specificexpression pattern. Our analysis of E14.5 expression data yielded 41 candidate genes that are up-regulated in the control kidneys compared to the conditional mutants. Three of them are relatedto the Notch signaling pathway that is known to be important in cell fate determination andnephron patterning.
Conclusion: Therefore, we demonstrate that Lim1 conditional mutant kidneys serve as a noveltissue source for comprehensive expression studies and provide a means to identify nephron-specific genes.
BackgroundKidney is one of the main excretory and homeostaticorgans of the body. The basic structural and functional
unit of the kidney is the nephron. The development of anephron involves a series of reciprocal tissue inductionsbetween the ureteric bud and the metanephric mesen-
Published: 07 February 2006
BMC Nephrology2006, 7:1 doi:10.1186/1471-2369-7-1
Received: 10 October 2005Accepted: 07 February 2006
This article is available from: http://www.biomedcentral.com/1471-2369/7/1
© 2006Chen et al; licensee BioMed Central Ltd.This is an Open Access article distributed under the terms of the Creative Commons Attribution License (http://creativecommons.org/licenses/by/2.0), which permits unrestricted use, distribution, and reproduction in any medium, provided the original work is properly cited.
Page 1 of 13(page number not for citation purposes)

BMC Nephrology 2006, 7:1 http://www.biomedcentral.com/1471-2369/7/1
chyme. Induced metanephric mesenchyme cells condenseto form pretubular cell aggregates and go through a mes-enchyme to epithelial transition and a series of morpho-logical changes, including the formation of nephricvesicles, comma- and S-shaped bodies and eventually theformation of mature nephrons. A mature nephron is com-posed of the vascular loop of the glomerulus, Bowman'scapsule, the proximal convoluted tubule, the loop ofHenle and the distal convoluted tubule that connects tothe drainage system. Genes expressed in developing andmature nephrons may be important for their develop-ment, structural integrity, and physiological function. Inhumans, mutations in such genes may cause kidney dis-ease [1].
Mouse has been widely used as a model organism for bio-medical research. This is because the mouse is anatomi-cally and physiologically similar to human. Recentprogress in the human and mouse genome projects fur-ther indicates that the organization of these two mamma-lian genomes are highly conserved [2]. Over 95% ofhuman genes can find their counterparts in the mousegenome [3,4]. This high similarity between mouse andhuman underscore the use of the mouse as the modelorganism par excellence for studies of many aspects ofhuman biology.
Although genes involved in kidney organogenesis or asso-ciated with kidney disease have been identified, there isstill limited molecular genetic knowledge of kidney devel-opment and homeostasis. Recent progress in microarraytechnology provides a powerful tool to study the kidney[5-14]. Mice with mutations that alter specific aspects ofkidney development and function provide unique tissueresources for microarray studies [15-18].
Lim1, also called Lhx1, is a LIM-class homeobox gene thatis expressed in the ureteric bud and pretubular cell aggre-gate prior to epithelialization of the developing metane-phric kidney [19,20]. Most Lim1 null mutants die aroundE10.5, an embryonic stage prior to the development of themetanephros [21]. Rare Lim1-null mutant mice survive tobirth but do not have kidneys, demonstrating an essentialrole for this gene in kidney organogenesis [21]. To bypassthe early lethality that hinders the analysis of Lim1 func-tion in kidney organogenesis, a Lim1 conditional nullallele in mouse was generated [22]. An Rarb2-Cre trans-gene was generated and used for metanephric mesen-chyme-specific ablation of Lim1 that resulted in newbornmice that had kidneys but no nephrons [20].
Nephrogenesis is a continuous process that begins withthe induction of metanephric mesenchyme by the uretericbud, around embryonic day 10.5 (E10.5), and persistsseveral weeks after birth in mice [1]. The first mature
nephron is observed at E16.5 [23]. Histological analysissuggests that the development of Lim1 mutant nephronsstops at the nephric vesicle stage, which begins aroundE11.0. Loss of a nephric vesicle polarity marker, Brn1,expression in the E13.5 conditional mutant kidneys fur-ther indicated that the Lim1 is required for correct pattern-ing of the nephric vesicle [20]. The developing nephricvesicle represents an important developmental stage inwhich nephron polarity is established. Disruption of itspatterning results in a failure to form nephron structuressuch as proximal tubules and glomerular epithelium [24].
In this study, we hypothesized that Lim1 mutant nephron-deficient kidneys could be used as a novel tissue resourcefor microarray experiments to identify genes expressed inthe developing nephrons. Kidneys of two developmentalstages were examined. Control and conditional mutantkidneys of E14.5 mouse embryos were used to identifygenes involved in early nephron development includingpattern formation. In contrast, E18.5 kidneys were used toisolate functional genes that are expressed in maturenephrons.
MethodsGeneration of conditional mutant mice and genotypingAll procedures performed on animals were done inaccordance with guidelines of the American PhysiologicalSociety and were approved by The University of Texas MDAnderson Cancer Center Institutional Animal Care andUse Committee (Richard R. Behringer, IACUC ProtocolNumber: 02-90-01735). Mice carrying a targeted Lim1null allele (Lim1lacZ, [25]), a Lim1 conditional null allele(Lim1flox, [22]) and an Rarb2-Cre transgene in which Cre isexpressed in the metanephric mesenchyme of the devel-oping kidney [20], were used in this study. Lim1lacZ/+ andLim1flox/flox mice were maintained on a C57BL/6J × 129/SvEv genetic background. Rarb2-Cre transgenic mice wereinitially generated on a C57BL/6J × SJL/J genetic back-ground.
To obtain mouse embryos with metanephric mesen-chyme-specific Lim1 deficient (Lim1flox/lacZ; Rarb2-Cretg/+)kidneys, timed matings between Lim1+/lacZ; Rarb2-Cretg/+
males and Lim1flox/flox females were established. Kidneysamples of two different embryonic stages (E14.5 andE18.5) were isolated. Their genotypes were assignedunambiguously using real time PCR assays detecting thepresence of lacZ and Cre alleles, which were established inthe M. D. Anderson Cancer Center DNA Analysis CoreFacility. For the E14.5 time point, a total of 71 embryoswere collected, 17 of them were genotyped as conditionalmutants (Lim1flox/lacZ; Rarb2-Cretg/+). Kidneys from 23Lim1flox/+; Rarb2Cretg/+ embryos were used as "control" kid-neys. For the E18.5 time point, a total of 39 embryos were
Page 2 of 13(page number not for citation purposes)

BMC Nephrology 2006, 7:1 http://www.biomedcentral.com/1471-2369/7/1
harvested, 9 of them were genotyped as conditionalmutants and 14 of them were genotyped as controls.
Tissue collection and RNA preparationEmbryonic kidney tissue from each individual was placedin a separate tube with 0.5 ml TRIzol (Invitrogen,Carlsbad, CA) and stored at -75°C until the correspond-ing visceral tissue could be genotyped. After a genotypewas unambiguously assigned to each individual, TRIzolpreserved kidneys of the same genotype were pooled andtotal RNA was prepared as per the manufacturer's instruc-tions. Total RNA was then processed using a QIAGENRNeasy Midi Kit before in vitro transcription-labeling reac-tion per Affymetrix (Santa Clara, CA) recommendation.Once purified, RNA quality was determined by electro-phoretic methods using an agarose gel or analysis using anAgilent Bioanalyzer 2100 (Palo Alto, CA) and by spectros-copy at 260 and 280 nm.
Microarray processingFive to forty micrograms of total RNA from each pooledembryonic kidney sample was used to produce the cRNAtarget for the microarray. The target was created using areverse transcription reaction to produce cDNA (Super-cript Choice System, Gibco), which was subsequently sub-jected to in vitro transcription with biotinylated cytidine-5'-triphosphate and uridine-5'-triphosphate using theENZO BioArray High Yield RNA Transcript Labeling Kit toproduce biotinylated cRNA. The target was then frag-mented and hybridized to Mouse Genome 430 2.0Affymetrix GeneChip Arrays (Affymetrix, Santa Clara, CA)in duplicates using an Affymetrix GeneChip Fluidics Sta-tion 400, according to the manufacturer's standard proto-cols. The arrays were stained with phycoerythrin-coupledavidin and scanned using a GeneArray Scanner 3000. Theresultant output was analyzed using Affymetrix Microar-ray Suite software and examined for excessive backgroundor evidence of RNA degradation. All microarray process-ing was performed in the Murine Microarray and Affyme-trix Facility at the University of Texas M. D. AndersonCancer Center.
After scanning, all probe sets were scaled to a signal inten-sity of 250 and relative levels of expression of each tran-script (signal) were determined using Microarray Suite 5.0software (Affymetrix). The images of all arrays wereinspected for physical anomalies and for the presence ofexcessive background hybridization. Generally, all arrayresults used in this study were of good quality, and nomajor manufacturer's defects or abnormalities weredetected.
Microarray analysisMicroarray experiment on each time point and genotypewas performed in technical duplicates (ie. a single RNA
preparation of pooled kidneys of one genotype used fortwo separate target preparations). Data from a total of 8independent arrays were used in this study, 2 arrays wereused for RNA samples from E18.5 control kidneys, 2 forE18.5 Lim1 conditional mutant kidneys, 2 for E14.5 con-trol kidneys, and the other 2 for E14.5 Lim1 conditionalmutant kidneys. Data generated from all arrays that satis-fied the preliminary analysis were exported and loadedinto DNA-Chip Analyzer (dChip2004) [26,27], where sta-tistical and comparative analyses were performed to verifythe data. The data were normalized using the default nor-malization method. Briefly, an iterative procedure wasused to identify an invariant set of probes, which presum-ably consisted of non-differentially expressed genes. Apiecewise-linear running median curve was then calcu-lated and used as the normalization curve. After normali-zation, all arrays had similar brightness. Medianintensities around 155 (between 155 to 158) wereobtained after normalization. Percent gene present (Pcall%) values between 55.7% and 63.6% were observedusing default detection p-value cut offs (a1 = 0.04 and a2 =0.06). Array outlier (%) and single outlier (%) weredetected at ranges from 0.016% to 0.080% and from0.009% to 0.045%. Expression data obtained from allarrays used is provided in Additional file 1.
Normalized data were exported in a tab delimited text for-mat. Fold changes of each transcript from different sam-ples were calculated and sorted using Microsoft Excel 5.0software. Signal obtained from control kidney sampleswere used as an experiment to compare to the signalobtained from Lim1 conditional mutant kidneys that wasdesignated as a baseline. A 2-fold change in the means ofsignal obtained from experimental duplicates and thosefrom baseline duplicates was used as the criterion to iden-tify differentially expressed transcripts. To ensure the qual-ity of the data, probe sets that showed a fold changebetween duplicates greater than between the experimentalmean and baseline mean were removed. To study onlygenes that showed consistent expression on experimentalchips, probe sets that did not show consistent present callsin the experimental duplicates were removed. To focus ongenes with a significant fold change between the experi-ment and the baseline, only probe sets that the product oftheir experimental mean and fold change were more than100 were retained. To produce a compact differentiallyexpressed gene list, the probe set list was sorted withinMicrosoft Excel based on Locus Link number and redun-dant entries were removed. Our experimental designdescription and the data format provided in the Addi-tional files fulfill the MIAME (minimum informationabout a microarray experiment) standards [28].
Page 3 of 13(page number not for citation purposes)

BMC Nephrology 2006, 7:1 http://www.biomedcentral.com/1471-2369/7/1
Expression specificity and ontological analysisTo evaluate kidney expression specificity of identifiedgenes, gene symbols and locus numbers were used toretrieve their relevant expression information in theGenomics Institute of the Novartis Foundation (GNF)Gene Expression Atlas 2 and Unigene databases. The GNFAtlas 2.0 contains two replicates each of 61 mouse tissuesrun over Affymetrix probe arrays. It was accessed using theGene Sorter server provided by the University of Califor-nia at Santa Cruz [29]. Gene Sorter provides a score,between -4 to 4, to describe the relative expression level ofa gene in different tissues presented in the GNF Atlas 2[30]. In contrast Unigene is a system automatically parti-tioning GenBank sequences, including expressedsequence tags (ESTs), into a non-redundant set of gene-oriented clusters [31]. The Unigene data were obtainedfrom SOURCE [32], which provides a normalized expres-sion level, based on the number of ESTs within the clusterfound in cDNA libraries of different sources, expressed inpercentages, to represent the relative abundance of a tran-script in different tissues or organs [33]. To understandthe composition of the genes identified in our study,ontological analysis was performed using DAVID (Data-base for Annotation, Visualization and Integrated Discov-ery) and EASE (Expression Analysis Systematic Explorer)from the National Institute for Allergy and Infectious Dis-ease (NIAID) [34-37]. Data obtained were processed andcharts were drawn using Microsoft Excel 5.0 software.
ResultsIdentification of stage-specific kidney genesThe first protocol used was to compare gene expressionlevels in kidney samples of the two developmental stages
so that stage-specific kidney genes could be identified. Toenrich for E18.5 kidney-specific genes, signals obtainedfrom E18.5 control kidney samples (E18.5C) were used tocompare with E14.5 control kidney data (E14.5C). Genessorted according to their expression signal fold changes(E18.5C/E14.5C) generated a list enchriched for E18.5mouse kidney genes. A list of 1,006 genes showed morethan 2 fold change was identified (Table 1 and Additionalfile 2). As shown in Table 2, the enrichment for kidneyspecificity was dramatic. The average relative kidneyexpression level among the top 50 genes on the listreported by Gene Sorter is 3.6 whereas that of the gene listsorted using raw signals (E18.5C) is only -0.1. Similarlythe average normalized expression level in the kidney,reported by SOURCE [33], of the top 50 genes alsoshowed a nearly 15 fold increase (30.69% compare to2.07%). Although a PubMed search did not find any ofthe top 50 genes in the list sorted by raw signals (E18.5C;0%), 22 of the top 50 (44%) genes sorted by fold change(E18.5C/E14.5C) were described to have a nephron-spe-cific expression pattern.
The same approach was applied to the E14.5 experimentto identify 796 gene that showed more than a 2 foldchange (Table 1 and Additional file 3), however theenrichment for kidney- or nephron-specificity was not sig-nificant. As shown in Table 2, the average relative kidneyexpression levels of the top 50 genes were not much dif-ferent in lists sorted by the raw signals and fold changes (-0.1 and 0.0). A slight increase in the average normalizedexpression in the kidney was observed (1.48% and2.51%). There were only 2 genes (4%) among the top 50reported to have a nephron-specific expression pattern in
Table 1: Numbers of genes that showed more than a 2-fold increase in different expression level comparisons.
Experiment/Baseline E18.5 C E18.5 M E14.5 C E14.5 M
E18.5 C - 47 796 -E18.5 M 465 - 481 341E14.5 C 1,006 476 - 2E14.5 M - 331 41 -
Table 2: Expression profile comparison between E18.5 control and Lim1 conditional mutant kidney generated a gene list enriched for nephron-specificity.
Sorted by Relative kidney expression level (GNF 2.0)
Normalized expression in kidney (SOURCE)
Published Nephron-specific expression (PubMed)
E18.5 C -0.1 2.07% 0%E18.5 C/E14.5 C 3.6 30.69% 44%E18.5 C/E18.5 M 3.5 32.27% 56%
E14.5 C -0.1 1.48% 0%E14.5 C/E18.5 C 0.0 2.51% 4%E14.5 C/E14.5 M 2.9 21.51% 26%
Page 4 of 13(page number not for citation purposes)
BMC Nephrology 2006, 7:1 http://www.biomedcentral.com/1471-2369/7/1
Page 5 of 13(page number not for citation purposes)
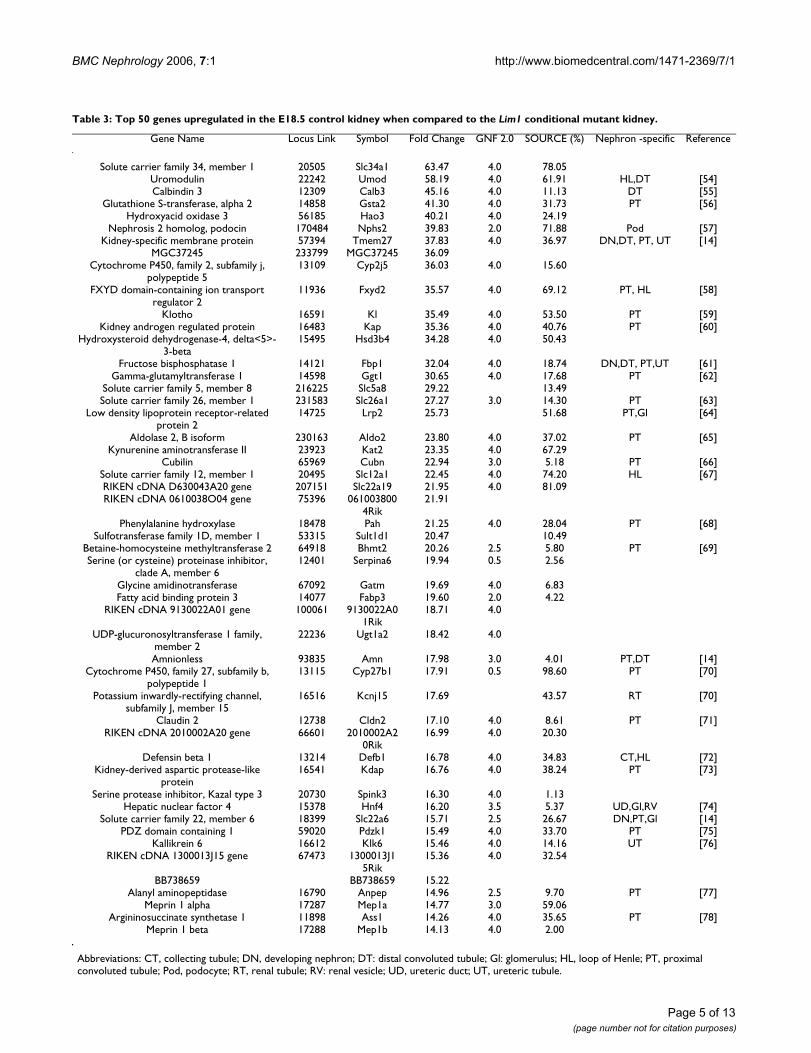
Table 3: Top 50 genes upregulated in the E18.5 control kidney when compared to the Lim1 conditional mutant kidney.
Gene Name Locus Link Symbol Fold Change GNF 2.0 SOURCE (%) Nephron -specific Reference
Solute carrier family 34, member 1 20505 Slc34a1 63.47 4.0 78.05Uromodulin 22242 Umod 58.19 4.0 61.91 HL,DT [54]Calbindin 3 12309 Calb3 45.16 4.0 11.13 DT [55]
Glutathione S-transferase, alpha 2 14858 Gsta2 41.30 4.0 31.73 PT [56]Hydroxyacid oxidase 3 56185 Hao3 40.21 4.0 24.19
Nephrosis 2 homolog, podocin 170484 Nphs2 39.83 2.0 71.88 Pod [57]Kidney-specific membrane protein 57394 Tmem27 37.83 4.0 36.97 DN,DT, PT, UT [14]
MGC37245 233799 MGC37245 36.09Cytochrome P450, family 2, subfamily j,
polypeptide 513109 Cyp2j5 36.03 4.0 15.60
FXYD domain-containing ion transport regulator 2
11936 Fxyd2 35.57 4.0 69.12 PT, HL [58]
Klotho 16591 Kl 35.49 4.0 53.50 PT [59]Kidney androgen regulated protein 16483 Kap 35.36 4.0 40.76 PT [60]
Hydroxysteroid dehydrogenase-4, delta<5>-3-beta
15495 Hsd3b4 34.28 4.0 50.43
Fructose bisphosphatase 1 14121 Fbp1 32.04 4.0 18.74 DN,DT, PT,UT [61]Gamma-glutamyltransferase 1 14598 Ggt1 30.65 4.0 17.68 PT [62]
Solute carrier family 5, member 8 216225 Slc5a8 29.22 13.49Solute carrier family 26, member 1 231583 Slc26a1 27.27 3.0 14.30 PT [63]
Low density lipoprotein receptor-related protein 2
14725 Lrp2 25.73 51.68 PT,Gl [64]
Aldolase 2, B isoform 230163 Aldo2 23.80 4.0 37.02 PT [65]Kynurenine aminotransferase II 23923 Kat2 23.35 4.0 67.29
Cubilin 65969 Cubn 22.94 3.0 5.18 PT [66]Solute carrier family 12, member 1 20495 Slc12a1 22.45 4.0 74.20 HL [67]RIKEN cDNA D630043A20 gene 207151 Slc22a19 21.95 4.0 81.09RIKEN cDNA 0610038O04 gene 75396 061003800
4Rik21.91
Phenylalanine hydroxylase 18478 Pah 21.25 4.0 28.04 PT [68]Sulfotransferase family 1D, member 1 53315 Sult1d1 20.47 10.49
Betaine-homocysteine methyltransferase 2 64918 Bhmt2 20.26 2.5 5.80 PT [69]Serine (or cysteine) proteinase inhibitor,
clade A, member 612401 Serpina6 19.94 0.5 2.56
Glycine amidinotransferase 67092 Gatm 19.69 4.0 6.83Fatty acid binding protein 3 14077 Fabp3 19.60 2.0 4.22
RIKEN cDNA 9130022A01 gene 100061 9130022A01Rik
18.71 4.0
UDP-glucuronosyltransferase 1 family, member 2
22236 Ugt1a2 18.42 4.0
Amnionless 93835 Amn 17.98 3.0 4.01 PT,DT [14]Cytochrome P450, family 27, subfamily b,
polypeptide 113115 Cyp27b1 17.91 0.5 98.60 PT [70]
Potassium inwardly-rectifying channel, subfamily J, member 15
16516 Kcnj15 17.69 43.57 RT [70]
Claudin 2 12738 Cldn2 17.10 4.0 8.61 PT [71]RIKEN cDNA 2010002A20 gene 66601 2010002A2
0Rik16.99 4.0 20.30
Defensin beta 1 13214 Defb1 16.78 4.0 34.83 CT,HL [72]Kidney-derived aspartic protease-like
protein16541 Kdap 16.76 4.0 38.24 PT [73]
Serine protease inhibitor, Kazal type 3 20730 Spink3 16.30 4.0 1.13Hepatic nuclear factor 4 15378 Hnf4 16.20 3.5 5.37 UD,Gl,RV [74]
Solute carrier family 22, member 6 18399 Slc22a6 15.71 2.5 26.67 DN,PT,Gl [14]PDZ domain containing 1 59020 Pdzk1 15.49 4.0 33.70 PT [75]
Kallikrein 6 16612 Klk6 15.46 4.0 14.16 UT [76]RIKEN cDNA 1300013J15 gene 67473 1300013J1
5Rik15.36 4.0 32.54
BB738659 BB738659 15.22Alanyl aminopeptidase 16790 Anpep 14.96 2.5 9.70 PT [77]
Meprin 1 alpha 17287 Mep1a 14.77 3.0 59.06Argininosuccinate synthetase 1 11898 Ass1 14.26 4.0 35.65 PT [78]
Meprin 1 beta 17288 Mep1b 14.13 4.0 2.00
Abbreviations: CT, collecting tubule; DN, developing nephron; DT: distal convoluted tubule; Gl: glomerulus; HL, loop of Henle; PT, proximal convoluted tubule; Pod, podocyte; RT, renal tubule; RV: renal vesicle; UD, ureteric duct; UT, ureteric tubule.

BMC Nephrology 2006, 7:1 http://www.biomedcentral.com/1471-2369/7/1
the gene list sorted by developmental stage-specific foldchange (E14.5C/E18.5C). A closer look of the gene listrevealed that this list enriched for genes generallyexpressed in undifferentiated, embryonic tissues but donot necessarily show kidney-specificity (data not shown).
Identification of nephron-specific genes of different developmental stagesA second protocol was to take advantage of the nephron-deficient Lim1 conditional mutant kidneys to identifynephron-specific genes of different developmental stages[20]. To generate an E18.5 nephron-specific gene list, wecompared gene expression data of E18.5 control kidney(E18.5C) and Lim1 conditional mutant kidney (E18.5M).Fold changes were calculated and used to sort genes. Atotal of 465 genes showed a more than 2 fold increase inexpression in the control kidney compared to the condi-tional mutant kidney (Table 1 and Additional file 4). Thetop 50 genes on the list were further evaluated computa-tionally for their kidney specificity. The results indicatethat the gene list generated by this protocol is highlyenrich for nephron-specific genes. The average relativekidney expression level, based on GNF 2.0, reached 3.5,and the normalized kidney expression level, according toSOURCE, is 32.27%. There is also a slight increase in theratio of genes with published nephron-specific expressionpatterns (56%) compared to the gene list generated usingthe previous protocol (44%). The details of the gene listare described in Table 3.
A gene list enriched for E14.5 nephron-specific genes wasgenerated using the same protocol. Comparison of theE14.5 control kidney and Lim1 conditional mutant kid-ney gene expression profile picked up only 41 genes thatshowed a more than 2 fold change (Table 1). Unlike thegene list sorted by the comparison made between devel-opmental stages (E14.5C/E18.5C), which does not signif-icantly enrich for E14.5 kidney genes, the comparisonbetween control and Lim1 conditional mutant kidneyhelped to identify kidney-specific genes, especially thoseexpressed in the nephrons. As shown in Table 2, the aver-age relative kidney expression level is as high as 2.9, andthere is also a nearly 15 fold increase in the average nor-malized kidney expression level (21.51 % compare to1.48%). Thirteen (26%) genes on the top 50 list were alsopreviously described to have a nephron-specific expres-sion pattern. Notably 3 genes related to the Notch signal-ing pathway, Msih2, Hes5, and Jag1 were found in the list.The details of this gene list are summarized in Table 4.
Ontological analysis on nephron-specific genes of different developmental stagesTo gain insight into the functional aspects of the microar-ray data, we exploited the web-based annotation tool,DAVID, to help identify functional themes that showed
differences between the control kidney and the Lim1 con-ditional mutant kidney [36]. Each of the top 1,000 geneson the lists that displayed upregulation in the control kid-ney compared to the Lim1 conditional mutant kidney ateither E18.5 or E14.5 were used for this analysis. Ontolog-ical analyses were performed at Molecular Function Level1, Biological Process Level 2, and Cell Component Level 4[35]. The results of major functional categories are shownin Figure 1. The numbers of genes that fell in major cate-gories were normalized by the number of genes annotatedin each list and were expressed in percentages. Generallyspeaking nephron-specific genes identified at E18.5 werebetter studied. Close to 60% of these genes were anno-tated in Molecular Function and Biological Process ontol-ogies and 32% in Cell Component at the levels ouranalyses were performed. In contrast, only about 30% and11% of the genes on the E14.5 nephron-specific gene listwere annotated at the same levels.
Comparisons made at Molecular Function Level 1 (Figure1A) revealed that the majority of the E18.5 nephron genesidentified in our screen were described to possess catalyticactivity (58.49%) whereas molecules found in the E14.5nephron gene list were better studied for their physicalinteractions with other molecules (e.g. binding, 64.48%).The E18.5 gene list is also characterized by a relativelyhigh proportion of transporter proteins (25.79%)whereas the E14.5 gene list contains a higher ratio ofgenes with signal transducer (13.73%), transcription reg-ulator (8.06%), enzyme regulator (4.48%), motor(1.19%) and translation regulator (0.90%) functions.
Ontological analysis at Biological Process Level 2 (Figure1B) indicated that the E14.5 nephron-specific gene listfavors molecules involved in cell communication(20.79%) and morphogenesis (11.11%). Metabolism isdetected as a very significant functional theme in theE18.5 gene list with an EASE score of 7.72 E-5 (data notshown) [37].
Cell Component Level 4 ontological study (Figure 1C) ofE18.5 nephron-specific genes featured by a high propor-tion of genes identified at subcellular sites related toenergy metabolism, including mitochondria (46.27%),mitochodrial inner membrane (13.04%), electron trans-fer flavoprotein complex (0.93%), hydrogen-translocat-ing V-type ATPase complex (1.24%), proton-transportingATP synthase complex (2.80%), proton-transporting two-sector ATPase complex (3.11%), respiratory chain com-plex III (0.93%), respiratory chain complex IV (1.86%),and ubiquinol-cytochrome-c reductase complex (0.93%).There were also more proteins found at the vacuole(5.59%), microbody (4.04%) and vesicular fraction(3.11%). However, a higher proportion of proteins in thecytoskeleton (18.52%), Golgi apparatus (12.96%), nucle-
Page 6 of 13(page number not for citation purposes)

BMC Nephrology 2006, 7:1 http://www.biomedcentral.com/1471-2369/7/1
oplasm (12.96%), cytosol (11.11%), chromatin (3.70%)and basal lamina (2.78%) was found in the E14.5 genelist.
DiscussionThe mouse is one of the most widely used animal modelsto study human biology especially after the developmentof embryonic stem (ES) cells and the assembly and anno-
tation of the mouse genome sequence [2-4,38]. ES cellsand gene targeting technology allow the construction oftransgenic mice with defined genetic modifications. Theavailability of whole genome sequences forms the basis ofthe development of high-throughput technologies, suchas microarrays, to conduct research at a genomic level.Since it is relatively difficult to collect significant numbersof genetically well-defined human samples, it is impor-
Table 4: Top 41 genes upregulated in the E14.5 control kidney when compared to the Lim1 conditional mutant kidney.
Gene Name Locus Link Symbol Fold Change GNF 2.0 SOURCE (%) Nephron -specific Reference
Sulfotransferase family 1D, member 1 53315 Sult1d1 7.22 10.49Hydroxyacid oxidase 3 56185 Hao3 7.05 4.0 24.19
FXYD domain-containing ion transport regulator 2
11936 Fxyd2 5.71 4.0 69.12 PT,HL [58]
Hepatic nuclear factor 4 15378 Hnf4 5.70 3.5 5.37 UD,DG,RV [74]Kidney-specific membrane protein 57394 Tmem27 4.26 4.0 36.97 DN,DT, PT,UT [14]
Sclerostin domain containing 1 66042 Sostdc1 4.16 3.5 12.36 DT [79]Lymphocyte antigen 6 complex, locus A 110454 Ly6a 4.05 2.5 7.10
AW210596 240638 AW210596 3.38 4.0 5.03Aldolase 2, B isoform 230163 Aldo2 3.27 4.0 37.02 PT [65]
RIKEN cDNA 9930038N01 gene 9930038N01Rik 3.13RIKEN cDNA 0610033E06 gene 112417 0610033E06Rik 3.07 3.5 37.77
Musashi homolog 2 76626 Msi2h 2.87 1.12ATPase, Na+/K+ transporting, beta 1
polypeptide11931 Atp1b1 2.83 2.5 8.64
Hairy and enhancer of split 5 15208 Hes5 2.67 0.5 0.00 CB,SB, PT [40]RIKEN cDNA 1300013J15 gene 67473 1300013J15Rik 2.55 4.0 32.54
BC013481 245945 BC013481 2.51 1.72PDZ domain containing 1 59020 Pdzk1 2.51 4.0 33.70 PT [75]
RIKEN cDNA D630042F21 gene 330428 D630042F21Rik 2.50 70.39Glucosaminyl (N-acetyl) transferase 1,
core 214537 Gcnt1 2.45 5.38
Dipeptidylpeptidase 4 13482 Dpp4 2.38 PT,DT [80]Low density lipoprotein receptor-
related protein 214725 Lrp2 2.37 51.68 PT,Gl [64]
Purkinje cell protein 4 14858 Pcp4 2.35 -2.0 0.00Glutathione S-transferase, alpha 2 18546 Gsta2 2.35 4.0 31.73 PT [56]
MGC37245 233799 MGC37245 2.29BB427389 BB427389 2.28
Single-minded 1 20464 Sim1 2.27 2.5 0.00 RT 81Kidney expressed gene 1 64697 Keg1 2.26 4.0 49.76
BG064527 BG064527 2.24RIKEN cDNA 2610511G16 gene 67500 2610511G16Rik 2.20Nephrosis 2 homolog, podocin 170484 Nphs2 2.20 2.0 71.88 Pod 57
Solute carrier family 34, member 1 20505 Slc34a1 2.16 4.0 78.05RIKEN cDNA 2700008B19 gene 217026 2700008B19Rik 2.15 1.76RIKEN cDNA 6332401O19 gene 319832 6332401O19Rik 2.14 6.71RIKEN cDNA 9130423L19 gene 74570 9130423L19Rik 2.11 1.5
C85657 C85657 2.11RIKEN cDNA 5730493B19 gene 5730493B19Rik 2.10
Fucosyltransferase 9 14348 Fut9 2.10 4.0 3.15AU022045 AU022045 2.07Jagged 1 16449 Jag1 2.06 1.5 1.20 RV, CB, SB,PT [82]
EH-domain containing 2 259300 Ehd2 2.02 0.00RIKEN cDNA 2610510D13 gene 229279 2610510D13Rik 2.01 -0.5
Abbreviations: CB, comma-shaped body; CT, collecting tubule; DN, developing nephron; DG, developing glomerulus; DT: distal convoluted tubule; Gl: glomerulus; HL, loop of Henle; PT, proximal convoluted tubule; Pod, podocyte; RT, renal tubule; RV: renal vesicle; SB, S-shaped body; UD, ureteric duct; UT, ureteric tubule
Page 7 of 13(page number not for citation purposes)

BMC Nephrology 2006, 7:1 http://www.biomedcentral.com/1471-2369/7/1
tant to perform research on an evolutionarily close speciesprior to their human applications. In this study, we tookadvantage of the nephron-deficient kidneys from metane-phric mesenchyme-specific Lim1 conditional mutant miceto perform a genome-wide screen for developing nephrongenes. Whereas similar studies have been performed onkidneys from meprin β, vitamin D receptor, aquaporin-1,
or metallothionein knockout mice, our study is the first touse a tissue-specific approach in the kidney [15-18].
Computational analysis and PubMed search suggestedthat the expression profile comparison between controland Lim1 conditional mutant kidneys generated gene listsenriched for nephron-specific genes. In global gene
Ontological analyses of the top 1,000 genes upregulated in E18.5 and E14.5 control kidneysFigure 1Ontological analyses of the top 1,000 genes upregulated in E18.5 and E14.5 control kidneys. A. Molecular Function Level 1 analysis (annotation rates: E18.5 – 63.6%, E14.5 – 33.5%). B. Biological Process Level 2 analysis (annotation rates: E18.5 – 54.0%, E14.5 – 27.9%). C. Cell Component Level 4 analysis (annotation rates of the top 1,000 genes: E18.5 – 32.2%, E14.5 – 10.8%). Only molecule categories containing at least 3 hits in either of the gene lists are shown. The numbers of genes fell in major functional categories were normalized by the numbers of gene annotated in each list and were expressed in percentages.
Page 8 of 13(page number not for citation purposes)
BMC Nephrology 2006, 7:1 http://www.biomedcentral.com/1471-2369/7/1
expression level studies, ribosomal genes and otherhousekeeping genes that are highly expressed but do notshow any tissue- or developmental stage-specificity arealways identified. In this study, we used two different pro-tocols to enrich for developmental stage-specific kidneygenes and nephron-specific genes of different develop-mental stages. Two independent online gene expressiondatabases, namely GNF Expression Atlas 2.0 and Unigenewere used to evaluate the tissue-specific enrichment com-putationally. Our results indicated dramatic enrichmentsfor kidney-specific genes by both protocols in the E18.5experiments. However, the comparison made betweenE14.5 and E18.5 control kidneys did not generate a kid-ney-specific gene list. In our opinion, there are at least twopossible reasons. Firstly, data from the two online data-bases we used were based on experiments performedusing either adult or neonate kidney tissues. Neither ofthem are likely to reflect gene expression profiles duringearly nephron development. Secondly, since many impor-tant molecular pathways and fundamental developmen-tal processes are repeatedly observed in different organsystems, genes predominantly expressed during earlynephron development are also likely to be found in otherundifferentiated tissues. A closer look of the gene listresults in a conclusion consistent with this latter assump-tion. Many of the genes identified by this comparison arecommonly found in undifferentiated tissues (data notshown). In contrast, the comparison between E14.5 con-trol and Lim1 conditional mutant kidneys identified mol-ecules that are also found in mature nephrons, whichpredominantly contributed to the kidney-specificity inour evaluation, and molecules involved in early nephrondevelopment. For example, podocin (Nphs2) is onlyexpressed in terminally differentiated podocytes [39]. Ele-vated podocin level observed in E14.5 control kidney sug-gests that the first podocyte is found before or aroundE14.5. Notably, regulatory genes important in early neph-ron development, such as Msi2h, Hes5, and Jag1, whichare involved in Notch signaling [40-45], do not show kid-ney-specificity based on GNF Atlas 2.0 and UniGene data.However, our screening protocol placed them on top ofour list. Therefore, the use of Lim1 conditional mutant tis-sue as an RNA source in our microarray experimenthelped to identify nephron developmental genes.
The results of our ontological comparison made betweenthe E18.5 and E14.5 nephron-specific gene lists are con-sistent with current concepts of kidney organogenesis anda previous study [46,47]. Gene ontology (GO) annota-tions provide structured, precisely defined, common, con-trolled vocabulary for describing the roles of genes andtheir products in any organism. It is the current represen-tation of biological knowledge as well as serving as a guidefor organizing new data [35]. However, one should keepin mind that the gene ontology is a dynamic, web-based
resource, the annotations are not complete and their accu-racy is limited by current knowledge of the molecules.Although kidney organogenesis is a continuous process,the first nephron is not seen until around E16.5 [1,23].Nephrons forming in a E14.5 kidney are mainly com-posed of reciprocally induced tissues, stem cell growthand differentiation, cell polarization, mesenchyme to epi-thelia transformation, branching morphogenesis, angio-genesis, apoptosis, proximal-distal segmentation and thedifferentiation of several interesting cell types. In ouroncological analysis, E14.5 forming nephron-specificgenes are composed of those better studied for their pro-tein-protein interaction (binding) and possess signaltransducer, transcription regulator and enzyme regulatoractivities. A higher portion of them are involved in cellcommunication and morphogenesis process. Interest-ingly, they are associated with cytoskeleton and nuclearcompartments (nucleoplasm and chromatin). In contrast,there are many mature nephrons present in an E18.5 kid-ney. Therefore, we were expecting to observe genes relatedto kidney function, e.g. those involved in solute transportand energy metabolism. Our results indicate a relativelyhigh number of E18.5 nephron-specific genes possess cat-alytic activity (presumably related to energy metabolismand the extensive extracellular matrix change in late kid-ney development) and exert their function as transporters.Consistently, an extremely high proportion of themencoded proteins located in the mitochondria.
Ontological analysis and a detailed examination of thetop 1,000 E14.5 nephron-specific gene list suggest thatgenes with modest upregulation in the control kidney(fold changes less than 2 in our experiment) are also inter-esting. For example, Brn1 (1.34) and EphA4 (1.67) werepreviously shown to be downstream of Lim1 [20,25]. Fzd4(1.71) has been considered a candidate receptor to trans-duce Wnt4 signals during kidney organogenesis [1,48].Irx2 (1.52) and Irx3 (1.28) are homeobox genes previ-ously reported to be expressed in the developing neph-rons [49]. Crb3 (1.40) is known to localize to kidneyepithelia and is essential for ciliogenesis [50,51]. The top1,000 genes upregulated in the E14.5 control kidney issupplied in Additional file 5.
Tissue heterogeniety always complicates the interpreta-tion of microarray data although analyses of differentorgans or even on organisms of different developmentalstages have been reported [30,52]. In our experiment, weused the whole kidney as a tissue source for RNA prepara-tion. The complexity of kidney structure and developmentlimits interpretations of our results. Improvements in tis-sue collection methods such as laser capture microdissec-tion and fluoresence-activated cell sorting (FACS) ongenetic marked/fluorescent protein-labelled transgenictissue have been developed [14,53] and could provide
Page 9 of 13(page number not for citation purposes)

BMC Nephrology 2006, 7:1 http://www.biomedcentral.com/1471-2369/7/1
more specificity. Nevertheless, our study demonstratesthat genetically engineered mouse organs can be used toidentify tissue-specific and developmentally regulatedgenes during mammalian organogenesis.
ConclusionOur experimental results indicate that the expression pro-file comparisons between the control and the Lim1 condi-tional mutant kidneys generated nephron-specific genelists. Our results demonstrate the feasibility of exploitinggenetically engineered kidneys to identify developingnephron-specific genes.
Competing interestsThe author(s) declare that they have no competing inter-ests.
Authors' contributionsYTC designed the study, carried out sample collection,performed computational analysis, and prepared themanuscript. AK conceived the study, participated in sam-ple collection, and participated in discussions. KMKhelped in sample collection and contributed to the discus-sion. RLJ provided microarray chips and contributed tothe discussion. RRB participated in study design, super-vised data collection, and prepared the manuscript.
Additional material
AcknowledgementsWe thank Sara Rizvi, Mona Varia, and Mini Kapoor in the M. D. Anderson Cancer Center Murine Microarray and Affymetrix Facility (MMAF) for array processing. Jin Wang for assistance on initial data analysis. These stud-ies were supported by a grant from the National Institutes of Health (NIH) HD30284 to R.R.B. and by EY012311 to R.L.J. MMAF and veterinary resources were supported by the NIH Cancer Center Support Grant CA16672.
References1. Vainio S, Lin Y: Coordinating early kidney development: les-
sons from gene targeting. Nat Rev Genet 2002, 3:533-543.2. Waterston RH, Lindblad-Toh K, Birney E, Rogers J, Abril JF, Agarwal
P, Agarwala R, Ainscough R, Alexandersson M, An P, Antonarakis SE,Attwood J, Baertsch R, Bailey J, Barlow K, Beck S, Berry E, Birren B,Bloom T, Bork P, Botcherby M, Bray N, Brent MR, Brown DG, BrownSD, Bult C, Burton J, Butler J, Campbell RD, Carninci P, Cawley S,Chiaromonte F, Chinwalla AT, Church DM, Clamp M, Clee C, CollinsFS, Cook LL, Copley RR, Coulson A, Couronne O, Cuff J, Curwen V,Cutts T, Daly M, David R, Davies J, Delehaunty KD, Deri J, Dermitza-kis ET, Dewey C, Dickens NJ, Diekhans M, Dodge S, Dubchak I, DunnDM, Eddy SR, Elnitski L, Emes RD, Eswara P, Eyras E, Felsenfeld A,Fewell GA, Flicek P, Foley K, Frankel WN, Fulton LA, Fulton RS, FureyTS, Gage D, Gibbs RA, Glusman G, Gnerre S, Goldman N, GoodstadtL, Grafham D, Graves TA, Green ED, Gregory S, Guigo R, Guyer M,Hardison RC, Haussler D, Hayashizaki Y, Hillier LW, Hinrichs A,Hlavina W, Holzer T, Hsu F, Hua A, Hubbard T, Hunt A, Jackson I,Jaffe DB, Johnson LS, Jones M, Jones TA, Joy A, Kamal M, Karlsson EK,Karolchik D, Kasprzyk A, Kawai J, Keibler E, Kells C, Kent WJ, KirbyA, Kolbe DL, Korf I, Kucherlapati RS, Kulbokas EJ, Kulp D, Landers T,Leger JP, Leonard S, Letunic I, Levine R, Li J, Li M, Lloyd C, Lucas S,Ma B, Maglott DR, Mardis ER, Matthews L, Mauceli E, Mayer JH,McCarthy M, McCombie WR, McLaren S, McLay K, McPherson JD,Meldrim J, Meredith B, Mesirov JP, Miller W, Miner TL, Mongin E,Montgomery KT, Morgan M, Mott R, Mullikin JC, Muzny DM, NashWE, Nelson JO, Nhan MN, Nicol R, Ning Z, Nusbaum C, O'ConnorMJ, Okazaki Y, Oliver K, Overton-Larty E, Pachter L, Parra G, PepinKH, Peterson J, Pevzner P, Plumb R, Pohl CS, Poliakov A, Ponce TC,Ponting CP, Potter S, Quail M, Reymond A, Roe BA, Roskin KM,Rubin EM, Rust AG, Santos R, Sapojnikov V, Schultz B, Schultz J,Schwartz MS, Schwartz S, Scott C, Seaman S, Searle S, Sharpe T,Sheridan A, Shownkeen R, Sims S, Singer JB, Slater G, Smit A, SmithDR, Spencer B, Stabenau A, Stange-Thomann N, Sugnet C, Suyama M,Tesler G, Thompson J, Torrents D, Trevaskis E, Tromp J, Ucla C,Ureta-Vidal A, Vinson JP, Von Niederhausern AC, Wade CM, Wall M,Weber RJ, Weiss RB, Wendl MC, West AP, Wetterstrand K,Wheeler R, Whelan S, Wierzbowski J, Willey D, Williams S, WilsonRK, Winter E, Worley KC, Wyman D, Yang S, Yang SP, Zdobnov EM,Zody MC, Lander ES: Initial sequencing and comparative anal-ysis of the mouse genome. Nature 2002, 420:520-562.
3. Okazaki Y, Furuno M, Kasukawa T, Adachi J, Bono H, Kondo S,Nikaido I, Osato N, Saito R, Suzuki H, Yamanaka I, Kiyosawa H, YagiK, Tomaru Y, Hasegawa Y, Nogami A, Schonbach C, Gojobori T,Baldarelli R, Hill DP, Bult C, Hume DA, Quackenbush J, Schriml LM,Kanapin A, Matsuda H, Batalov S, Beisel KW, Blake JA, Bradt D, BrusicV, Chothia C, Corbani LE, Cousins S, Dalla E, Dragani TA, FletcherCF, Forrest A, Frazer KS, Gaasterland T, Gariboldi M, Gissi C, GodzikA, Gough J, Grimmond S, Gustincich S, Hirokawa N, Jackson IJ, JarvisED, Kanai A, Kawaji H, Kawasawa Y, Kedzierski RM, King BL, Kona-gaya A, Kurochkin IV, Lee Y, Lenhard B, Lyons PA, Maglott DR,Maltais L, Marchionni L, McKenzie L, Miki H, Nagashima T, Numata K,
Additional file 1Expression data for all the microarrays used in this study.Click here for file[http://www.biomedcentral.com/content/supplementary/1471-2369-7-1-S1.xls]
Additional file 2E18.5 kidney gene list. Sorted by E18.5C/E14.5C; 1,006 genes showed a more than 2 fold change.Click here for file[http://www.biomedcentral.com/content/supplementary/1471-2369-7-1-S2.xls]
Additional file 3E14.5 kidney gene list. Sorted by E14.5C/E18.5C; 796 genes showed a more than 2 fold change.Click here for file[http://www.biomedcentral.com/content/supplementary/1471-2369-7-1-S3.xls]
Additional file 4E18.5 nephron gene list. Sorted by E18.5C/E18.5M; 465 genes showed a more than 2fold change; top 1,000 genes.Click here for file[http://www.biomedcentral.com/content/supplementary/1471-2369-7-1-S4.xls]
Additional file 5E14.5 nephron gene list. Sorted by E14.5C/E14.5M; 41 genes showed a more than 2 fold change; top 1,000 genes.Click here for file[http://www.biomedcentral.com/content/supplementary/1471-2369-7-1-S5.xls]
Page 10 of 13(page number not for citation purposes)

BMC Nephrology 2006, 7:1 http://www.biomedcentral.com/1471-2369/7/1
Okido T, Pavan WJ, Pertea G, Pesole G, Petrovsky N, Pillai R, PontiusJU, Qi D, Ramachandran S, Ravasi T, Reed JC, Reed DJ, Reid J, RingBZ, Ringwald M, Sandelin A, Schneider C, Semple CA, Setou M, Shi-mada K, Sultana R, Takenaka Y, Taylor MS, Teasdale RD, Tomita M,Verardo R, Wagner L, Wahlestedt C, Wang Y, Watanabe Y, Wells C,Wilming LG, Wynshaw-Boris A, Yanagisawa M, Yang I, Yang L, YuanZ, Zavolan M, Zhu Y, Zimmer A, Carninci P, Hayatsu N, Hirozane-Kishikawa T, Konno H, Nakamura M, Sakazume N, Sato K, Shiraki T,Waki K, Kawai J, Aizawa K, Arakawa T, Fukuda S, Hara A, HashizumeW, Imotani K, Ishii Y, Itoh M, Kagawa I, Miyazaki A, Sakai K, Sasaki D,Shibata K, Shinagawa A, Yasunishi A, Yoshino M, Waterston R, LanderES, Rogers J, Birney E, Hayashizaki Y: Analysis of the mouse tran-scriptome based on functional annotation of 60,770 full-length cDNAs. Nature 2002, 420:563-573.
4. Kawai J, Shinagawa A, Shibata K, Yoshino M, Itoh M, Ishii Y, ArakawaT, Hara A, Fukunishi Y, Konno H, Adachi J, Fukuda S, Aizawa K, IzawaM, Nishi K, Kiyosawa H, Kondo S, Yamanaka I, Saito T, Okazaki Y,Gojobori T, Bono H, Kasukawa T, Saito R, Kadota K, Matsuda H, Ash-burner M, Batalov S, Casavant T, Fleischmann W, Gaasterland T, GissiC, King B, Kochiwa H, Kuehl P, Lewis S, Matsuo Y, Nikaido I, PesoleG, Quackenbush J, Schriml LM, Staubli F, Suzuki R, Tomita M, WagnerL, Washio T, Sakai K, Okido T, Furuno M, Aono H, Baldarelli R, BarshG, Blake J, Boffelli D, Bojunga N, Carninci P, de Bonaldo MF, Brown-stein MJ, Bult C, Fletcher C, Fujita M, Gariboldi M, Gustincich S, HillD, Hofmann M, Hume DA, Kamiya M, Lee NH, Lyons P, MarchionniL, Mashima J, Mazzarelli J, Mombaerts P, Nordone P, Ring B, RingwaldM, Rodriguez I, Sakamoto N, Sasaki H, Sato K, Schonbach C, Seya T,Shibata Y, Storch KF, Suzuki H, Toyo-oka K, Wang KH, Weitz C,Whittaker C, Wilming L, Wynshaw-Boris A, Yoshida K, Hasegawa Y,Kawaji H, Kohtsuki S, Hayashizaki Y: Functional annotation of afull-length mouse cDNA collection. Nature 2001, 409:685-690.
5. Schwab K, Patterson LT, Aronow BJ, Luckas R, Liang HC, Potter SS:A catalogue of gene expression in the developing kidney. Kid-ney Int 2003, 64:1588-1604.
6. Yoshida T, Muller E, Stears R, Shirota S, Tsuchiya K, Akiba T, GullansSR: Osmoadaptation-related genes in inner medulla ofmouse kidney using microarray. Biochem Biophys Res Commun2004, 322:250-257.
7. Stuart RO, Bush KT, Nigam SK: Changes in gene expression pat-terns in the ureteric bud and metanephric mesenchyme inmodels of kidney development. Kidney Int 2003, 64:1997-2008.
8. Valerius MT, Patterson LT, Witte DP, Potter SS: Microarray analy-sis of novel cell lines representing two stages of metanephricmesenchyme differentiation. Mech Dev 2002, 110:151-164.
9. Supavekin S, Zhang W, Kucherlapati R, Kaskel FJ, Moore LC, Devar-ajan P: Differential gene expression following early renalischemia/reperfusion. Kidney Int 2003, 63:1714-1724.
10. Gumz ML, Popp MP, Wingo CS, Cain BD: Early transcriptionaleffects of aldosterone in a mouse inner medullary collectingduct cell line. Am J Physiol Renal Physiol 2003, 285:F664-673.
11. Kieran NE, Doran PP, Connolly SB, Greenan MC, Higgins DF, Leon-ard M, Godson C, Taylor CT, Henger A, Kretzler M, Burne MJ, RabbH, Brady HR: Modification of the transcriptomic response torenal ischemia/reperfusion injury by lipoxin analog. Kidney Int2003, 64:480-492.
12. Susztak K, Bottinger E, Novetsky A, Liang D, Zhu Y, Ciccone E, WuD, Dunn S, McCue P, Sharma K: Molecular profiling of diabeticmouse kidney reveals novel genes linked to glomerular dis-ease. Diabetes 2004, 53:784-794.
13. Kim JH, Ha IS, Hwang CI, Lee YJ, Kim J, Yang SH, Kim YS, Cao YA,Choi S, Park WY: Gene expression profiling of anti-GBMglomerulonephritis model: the role of NF-kappaB inimmune complex kidney disease. Kidney Int 2004, 66:1826-1837.
14. Takasato M, Osafune K, Matsumoto Y, Kataoka Y, Yoshida N, MeguroH, Aburatani H, Asashima M, Nishinakamura R: Identification ofkidney mesenchymal genes by a combination of microarrayanalysis and Sall1-GFP knockin mice. Mech Dev 2004,121:547-557.
15. Norman LP, Jiang W, Han X, Saunders TL, Bond JS: Targeted dis-ruption of the meprin beta gene in mice leads to underrep-resentation of knockout mice and changes in renal geneexpression profiles. Mol Cell Biol 2003, 23:1221-1230.
16. Li X, Zheng W, Li YC: Altered gene expression profile in thekidney of vitamin D receptor knockout mice. J Cell Biochem2003, 89:709-719.
17. McReynolds MR, Taylor-Garcia KM, Greer KA, Hoying JB, BrooksHL: Renal medullary gene expression in aquaporin-1 nullmice. Am J Physiol Renal Physiol 2005, 288:F315-321.
18. Miura N, Koizumi S: Gene expression profiles in the liver andkidney of metallothionein-null mice. Biochem Biophys Res Com-mun 2005, 332:949-955.
19. Karavanov AA, Karavanova I, Perantoni A, Dawid IB: Expressionpattern of the rat Lim-1 homeobox gene suggests a dual roleduring kidney development. Int J Dev Biol 1998, 42:61-66.
20. Kobayashi A, Kwan KM, Carroll TJ, McMahon AP, Mendelsohn CL,Behringer RR: Distinct and sequential tissue-specific activitiesof the LIM-class homeobox gene Lim1 for tubular morpho-genesis during kidney development. Development 2005,132:2809-2823.
21. Shawlot W, Behringer RR: Requirement for Lim1 in head-organizer function. Nature 1995, 374:425-430.
22. Kwan KM, Behringer RR: Conditional inactivation of Lim1 func-tion. Genesis 2002, 32:118-120.
23. Kaufman MH, Bard JBL: The anatomical basis of mouse development SanDiego, California, U.S.A.: Academic Press; 1999.
24. Wang P, Pereira FA, Beasley D, Zheng H: Presenilins are requiredfor the formation of comma- and S-shaped bodies duringnephrogenesis. Development 2003, 130:5019-5029.
25. Kania A, Johnson RL, Jessell TM: Coordinate roles for LIM home-obox genes in directing the dorsoventral trajectory of motoraxons in the vertebrate limb. Cell 2000, 102:161-173.
26. Li C, Wong WH: Model-based analysis of oligonucleotidearrays: expression index computation and outlier detection.Proc Natl Acad Sci U S A 2001, 98:31-36.
27. Schadt EE, Li C, Ellis B, Wong WH: Feature extraction and nor-malization algorithms for high-density oligonucleotide geneexpression array data. J Cell Biochem Suppl 2001:120-125.
28. Brazma A, Hingamp P, Quackenbush J, Sherlock G, Spellman P,Stoeckert C, Aach J, Ansorge W, Ball CA, Causton HC, GaasterlandT, Glenisson P, Holstege FC, Kim IF, Markowitz V, Matese JC, Parkin-son H, Robinson A, Sarkans U, Schulze-Kremer S, Stewart J, Taylor R,Vilo J, Vingron M: Minimum information about a microarrayexperiment (MIAME)-toward standards for microarraydata. Nat Genet 2001, 29:365-371.
29. UCSC Mouse Gene Sorter [http://genome.ucsc.edu/cgi-bin/hgNear]
30. Su AI, Wiltshire T, Batalov S, Lapp H, Ching KA, Block D, Zhang J,Soden R, Hayakawa M, Kreiman G, Cooke MP, Walker JR, HogeneschJB: A gene atlas of the mouse and human protein-encodingtranscriptomes. Proc Natl Acad Sci U S A 2004, 101:6062-6067.
31. Wheeler DL, Barrett T, Benson DA, Bryant SH, Canese K, ChurchDM, DiCuccio M, Edgar R, Federhen S, Helmberg W, Kenton DL,Khovayko O, Lipman DJ, Madden TL, Maglott DR, Ostell J, Pontius JU,Pruitt KD, Schuler GD, Schriml LM, Sequeira E, Sherry ST, Sirotkin K,Starchenko G, Suzek TO, Tatusov R, Tatusova TA, Wagner L,Yaschenko E: Database resources of the National Center forBiotechnology Information. Nucleic Acids Res 2005, 33:D39-45.
32. SOURCE [http://source.stanford.edu]33. Diehn M, Sherlock G, Binkley G, Jin H, Matese JC, Hernandez-Bous-
sard T, Rees CA, Cherry JM, Botstein D, Brown PO, Alizadeh AA:SOURCE: a unified genomic resource of functional annota-tions, ontologies, and gene expression data. Nucleic Acids Res2003, 31:219-223.
34. Database for Annotation, Visualization and Integrated Dis-covery [http://apps1.niaid.nih.gov/DAVID]
35. Ashburner M, Ball CA, Blake JA, Botstein D, Butler H, Cherry JM,Davis AP, Dolinski K, Dwight SS, Eppig JT, Harris MA, Hill DP, Issel-Tarver L, Kasarskis A, Lewis S, Matese JC, Richardson JE, Ringwald M,Rubin GM, Sherlock G: Gene ontology: tool for the unificationof biology. The Gene Ontology Consortium. Nat Genet 2000,25:25-29.
36. Dennis G Jr, Sherman BT, Hosack DA, Yang J, Gao W, Lane HC, Lem-picki RA: DAVID: Database for Annotation, Visualization, andIntegrated Discovery. Genome Biol 2003, 4:P3.
37. Hosack DA, Dennis G Jr, Sherman BT, Lane HC, Lempicki RA: Iden-tifying biological themes within lists of genes with EASE.Genome Biol 2003, 4:R70.
38. Bradley A, Evans M, Kaufman MH, Robertson E: Formation ofgerm-line chimaeras from embryo-derived teratocarcinomacell lines. Nature 1984, 309:255-256.
Page 11 of 13(page number not for citation purposes)
BMC Nephrology 2006, 7:1 http://www.biomedcentral.com/1471-2369/7/1
39. Miner JH: Focusing on the glomerular slit diaphragm: podocinenters the picture. Am J Pathol 2002, 160:3-5.
40. Piscione TD, Wu MY, Quaggin SE: Expression of Hairy/Enhancerof Split genes, Hes1 and Hes5, during murine nephron mor-phogenesis. Gene Expr Patterns 2004, 4:707-711.
41. McCright B: Notch signaling in kidney development. Curr OpinNephrol Hypertens 2003, 12:5-10.
42. McCright B, Lozier J, Gridley T: A mouse model of Alagille syn-drome: Notch2 as a genetic modifier of Jag1 haploinsuffi-ciency. Development 2002, 129:1075-1082.
43. McCright B, Gao X, Shen L, Lozier J, Lan Y, Maguire M, Herzlinger D,Weinmaster G, Jiang R, Gridley T: Defects in development of thekidney, heart and eye vasculature in mice homozygous for ahypomorphic Notch2 mutation. Development 2001,128:491-502.
44. Li L, Krantz ID, Deng Y, Genin A, Banta AB, Collins CC, Qi M, TraskBJ, Kuo WL, Cochran J, Costa T, Pierpont ME, Rand EB, Piccoli DA,Hood L, Spinner NB: Alagille syndrome is caused by mutationsin human Jagged1, which encodes a ligand for Notch1. NatGenet 1997, 16:243-251.
45. Okano H, Imai T, Okabe M: Musashi: a translational regulator ofcell fate. J Cell Sci 2002, 115:1355-1359.
46. Saxen L: Organogenesis of the Kidney Cambridge: Press Syndicate of theUniversity of Cambridge; 1987.
47. Stuart RO, Bush KT, Nigam SK: Changes in global gene expres-sion patterns during development and maturation of the ratkidney. Proc Natl Acad Sci U S A 2001, 98:5649-5654.
48. Stark MR, Rao MS, Schoenwolf GC, Yang G, Smith D, Mauch TJ: Friz-zled-4 expression during chick kidney development. MechDev 2000, 98:121-125.
49. Houweling AC, Dildrop R, Peters T, Mummenhoff J, Moorman AF,Ruther U, Christoffels VM: Gene and cluster-specific expressionof the Iroquois family members during mouse development.Mech Dev 2001, 107:169-174.
50. Lemmers C, Michel D, Lane-Guermonprez L, Delgrossi MH, MedinaE, Arsanto JP, Le Bivic A: CRB3 binds directly to Par6 and regu-lates the morphogenesis of the tight junctions in mammalianepithelial cells. Mol Biol Cell 2004, 15:1324-1333.
51. Makarova O, Roh MH, Liu CJ, Laurinec S, Margolis B: MammalianCrumbs3 is a small transmembrane protein linked to pro-tein associated with Lin-7 (Pals1). Gene 2003, 302:21-29.
52. White KP, Rifkin SA, Hurban P, Hogness DS: Microarray analysisof Drosophila development during metamorphosis. Science1999, 286:2179-2184.
53. Mikulowska-Mennis A, Taylor TB, Vishnu P, Michie SA, Raja R,Horner N, Kunitake ST: High-quality RNA from cells isolated bylaser capture microdissection. Biotechniques 2002, 33:176-179.
54. Zhu X, Cheng J, Gao J, Lepor H, Zhang ZT, Pak J, Wu XR: Isolationof mouse THP gene promoter and demonstration of its kid-ney-specific activity in transgenic mice. Am J Physiol Renal Physiol2002, 282:F608-617.
55. Li H, Christakos S: Differential regulation by 1,25-dihydroxyvi-tamin D3 of calbindin-D9k and calbindin-D28k gene expres-sion in mouse kidney. Endocrinology 1991, 128:2844-2852.
56. Rabahi F, Brule S, Sirois J, Beckers JF, Silversides DW, Lussier JG:High expression of bovine alpha glutathione S-transferase(GSTA1, GSTA2) subunits is mainly associated with ster-oidogenically active cells and regulated by gonadotropins inbovine ovarian follicles. Endocrinology 1999, 140:3507-3517.
57. Moeller MJ, Sanden SK, Soofi A, Wiggins RC, Holzman LB: Two genefragments that direct podocyte-specific expression in trans-genic mice. J Am Soc Nephrol 2002, 13:1561-1567.
58. Jones DH, Golding MC, Barr KJ, Fong GH, Kidder GM: The mouseNa+-K+-ATPase gamma-subunit gene (Fxyd2) encodesthree developmentally regulated transcripts. Physiol Genomics2001, 6:129-135.
59. Kato Y, Arakawa E, Kinoshita S, Shirai A, Furuya A, Yamano K, Naka-mura K, Iida A, Anazawa H, Koh N, Iwano A, Imura A, Fujimori T,Kuro-o M, Hanai N, Takeshige K, Nabeshima Y: Establishment ofthe anti-Klotho monoclonal antibodies and detection ofKlotho protein in kidneys. Biochem Biophys Res Commun 2000,267:597-602.
60. Meseguer A, Catterall JF: Mouse kidney androgen-regulatedprotein messenger ribonucleic acid is expressed in the prox-imal convoluted tubules. Mol Endocrinol 1987, 1:535-541.
61. Stein S, Liehr T, Eschrich K: Characterization of the mouse liverfructose-1,6-bisphosphatase gene. Gene 2001, 264:215-224.
62. Darbouy M, Chobert MN, Lahuna O, Okamoto T, Bonvalet JP, Far-man N, Laperche Y: Tissue-specific expression of multiplegamma-glutamyl transpeptidase mRNAs in rat epithelia. AmJ Physiol 1991, 261:C1130-1137.
63. Lee A, Beck L, Markovich D: The mouse sulfate anion trans-porter gene Sat1 (Slc26a1): cloning, tissue distribution, genestructure, functional characterization, and transcriptionalregulation thyroid hormone. DNA Cell Biol 2003, 22:19-31.
64. Oleinikov AV, Makker SP: Increased expression of cytoplasmictail-containing form of gp600/megalin in active Heymannnephritis. J Pathol 2000, 192:251-256.
65. Vallet V, Bens M, Antoine B, Levrat F, Miquerol L, Kahn A, VandewalleA: Transcription factors and aldolase B gene expression inmicrodissected renal proximal tubules and derived cell lines.Exp Cell Res 1995, 216:363-370.
66. Christensen EI, Verroust PJ: Megalin and cubilin, role in proxi-mal tubule function and during development. Pediatr Nephrol2002, 17:993-999.
67. Igarashi P, Vanden Heuvel GB, Payne JA, Forbush B 3rd: Cloning,embryonic expression, and alternative splicing of a murinekidney-specific Na-K-Cl cotransporter. Am J Physiol 1995,269:F405-418.
68. Lichter-Konecki U, Hipke CM, Konecki DS: Human phenylalaninehydroxylase gene expression in kidney and other nonhepatictissues. Mol Genet Metab 1999, 67:308-316.
69. Delgado-Reyes CV, Wallig MA, Garrow TA: Immunohistochemi-cal detection of betaine-homocysteine S-methyltransferasein human, pig, and rat liver and kidney. Arch Biochem Biophys2001, 393:184-186.
70. Zhang MY, Wang X, Wang JT, Compagnone NA, Mellon SH, OlsonJL, Tenenhouse HS, Miller WL, Portale AA: Dietary phosphorustranscriptionally regulates 25-hydroxyvitamin D-1alpha-hydroxylase gene expression in the proximal renal tubule.Endocrinology 2002, 143:587-595.
71. Enck AH, Berger UV, Yu AS: Claudin-2 is selectively expressedin proximal nephron in mouse kidney. Am J Physiol Renal Physiol2001, 281:F966-974.
72. Schnapp D, Reid CJ, Harris A: Localization of expression ofhuman beta defensin-1 in the pancreas and kidney. J Pathol1998, 186:99-103.
73. Mori K, Ogawa Y, Tamura N, Ebihara K, Aoki T, Muro S, Ozaki S,Tanaka I, Tashiro K, Nakao K: Molecular cloning of a novelmouse aspartic protease-like protein that is expressed abun-dantly in the kidney. FEBS Lett 1997, 401:218-222.
74. Taraviras S, Monaghan AP, Schutz G, Kelsey G: Characterization ofthe mouse HNF-4 gene and its expression during mouseembryogenesis. Mech Dev 1994, 48:67-79.
75. Capuano P, Bacic D, Stange G, Hernando N, Kaissling B, Pal R, KocherO, Biber J, Wagner CA, Murer H: Expression and regulation ofthe renal Na/phosphate cotransporter NaPi-IIa in a mousemodel deficient for the PDZ protein PDZK1. Pflugers Arch2005, 449:392-402.
76. Petraki CD, Karavana VN, Skoufogiannis PT, Little SP, Howarth DJ,Yousef GM, Diamandis EP: The spectrum of human kallikrein 6(zyme/protease M/neurosin) expression in human tissues asassessed by immunohistochemistry. J Histochem Cytochem 2001,49:1431-1441.
77. Yang XF, Milhiet PE, Gaudoux F, Crine P, Boileau G: Completesequence of rabbit kidney aminopeptidase N and mRNAlocalization in rabbit kidney by in situ hybridization. BiochemCell Biol 1993, 71:278-287.
78. Wakui H, Komatsuda A, Itoh H, Kobayashi R, Nakamoto Y, Miura AB:Renal argininosuccinate synthetase: purification, immuno-histochemical localization, and elastin-binding property. RenPhysiol Biochem 1992, 15:1-9.
79. Yanagita M, Oka M, Watabe T, Iguchi H, Niida A, Takahashi S, Aki-yama T, Miyazono K, Yanagisawa M, Sakurai T: USAG-1: a bonemorphogenetic protein antagonist abundantly expressed inthe kidney. Biochem Biophys Res Commun 2004, 316:490-500.
80. Dinjens WN, ten Kate J, Wijnen JT, van der Linden EP, Beek CJ, Lend-ers MH, Khan PM, Bosman FT: Distribution of adenosine deam-inase-complexing protein in murine tissues. J Biol Chem 1989,264:19215-19220.
Page 12 of 13(page number not for citation purposes)

BMC Nephrology 2006, 7:1 http://www.biomedcentral.com/1471-2369/7/1
Publish with BioMed Central and every scientist can read your work free of charge
"BioMed Central will be the most significant development for disseminating the results of biomedical research in our lifetime."
Sir Paul Nurse, Cancer Research UK
Your research papers will be:
available free of charge to the entire biomedical community
peer reviewed and published immediately upon acceptance
cited in PubMed and archived on PubMed Central
yours — you keep the copyright
Submit your manuscript here:http://www.biomedcentral.com/info/publishing_adv.asp
BioMedcentral
81. Fan CM, Kuwana E, Bulfone A, Fletcher CF, Copeland NG, JenkinsNA, Crews S, Martinez S, Puelles L, Rubenstein JL, Tessier-Lavigne M:Expression patterns of two murine homologs of Drosophilasingle-minded suggest possible roles in embryonic pattern-ing and in the pathogenesis of Down syndrome. Mol Cell Neu-rosci 1996, 7:1-16.
82. Leimeister C, Schumacher N, Gessler M: Expression of Notchpathway genes in the embryonic mouse metanephros sug-gests a role in proximal tubule development. Gene Expr Pat-terns 2003, 3:595-598.
Pre-publication historyThe pre-publication history for this paper can be accessedhere:
http://www.biomedcentral.com/1471-2369/7/1/prepub
Page 13 of 13(page number not for citation purposes)