heatto power - smart energy systems
TRANSCRIPT

HEAT TO POWER– techno-economic assessment of
heat-to-power use in district heating
networks
Jay Hennessy
RISE Research Institutes of Sweden
Built EnvironmentEnergy and circular economy
in collaboration with
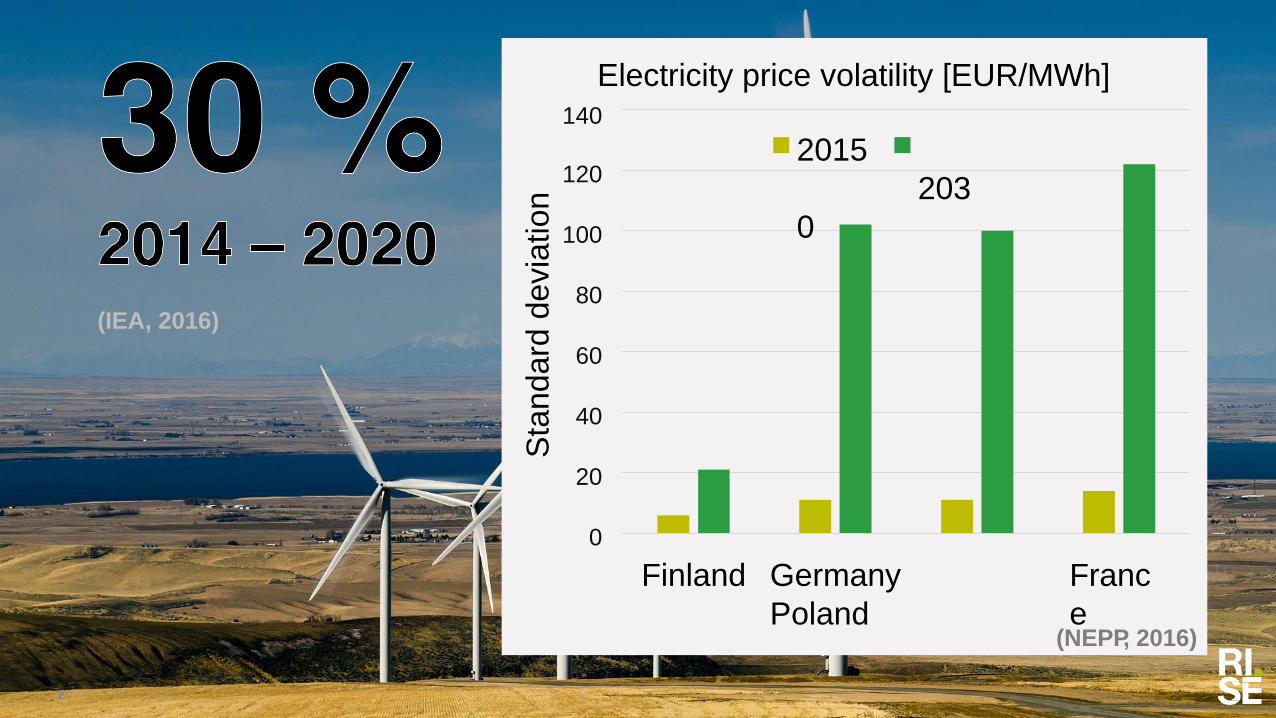
(IEA, 2016)
0
20
40
60
80
100
120
Electricity price volatility [EUR/MWh]
140
Finland Germany
Poland
Franc
e
Sta
ndard
devia
tion
2015
203
0
(NEPP, 2016)
2

§Thermal grids vision
§Heat to power
§Levelised cost of
electricity (LCOE) from
thermal grid heat
Coming up…

Thermal grids futureThermal grid
Residentialbuildings
Commercialbuildings
Renewablesources
HeatPump
Industrial waste heat
New demand
Electricity grid
Futureinteractions
Gas grid
Prosumers
4

Temperatures °C
40
60
80
100
120
140
20
2nd gen: High temp.
3rd gen: Medium temp.
4th (next)gen: Low temp.
5
(Lund et al., 2014; Østergaard and Svendsen, 2017)
(Dansk Fjernvarme, 2016; Frederiksen and Werner, 2013)
– Max. peak Europe: 120 °C
Annual average…
– Sweden 86 °C
– Denmark 74 °C…80 °C

▪ Thermodynamic power cycles
▪ Organic Rankine cycle (ORC)
▪ Kalina cycle
▪ Goswami cycle
▪ Commercial ORC-like cycles
▪ Direct processes
▪ Thermoelectric
▪ Piezoelectric
▪ Thermionic
▪ Thermo-photovoltaic
6
▪ Appropriate operating
temperature and power
demand
▪ Competitive cost
▪ Efficiency
▪ Commercially available
▪ Selected: ORC and
commercial cycles
Technology selection

Organic Rankine cycleHeat source
Hot circuit
TH1
EOUT
7
TH2
Heat sink
Cold circuit
TC1 TC2

Levelised Cost of Electricity (LCOE)
8
LCOE LFC LVC TIC r
Q
M
1 (1 r)T
Q
• Heat source temperatures: 80 °C and 120 °C
• Heat sink temperature 20 °C
• Shutdown time: 48 hours, 1 month, 3 months
• Heat has zero cost
• Pump electricity not included
• Data from 3 heat to power vendors
(Blumsack, 2014)
LFC = Levelised Fixed Cost
LVC = Levelised Variable Cost
TIC = Total Installed Cost
r = discount rate (6 %)
T = technology lifetime (years)
Q = annual energy outputM = operational costs
the net present value of the unit-cost of electricity over the lifetime of a generating
asset

Calculated LCOE
10 100
Levelized cost of electricity, LCOE (€/MWh)
1000
Vendor 1
Vendor 3
Vendor 2
Vendor 1
Vendor 2
Vendor 3
Vendor 2
Vendor 1
Vendor 3
48
Hours
1 m
onth
3 m
onth
s
Annualshutd
ow
ntim
e
80 °C
120 °C
9

10
69 € /MWh in context…
54 € /MWh UK
annual average (peak 75 € )
121 € /MWh New York
annual average
63 € /MWh UK offshore wind

0 1 2 3
Installation cost [%]
Annual usage [%]
Discount rate [% (top)]
Pump power [kW (top)]
Baseline 80/15 °C
11
4 5 6 7 8 9
kW / %
10
-40%
-20%
0%
20%
40%
60%
80%
100%
120%
0% 10% 20% 30% 40% 50% 60% 70% 80% 90% 100%
LC
OE[€
/MW
h]
LCOE Sensitivity Analysis 80/15 °C

Conclusions
12
Levelized cost of electricity
▪ Most sensitive to:
▪ Installation cost
▪ Heat availability / annual
operation time
▪ Cold sink source important
Upcoming analysis
▪ LCOE sensitivity to hot / cold
temperature
▪ Test case with district heating
network data
▪ Include levelized cost of heat
▪ Scenarios economically &
technically feasible

THANKS!
Jay Hennessy
+46 73 810 6005
RISE Research Institutes of Sweden
Built EnvironmentEnergy and circular economy
in collaboration with

▪ Blumsack, S. (2014) Project Decision Metrics: Levelized Cost of Energy (LCOE). Available at: https://www.e-education.psu.edu/eme801/node/560 (Accessed: 24
May 2017).
▪ Dansk Fjernvarme (2016) Statistics 2015-2016. Available at: http://www.danskfjernvarme.dk/viden-om/aarsstatistik/statistik-2015-2016 (Accessed: 13 April 2017).
▪ European Commission (2017) Energy balance flow for European Union (28 countries) 2014. Available at: http://ec.europa.eu/eurostat/cache/sankey/sankey.html
(Accessed: 8 August 2017).
▪ Frederiksen, S. and Werner, S. (2013) District Heating and Cooling. Studentlitteratur AB. Available at: https://books.google.se/books?id=vH5zngEACAAJ.
▪ IEA [International Energy Agency] (2014a) World Balance 2014. Available at: https://www.iea.org/Sankey/#?c=World&s=Balance (Accessed: 17 November 2016).
▪ IEA [International Energy Agency] (2014b) Linking Heat and Electricity Systems. Available at:
https://www.iea.org/publications/freepublications/publication/LinkingHeatandElectricitySystems.pdf.
▪ IEA [International Energy Agency] (2016) Energy Technology Perspectives 2016. doi: 10.1787/energy_tech-2016-en.
▪ Lund, H., Werner, S., Wiltshire, R., Svendsen, S., Thorsen, J. E., Hvelplund, F. and Mathiesen, B. V. (2014) ‘4th Generation District Heating (4GDH): Integrating
smart thermal grids into future sustainable energy systems’, Energy. Elsevier Ltd, 68, pp. 1–11. doi: 10.1016/j.energy.2014.02.089.
▪ Nord Pool (2017) N2EX Day Ahead Auction Prices. Available at: http://www.nordpoolspot.com/Market-data1/N2EX/Auction-prices/UK/monthly/?view=chart
(Accessed: 31 May 2017).
▪ NEPP - North European Power Perspectives (2016) Reglering av kraftsystemet med ett stort inslag av variabel produktion. Available at:
http://nepp.se/pdf/reglering.pdf.
▪ US Energy Information Administration (2017) Electricity data browser - Average retail price of electricity. Available at: https://www.eia.gov/electricity/data/browser
(Accessed: 31 May 2017).
▪ Østergaard, D. and Svendsen, S. (2017) ‘Space heating with ultra-low-temperature district heating – a case study of four single-family houses from the 1980s’,
Energy Procedia. Elsevier B.V., 116, pp. 226–235. doi: 10.1016/j.egypro.2017.05.070.
14
References