heat pumps potential for energy savings in new york state · nyserda record of revision . heat...
TRANSCRIPT
New York State Energy Research and Development Authority
Heat Pumps Potential for Energy Savings in New York State
Final Report July 2014
Revised March 2015
Report Number 14-39

NYSERDA’s Promise to New Yorkers: NYSERDA provides resources, expertise, and objective information so New Yorkers can make confident, informed energy decisions.
Mission Statement:Advance innovative energy solutions in ways that improve New York’s economy and environment.
Vision Statement:Serve as a catalyst – advancing energy innovation, technology, and investment; transforming New York’s economy; and empowering people to choose clean and efficient energy as part of their everyday lives.
Core Values:Objectivity, integrity, public service, partnership, and innovation.
PortfoliosNYSERDA programs are organized into five portfolios, each representing a complementary group of offerings with common areas of energy-related focus and objectives.
Energy Efficiency and Renewable Energy Deployment
Helping New York State to achieve its aggressive energy efficiency and renewable energy goals – including programs to motivate increased efficiency in energy consumption by consumers (residential, commercial, municipal, institutional, industrial, and transportation), to increase production by renewable power suppliers, to support market transformation, and to provide financing.
Energy Technology Innovation and Business Development
Helping to stimulate a vibrant innovation ecosystem and a clean energy economy in New York State – including programs to support product research, development, and demonstrations; clean energy business development; and the knowledge-based community at the Saratoga Technology + Energy Park® (STEP®).
Energy Education and Workforce Development
Helping to build a generation of New Yorkers ready to lead and work in a clean energy economy – including consumer behavior, youth education, workforce development, and training programs for existing and emerging technologies.
Energy and the Environment
Helping to assess and mitigate the environmental impacts of energy production and use in New York State – including environmental research and development, regional initiatives to improve environmental sustainability, and West Valley Site Management.
Energy Data, Planning, and Policy
Helping to ensure that New York State policymakers and consumers have objective and reliable information to make informed energy decisions – including State Energy Planning, policy analysis to support the Regional Greenhouse Gas Initiative and other energy initiatives, emergency preparedness, and a range of energy data reporting.

NYSERDA Record of Revision
Heat Pumps Potential for Energy Savings in New York State
July 2014
Revision Date Description of Changes Revision on Page(s)
July 2014 Original Issue Original Issue
January 2015 Provided additional definitions and detail on analytic approach. 1
January 2015 Provided additional detail on cost effectiveness methodology used in assessing the various heat pump technologies.
8
January 2015 Clarified criteria for selecting technologies for analysis. 17
January 2015 Added additional information clarifying the applicability of ground-source heat pumps in New York State.
21
January 2015 Edited desuperheater discussion to reflect additional citation. 29
January 2015 Edited text to better reflect use of ground-source heat pumps in large buildings.
29
January 2015 Edited market barriers to better reflect constraints on ground-source heat pumps.
30
March 2015 Revised measure characterizations for commercial ground-source heat pumps and VRF heat pumps.
All tables with commercial results and appendices
i

Heat Pumps Potential for Energy Savings in New York State
Final Report
Prepared for:
New York State Energy Research and Development Authority
Albany, NY
Christine Gifford Project Manager
Prepared by:
Optimal Energy Inc.
Hinesburg, VT
Steve Bower, Managing Consultant Project Manager
NYSERDA Report 14-39 NYSERDA Contract 41081 July 3, 2014 Revised March 2015

Notice This report was prepared by Optimal Energy, inc. in the course of performing work contracted for and sponsored by
the New York State Energy Research and Development Authority (hereafter “NYSERDA”). The opinions expressed
in this report do not necessarily reflect those of NYSERDA or the State of New York, and reference to any specific
product, service, process, or method does not constitute an implied or expressed recommendation or endorsement of
it. Further, NYSERDA, the State of New York, and the contractor make no warranties or representations, expressed
or implied, as to the fitness for particular purpose or merchantability of any product, apparatus, or service, or the
usefulness, completeness, or accuracy of any processes, methods, or other information contained, described,
disclosed, or referred to in this report. NYSERDA, the State of New York, and the contractor make no
representation that the use of any product, apparatus, process, method, or other information will not infringe
privately owned rights and will assume no liability for any loss, injury, or damage resulting from, or occurring
in connection with, the use of information contained, described, disclosed, or referred to in this report.
NYSERDA makes every effort to provide accurate information about copyright owners and related matters in the
reports we publish. Contractors are responsible for determining and satisfying copyright or other use restrictions
regarding the content of reports that they write, in compliance with NYSERDA’s policies and federal law. If you
are the copyright owner and believe a NYSERDA report has not properly attributed your work to you or has used
it without permission, please email [email protected].
iii
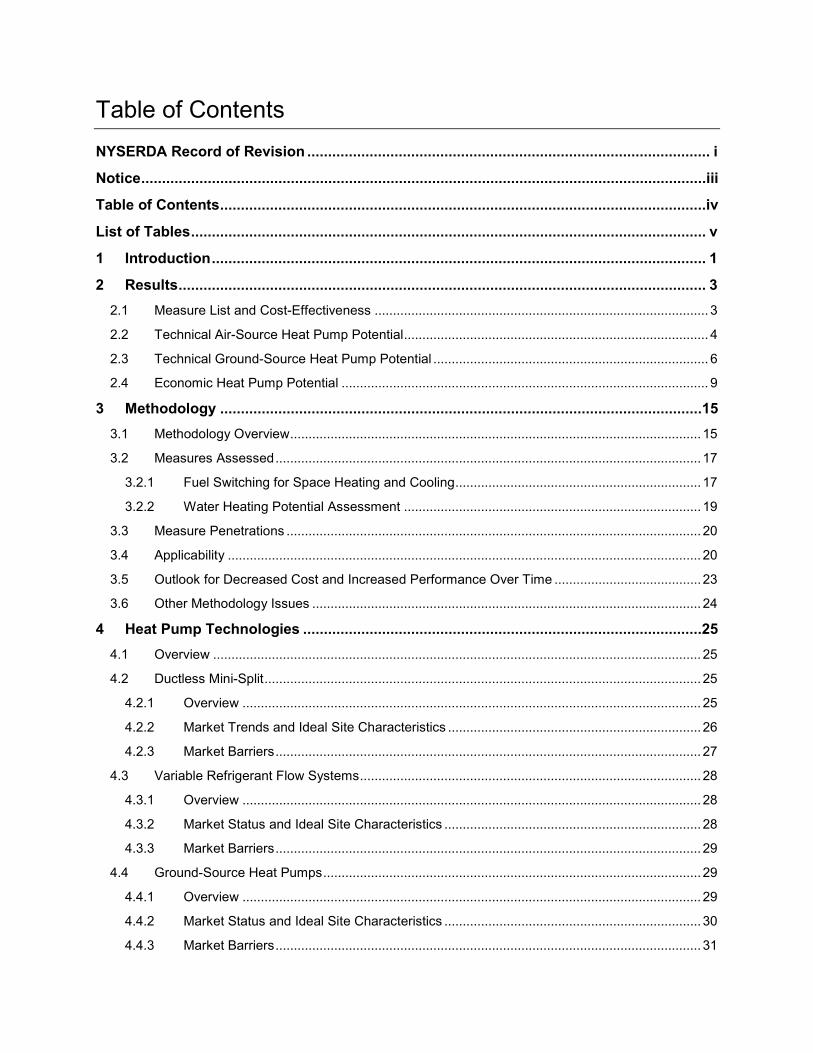
Table of Contents NYSERDA Record of Revision ................................................................................................. i
Notice ........................................................................................................................................iii
Table of Contents .....................................................................................................................iv
List of Tables ............................................................................................................................ v
1 Introduction ....................................................................................................................... 1
2 Results ............................................................................................................................... 3
2.1 Measure List and Cost-Effectiveness ........................................................................................... 3 2.2 Technical Air-Source Heat Pump Potential ................................................................................... 4 2.3 Technical Ground-Source Heat Pump Potential ........................................................................... 6 2.4 Economic Heat Pump Potential .................................................................................................... 9
3 Methodology ....................................................................................................................15
3.1 Methodology Overview ................................................................................................................ 15 3.2 Measures Assessed .................................................................................................................... 17
3.2.1 Fuel Switching for Space Heating and Cooling ................................................................... 17 3.2.2 Water Heating Potential Assessment ................................................................................. 19
3.3 Measure Penetrations ................................................................................................................. 20 3.4 Applicability ................................................................................................................................. 20 3.5 Outlook for Decreased Cost and Increased Performance Over Time ........................................ 23 3.6 Other Methodology Issues .......................................................................................................... 24
4 Heat Pump Technologies ................................................................................................25
4.1 Overview ..................................................................................................................................... 25 4.2 Ductless Mini-Split ....................................................................................................................... 25
4.2.1 Overview ............................................................................................................................. 25 4.2.2 Market Trends and Ideal Site Characteristics ..................................................................... 26 4.2.3 Market Barriers .................................................................................................................... 27
4.3 Variable Refrigerant Flow Systems ............................................................................................. 28 4.3.1 Overview ............................................................................................................................. 28 4.3.2 Market Status and Ideal Site Characteristics ...................................................................... 28 4.3.3 Market Barriers .................................................................................................................... 29
4.4 Ground-Source Heat Pumps ....................................................................................................... 29 4.4.1 Overview ............................................................................................................................. 29 4.4.2 Market Status and Ideal Site Characteristics ...................................................................... 30 4.4.3 Market Barriers .................................................................................................................... 31

5 Bibliography .....................................................................................................................32
Appendix A: Measure Screening, Year One ........................................................................ A-1
Appendix B: Measure Screening, Year One, BCR Comparison by Zone .......................... B-1
Appendix C: Measure Screening, BCRs for Selected Years .............................................. C-1
Appendix D: Measure Characterizations ............................................................................. D-1
List of Tables Table 1. Residential Space Heating/Cooling, Fuel Switching Measures ...................................................... 4 Table 2. Commercial Space Heating/Cooling, Fuel Switching Measures .................................................... 4 Table 3. Total Residential and Commercial Space Heating/Cooling, Fuel Switching Measures ................. 5 Table 4. Residential Space Heating/Cooling, Non-Fuel Switching Measures .............................................. 5 Table 5. Commercial Space Heating/Cooling, Non-Fuel Switching Measures ............................................. 5 Table 6. Total Residential and Commercial Space Heating/Cooling, Non-Fuel Switching Measures.......... 5 Table 7. Residential Space Heating/Cooling, Fuel Switching Measures ...................................................... 7 Table 8. Commercial Space Heating/Cooling, Fuel Switching Measures .................................................... 7 Table 9. Total Residential and Commercial Space Heating/Cooling, Fuel Switching Measures ................. 8 Table 10. Residential Space Heating/Cooling, Non-Fuel Switching Measures ............................................ 8 Table 11. Commercial Space Heating/Cooling, Non-Fuel Switching Measures ........................................... 8 Table 12. Total Residential and Commercial Space Heating/Cooling, Non-Fuel Switching Measures........ 8 Table 13. Residential Space Heating/Cooling, Fuel Switching Measures .................................................. 10 Table 14. Commercial Space Heating/Cooling, Fuel Switching Measures ................................................ 11 Table 15. Total Residential and Commercial Space Heating/Cooling, Fuel Switching Measures ............. 11 Table 16. Residential Space Heating/Cooling, Non-fuel Switching Measures ........................................... 11 Table 17. Commercial Space Heating/Cooling, Non-fuel Switching Measures .......................................... 12 Table 18. Total Residential and Commercial Space Heating/Cooling, Non-fuel Switching Measures ....... 12 Table 19. Residential Water Heating, Fuel Switching Measures ................................................................ 12 Table 20. Commercial Water Heating, Fuel Switching Measures .............................................................. 12 Table 21. Total Residential and Commercial Water Heating, Fuel Switching Measures ........................... 13 Table 22. Residential Water Heating, Non-fuel Switching Measures ......................................................... 13 Table 23. Commercial Water Heating, Non-fuel Switching Measures ........................................................ 13 Table 24.Total Residential and Commercial Water Heating, Non-Fuel Switching Measures .................... 13 Table 25. Economic Potential as a Percentage of Technical Air-Source Potential, Space Heating,
and Cooling Measures ................................................................................................................... 14 Table 26. Categories Measured for the Assessment .................................................................................. 17 Table 27. Residential Heat Pump Measures .............................................................................................. 18 Table 28. Commercial Heat Pump Measures ............................................................................................. 18 Table 29. Portion of Fossil Fuel Heating Energy with No Corresponding Cooling ..................................... 21 Table 30. Baseline Cooling Equipment Applicability Factors ...................................................................... 22 Table 31. Ground Source Heat Pump Applicability Factors ....................................................................... 23

1 Introduction Heat pumps are a category of space conditioning devices that can extract heat from a cold reservoir and move it to
a hot reservoir. As such, heat pumps are basically air conditioners that can run in reverse in the winter to provide
heating. Because heat pumps move heat as opposed to creating it, they can achieve a coefficient of performance
(COP)1 many times higher than 1.0, which is the theoretical maximum efficiency for typical combustion heat
sources and traditional electric resistance heat.
This report provides an assessment of the potential for energy savings from heat pumps in New York State.
Following this introduction, the report is comprised of the following sections:
• Results of the potential assessment. • Methodology used for the assessment. • Overview of selected heat pump technologies, their market status and ideal site characteristics for
installation, and barriers to market adoption.
The assessment is limited to the implementation of heat pumps for providing both space heating and cooling in
residential and commercial buildings. Three potential assessments were performed:
1. Technical potential for air source heat pumps. 2. Technical potential for ground source heat pumps. 3. Economic potential for air source and ground source heat pumps combined.
For this analysis, economic includes any heat pump project where the average benefits on a system level exceed the
total costs of the project. For this type of analysis, the benefits are defined as the avoided costs of energy, which are
distinct from the retail rates. Further, the analysis looks at both lost opportunity and retrofit projects. For lost
opportunity projects, the baseline is defined as a system that complies with current energy code, which may be much
more efficient than a typical existing system. For retrofit, the baseline is assumed to be the existing equipment for
the remainder of its useful life, at which point a code compliant model is to be otherwise installed and savings go
down. This method of analysis is significantly different than what is often done by a customer on site, who will
calculate simple payback based on the performance of the existing equipment.
As a result, we are comparing the potential savings from a heat pump with the likely code compliant alternative,
rather than quantifying the full savings customers would experience. Finally, the economic potential includes the
most cost-effective measure, which is not necessarily the measure with the greatest savings. For example, even
though a ground source heat pump will typically have higher savings than an air source heat pump, net benefits may
be lower, if the cost premium is high enough. In this case, it is assumed that the air source heat pump will be
installed.
1 The coefficient of performance (COP) is the ratio of the heating or cooling energy pumped between reservoirs to the energy consumed.
1

Note that this assessment builds on work reported in the Energy Efficiency and Renewable Energy Potential Study
of New York State (the EERE Potential Study), which was published in April 2014, is available on NYSERDA’s
website,2 and referred to throughout this report. This assessment supplements the EERE Potential Study in several
key ways:
• The EERE Potential Study did not include fuel switching, which provides the largest opportunities for energy savings from heat pumps. This assessment includes the fuel switching potential.
• The EERE Potential Study applied aggregated efficiency measures and thus did not provide heat pump-specific results.
• The EERE Potential Study included a separate “module” on heat pumps, but that only provided very high-level assessments of the technical potential for each of several heat pump technologies. This detailed assessment includes the integrated economic potential for heat pumps.
The Methodology section provides more information on the assumptions and approach used to carry out the
assessment.
2 https://www.nyserda.ny.gov/Energy-Data-and-Prices-Planning-and-Policy/Energy-Prices-Data-and-Reports/EA-Reports-and-Studies/EERE-Potential-Studies.aspx
2

2 Results
2.1 Measure List and Cost-Effectiveness
The list of heat pump (HP) measures and their cost-effectiveness are provided in the appendices. The total resource
costs and benefits shown in Appendix A represent the discounted costs and benefits over the life of the HP measure.
A measure with positive net benefits (benefits minus costs) is considered to be cost-effective. Some measures
have negative costs, which reflect that the HP equipment costs less than the corresponding heating and cooling
equipment. Many measures have negative benefits because the cost of increased electricity for heating is considered
to be a negative benefit. Negative costs or benefits generally result in negative benefit-cost ratios (BCRs), which can
be confusing. Cost-effectiveness is therefore indicated by gray shading, which indicates negative net-benefits.
As shown in Appendices A and B, cost-effectiveness of the fuel switching measures differs considerably between
zones. Cost-effectiveness is heavily dominated by the heating impacts, including reduced fossil fuel use and
increased electric heating. Fuel switching from petroleum fuels is the most cost-effective, due to their higher
costs. Cooling impacts are relatively low since both baseline and efficient cooling is electric, so the same electric
avoided costs apply to the relatively small difference in usage.
New York City is generally the least cost-effective for several reasons: highest equipment and labor costs; most
expensive winter electric avoided costs, and thus the highest penalty for increased electric heating; and least
expensive oil, and thus the lowest benefits for decreased oil use. The Upstate zone is generally the most cost-
effective due to lower equipment and labor costs, and the lowest winter electric costs.
Fuel switching from natural gas is not cost-effective for most of the HP measures, due to the relatively low cost
of natural gas. Gas prices are forecast to escalate over the 20-year period, but not enough to overcome the cost-
effectiveness hurdle for most gas measures (a few natural gas measures become cost effective starting in later years).
Appendix C provides measure cost-effectiveness for selected years throughout the 20-years study period.
Appendix D provides measure descriptions and their characterizations for costs and savings.
3

2.2 Technical Air-Source Heat Pump Potential
The technical air-source potential was limited to air-source heat pumps, assuming installation of all applicable
measures regardless of cost-effectiveness.
Tables 1 through 6 show the estimated potential for energy savings in various categories, for fuel switching
and non-fuel switching measures, with the percent of the corresponding sales forecast saved, for selected years.
Negative values indicate increased usage.
Table 1. Residential Space Heating/Cooling, Fuel Switching Measures
Table 2. Commercial Space Heating/Cooling, Fuel Switching Measures
2015 2025 2030 2034Elec Cooling (GWh) 31 885 1,237 1,401 % of Res Cooling Forecast 1% 19% 25% 27%
Elec HP Space Heating (GWh) (752) (17,698) (25,336) (25,662)% of Res Elec Forecast -1% -30% -42% -42%
Total Elec Space Htg Impact (GWh) (722) (16,813) (24,099) (24,261)% of Res Elec Forecast -1% -28% -40% -40%
Gas Space Heating (BBtu) 5,310 142,714 215,413 236,396% of Res Gas Space Heating Forecast 2% 53% 77% 84%
Oil Space Heating (BBtu) 2,463 58,230 86,303 88,209% of Res Oil Space Heating Forecast 2% 52% 78% 81%
2015 2025 2030 2034Elec Cooling (GWh) 33 583 578 585% of Com Cooling Forecast 0% 4% 4% 4%
Elec HP Space Heating (GWh) (556) (10,655) (15,193) (15,141)% of Com Elec Forecast -1% -9% -12% -12%
Total Elec Impact (GWh) (523) (10,072) (14,615) (14,555)% of Com Elec Forecast -1% -9% -12% -11%
Gas Space Heating (BBtu) 5,567 121,182 182,510 195,100% of Com Gas Space Heating Forecast 3% 61% 88% 94%
Oil Space Heating (BBtu) 1,570 28,619 41,929 43,412% of Com Oil Space Heating Forecast 3% 61% 89% 94%
4

Table 3. Total Residential and Commercial Space Heating/Cooling, Fuel Switching Measures
Table 4. Residential Space Heating/Cooling, Non-Fuel Switching Measures
Table 5. Commercial Space Heating/Cooling, Non-Fuel Switching Measures
Table 6. Total Residential and Commercial Space Heating/Cooling, Non-Fuel Switching Measures
2015 2025 2030 2034Elec Cooling (GWh) 63 1,468 1,815 1,986 % of Res & Com Cooling Forecast 0% 8% 9% 9%
Elec HP Space Heating (GWh) (1,308) (28,352) (40,529) (40,803)% of Res & Com Elec Forecast -1% -16% -22% -21%
Total Elec Impact (GWh) (1,245) (26,884) (38,714) (38,816)% of Res & Com Elec Forecast -1% -15% -21% -20%
Gas Space Heating (BBtu) 10,877 263,896 397,923 431,496% of Res & Com Gas Space Htg Forecast 2% 56% 81% 88%
Oil Space Heating (BBtu) 4,033 86,849 128,232 131,621% of Res & Com Oil Space Heating Forecast 3% 55% 81% 85%
2015 2025 2030 2034Elec Cooling (GWh) 2 55 83 90% of Res Cooling Forecast 0% 1% 2% 2%
Elec HP Space Heating (GWh) 42 898 1,263 1,233 % of Res Space Heating Forecast 1% 20% 28% 27%
2015 2025 2030 2034Elec Cooling (GWh) 3 57 77 80% of Com Cooling Forecast 0% 0% 0% 0%
Elec Space Heating (GWh) 6 90 121 114% of Com Space Heating Forecast 0% 3% 4% 4%
2015 2025 2030 2034Elec Cooling (GWh) 5 111 160 171% of Res & Com Cooling Forecast 0% 1% 1% 1%
Elec Heat Pump Space Heating (GWh) 47 988 1,384 1,347 % of Res & Com Space Heating Forecast 1% 14% 19% 18%
5

Notably, for fuel switching measures for space heating and cooling, for the total residential and commercial sectors:
• Cooling energy would be reduced by year 20 by about 2.0 terawatt hours (TWh), or 9% of the cooling energy forecast.
• Increased electric space heating of about 41 TWh, which would increase the total residential and commercial electric forecast by about 21%.
• Gas and petroleum fuel space heating would be reduced by 84% and 81%, respectively.
Non-fuel switching installation of heat pumps for space heating and cooling has much smaller potential than for
fuel switching. Residential opportunities would reduce the electric space heating forecast by about 1.2 TWh, or
27% over 20 years, while the cooling forecast would be reduced by about 90 gigawatt hours (GWh), or 2%.
Commercial opportunities would reduce the electric space heating forecast by about 114 GWh, or 4%, with
essentially no reduction in the cooling forecast. These savings are a small fraction of the potential savings from
fuel switching. As noted in the Methodology (Section 3), heat pump measures were only applied to spaces that have
both space heating and cooling. Also, the assessment for non-fuel switching measures was done at a high level and
thus may not reflect all energy efficiency opportunities. The targets for fuel switching from gas and petroleum fuel
space heating are based on the applicability factors described in the Methodology section (under “Applicability”),
which limit the amount of heating energy to which heat pumps apply. Measure penetrations were set to meet
these targets, within the limits described in the Measure Penetrations section, under Methodology.
The potential for water heating measures is detailed in Section 2.4.
2.3 Technical Ground-Source Heat Pump Potential
As noted in the methodology (Section 3), the ground-source technical potential was limited by the assumed
applicability factors for ground source heat pump (GSHP) physical constraints. The potential savings are thus
significantly lower than for the air-source heat pump (ASHP) potential. Tables 7 through 12 show the estimated
potential for ground-source heat pump energy savings in various categories, for fuel switching and non-fuel
switching measures, with the percent of the corresponding sales forecast saved, for selected years. Negative
values indicate increased usage. Of note, gas and petroleum fuel space heating would be reduced by 47% and
51%, respectively.
6

Table 7. Residential Space Heating/Cooling, Fuel Switching Measures
Table 8. Commercial Space Heating/Cooling, Fuel Switching Measures
2015 2025 2030 2034Elec Cooling (GWh) 29 717 1,012 1,250 % of Res Cooling Forecast 1% 15% 20% 24%
Elec HP Space Heating (GWh) (206) (4,808) (6,789) (8,105) % of Res Elec Forecast 0% -8% -11% -13%
Total Elec Space Htg Impact (GWh) (177) (4,091) (5,778) (6,855) % of Res Elec Forecast 0% -7% -10% -11%
Gas Space Heating (BBtu) 2,660 70,076 103,765 129,036% of Res Gas Space Heating Forecast 1% 26% 37% 46%
Oil Space Heating (BBtu) 1,313 31,298 45,453 54,956% of Res Oil Space Heating Forecast 1% 28% 41% 51%
2015 2025 2030 2034Elec Cooling (GWh) 70 1,829 2,756 3,540 % of Com Cooling Forecast 1% 13% 18% 22%
Elec HP Space Heating (GWh) (133) (3,261) (4,821) (5,940) % of Com Elec Forecast 0% -3% -4% -5%
Total Elec Impact (GWh) (62) (1,432) (2,065) (2,400) % of Com Elec Forecast 0% -1% -2% -2%
Gas Space Heating (BBtu) 1,834 51,956 80,346 102,951% of Com Gas Space Heating Forecast 1% 26% 39% 49%
Oil Space Heating (BBtu) 539 12,004 18,480 23,276% of Com Oil Space Heating Forecast 1% 26% 39% 50%
7

Table 9. Total Residential and Commercial Space Heating/Cooling, Fuel Switching Measures
Table 10. Residential Space Heating/Cooling, Non-Fuel Switching Measures
Table 11. Commercial Space Heating/Cooling, Non-Fuel Switching Measures
Table 12. Total Residential and Commercial Space Heating/Cooling, Non-Fuel Switching Measures
2015 2025 2030 2034Elec Cooling (GWh) 99 2,546 3,767 4,790 % of Res & Com Cooling Forecast 1% 13% 18% 22%
Elec HP Space Heating (GWh) (339) (8,069) (11,610) (14,045)% of Res & Com Elec Forecast 0% -5% -6% -7%
Total Elec Impact (GWh) (239) (5,523) (7,843) (9,255) % of Res & Com Elec Forecast 0% -3% -4% -5%
Gas Space Heating (BBtu) 4,495 122,032 184,111 231,987% of Res & Com Gas Space Htg Forecast 1% 26% 38% 47%
Oil Space Heating (BBtu) 1,852 43,302 63,933 78,231% of Res & Com Oil Space Heating Forecast 1% 27% 41% 51%
2015 2025 2030 2034Elec Cooling (GWh) 2 55 83 90% of Res Cooling Forecast 0% 1% 2% 2%
Elec HP Space Heating (GWh) 42 898 1,263 1,233 % of Res Space Heating Forecast 1% 20% 28% 27%
2015 2025 2030 2034Elec Cooling (GWh) 3 57 77 80% of Com Cooling Forecast 0% 0% 0% 0%
Elec Space Heating (GWh) 6 90 121 114% of Com Space Heating Forecast 0% 3% 4% 4%
2015 2025 2030 2034Elec Cooling (GWh) 5 111 160 171% of Res & Com Cooling Forecast 0% 1% 1% 1%
Elec Heat Pump Space Heating (GWh) 47 988 1,384 1,347 % of Res & Com Space Heating Forecast 1% 14% 19% 18%
8

2.4 Economic Heat Pump Potential
The economic scenario considered both air-source and ground-source heat pumps. However, the air-source
heat pumps were found to be more cost-effective for all applications, so the results presented below include no
ground-source heat pumps. As noted above, the report used the Total Resource Cost test, which looks at average
benefits at the system level compared to the costs of the project. Although the analysis determined that ASHPs are
more cost-effective than GSHPs, this does not mean that ASHPs save more energy, just that the added cost of the
GSHPs does not fully counteract the increased savings when compared to a high efficiency ASHP alternative.
Further, the study looked at average costs and benefits; it is likely there will be specific instances where site-specific
conditions mean that GSHPs would actually be more cost-effective than ASHPs, as well as providing larger savings.
Finally, both lost opportunity and retrofit measures were examined. Lost opportunity measures occur when existing
equipment is at the end of its useful life and needs replacement. For these measures, the baseline is assumed to be
minimally code compliant replacement equipment. This equipment is likely significantly more efficient than the old
existing equipment (which is likely at least 20 years old). In retrofit projects existing equipment is replaced before
the end of its useful life. For these projects, the baseline is the existing equipment only until the point in time at
which it would have failed and needed replacement. At this time, the baseline shifts to become the minimally code-
compliant and there is a corresponding drop in the savings. Note that these calculations are more complex than the
simple payback often used by building owners and vendors to evaluate projects.
Most measures for fuel switching from natural gas were not cost-effective, due primarily to low avoided costs
for gas.
For petroleum fuel measures, although some were not cost-effective in the early years, there are enough
cost-effective measures to account for nearly all (99%) of the technical potential for petroleum fuel heating
over 20 years.
Notably, for fuel switching measures for space heating and cooling, for the total residential and commercial sectors:
• Cooling energy in the residential sector would be reduced by year 20 by about 430 GWh, or 8% of the residential cooling energy forecast. However, commercial cooling energy would be increased by about 380 GWh (2% of the commercial cooling forecast) due to less efficient cooling by some heat pump equipment relative to standard cooling equipment.
• Increased electric space heating of about 10 TWh, which would increase the total residential and commercial electric forecast by about 5%.
• Gas and petroleum fuel space heating would be reduced by 3% and 78%, respectively.
Non-fuel switching installation of heat pumps for space heating and cooling has much smaller potential than for
fuel switching. Residential opportunities would reduce the electric space heating forecast by about 1.2 TWh, or
26% over 20 years, while the cooling forecast would be reduced by about 86 GWh, or 2% of the forecast.
9

Commercial opportunities would reduce the electric space heating forecast by about 50 GWh, or 2%, with
essentially no reduction in the cooling forecast. These savings are a small fraction of the potential savings from
fuel switching. As noted in methodology (Section 3), heat pump measures were only applied to spaces that have
both space heating and cooling. Also, the assessment for non-fuel switching measures was done at a high level and
thus may not reflect all energy efficiency opportunities.
Water heating measures for fuel switching to heat pump water heaters (HPWHs) were limited to fuel switching
from petroleum fuels. Water heating savings by year 20 were estimated at about 12 TBtu in the residential sector
(50% of the residential water heating forecast by petroleum fuels), and 7 TBtu in the commercial sector (22% of
commercial forecast). For both sectors combined these savings amount to 35% of the water heating forecast by
petroleum fuels. Water heating savings by HPWHs replacing electric-resistance water heaters had lower potential
than the fuel switching measures, estimated at about 590 GWh for the residential and commercial sectors by
year 20, or 14% of the forecast for electric water heating.
Tables 13 through 18 present the results for the economic heat pump potential, for space heating and cooling.
Table 13. Residential Space Heating/Cooling, Fuel Switching Measures
2015 2025 2030 2034Elec Cooling (GWh) 10 265 377 428% of Res Cooling Forecast 0% 6% 8% 8%
Elec HP Space Heating (GWh) (238) (5,057) (7,179) (7,018) % of Res Elec Forecast 0% -9% -12% -11%
Total Elec Space Htg Impact (GWh) (229) (4,792) (6,801) (6,591) % of Res Elec Forecast 0% -8% -11% -11%
Gas Space Heating (BBtu) - - - 273% of Res Gas Space Heating Forecast 0% 0% 0% 0%
Oil Space Heating (BBtu) 2,463 57,381 85,435 88,164% of Res Oil Space Heating Forecast 2% 52% 77% 81%
10

Table 14. Commercial Space Heating/Cooling, Fuel Switching Measures
Table 15. Total Residential and Commercial Space Heating/Cooling, Fuel Switching Measures
Table 16. Residential Space Heating/Cooling, Non-fuel Switching Measures
2015 2025 2030 2034Elec Cooling (GWh) (24) (227) (351) (382)% of Com Cooling Forecast 0% -2% -2% -2%
Elec HP Space Heating (GWh) (129) (1,976) (2,882) (2,880) % of Com Elec Forecast 0% -2% -2% -2%
Total Elec Impact (GWh) (153) (2,202) (3,233) (3,263) % of Com Elec Forecast 0% -2% -3% -3%
Gas Space Heating (BBtu) 633 6,663 11,361 13,099% of Com Gas Space Heating Forecast 0% 3% 5% 6%
Oil Space Heating (BBtu) 1,028 21,033 31,457 32,806% of Com Oil Space Heating Forecast 2% 45% 67% 71%
2015 2025 2030 2034Elec Cooling (GWh) (14) 38 26 45% of Res & Com Cooling Forecast 0% 0% 0% 0%
Elec HP Space Heating (GWh) (367) (7,032) (10,061) (9,899) % of Res & Com Elec Forecast 0% -4% -5% -5%
Total Elec Impact (GWh) (382) (6,994) (10,034) (9,854) % of Res & Com Elec Forecast 0% -4% -5% -5%
Gas Space Heating (BBtu) 633 6,663 11,361 13,372% of Res & Com Gas Space Htg Forecast 0% 1% 2% 3%
Oil Space Heating (BBtu) 3,491 78,414 116,892 120,970% of Res & Com Oil Space Heating Forecast 2% 50% 74% 78%
2015 2025 2030 2034Elec Cooling (GWh) 2 51 78 86% of Res Cooling Forecast 0% 1% 2% 2%
Elec HP Space Heating (GWh) 41 892 1,254 1,224 % of Res Space Heating Forecast 1% 20% 27% 26%
11

Table 17. Commercial Space Heating/Cooling, Non-fuel Switching Measures
Table 18. Total Residential and Commercial Space Heating/Cooling, Non-fuel Switching Measures
Tables 19 through 24 present the economic potential results for heat pump water heaters.
Table 19. Residential Water Heating, Fuel Switching Measures
Table 20. Commercial Water Heating, Fuel Switching Measures
2015 2025 2030 2034Elec Cooling (GWh) 2 24 34 35% of Com Cooling Forecast 0% 0% 0% 0%
Elec Space Heating (GWh) 4 42 54 50% of Com Space Heating Forecast 0% 2% 2% 2%
2015 2025 2030 2034Elec Cooling (GWh) 4 75 112 120% of Res & Com Cooling Forecast 0% 0% 1% 1%
Elec Heat Pump Space Heating (GWh) 45 934 1,309 1,274 % of Res & Com Space Heating Forecast 1% 13% 18% 17%
2015 2025 2030 2034Elec Water Heating (GWh) (98) (992) (1,008) (892)% of Res Water Heating Forecast -2% -31% -30% -26%
Oil Water Heating (BBtu) 1,081 12,051 13,240 12,445% of Res Oil Water Heating Forecast 6% 54% 55% 50%
2015 2025 2030 2034Elec Water Heating (GWh) (51) (523) (537) (506)% of Com Water Heating Forecast -7% -66% -66% -61%
Oil Water Heating (BBtu) 565 6,342 7,044 7,085 % of Com Oil Water Heating Forecast 2% 22% 23% 22%
12

Table 21. Total Residential and Commercial Water Heating, Fuel Switching Measures
Table 22. Residential Water Heating, Non-fuel Switching Measures
Table 23. Commercial Water Heating, Non-fuel Switching Measures
Table 24.Total Residential and Commercial Water Heating, Non-Fuel Switching Measures
2015 2025 2030 2034Elec Water Heating (GWh) (149) (1,515) (1,545) (1,398) % of Res & Com Water Heating Forecast -3% -38% -37% -33%
Oil Water Heating (BBtu) 1,646 18,393 20,285 19,530% of Res & Com Oil Water Heating Forecast 4% 36% 37% 35%
2015 2025 2030 2034Elec Water Heating (GWh) 64 451 505 510% of Res Elec Water Heating Forecast 2% 14% 15% 15%
2015 2025 2030 2034Elec Water Heating (GWh) 8 73 81 81% of Com Water Heating Forecast 1% 9% 10% 10%
2015 2025 2030 2034Elec Water Heating (GWh) 72 525 586 591% of Res & Com Water Heating Forecast 1% 13% 14% 14%
13

Table 25 compares the economic potential scenario to the technical air-source potential scenario, for fuel-switching
measures for space heating and cooling.
Table 25. Economic Potential as a Percentage of Technical Air-Source Potential, Space Heating, and Cooling Measures
Residential 2015 2025 2030 2034Elec Cooling (GWh) 31% 30% 30% 31%Elec Heat Pump Space Heating (GWh) 32% 29% 28% 27%Total Electric Impact (GWh) 32% 29% 28% 27%Gas Space Heating (BBtu) 0% 0% 0% 0%Oil Space Heating (BBtu) 100% 99% 99% 100%
Commercial 2015 2025 2030 2034Elec Cooling (GWh) -73% -39% -61% -65%Elec Heat Pump Space Heating (GWh) 23% 19% 19% 19%Total Electric Impact (GWh) 29% 22% 22% 22%Gas Space Heating (BBtu) 11% 5% 6% 7%Oil Space Heating (BBtu) 65% 73% 75% 76%
Total Residential & Commercial 2015 2025 2030 2034Elec Cooling (GWh) -23% 3% 1% 2%Elec Heat Pump Space Heating (GWh) 28% 25% 25% 24%Total Electric Impact (GWh) 31% 26% 26% 25%Gas Space Heating (BBtu) 6% 3% 3% 3%Oil Space Heating (BBtu) 87% 90% 91% 92%
14

3 Methodology
3.1 Methodology Overview
The scope of analysis was limited to heat pumps used for both space heating and cooling of residential and
commercial buildings. While there are many special applications of heat pumps for various industrial processes,
we did not include those applications in this study. There would be some potential for conventional space heating
and cooling by heat pumps in the industrial sector, but that is a relatively small part of the industrial sector energy,
and we did not include that in this study.
This assessment is built on the EERE Potential Study.3 As for that study, this assessment used a top-down analysis
starting with statewide usage forecasts for electricity, natural gas, and petroleum fuels.4 The usage forecasts were
disaggregated into annual energy usage by end use, including space heating and cooling as applicable to heat
pumps. Individual heat pump measures were defined and characterized for their costs and energy savings (or
increased usage) relative to baseline or standard equipment, and for its effective useful lifetime. The “applicability”
of each measure, or the portion of the end-use energy to which each measure applies was also estimated as described
in more detail later in this section. Depending on the potential scenario (technical or economic), appropriate market
penetration percentages were assigned. These factors lead to Equation 1:
Annual energy savings = (End-use Energy) * (Applicability) * (% Savings) * (% Penetration) (1)
For example, consider a residential heat pump replacing a gas boiler and central air conditioning (CAC), for
the new construction market, for the technical potential. For this case, the gas heating component might be:
• End-use energy = 1,000BBtu (total space heating by natural gas, year 1, for this zone, for new construction.
• Applicability = 80% (gas usage paired with AC) * 50% (portion associated with CAC) = 40%. • Percent Savings = 100% (all of the natural gas is saved due to fuel switching to the heat pump). • Percent Penetration = 100% (assume full market penetration of the new construction market). • Annual gas savings = 1,000 BBtu * 40% * 100% * 100% = 400 BBtu.
3 https://www.nyserda.ny.gov/Energy-Data-and-Prices-Planning-and-Policy/Energy-Prices-Data-and-Reports/EA-Reports-and-Studies/EERE-Potential-Studies.aspx
4 Petroleum fuels included heating oil, propane, and kerosene, and were assessed as a group rather than individually.
15

This same measure would have increased electric usage (kWh) for heating by the heat pump, estimated
proportionately to the gas savings. In addition, there would be cooling savings for the efficient heat pump relative
to the baseline CAC. The dollar benefits associated with energy savings (or increased usage) were determined by
applying the avoided costs of energy supply for each fuel type and year of the measure’s service lifetime.
The assessment was carried out separately for each of four analysis zones: Long Island (LI), New York City (NYC),
Hudson Valley (HV), and Upstate New York (UP). Each zone was distinguished by its own:
• Usage forecast and energy disaggregation (electric, gas, petroleum fuels). • Avoided costs of energy supply. • Climatic conditions (e.g., full-load hours for space heating and cooling). • Equipment and installation cost multipliers (based on RSMeans data). • Electric load profiles (load shapes) for estimating the energy (kWh) saved in each energy costing period
corresponding to the electric avoided costs.
This top-down methodology by analysis zone is described in detail the EERE Potential Study. Volume 1 describes
the analysis zones, usage forecasts, end-use disaggregation, avoided costs, and the cost-effectiveness analysis
methodology. Volume 2 describes the top-down methodology (see in particular the commercial sector “Overview
of Approach” on page 39).
As for the EERE Potential Study, this assessment covered a 20-year period, but starting in 2015 rather than 2013.
The avoided energy supply costs from the EERE Potential Study were used for this study, but were inflated from
2012 dollars to 2014 dollars.
The technical potential includes full market penetration all measures evaluated (while avoiding any double
counting), regardless of whether they were cost effective, and ignoring other market barriers. The economic
potential limits the analysis to measures found to be cost-effective based on New York’s standard Total Resource
Costs test (described in Volume 1 of the EERE Potential Study). Cost-effectiveness was evaluated for each zone
and installation year of the 20-year study. Some measures were not cost-effective in year 1, but became cost-
effective in future years.
Three potential assessments were performed:
• Technical potential for air source heat pumps. • Technical potential for ground source heat pumps. • Economic potential for air source and ground source heat pumps combined.
16

3.2 Measures Assessed
The assessment included the following categories of measures, which are summarized in Table 26.
Table 26. Categories Measured for the Assessment
End Use Measure Category Notes
Space Heating and Cooling
Fuel switching from gas or petroleum fuel space heating and electric cooling to heat pumps
This category has the highest potential for energy savings, and was assessed in greater detail than the other categories.
Switching from resistance space heating and cooling to heat pumps
Assessed for the residential sector. Ignored for the commercial sector, which has relatively small usage of electric resistance heating.
Installation of high-efficiency space heating and cooling heat pumps in place of standard-efficiency heat pumps
For the residential sector this was not found to be cost effective. For the commercial sector, assessed for installation of CEE Tier II heat pumps.
Water Heating
Fuel switching from fossil fuel (FF) heating to heat pump water heaters
High-level assessment using a single measure for switching from stand-alone FF water heaters to HPWHs. Fuel switching from gas was assumed not to be cost-effective.
Installation of high-efficiency HPWHs in place of electric resistance water heaters
High-level assessment based on the findings of the EERE Potential Study.
3.2.1 Fuel Switching for Space Heating and Cooling
The assessment of fuel switching for space heating and cooling includes heat pump measures for new construction
and retrofit. The retrofit measure characterizations assume that existing heating and cooling equipment has five
years of remaining life, out of a 20-year life for heating equipment and a 15-year life for cooling equipment. The
retrofit characterizations also include:
• A dollar benefit for a deferred replacement cycle for the existing heating and cooling equipment (which would have needed replacement in 5 years).
• A baseline shift when newer (generally more efficient) equipment would have been installed in 5 years.
In terms of measuring cost-effectiveness, these aspects of the retrofit characterizations put them on a par with
replace-on-burnout measures, where the existing heating and cooling equipment would be at end-of-life. It would
be relatively rare to have both the heating and cooling equipment reach end-of-life at the same time, hence the
decision to treat all non-new-construction as retrofits. Also, because 100% of new construction opportunities were
assumed to result in heat pump installations, these account for a substantial part of the total potential over the course
of the 20-year study.
17

Table 27 and Table 28 summarize the combinations of source cooling equipment and heat-pump technologies
included in the assessment for space heating and cooling. The heat pump technologies included:
• ASHP—Central, ducted Air-Source Heat Pumps, typically like central AC for residential, and unitary AC (e.g., roof-top units) for commercial.
• DMSHP—Ductless Mini Split Heat Pumps. • VRF—Variable Refrigerant Flow Heat Pumps. • GSHP—Ground Source Heat Pumps.
Where multiple HP technologies applied to given cooling equipment, the “Prioritized HP Technology” was the
technology found to have the highest cost-effectiveness. As a result, the analysis does not attempt to quantify the
maximum savings that can be captured cost-effectively, but rather the savings associated with doing the optimal
measures based on maximum cost-effectiveness. The displaced fossil fuel for heating was the same regardless of the
HP technology. For each of the three potential scenarios, the Prioritized HP Technology was used for all
installations, and the less cost-effective options were excluded from the analysis.
Table 27. Residential Heat Pump Measures
ASHP DMSHP VRF GSHP Prioritized HP Technology
Central AC X X X ASHP
Room AC X
Table 28. Commercial Heat Pump Measures
ASHP DMSHP VRF GSHP Prioritized HP Technology
Unitary AC X X X ASHP
Chiller X X X VRF for Tech; VRF or ASHP for
Economic*
Central AC X
Room AC X
* The “Chiller to VRF” measure has higher savings, but there were cases where “Chiller to ASHP” passed cost-effectiveness while “Chiller to VRF” failed. Therefore, for the economic potential the VRF option was prioritized where it passes, and ASHP is otherwise selected where cost-effective.
18

Heat pumps were assumed to completely replace existing fossil-fuel based heating systems. In past practice for
northern areas, existing heating systems were often left in place to handle peak loads. Otherwise, electric resistance
coils were used to handle peak loads, which greatly reduced or even eliminated the efficient gains from the heat
pump. With new “cold-climate” heat pumps, the need for backup heating is greatly reduced or eliminated. Measures
for lower capacity heat pumps with backup heat were not included partly due to the complexity of these scenarios
and a lack of data on their costs and benefits (characterizing them would necessitate modeling a variety of
prototypical building for different configurations, beyond the scope of this study). More importantly, current
installations are generally sized to eliminate the need for backup heat.
Measure costs reflect the expected need for distribution systems to support the heat pumps. Existing duct work,
such as for central heating systems, was assumed to be reused with some modification. Some buildings would
require expensive distribution system retrofits, particularly in place of existing hydronic distribution systems.
While some hydronic systems are capable of being retrofit for use with hydronic heat pump systems, this is
relatively rare and there is no data available to support an estimate for this special case.
For the technical potential, the highest-efficiency heat pumps were not necessarily assumed to be available on the
market. For measure characterizations, the highest-efficiency equipment with reasonably good cost data available
and with reasonably high installation rates was assumed. These characterizations made sense for the economic
potential. Therefore, the technical potential would be somewhat higher if assuming the most efficient heat pumps
available, regardless of their cost-effectiveness. At the same time, increasing heat pump COPs over time were
assumed, which accounts for higher efficiency levels and greater savings potential in the future.
3.2.2 Water Heating Potential Assessment
Potential savings for heat pump HPWHs were assessed at a high-level. Fuel switching was assessed for switching
from a stand-alone oil or propane hot water heater to a HPWH. Fuel switching from gas water heaters was assumed
not to be cost-effective based on other studies, and was not assessed.
The potential for HPWHs for non-fuel switching applications was assessed at a high level based on the EERE
Potential Study. The residential bundled water heating measures for that study included multiple energy efficiency
opportunities, including source heating equipment (e.g., HPWHs), hot water distribution (e.g., pipe wrap), delivery
equipment (e.g., low-flow equipment), and heat recovery. For the residential sector, 30% of the economic hot water
electric energy savings was assumed to be attributed to hot water heat pumps, whether replacing electric resistance
19

hot water tanks or installing high-efficiency rather than standard efficiency heat pumps. For the commercial sector,
about 10% of economic energy savings was estimated to be attributed to heat pumps. The lower percent of savings
for the commercial sector is due to having much less electric resistance hot water, and higher standards for larger
water heaters.5 The EERE Potential Study did not estimate the technical potential, but this assessment roughly
estimated that the technical potential would be 20% higher than the economic potential.
3.3 Measure Penetrations
Technical and economic potential scenarios typically ignore all market barriers. For this study, rather than
assuming all applicable measures could be installed in year one, we roughly bounded the potential scenarios
based on contractor and equipment availability. We assumed that high levels of annual market penetration could
be achieved, but that it would take several years to ramp up to those levels as the contractor pool would grow over
time in response to high demand for their services. By having measure penetrations ramp up over time, the impacts
of measures installed in future years were assessed when the avoided energy supply costs are expected to be higher
than today (see the EERE Potential Study for more detail on the avoided costs).
For the technical scenarios, measure penetrations were set to 100% for new construction (full market penetration),
assuming there would be sufficient contractor availability for the relatively small new construction market. Retrofit
measures started with 2% penetration, ramping up over about 10 years to a maximum of 9% annual penetration.
For the economic scenario, measure penetrations were set to 100% for new construction (full market penetration).
Retrofit measures were set individually for those measures that passed cost-effectiveness, generally following the
same ramp-up as for the technical scenarios, to a maximum of 9% penetration.
3.4 Applicability
“Applicability” is the portion of the end-use energy to which a measure applies. As previously noted, a measure’s
annual savings are calculated as Equation 1:
Annual energy savings = (End-use Energy) * (Applicability) * (% Savings) * (% Penetration) (1)
Applicability is thus a key factor limiting measure savings, and for preventing double-counting by different
measures.
5 For example, in 2015, ENERGY STAR® water heaters above 55 gallons (9% of the ENERGY STAR water heater market) must be HPWHs.
20
Assessing applicability for the fuel switching measures took place in several steps:
Step 1: Exclude street lighting and data center energy from the commercial energy available for HPs. Data centers
are excluded as they do not have significant heating loads. The street lighting and data center loads were estimated
by zone in the usage disaggregation from the EERE Potential Study.
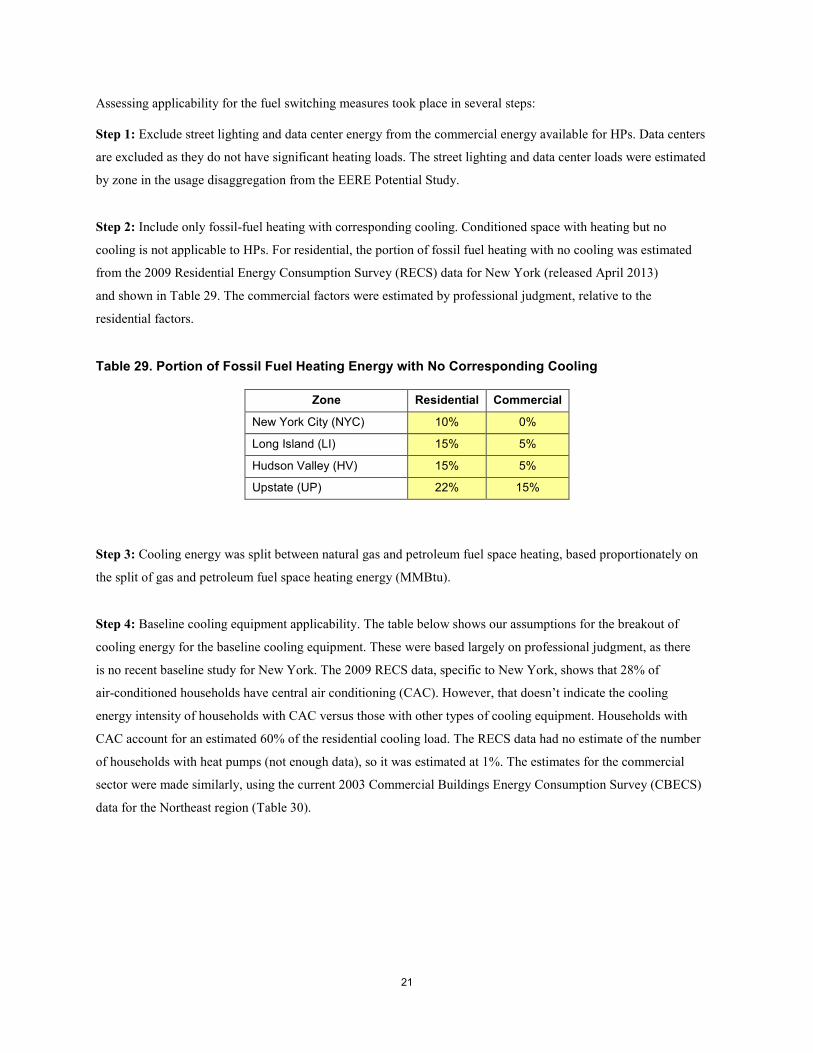
Step 2: Include only fossil-fuel heating with corresponding cooling. Conditioned space with heating but no
cooling is not applicable to HPs. For residential, the portion of fossil fuel heating with no cooling was estimated
from the 2009 Residential Energy Consumption Survey (RECS) data for New York (released April 2013)
and shown in Table 29. The commercial factors were estimated by professional judgment, relative to the
residential factors.
Table 29. Portion of Fossil Fuel Heating Energy with No Corresponding Cooling
Zone Residential Commercial
New York City (NYC) 10% 0%
Long Island (LI) 15% 5%
Hudson Valley (HV) 15% 5%
Upstate (UP) 22% 15%
Step 3: Cooling energy was split between natural gas and petroleum fuel space heating, based proportionately on
the split of gas and petroleum fuel space heating energy (MMBtu).
Step 4: Baseline cooling equipment applicability. The table below shows our assumptions for the breakout of
cooling energy for the baseline cooling equipment. These were based largely on professional judgment, as there
is no recent baseline study for New York. The 2009 RECS data, specific to New York, shows that 28% of
air-conditioned households have central air conditioning (CAC). However, that doesn’t indicate the cooling
energy intensity of households with CAC versus those with other types of cooling equipment. Households with
CAC account for an estimated 60% of the residential cooling load. The RECS data had no estimate of the number
of households with heat pumps (not enough data), so it was estimated at 1%. The estimates for the commercial
sector were made similarly, using the current 2003 Commercial Buildings Energy Consumption Survey (CBECS)
data for the Northeast region (Table 30).
21
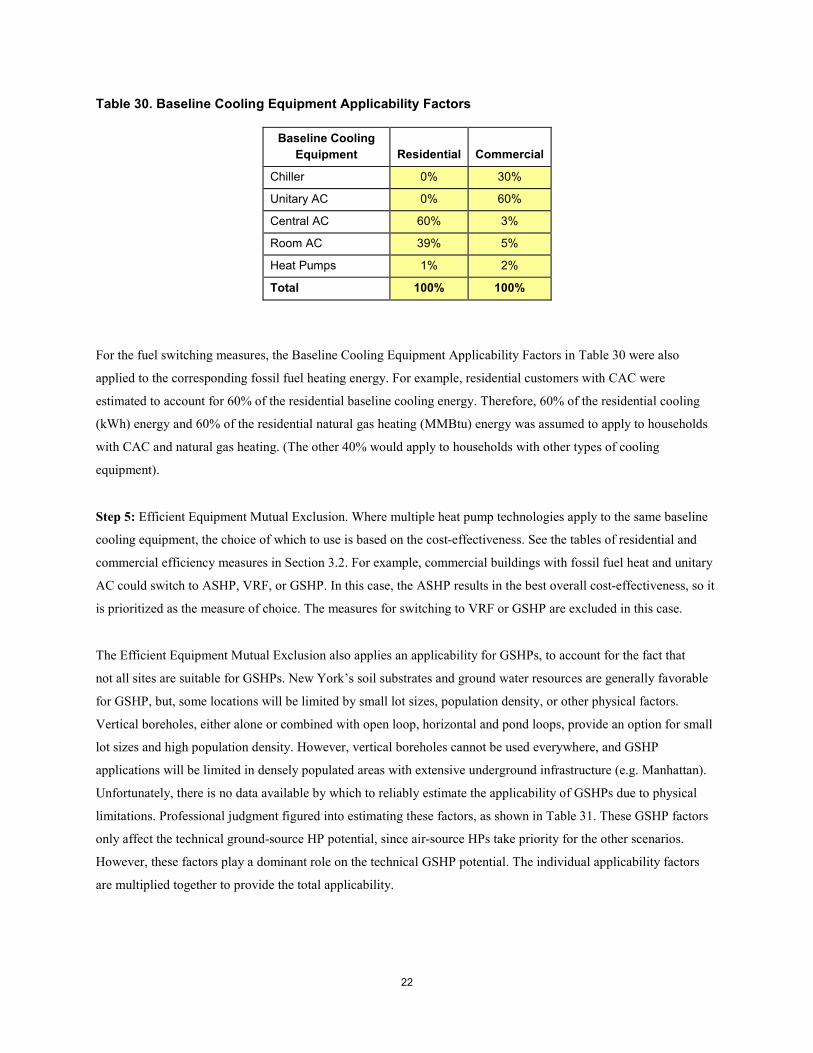
Table 30. Baseline Cooling Equipment Applicability Factors
Baseline Cooling Equipment Residential Commercial
Chiller 0% 30%
Unitary AC 0% 60%
Central AC 60% 3%
Room AC 39% 5%
Heat Pumps 1% 2%
Total 100% 100%
For the fuel switching measures, the Baseline Cooling Equipment Applicability Factors in Table 30 were also
applied to the corresponding fossil fuel heating energy. For example, residential customers with CAC were
estimated to account for 60% of the residential baseline cooling energy. Therefore, 60% of the residential cooling
(kWh) energy and 60% of the residential natural gas heating (MMBtu) energy was assumed to apply to households
with CAC and natural gas heating. (The other 40% would apply to households with other types of cooling
equipment).
Step 5: Efficient Equipment Mutual Exclusion. Where multiple heat pump technologies apply to the same baseline
cooling equipment, the choice of which to use is based on the cost-effectiveness. See the tables of residential and
commercial efficiency measures in Section 3.2. For example, commercial buildings with fossil fuel heat and unitary
AC could switch to ASHP, VRF, or GSHP. In this case, the ASHP results in the best overall cost-effectiveness, so it
is prioritized as the measure of choice. The measures for switching to VRF or GSHP are excluded in this case.
The Efficient Equipment Mutual Exclusion also applies an applicability for GSHPs, to account for the fact that
not all sites are suitable for GSHPs. New York’s soil substrates and ground water resources are generally favorable
for GSHP, but, some locations will be limited by small lot sizes, population density, or other physical factors.
Vertical boreholes, either alone or combined with open loop, horizontal and pond loops, provide an option for small
lot sizes and high population density. However, vertical boreholes cannot be used everywhere, and GSHP
applications will be limited in densely populated areas with extensive underground infrastructure (e.g. Manhattan).
Unfortunately, there is no data available by which to reliably estimate the applicability of GSHPs due to physical
limitations. Professional judgment figured into estimating these factors, as shown in Table 31. These GSHP factors
only affect the technical ground-source HP potential, since air-source HPs take priority for the other scenarios.
However, these factors play a dominant role on the technical GSHP potential. The individual applicability factors
are multiplied together to provide the total applicability.
22

Table 31. Ground Source Heat Pump Applicability Factors
Zone Residential Commercial
New York City (NYC) 30% 30%
Long Island (LI) 70% 70%
Hudson Valley (HV) 70% 70%
Upstate (UP) 80% 80%
3.5 Outlook for Decreased Cost and Increased Performance Over Time
Heat pumps have been improving in performance over recent years, and newer “cold-climate” heat pumps have
opened up markets for heat pumps, including New York State.
The International Energy Agency (IEA) produced in 2011 a Technology Roadmap: Energy-efficient Buildings:
Heating and Cooling Equipment,6 which included cost and performance goals for heat pumps. Performance
improvements were assumed to be equal to the lower end of these performance goals by 2030. For space and water
heating, a 30% increase was assumed in heat pump Coefficient of Performance (COP) by 2030, which corresponds
to a decrease in heat pump heating energy (kWh) of about 23%. For cooling, a modest increase in savings of 10% by
2030 (relative to 2015) was assumed, as baseline cooling equipment is expected to improve along with heat pump
equipment. Incremental installed costs for heat pump measures was assumed to decrease by 5% (in real dollars)
by 2030, relative to 2015 – a conservative estimate relative to the IEA’s Technology Roadmap cost goals. These
assumptions for changes over time to installed cost and performance were applied linearly between 2015 and 2030,
continuing the same trends through 2034 (year 20).
6 https://www.iea.org/publications/freepublications/publication/buildings_roadmap.pdf
23

3.6 Other Methodology Issues
Exclusion of residual (#6) heating oil. Residual heating oil was excluded from the petroleum fuels due to its
low avoided costs. As for natural gas, fuel switching from residual fuel oil heating to heat pumps is generally not
cost-effective due to the relatively low benefits for reduced fuel usage. Thus, the aggregated petroleum fuels and
their associated aggregate avoided costs were limited to distillate (#2), kerosene, and propane/LPG, all of which
have relatively high avoided costs. Note that the petroleum fuels sales forecast still includes residual fuel oil. The
petroleum fuels savings as a percent of forecast thus reflects the residual fuel oil in the forecast, though no heat
pump measures were applied to petroleum fuels.
Building shell efficiency. Any increase in building shell efficiency over time was not assumed. With increased
building shell efficiency, as could be driven by efficiency program efforts, the potential would be reduced due to
reduced heating and cooling loads. Note that for buildings with poor air sealing or insulation it may be more cost-
effective to do some weatherization first, so that a smaller HP could be purchased (or if pursuing a net-zero-energy
home, weatherization makes it possible to run the HP with less solar panels) – but that assessment was beyond the
scope of this project.
Potential for increased cooling loads due to promotion of heat pumps. In reality, as heat pumps become
more available and cost-effective, some people without cooling may choose to install them when they would
not otherwise have installed cooling. That is, as people become aware of the benefits of heat pumps, there may
be market pressure to install new air conditioning earlier than would have occurred with conventional cooling
equipment. This issue may be considered during an evaluation of heat pump programs.
24

4 Heat Pump Technologies
4.1 Overview
Heat pumps are often grouped into two distinct categories: air-source heat pumps (ASHP) and ground source
heat pumps (GSHP). ASHPs use outdoor air as a thermal reservoir. This reservoir allows for simpler and less
expensive installations, but ASHPs are also highly susceptible to reduced performance at lower air temperatures.
Because the efficiency of heat pumps is inversely proportional to the difference in temperature between the hot and
cold reservoirs, the heat pumps become less efficient as the temperature difference becomes larger. The difference in
temperature between inside and outside is typically higher in the winter than in the summer, so this problem mainly
impacts the heating season. In fact, for climates in much of New York, heat pumps may need an auxiliary heat
source for the coldest nights. Conventional air source heat pumps commonly used in milder climates, for example,
have a COP barely above 1 at 50 °F, and a lower temperature limit of 45 °F. However, heat pumps designed for
improved cold weather performance has significantly increased in recent years, and now some ASHP models can
provide space heating at a COP of 1.75 at 5 °F, and lower limit temperatures as low as -13 °F.7
GSHPs address the problem of cold weather performance by using the ground soil or a body of water as a heat
reservoir, instead of the outdoor air. Ground temperatures in the U.S. stay at a fairly constant temperature throughout
the year of between, depending on latitude, 45 to 75 °F.8 Because the temperature difference between the ground
and the desired set point remains fairly small all year, ground source heat pumps are able to achieve higher seasonal
efficiencies than air source heat pumps. However, extra piping and digging expenses also mean that the installation
costs for GSHPs are much higher than those for ASHPs.
Within each of these two broad categories, several distinct types of heat pumps exist. The following sections review
several of these types of heat pumps, giving an overview of the technology, the market status and ideal site
characteristics for installation, and barriers to market adoption of the technology.
4.2 Ductless Mini-Split
4.2.1 Overview
Ductless mini-splits are a type of air-source heat pump used primarily in residential and small commercial settings.
Like standard central air conditioning (AC) units, ductless mini-splits have an outdoor compressor and an indoor air
handler/evaporator connected by refrigerant lines. However, no ductwork is needed – instead, the evaporator units
7 ETSAP and IRENA, p. 1. 8 http://energy.gov/energysaver/articles/geothermal-heat-pumps.
25

are typically located directly in the space to be cooled. Multiple indoor units can be connected to the same outdoor
unit, allowing easy multi-zone control. Further, ductless mini-split units typically use inverter-driven variable speed
compressors and multi-speed fans that allow for efficient part-load operation. This set-up means less cycling and
thus a tighter indoor temperature range. The eliminated duct losses, efficient part load operation, and easy zone
control combine to allow ductless mini-splits to achieve higher seasonal efficiencies than traditional central ACs;
units can reach as high as a 26 Seasonal Energy Efficiency Ratio (SEER). The lack of duct losses that often degrade
the system efficiency in ducted systems contribute to additional energy savings. On the heating side, with seasonal
average COPs reaching 3.5, ductless mini-splits provide significant advantages over electric resistance heat, and
potentially even over fossil fuel boilers and furnaces, for which the highest efficiencies are in the upper 90s not
including any duct losses.
In most areas of New York State, supplemental heating would likely be needed with ductless mini-splits. However,
recent years have seen large advancements in cold-climate mini-splits, and units have recently become available that
provide full heating capacity at 5 °F with COPs in the range of 1.5-1.8.9
4.2.2 Market Trends and Ideal Site Characteristics
Internationally, ductless mini-split heat pumps (DMSHPs) are not a new market, and in fact they are estimated to
make up as much as 98% of the Asian residential HVAC market, and 50-70% of the European market.10 Despite the
international popularity, they have been slow to take hold in the U.S. market, and are thought to make up less than
5% of the residential market. However, U.S. adoption has recently been picking up, with an average annual growth
rate of 12% for the past five years, despite a contracting overall Unitary HVAC market.11
Part of the reason for the slower uptake in the U.S. market is that ductless mini-splits have a higher first-cost than
a traditional AC and furnace. A pilot program in Connecticut and Massachusetts found an average cost per ton of
cooling for a ductless mini-split retrofit of $2,715.12 This agrees closely with a case study done by the U.S.
Department of Energy, Office of Energy Efficiency and Renewable Energy (EERE) in Austin, TX, which found a
cost of $2,922 per ton.13 The EERE Potential Study also found an incremental cost of $275 per ton, assuming both
the furnace and the AC need to be retrofit in the base case. A comprehensive study in the Pacific Northwest finds a
slightly higher incremental cost, estimating a 30% premium for DMSHPs.14 However, given that a large portion of
9 Roth, Sehgal and Akers 2013 10 NAHB Research Center 2008 11 Landwehr 2012 12 KEMA Inc. 2009 13 Roth, Sehgal and Akers 2013 14 NAHB Research Center 2008
26

the costs for DMSHPs are for labor and their relatively low acceptance in the marketplace, it is reasonable to expect
that costs will come down as the technology becomes more well-known. Further, DMSHP systems are likely already
cheaper than traditional ducted systems for retrofit add-ons in houses with pre-existing non-ducted systems, or for
room additions or renovations where it is infeasible to extend the existing ductwork.
4.2.3 Market Barriers
As evidenced by very high penetration rates of DMSHPs in Europe and Asia, the market barriers preventing
U.S. adoption of the technology should be addressable. These barriers include:
• High first cost: as mentioned above, first costs for DMSHPs are often higher than for traditional ducted systems when replacing existing equipment. However, the incremental cost will likely fall as DMSHPs gain more acceptance in the U.S.
• Aesthetic concerns: Many U.S homeowners do not like the aesthetics of having the indoor air handling unit right in the conditioned space, preferring to have the conditioned air enter through the nearly invisible vents typical of a ducted system. These concerns are likely to be mitigated with increased knowledge of the other comfort benefits of DMSHPs. In the Connecticut and Massachusetts pilot project, for example, 31 of 40 participants indicated that the DMSHP system worked better than their old one. Surveys for pilot projects have found that although many customers complain about the sight of the system at first, they gradually grew accustomed. Further, many high-end residential homes are now putting in DMSHPs with short ductwork in order to address these concerns.
• Lack of awareness: In the past, manufacturers have directed marketing materials exclusively to trade contractors. This means consumer awareness of the product is still very low.
• Low temperature heating: In the past, the low-temperature performance has been a significant barrier to adoption in cold climates. However, as previously discussed, this performance has improved significantly in recent years, and will likely continue to improve.
• Uncertainty and lack of installers: Many builders are reluctant to install DMSHPs due to uncertainty of market acceptance. Builders who do want to install DMSHPs often report having trouble finding an installer.15
• Lack of contractor training: DMSHPs require specialized training for proper installation, including how to size the system properly, and where to install the indoor AHUs. If this is not done properly, there will likely be issues with temperature and humidity control. Further, contractors are typically much more comfortable working with ducts than with refrigerant lines.
15 Ibid.
27

4.3 Variable Refrigerant Flow Systems
4.3.1 Overview
Variable refrigerant flow (VRF) heat pumps are similar to mini-splits in that one outdoor compressor is connected
to multiple indoor air handlers/evaporators. However, whereas mini-split (and multi-split) systems require separate
refrigerant lines for each indoor unit, the variable refrigerant flow capability allows all indoor units to connect to
the compressor via the same two refrigerant lines. Further, VRF systems are able to use heat recovery, enabling
simultaneous heating and cooling by zone. With heat recovery, VRF systems will typically use three refrigerant
lines: a liquid line, a hot gas line, and a suction line. An indoor unit requiring cooling will open the liquid and
suction lines, and act as an evaporator, and a unit requiring heating will open its hot gas line and liquid line, and act
as a condenser. Heat exchangers in the indoor units will transfer reject heat from units being cooled to the refrigerant
line that is going to the zone to be heated. The waste heat can also potentially go to heat domestic hot water, or hot
water for a separate hydronic heating system. Because the heat recovery gives energy savings to both the heated
zones and the cooled zones, the effective COP may increase significantly.16
4.3.2 Market Status and Ideal Site Characteristics
Due to the VRF system’s ability to efficiently provide tight zone-level temperature control to buildings with many
zones, they are best suited to larger commercial and residential buildings that benefit from a high degree of
individual zone control. Examples include offices, hospitals, large multifamily buildings, nursing homes, strip malls,
and schools. If zones in the building are expected to have highly variable cooling/heating loads, or if heat for DHW
is desired, it may be worth paying a premium for a VRF system with heat recovery. Costs for VRF systems are
highly variable, and depend on many site-specific conditions. However, studies indicate that a VRF system typically
costs 5-20% more than an equivalent standard HVAC system.17 VRF systems are also a highly cost-effective retrofit
on commercial buildings without a current cooling system.
Like ductless mini-split systems, the larger VRF systems also have much higher usage in Asia and Europe than in
the U.S. In Japan, for example, VRF systems are used in about 50% of medium-sized commercial buildings, and
33% of large commercial buildings (greater than 70,000 square feet). Although U.S. penetration is starting to
increase in sectors such as luxury high rises in New York, overall market share is very low. In 2007, less than
10,000 VRF systems were installed in the US.18
16 Bhatia 2011 17 Ibid. 18 Amarnath and Blatt 2008
28

4.3.3 Market Barriers
Market Barriers to widespread adoption of VRF systems in the U.S. include:
• High first cost: In countries where VRF systems are well established, the higher equipment costs from VRFs are somewhat offset by lower labor costs. This is less true in the US, where most contractors are not familiar with VRFs.
• Poor understanding of savings: There is not much reliable third-party data available examining the performance and cost data of VRF systems in the U.S. Until this data is more widely available and accepted, risk-averse contractors and builders are unlikely to specify a VRF system.
• Concerns about refrigerant leaks: Because VRF systems have long lengths of refrigerant pipes, there has been concern relating to the potential for leaks. Installation must be performed in accordance with ASHRAE Standard 15-2007. As more contractors gain experience safely installing long refrigerant lines, this barrier should diminish in importance.
• Manufacturer presence: U.S. manufacturer presence and support for VRF systems has traditionally been very limited. This trend seems to be changing in recent years as Japanese manufactures have moved into the U.S. market space.
• Ventilation requirements: Depending on the design, a building with a VRF system may also need a dedicated ventilation system to comply with ASHRAE standard 62 requirements. This offsets part of the advantage of using a VRF system, as compared to systems that do not require dedicated outside air.
• Lack of test rating procedures: While Japan and Europe have well established rating systems for VRFs, there are no code compliance procedures certified by the ARI and approved by U.S. Department of Energy.
4.4 Ground-Source Heat Pumps
4.4.1 Overview
GSHPs use either the ground, or a nearby lake or other body of water as a heat reservoir. Because the ground
temperature is relatively stable throughout the year, GSHPs provide an efficiency advantage over air-source heat
pumps and have much better cold climate performance than air-source heat pumps. This advantage is demonstrated
by their popularity in Scandinavian countries – 30% of Swedish houses have GSHPs, and there are an estimated
15,000 GSHP systems in Norway and 46,000 in Finland.19
There are two broad categories of GSHPs: open-loop systems and closed-loop systems. Open-loop systems pump
water from a nearby lake, ocean, or river into a heat exchanger in the heat pump, and then discharge the water into
the same body of water. Although installation costs are typically cheaper than for closed-loop systems, the site must
be situated nearby an appropriate body of water. Local codes regarding groundwater discharge may further restrict
possible installation sites.
19 Denali Commission 2011
29

A closed-loop system pumps a fluid with a low freezing temperature through the ground or body of water. As the
fluid gets pumped through the pipe, it exchanges heat with the surrounding ground. The longer the pipe, the more
heat will be exchanged; typical estimates call for about 1,000 feet per ton of heat pump capacity for horizontal
loops, and 300-400 feet per ton for vertical loops. Horizontal systems are generally cheaper to install, and more
cost-effective for residential installations, if sufficient space is available. In these systems, the piping is installed
over a fairly large area, at a depth of between 4 and 6 feet below ground. Cold climate installations may need to go
in at the deeper end of this range in order to avoid ground frost in the winter. Vertical systems are used more often
for larger systems, where the amount of land area required for a horizontal system would be prohibitive. Vertical
systems are far more expensive than horizontal systems, as they require piping to depths of 100 to 400 feet.
In recent years, direct exchange (DX) ground-source heat pumps have been gaining popularity. DX systems pump
refrigerant directly through the ground loop, instead of using a secondary water/glycol loop. DX systems eliminate
the water-to-refrigerant heat exchanger as well as water loop pumping, making them generally cheaper and more
efficient than traditional GSHPs. However, there are potentially serious environmental concerns relating to the
potential leakage of refrigerant into the groundwater, and the high cost of repairing such leaks.
Desuperheaters: A desuperheater is an auxiliary heat exchanger that captures heat from the hot refrigerant
as it leaves the heat pump compressor and transfers it to the domestic hot water. Although desuperheaters are
available for standard air source heat pumps and even central AC units, they most commonly come with GSHPs.
Desuperheater costs range from around $400-$700, and can meet up to 50% of annual water heating demand.20, 21, 22
4.4.2 Market Status and Ideal Site Characteristics
GSHP installations in the U.S. have been rising rapidly in recent years. In 2005, there were only about
600,000 GHP units installed in the U.S.; however 2008 and 2009 both saw annual shipments of over
100,000, equaling more than 400,000 tons of capacity per year.23, 24
20 Builder Guide 2003 21 Olszewski and Fontana, 1983, 22 http://www.igshpa.okstate.edu/geothermal/faq.htm 23 Liu 2010 24 Navigant Consulting, Inc. 2012
30

Despite the increase in installations, high first cost continues to be a significant barrier to GSHP penetration. Costs
for GSHPs are highly variable, and dependent both on the soil type in the area and on the availability of drillers with
the type of experience needed to drill for GSHP systems. Also, incremental costs tend to get smaller as the system
gets larger (for the same type of GSHP system). A survey of the market in the Pacific Northwest found installation
costs for a 2,000-square foot home to be between $10,000 and $14,000, and costs for a 4,000-square foot home to be
$12,000 to $18,000.25 For this reason, most systems installed are going into homes larger than 3,000 square feet.
However, the same survey found that, if equipment were sold at cost, GSHPs would only be slightly more expensive
than ASHPs for homes as small as 2,000 square feet. In contrast, a study from Oak Ridge National Laboratory
estimated that the incremental cost of retrofitting a 3-ton GSHP system at more than double the costs of installing a
CAC and gas furnace.26
Commercial installations of GSHPs are rarer than residential installations, due to more complex systems and higher
costs. Cost premiums for commercial installations are also highly variable, but estimated at between 0 and 100%.27
An ASHRAE study of a sample of GSHPs in commercial installation found an average installed cost of $7,694 per
ton. However, the study also found that the ground loop portion only made up 25.5% of the total costs, implying that
there is likely significant room for cost reduction on the actual HVAC components of GSHPs.
4.4.3 Market Barriers
The largest barrier to GSHP adoption is high first costs, as previously discussed. The two main factors contributing
to higher first costs are complexities associated with the ground loop, and limited production volume of the other
parts. One would expect both of these two go down as GSHPs gain market acceptance. Other barriers include:
• Complexity: The need for a ground loop adds significant complexity and risk to GSHP installations, and may necessitate site-specific design.
• Economics compared to ASHPs: Top of the line ASHPs may have more attractive economics than GSHPs, despite higher total savings from GSHPs. It may be especially true as advances in ASHPs make them more suitable for colder climates. The lifetime and payback period for GSHPs are also typically longer than for ASHPs.
• Site limitations: GSHP installation may be infeasible for a specific location, based on soil type, proximity to water, space constraints, and availability of drillers.
• Limited number of qualified, trained installers. • Potential for glycol or refrigerant leaks.
25 Regional Economic Research, Inc. 2010 26 Liu 2010 27 Regional Economic Research, Inc. 2010
31

5 Bibliography ______. 2003. Improve Energy Efficiency with Desuperheaters. On stampededrive.net.
http://stampededrive.net/PDF/BuilderGuide3E.pdf
ACEEE. 2002. Toward Market Transformation: Commercial Heat Pump Water Heaters for the New York Energy $mart Region, Final Report. Prepared for NYSERDA. http://library.cee1.org/sites/default/files/library/1159/325.pdf
Amarnath, Ammi and Morton Blatt. 2008. Variable Refrigerant Flow: An Emerging Air Conditioner and Heat Pump Technology. 2008 ACEEE Summer Study Conference. http://www.aceee.org/files/proceedings/2008/data/papers/3_228.pdf
ASHRAE. June 2012. Commercial GSHP Performance. ASHRAE Journal
Bhatia, A. 2011. HVAC Variable Refrigerant Flow Systems. CED Engineering. http://www.seedengr.com/Variable%20Refrigerant%20Flow%20Systems.pdf
Denali Commission. May 31, 2011. Ground Source Heat Pumps in Cold Climates. http://cchrc.org/docs/reports/Ground-Source-Heat-Pumps-in-Cold-Climates.pdf
DOE. June 24, 2012. Geothermal Heat Pumps. http://energy.gov/energysaver/articles/geothermal-heat-pumps.
Ecotope Inc. 2014. Final Summary Report for the Ductless Heat Pump Impact and Process Evaluation. Prepared for the Northwest Energy Efficiency Alliance. http://neea.org/docs/default-source/reports/e14-274-dhp-final-summary-report-(final).pdf?sfvrsn=8
ETSAP and IRENA. January 2013. Heat Pumps: Technology Brief. IEA-ETSAP and IRENA Technology Brief E12. http://www.irena.org/DocumentDownloads/Publications/IRENA-ETSAP%20Tech%20Brief%20E12%20Heat%20Pumps.pdf
Geothermal Heat Pump Consortium. 2004, revised 2007. Information for Evaluating Geoexchange Applications. Prepared for the New York State Research and Development Authority (NYSERDA). http://www.nyserda.ny.gov/en/Page-Sections/Renewables/~/media/Files/EERP/Residential/Geothermal/geothermal-manual.ashx
Heat Pump and Thermal Storage Technology Center of Japan. 2007. Heat pumps: Long Awaited Way out of the Global Warming. http://www.hptcj.or.jp/e/publication/tabid/356/Default.aspx
International Energy Agency. 2011. Technology Roadmap, Energy-efficient Buildings: Heating and Cooling Equipment. https://www.iea.org/publications/freepublications/publication/buildings_roadmap.pdf
KEMA Inc. June 2009. Ductless Mini Pilot Study Final Report. http://rtf.nwcouncil.org/meetings/2009/11/Conn%20-%20Mass%204%20Ductless%20Mini%20Pilot.pdf
32

Landwehr, Frank. April 23, 2012. Trends to Watch in Ductless. The Air Conditioning Heating and Refrigeration News. http://www.achrnews.com/articles/119825-trends-to-watch-in-ductless
Liu, Xiaobing. September 2010. Assessment of National Benefits from Retrofitting Existing Single-Family Homes with Ground Source Heat Pump Systems. NEPI. http://btric.ornl.gov/pdfs/Liu_GSHP_Report_8-30-2010.pdf
NAHB Research Center. June 2008. Ductless Heat Pump Market Research and Analysis. Northwest Energy Efficiency Alliance. http://neea.org/docs/reports/residentialductless.pdf
Navigant Consulting, Inc. February 3, 2009. Ground-Source Heat Pumps: Overview of Market Status, Barriers to Adoptions, and Options for Overcoming Barriers. http://www1.eere.energy.gov/geothermal/pdfs/gshp_overview.pdf
Navigant Consulting, Inc. October 2012. Research and Development Roadmap: Geothermal (Ground-Source) Heat Pumps. EERE. http://www1.eere.energy.gov/buildings/pdfs/ghp_rd_roadmap2012.pdf
Navigant Consulting, Inc. September 2012. Energy Savings Potential and RD&D Opportunities for Residential Building HVAC Systems. Prepared for U.S. Department of Energy, Office of Energy Efficiency and Renewable Energy, Building Technologies Office. http://www1.eere.energy.gov/buildings/pdfs/residential_hvac_research_opportunities.pdf
Northeast Energy Efficiency Partnerships. 2014. Northeast/Mid-Atlantic Air-Source Heat Pump Market Strategies Report. http://www.neep.org/Assets/uploads/files/market-strategies/emerging-tech/ASHP/ASHP%20Report_FINAL%20(2).pdf
Olszewski, M., and E. C. Fontana. 1983. Heat Pump Desuperheaters for Supplying Domestic Hot Water – Estimation of Energy Savings and Economic Viability for Residential Applications. ORNL. http://rtf.nwcouncil.org/meetings/2008/08/ornl_con_114.pdf
Regional Economic Research, Inc. September 2010. Ground-Source Heat Pump Market Assessment. NEEA. http://neea.org/docs/reports/ground-sourceheatpumpmarketassessment.pdf
Rocky Mountain Institute. 2013. Heat Pumps: An alternative to oil heat for the Northeast—Input for planners and policy-makers. http://www.rmi.org/Knowledge-Center/Library/2013-05_HeatPumps
Rogers, Tom. 2011. Super Energy Savers Ground Source Heat Pump. DOE and ORNL. http://www.ornl.gov/adm/partnerships/events/Dec_Spark/Rogers_Spark%2011.23%20GSHP%20rev6.pdf
Roth, K., N. Sehgal, and C. Akers. March 2013. Ductless Mini-Split Heat Pump Comfort Evaluation. http://apps1.eere.energy.gov/buildings/publications/pdfs/building_america/ductless_minisplit_hp.pdf
33

Steven Winter Associates, Inc. 2012. Heat Pump Water Heaters: Evaluation of Field Installed Performance. Prepared for National Grid and NSTAR. http://ma-eeac.org/wordpress/wp-content/uploads/Heat-Pump-Water-heaters-Evaluation-of-Field-INstalled-Performance.pdf
Storm, Poppy, D. Baylon, A. Armstrong, J. Harris. 2012. Integrated Ductless Heat Pump Analysis: Developing an Emerging Technology into a Regional Efficiency Resource. ACEEE 2012 Summer Study on Energy Efficiency in Buildings. http://www.aceee.org/files/proceedings/2012/data/papers/0193-000064.pdf
34

Appendix A: Measure Screening, Year One Table A-1 shows the Total Resource costs, benefits, net benefits, and benefit-cost ratio (BCR) for each heat pump measure.
Measures with “oil” in the name actually refer to aggregated petroleum fuels (oil, kerosene, and propane).
Gray shading of BCRs indicates measures that did not pass cost-effectiveness in year one.
Primary Fuel: G = Gas, O = Petroleum Fuels, E = Electric
Zone: NYC = New York City, LI = Long Island, HV = Hudson Valley, UP = Upstate
Market: MD = Market Driven, RET = Retrofit, REPL = Natural Replacement
Table A-1. Total Resources Costs, Benefits, Net Benefits, and Benefit-Cost Ratio for Each Heat Pump Measure
# Measure Name Prim
ary
Fuel
Zone
Sect
or
Mar
ket
Total Resource Benefits
Total Resource Costs
Total Resource Net Benefits
Total Resource
BCR 1 Com Boiler/unitary AC to ASHP - Gas Heat G NYC Com RET $ 2,874,508,285 $ 11,086,130,944 $ (8,211,622,659) 0.26 2 Com Boiler/unitary AC to ASHP - Gas Heat G NYC Com NC $ 12,957,458 $ 69,602,727 $ (56,645,270) 0.19 5 Com Boiler/unitary AC to ASHP - Oil Heat O NYC Com RET $ 2,743,813,229 $ 2,421,472,288 $ 322,340,941 1.13 6 Com Boiler/unitary AC to ASHP - Oil Heat O NYC Com NC $ 57,505,552 $ 24,507,670 $ 32,997,882 2.35 9 Com Boiler/Chiller to ASHP - Gas Heat G NYC Com RET $ 19,979,059 $ 7,000,551,632 $ (6,980,572,574) 0.00
10 Com Boiler/Chiller to ASHP - Gas Heat G NYC Com NC $ (15,722,575) $ (25,112,517) $ 9,389,942 0.63 13 Com Boiler/Chiller to ASHP - Oil Heat O NYC Com RET $ 1,062,340,332 $ 1,529,085,473 $ (466,745,141) 0.69 14 Com Boiler/Chiller to ASHP - Oil Heat O NYC Com NC $ 23,903,488 $ (9,206,445) $ 33,109,933 -2.60 17 Com Boiler/CAC to DMSHP - Gas Heat G NYC Com RET $ 189,322,479 $ 1,037,107,741 $ (847,785,262) 0.18 18 Com Boiler/CAC to DMSHP - Gas Heat G NYC Com NC $ 1,556,817 $ 11,796,307 $ (10,239,490) 0.13 21 Com Boiler/CAC to DMSHP - Oil Heat O NYC Com RET $ 138,205,941 $ 226,528,774 $ (88,322,833) 0.61 22 Com Boiler/CAC to DMSHP - Oil Heat O NYC Com NC $ 3,002,554 $ 4,059,062 $ (1,056,509) 0.74 25 Com Boiler/RoomAC to DMSHP - Gas Heat G NYC Com RET $ 312,368,837 $ 1,703,647,905 $ (1,391,279,068) 0.18 26 Com Boiler/RoomAC to DMSHP - Gas Heat G NYC Com NC $ 3,521,363 $ 23,758,646 $ (20,237,283) 0.15 29 Com Boiler/RoomAC to DMSHP - Oil Heat O NYC Com RET $ 244,558,122 $ 372,116,856 $ (127,558,734) 0.66 30 Com Boiler/RoomAC to DMSHP - Oil Heat O NYC Com NC $ 5,206,662 $ 8,108,022 $ (2,901,359) 0.64 33 Com Boiler/Unitary AC to VRF - Gas Heat G NYC Com RET $ 4,614,734,405 $ 13,283,680,919 $ (8,668,946,514) 0.35
A-1

# Measure Name Prim
ary
Fuel
Zone
Sect
or
Mar
ket
Total Resource Benefits
Total Resource Costs
Total Resource Net Benefits
Total Resource
BCR 34 Com Boiler/Unitary AC to VRF - Gas Heat G NYC Com NC $ 48,341,598 $ 123,208,392 $ (74,866,793) 0.39 37 Com Boiler/Unitary AC to VRF - Oil Heat O NYC Com RET $ 3,123,919,629 $ 2,901,468,996 $ 222,450,632 1.08 38 Com Boiler/Unitary AC to VRF - Oil Heat O NYC Com NC $ 65,794,560 $ 42,324,365 $ 23,470,195 1.55 41 Com Boiler/Chiller to VRF - Gas Heat G NYC Com RET $ 1,444,159,596 $ 8,183,736,610 $ (6,739,577,014) 0.18 42 Com Boiler/Chiller to VRF - Gas Heat G NYC Com NC $ 10,709,287 $ 14,945,582 $ (4,236,295) 0.72 45 Com Boiler/Chiller to VRF - Oil Heat O NYC Com RET $ 1,373,414,928 $ 1,787,520,959 $ (414,106,030) 0.77 46 Com Boiler/Chiller to VRF - Oil Heat O NYC Com NC $ 29,956,968 $ 5,243,984 $ 24,712,984 5.71 49 Com Boiler/Unitary AC to GSHP - Gas Heat G NYC Com RET $ 5,148,499,457 $ 37,959,494,753 $ (32,810,995,296) 0.14 50 Com Boiler/Unitary AC to GSHP - Gas Heat G NYC Com NC $ 43,871,037 $ 295,178,784 $ (251,307,747) 0.15 53 Com Boiler/Unitary AC to GSHP - Oil Heat O NYC Com RET $ 4,611,380,860 $ 8,291,248,323 $ (3,679,867,463) 0.56 54 Com Boiler/Unitary AC to GSHP - Oil Heat O NYC Com NC $ 93,303,606 $ 100,364,364 $ (7,060,758) 0.93 57 Com Boiler/Chiller to GSHP - Gas Heat G NYC Com RET $ 926,413,969 $ 23,275,179,701 $ (22,348,765,732) 0.04 58 Com Boiler/Chiller to GSHP - Gas Heat G NYC Com NC $ (6,468,564) $ 116,299,970 $ (122,768,534) -0.06 61 Com Boiler/Chiller to GSHP - Oil Heat O NYC Com RET $ 1,945,764,262 $ 5,083,847,821 $ (3,138,083,558) 0.38 62 Com Boiler/Chiller to GSHP - Oil Heat O NYC Com NC $ 38,734,031 $ 40,105,603 $ (1,371,571) 0.97 65 High-eff HP CEE Tier II -Cool E NYC Com RET $ 65,617,863 $ 101,386,066 $ (35,768,203) 0.65 66 High-eff HP CEE Tier II -Cool E NYC Com NC $ 527,180 $ 230,508 $ 296,672 2.29 67 High-eff HP CEE Tier II -Cool E NYC Com REPL $ 2,094,593 $ 916,817 $ 1,177,777 2.28 71 Com Heat Pump Water Htr replace Oil O NYC Com NC $ 18,411,733 $ 5,555,866 $ 12,855,866 3.31 72 Com Heat Pump Water Htr replace Oil O NYC Com REPL $ 61,895,470 $ 18,677,382 $ 43,218,087 3.31 73 Res FF Heat/CAC to ASHP - Gas Heat G NYC Res RET $ 643,042,026 $ 6,235,626,329 $ (5,592,584,304) 0.10 74 Res FF Heat/CAC to ASHP - Gas Heat G NYC Res NC $ 7,829,108 $ 28,520,347 $ (20,691,239) 0.27 77 Res FF Heat/CAC to ASHP - Oil Heat O NYC Res RET $ 3,008,407,013 $ 1,872,329,000 $ 1,136,078,013 1.61 78 Res FF Heat/CAC to ASHP - Oil Heat O NYC Res NC $ 51,032,630 $ 9,476,183 $ 41,556,447 5.39 81 Res FFHeat/CAC to DMSHP - Gas Heat G NYC Res RET $ 2,623,678,611 $ 11,005,734,067 $ (8,382,055,455) 0.24 82 Res FFHeat/CAC to DMSHP - Gas Heat G NYC Res NC $ 22,207,776 $ 107,050,230 $ (84,842,454) 0.21 85 Res FFHeat/CAC to DMSHP - Oil Heat O NYC Res RET $ 3,456,943,109 $ 3,304,616,725 $ 152,326,383 1.05 86 Res FFHeat/CAC to DMSHP - Oil Heat O NYC Res NC $ 55,648,101 $ 35,527,318 $ 20,120,783 1.57 89 Res FFHeat/Room AC to DMSHP - Gas Heat G NYC Res RET $ 1,555,795,304 $ 7,128,368,450 $ (5,572,573,145) 0.22 90 Res FFHeat/Room AC to DMSHP - Gas Heat G NYC Res NC $ 16,266,924 $ 92,159,360 $ (75,892,436) 0.18 93 Res FFHeat/Room AC to DMSHP - Oil Heat O NYC Res RET $ 2,297,109,407 $ 2,140,386,589 $ 156,722,818 1.07 94 Res FFHeat/Room AC to DMSHP - Oil Heat O NYC Res NC $ 36,721,308 $ 30,566,119 $ 6,155,189 1.20 97 Res FF Heat/CAC to GSHP - Gas Heat G NYC Res RET $ 4,683,666,534 $ 20,724,689,928 $ (16,041,023,394) 0.23 98 Res FF Heat/CAC to GSHP - Gas Heat G NYC Res NC $ 39,426,609 $ 133,195,573 $ (93,768,963) 0.30 101 Res FF Heat/CAC to GSHP - Oil Heat O NYC Res RET $ 6,026,791,357 $ 6,222,861,333 $ (196,069,976) 0.97
A-2

# Measure Name Prim
ary
Fuel
Zone
Sect
or
Mar
ket
Total Resource Benefits
Total Resource Costs
Total Resource Net Benefits
Total Resource
BCR 102 Res FF Heat/CAC to GSHP - Oil Heat O NYC Res NC $ 92,469,053 $ 44,171,221 $ 48,297,832 2.09 105 Res Resist Heat/Room AC to DMSHP -Heat E NYC Res RET $ 218,825,744 $ 151,013,938 $ 67,811,806 1.45 106 Res Resist Heat/Room AC to DMSHP -Heat E NYC Res NC $ 4,108,647 $ 1,843,575 $ 2,265,072 2.23 109 Air Source Heat Pump ESTAR -Cool E NYC Res NC $ 78,245 $ 97,875 $ (19,629) 0.80 110 Air Source Heat Pump ESTAR -Cool E NYC Res REPL $ 291,378 $ 364,475 $ (73,097) 0.80 113 Res Heat Pump Water Htr replace Oil O NYC Res NC $ 18,641,660 $ 5,330,303 $ 13,311,357 3.50 114 Res Heat Pump Water Htr replace Oil O NYC Res REPL $ 91,557,365 $ 26,179,453 $ 65,377,912 3.50 116 Com Boiler/unitary AC to ASHP - Gas Heat G LI Com RET $ 719,923,009 $ 2,427,998,945 $ (1,708,075,936) 0.30 117 Com Boiler/unitary AC to ASHP - Gas Heat G LI Com NC $ 2,191,693 $ 9,079,646 $ (6,887,952) 0.24 120 Com Boiler/unitary AC to ASHP - Oil Heat O LI Com RET $ 1,074,518,665 $ 755,210,678 $ 319,307,987 1.42 121 Com Boiler/unitary AC to ASHP - Oil Heat O LI Com NC $ 9,284,268 $ 2,839,555 $ 6,444,713 3.27 124 Com Boiler/Chiller to ASHP - Gas Heat G LI Com RET $ 80,032,998 $ 1,440,966,533 $ (1,360,933,535) 0.06 125 Com Boiler/Chiller to ASHP - Gas Heat G LI Com NC $ (3,458,459) $ (3,606,264) $ 147,805 0.96 128 Com Boiler/Chiller to ASHP - Oil Heat O LI Com RET $ 450,189,691 $ 448,201,724 $ 1,987,967 1.00 129 Com Boiler/Chiller to ASHP - Oil Heat O LI Com NC $ 3,225,552 $ (1,129,042) $ 4,354,593 -2.86 132 Com Boiler/CAC to DMSHP - Gas Heat G LI Com RET $ 43,959,708 $ 242,173,728 $ (198,214,020) 0.18 133 Com Boiler/CAC to DMSHP - Gas Heat G LI Com NC $ 322,890 $ 1,813,111 $ (1,490,221) 0.18 136 Com Boiler/CAC to DMSHP - Oil Heat O LI Com RET $ 53,378,186 $ 75,326,303 $ (21,948,118) 0.71 137 Com Boiler/CAC to DMSHP - Oil Heat O LI Com NC $ 530,421 $ 566,728 $ (36,307) 0.94 140 Com Boiler/RoomAC to DMSHP - Gas Heat G LI Com RET $ 69,263,083 $ 398,676,847 $ (329,413,764) 0.17 141 Com Boiler/RoomAC to DMSHP - Gas Heat G LI Com NC $ 728,243 $ 3,767,546 $ (3,039,302) 0.19 144 Com Boiler/RoomAC to DMSHP - Oil Heat O LI Com RET $ 92,426,430 $ 124,005,413 $ (31,578,983) 0.75 145 Com Boiler/RoomAC to DMSHP - Oil Heat O LI Com NC $ 943,162 $ 1,177,421 $ (234,259) 0.80 148 Com Boiler/Unitary AC to VRF - Gas Heat G LI Com RET $ 1,046,896,382 $ 3,117,526,190 $ (2,070,629,808) 0.34 149 Com Boiler/Unitary AC to VRF - Gas Heat G LI Com NC $ 8,775,517 $ 19,160,436 $ (10,384,919) 0.46 152 Com Boiler/Unitary AC to VRF - Oil Heat O LI Com RET $ 1,176,221,256 $ 969,682,904 $ 206,538,352 1.21 153 Com Boiler/Unitary AC to VRF - Oil Heat O LI Com NC $ 11,333,213 $ 5,989,024 $ 5,344,189 1.89 156 Com Boiler/Chiller to VRF - Gas Heat G LI Com RET $ 342,424,213 $ 1,844,313,438 $ (1,501,889,226) 0.19 157 Com Boiler/Chiller to VRF - Gas Heat G LI Com NC $ 1,496,243 $ 2,165,493 $ (669,251) 0.69 160 Com Boiler/Chiller to VRF - Oil Heat O LI Com RET $ 531,804,491 $ 573,659,723 $ (41,855,232) 0.93 161 Com Boiler/Chiller to VRF - Oil Heat O LI Com NC $ 4,767,222 $ 677,223 $ 4,089,999 7.04 164 Com Boiler/Unitary AC to GSHP - Gas Heat G LI Com RET $ 1,208,533,504 $ 8,931,217,182 $ (7,722,683,678) 0.14 165 Com Boiler/Unitary AC to GSHP - Gas Heat G LI Com NC $ 11,159,305 $ 47,047,951 $ (35,888,646) 0.24 168 Com Boiler/Unitary AC to GSHP - Oil Heat O LI Com RET $ 1,779,710,485 $ 2,777,987,446 $ (998,276,961) 0.64 169 Com Boiler/Unitary AC to GSHP - Oil Heat O LI Com NC $ 17,657,012 $ 14,702,137 $ 2,954,875 1.20
A-3

y
Total
Fuel
Zone ecto
r
kM
aret
Total Resource Total Resource Total Resource Resource # Measure Name Pr
imar
S Benefits Costs Net Benefits BCR 172 Com Boiler/Chiller to GSHP - Gas Heat G LI Com RET $ 271,804,498 $ 5,292,995,462 $ (5,021,190,964) 0.05 173 Com Boiler/Chiller to GSHP - Gas Heat G LI Com NC $ 658,739 $ 17,647,779 $ (16,989,040) 0.04 176 Com Boiler/Chiller to GSHP - Oil Heat O LI Com RET $ 786,445,377 $ 1,646,346,141 $ (859,900,764) 0.48 177 Com Boiler/Chiller to GSHP - Oil Heat O LI Com NC $ 7,294,982 $ 5,516,471 $ 1,778,512 1.32 180 High-eff HP CEE Tier II -Cool E LI Com RET $ 19,258,690 $ 40,225,690 $ (20,967,000) 0.48 181 High-eff HP CEE Tier II -Cool E LI Com NC $ 170,530 $ 103,903 $ 66,627 1.64 182 High-eff HP CEE Tier II -Cool E LI Com REPL $ 632,885 $ 385,411 $ 247,474 1.64 186 Com Heat Pump Water Htr replace Oil O LI Com NC $ 2,889,676 $ 737,457 $ 2,152,218 3.92 187 Com Heat Pump Water Htr replace Oil O LI Com REPL $ 23,823,851 $ 6,079,947 $ 17,743,904 3.92 188 Res FF Heat/CAC to ASHP - Gas Heat G LI Res RET $ 124,652,084 $ 1,805,929,436 $ (1,681,277,352) 0.07 189 Res FF Heat/CAC to ASHP - Gas Heat G LI Res NC $ 1,485,928 $ 8,244,626 $ (6,758,699) 0.18 192 Res FF Heat/CAC to ASHP - Oil Heat O LI Res RET $ 1,665,616,178 $ 1,061,154,494 $ 604,461,683 1.57 193 Res FF Heat/CAC to ASHP - Oil Heat O LI Res NC $ 28,364,956 $ 5,360,683 $ 23,004,273 5.29 196 Res FFHeat/CAC to DMSHP - Gas Heat G LI Res RET $ 678,003,770 $ 3,191,236,488 $ (2,513,232,718) 0.21 197 Res FFHeat/CAC to DMSHP - Gas Heat G LI Res NC $ 5,034,674 $ 30,990,130 $ (25,955,457) 0.16 200 Res FFHeat/CAC to DMSHP - Oil Heat O LI Res RET $ 1,908,100,059 $ 1,875,153,522 $ 32,946,537 1.02 201 Res FFHeat/CAC to DMSHP - Oil Heat O LI Res NC $ 30,601,512 $ 20,125,576 $ 10,475,936 1.52 204 Res FFHeat/Room AC to DMSHP - Gas Heat G LI Res RET $ 387,129,222 $ 2,067,278,957 $ (1,680,149,735) 0.19 205 Res FFHeat/Room AC to DMSHP - Gas Heat G LI Res NC $ 3,682,482 $ 26,711,604 $ (23,029,122) 0.14 208 Res FFHeat/Room AC to DMSHP - Oil Heat O LI Res RET $ 1,262,516,395 $ 1,214,722,077 $ 47,794,317 1.04 209 Res FFHeat/Room AC to DMSHP - Oil Heat O LI Res NC $ 20,131,864 $ 17,335,646 $ 2,796,218 1.16 212 Res FF Heat/CAC to GSHP - Gas Heat G LI Res RET $ 1,122,755,969 $ 6,013,926,925 $ (4,891,170,956) 0.19 213 Res FF Heat/CAC to GSHP - Gas Heat G LI Res NC $ 7,303,777 $ 38,593,891 $ (31,290,114) 0.19 216 Res FF Heat/CAC to GSHP - Oil Heat O LI Res RET $ 3,277,072,402 $ 3,533,751,352 $ (256,678,951) 0.93 217 Res FF Heat/CAC to GSHP - Oil Heat O LI Res NC $ 49,775,632 $ 25,044,096 $ 24,731,536 1.99 220 Res Resist Heat/Room AC to DMSHP -Heat E LI Res RET $ 97,895,323 $ 73,559,704 $ 24,335,619 1.33 221 Res Resist Heat/Room AC to DMSHP -Heat E LI Res NC $ 1,846,600 $ 898,208 $ 948,392 2.06 224 Air Source Heat Pump ESTAR -Cool E LI Res NC $ 27,095 $ 39,472 $ (12,377) 0.69 225 Air Source Heat Pump ESTAR -Cool E LI Res REPL $ 100,899 $ 146,988 $ (46,090) 0.69 228 Res Heat Pump Water Htr replace Oil O LI Res NC $ 10,853,291 $ 2,690,508 $ 8,162,784 4.03 229 Res Heat Pump Water Htr replace Oil O LI Res REPL $ 53,305,271 $ 13,214,262 $ 40,091,010 4.03 231 Com Boiler/unitary AC to ASHP - Gas Heat G HV Com RET $ 407,771,252 $ 871,572,220 $ (463,800,969) 0.47 232 Com Boiler/unitary AC to ASHP - Gas Heat G HV Com NC $ 1,636,180 $ 3,076,503 $ (1,440,323) 0.53 235 Com Boiler/unitary AC to ASHP - Oil Heat O HV Com RET $ 835,371,076 $ 465,340,499 $ 370,030,577 1.80 236 Com Boiler/unitary AC to ASHP - Oil Heat O HV Com NC $ 9,077,233 $ 2,043,258 $ 7,033,975 4.44
A-4

y
Total
Fuel
Zone ecto
r
kM
aret
Total Resource Total Resource Total Resource Resource # Measure Name Pr
imar
S Benefits Costs Net Benefits BCR 239 Com Boiler/Chiller to ASHP - Gas Heat G HV Com RET $ 43,265,251 $ 473,994,930 $ (430,729,680) 0.09 240 Com Boiler/Chiller to ASHP - Gas Heat G HV Com NC $ (1,508,467) $ (1,367,235) $ (141,232) 1.10 243 Com Boiler/Chiller to ASHP - Oil Heat O HV Com RET $ 331,928,829 $ 253,070,293 $ 78,858,536 1.31 244 Com Boiler/Chiller to ASHP - Oil Heat O HV Com NC $ 3,296,446 $ (952,014) $ 4,248,460 -3.46 247 Com Boiler/CAC to DMSHP - Gas Heat G HV Com RET $ 26,674,090 $ 93,539,558 $ (66,865,468) 0.29 248 Com Boiler/CAC to DMSHP - Gas Heat G HV Com NC $ 198,471 $ 698,202 $ (499,731) 0.28 251 Com Boiler/CAC to DMSHP - Oil Heat O HV Com RET $ 43,378,554 $ 49,941,639 $ (6,563,085) 0.87 252 Com Boiler/CAC to DMSHP - Oil Heat O HV Com NC $ 511,677 $ 453,319 $ 58,357 1.13 255 Com Boiler/RoomAC to DMSHP - Gas Heat G HV Com RET $ 41,918,832 $ 154,378,390 $ (112,459,558) 0.27 256 Com Boiler/RoomAC to DMSHP - Gas Heat G HV Com NC $ 427,894 $ 1,480,035 $ (1,052,142) 0.29 259 Com Boiler/RoomAC to DMSHP - Oil Heat O HV Com RET $ 73,852,372 $ 82,424,056 $ (8,571,684) 0.90 260 Com Boiler/RoomAC to DMSHP - Oil Heat O HV Com NC $ 904,642 $ 953,754 $ (49,112) 0.95 263 Com Boiler/Unitary AC to VRF - Gas Heat G HV Com RET $ 575,656,029 $ 1,203,269,365 $ (627,613,336) 0.48 264 Com Boiler/Unitary AC to VRF - Gas Heat G HV Com NC $ 4,678,719 $ 7,404,696 $ (2,725,977) 0.63 267 Com Boiler/Unitary AC to VRF - Oil Heat O HV Com RET $ 925,006,317 $ 642,436,683 $ 282,569,634 1.44 268 Com Boiler/Unitary AC to VRF - Oil Heat O HV Com NC $ 10,736,831 $ 4,816,197 $ 5,920,634 2.23 271 Com Boiler/Chiller to VRF - Gas Heat G HV Com RET $ 180,645,216 $ 671,971,503 $ (491,326,287) 0.27 272 Com Boiler/Chiller to VRF - Gas Heat G HV Com NC $ 789,225 $ 798,083 $ (8,858) 0.99 275 Com Boiler/Chiller to VRF - Oil Heat O HV Com RET $ 405,277,268 $ 358,771,823 $ 46,505,444 1.13 276 Com Boiler/Chiller to VRF - Oil Heat O HV Com NC $ 4,540,784 $ 531,537 $ 4,009,247 8.54 279 Com Boiler/Unitary AC to GSHP - Gas Heat G HV Com RET $ 835,779,815 $ 3,492,000,770 $ (2,656,220,954) 0.24 280 Com Boiler/Unitary AC to GSHP - Gas Heat G HV Com NC $ 7,563,794 $ 18,513,041 $ (10,949,247) 0.41 283 Com Boiler/Unitary AC to GSHP - Oil Heat O HV Com RET $ 1,465,093,419 $ 1,864,411,625 $ (399,318,206) 0.79 284 Com Boiler/Unitary AC to GSHP - Oil Heat O HV Com NC $ 17,251,203 $ 11,891,369 $ 5,359,834 1.45 287 Com Boiler/Chiller to GSHP - Gas Heat G HV Com RET $ 271,407,471 $ 1,985,108,591 $ (1,713,701,120) 0.14 288 Com Boiler/Chiller to GSHP - Gas Heat G HV Com NC $ 1,573,069 $ 6,736,093 $ (5,163,024) 0.23 291 Com Boiler/Chiller to GSHP - Oil Heat O HV Com RET $ 654,338,377 $ 1,059,867,903 $ (405,529,526) 0.62 292 Com Boiler/Chiller to GSHP - Oil Heat O HV Com NC $ 7,369,025 $ 4,382,415 $ 2,986,610 1.68 295 High-eff HP CEE Tier II -Cool E HV Com RET $ 16,606,926 $ 40,525,412 $ (23,918,486) 0.41 296 High-eff HP CEE Tier II -Cool E HV Com NC $ 137,820 $ 92,915 $ 44,905 1.48 297 High-eff HP CEE Tier II -Cool E HV Com REPL $ 597,562 $ 403,342 $ 194,220 1.48 301 Com Heat Pump Water Htr replace Oil O HV Com NC $ 2,780,507 $ 691,738 $ 2,088,769 4.02 302 Com Heat Pump Water Htr replace Oil O HV Com REPL $ 18,018,075 $ 4,482,558 $ 13,535,517 4.02 303 Res FF Heat/CAC to ASHP - Gas Heat G HV Res RET $ 123,823,486 $ 797,559,420 $ (673,735,934) 0.16 304 Res FF Heat/CAC to ASHP - Gas Heat G HV Res NC $ 1,685,165 $ 3,615,042 $ (1,929,877) 0.47
A-5

y
Total
Fuel
Zone ecto
r
kM
aret
Total Resource Total Resource Total Resource Resource # Measure Name Pr
imar
S Benefits Costs Net Benefits BCR 307 Res FF Heat/CAC to ASHP - Oil Heat O HV Res RET $ 1,350,665,527 $ 879,166,438 $ 471,499,089 1.54 308 Res FF Heat/CAC to ASHP - Oil Heat O HV Res NC $ 22,942,645 $ 4,408,957 $ 18,533,688 5.20 311 Res FFHeat/CAC to DMSHP - Gas Heat G HV Res RET $ 409,082,043 $ 1,416,221,555 $ (1,007,139,512) 0.29 312 Res FFHeat/CAC to DMSHP - Gas Heat G HV Res NC $ 3,253,801 $ 13,676,865 $ (10,423,065) 0.24 315 Res FFHeat/CAC to DMSHP - Oil Heat O HV Res RET $ 1,597,228,992 $ 1,561,130,656 $ 36,098,336 1.02 316 Res FFHeat/CAC to DMSHP - Oil Heat O HV Res NC $ 24,783,650 $ 16,651,967 $ 8,131,684 1.49 319 Res FFHeat/Room AC to DMSHP - Gas Heat G HV Res RET $ 228,400,630 $ 917,837,189 $ (689,436,559) 0.25 320 Res FFHeat/Room AC to DMSHP - Gas Heat G HV Res NC $ 2,337,781 $ 11,836,518 $ (9,498,737) 0.20 323 Res FFHeat/Room AC to DMSHP - Oil Heat O HV Res RET $ 1,040,982,794 $ 1,011,751,140 $ 29,231,654 1.03 324 Res FFHeat/Room AC to DMSHP - Oil Heat O HV Res NC $ 16,354,982 $ 14,397,997 $ 1,956,984 1.14 327 Res FF Heat/CAC to GSHP - Gas Heat G HV Res RET $ 635,173,345 $ 2,677,236,611 $ (2,042,063,266) 0.24 328 Res FF Heat/CAC to GSHP - Gas Heat G HV Res NC $ 4,115,902 $ 17,103,518 $ (12,987,616) 0.24 331 Res FF Heat/CAC to GSHP - Oil Heat O HV Res RET $ 2,694,875,741 $ 2,951,173,941 $ (256,298,200) 0.91 332 Res FF Heat/CAC to GSHP - Oil Heat O HV Res NC $ 39,287,112 $ 20,801,222 $ 18,485,890 1.89 335 Res Resist Heat/Room AC to DMSHP -Heat E HV Res RET $ 94,196,782 $ 74,649,937 $ 19,546,844 1.26 336 Res Resist Heat/Room AC to DMSHP -Heat E HV Res NC $ 1,763,347 $ 906,670 $ 856,677 1.94 339 Air Source Heat Pump ESTAR -Cool E HV Res NC $ 22,400 $ 35,173 $ (12,773) 0.64 340 Air Source Heat Pump ESTAR -Cool E HV Res REPL $ 83,415 $ 130,981 $ (47,566) 0.64 343 Res Heat Pump Water Htr replace Oil O HV Res NC $ 7,944,914 $ 1,926,406 $ 6,018,508 4.12 344 Res Heat Pump Water Htr replace Oil O HV Res REPL $ 39,020,957 $ 9,461,427 $ 29,559,530 4.12 346 Com Boiler/unitary AC to ASHP - Gas Heat G UP Com RET $ 1,234,199,298 $ 3,117,768,246 $ (1,883,568,948) 0.40 347 Com Boiler/unitary AC to ASHP - Gas Heat G UP Com NC $ 2,709,650 $ 9,151,158 $ (6,441,508) 0.30 350 Com Boiler/unitary AC to ASHP - Oil Heat O UP Com RET $ 1,923,814,130 $ 663,333,105 $ 1,260,481,025 2.90 351 Com Boiler/unitary AC to ASHP - Oil Heat O UP Com NC $ 22,329,984 $ 2,439,130 $ 19,890,854 9.15 354 Com Boiler/Chiller to ASHP - Gas Heat G UP Com RET $ (27,986,250) $ 1,631,015,428 $ (1,659,001,678) -0.02 355 Com Boiler/Chiller to ASHP - Gas Heat G UP Com NC $ (5,933,941) $ (6,598,004) $ 664,064 0.90 358 Com Boiler/Chiller to ASHP - Oil Heat O UP Com RET $ 824,659,265 $ 347,013,133 $ 477,646,132 2.38 359 Com Boiler/Chiller to ASHP - Oil Heat O UP Com NC $ 9,614,242 $ (1,805,111) $ 11,419,353 -5.33 362 Com Boiler/CAC to DMSHP - Gas Heat G UP Com RET $ 81,984,845 $ 369,810,779 $ (287,825,934) 0.22 363 Com Boiler/CAC to DMSHP - Gas Heat G UP Com NC $ 415,105 $ 2,621,978 $ (2,206,874) 0.16 366 Com Boiler/CAC to DMSHP - Oil Heat O UP Com RET $ 97,877,525 $ 78,680,554 $ 19,196,972 1.24 367 Com Boiler/CAC to DMSHP - Oil Heat O UP Com NC $ 1,165,594 $ 688,961 $ 476,634 1.69 370 Com Boiler/RoomAC to DMSHP - Gas Heat G UP Com RET $ 125,427,943 $ 612,030,592 $ (486,602,650) 0.20 371 Com Boiler/RoomAC to DMSHP - Gas Heat G UP Com NC $ 996,070 $ 5,611,150 $ (4,615,081) 0.18 374 Com Boiler/RoomAC to DMSHP - Oil Heat O UP Com RET $ 165,121,516 $ 130,214,987 $ 34,906,529 1.27
A-6

y
Total
Fuel
Zone ecto
r
kM
aret
Total Resource Total Resource Total Resource Resource # Measure Name Pr
imar
S Benefits Costs Net Benefits BCR 375 Com Boiler/RoomAC to DMSHP - Oil Heat O UP Com NC $ 2,007,384 $ 1,467,036 $ 540,348 1.37 378 Com Boiler/Unitary AC to VRF - Gas Heat G UP Com RET $ 1,841,868,360 $ 4,764,885,257 $ (2,923,016,897) 0.39 379 Com Boiler/Unitary AC to VRF - Gas Heat G UP Com NC $ 11,242,099 $ 28,033,076 $ (16,790,977) 0.40 382 Com Boiler/Unitary AC to VRF - Oil Heat O UP Com RET $ 2,053,101,163 $ 1,013,771,994 $ 1,039,329,169 2.03 383 Com Boiler/Unitary AC to VRF - Oil Heat O UP Com NC $ 24,227,088 $ 7,392,460 $ 16,834,628 3.28 386 Com Boiler/Chiller to VRF - Gas Heat G UP Com RET $ 449,541,381 $ 2,547,529,925 $ (2,097,988,545) 0.18 387 Com Boiler/Chiller to VRF - Gas Heat G UP Com NC $ 295,008 $ 3,022,474 $ (2,727,466) 0.10 390 Com Boiler/Chiller to VRF - Oil Heat O UP Com RET $ 926,257,543 $ 542,009,797 $ 384,247,746 1.71 391 Com Boiler/Chiller to VRF - Oil Heat O UP Com NC $ 10,980,381 $ 810,466 $ 10,169,915 13.55 394 Com Boiler/Unitary AC to GSHP - Gas Heat G UP Com RET $ 2,925,690,713 $ 13,893,944,916 $ (10,968,254,202) 0.21 395 Com Boiler/Unitary AC to GSHP - Gas Heat G UP Com NC $ 19,835,927 $ 69,565,844 $ (49,729,917) 0.29 398 Com Boiler/Unitary AC to GSHP - Oil Heat O UP Com RET $ 3,367,522,630 $ 2,956,061,160 $ 411,461,470 1.14 399 Com Boiler/Unitary AC to GSHP - Oil Heat O UP Com NC $ 39,725,258 $ 18,147,729 $ 21,577,529 2.19 402 Com Boiler/Chiller to GSHP - Gas Heat G UP Com RET $ 920,000,839 $ 7,596,588,848 $ (6,676,588,009) 0.12 403 Com Boiler/Chiller to GSHP - Gas Heat G UP Com NC $ 2,896,870 $ 25,079,643 $ (22,182,774) 0.12 406 Com Boiler/Chiller to GSHP - Oil Heat O UP Com RET $ 1,568,266,284 $ 1,616,242,282 $ (47,975,998) 0.97 407 Com Boiler/Chiller to GSHP - Oil Heat O UP Com NC $ 18,265,994 $ 6,598,793 $ 11,667,200 2.77 410 High-eff HP CEE Tier II -Cool E UP Com RET $ 53,087,118 $ 128,204,094 $ (75,116,977) 0.41 411 High-eff HP CEE Tier II -Cool E UP Com NC $ 343,110 $ 231,954 $ 111,156 1.48 412 High-eff HP CEE Tier II -Cool E UP Com REPL $ 1,921,374 $ 1,301,114 $ 620,260 1.48 416 Com Heat Pump Water Htr replace Oil O UP Com NC $ 7,743,122 $ 1,860,942 $ 5,882,180 4.16 417 Com Heat Pump Water Htr replace Oil O UP Com REPL $ 49,517,999 $ 11,900,900 $ 37,617,099 4.16 418 Res FF Heat/CAC to ASHP - Gas Heat G UP Res RET $ (104,939,915) $ 4,668,715,849 $ (4,773,655,764) -0.02 419 Res FF Heat/CAC to ASHP - Gas Heat G UP Res NC $ (2,603,480) $ 20,938,534 $ (23,542,014) -0.12 422 Res FF Heat/CAC to ASHP - Oil Heat O UP Res RET $ 5,767,144,815 $ 2,094,954,306 $ 3,672,190,509 2.75 423 Res FF Heat/CAC to ASHP - Oil Heat O UP Res NC $ 98,783,525 $ 10,397,835 $ 88,385,690 9.50 426 Res FFHeat/CAC to DMSHP - Gas Heat G UP Res RET $ 1,740,363,046 $ 8,342,060,757 $ (6,601,697,711) 0.21 427 Res FFHeat/CAC to DMSHP - Gas Heat G UP Res NC $ 9,095,166 $ 79,576,285 $ (70,481,119) 0.11 430 Res FFHeat/CAC to DMSHP - Oil Heat O UP Res RET $ 6,435,307,752 $ 3,743,264,030 $ 2,692,043,722 1.72 431 Res FFHeat/CAC to DMSHP - Oil Heat O UP Res NC $ 104,474,381 $ 39,486,114 $ 64,988,267 2.65 434 Res FFHeat/Room AC to DMSHP - Gas Heat G UP Res RET $ 890,774,746 $ 5,415,016,250 $ (4,524,241,505) 0.16 435 Res FFHeat/Room AC to DMSHP - Gas Heat G UP Res NC $ 6,809,777 $ 69,520,948 $ (62,711,171) 0.10 438 Res FFHeat/Room AC to DMSHP - Oil Heat O UP Res RET $ 4,178,961,859 $ 2,429,835,522 $ 1,749,126,337 1.72 439 Res FFHeat/Room AC to DMSHP - Oil Heat O UP Res NC $ 68,311,263 $ 34,482,016 $ 33,829,247 1.98 442 Res FF Heat/CAC to GSHP - Gas Heat G UP Res RET $ 2,826,792,062 $ 15,831,856,069 $ (13,005,064,006) 0.18
A-7

# Measure Name Prim
ary
Fuel
Zone
Sect
or
Mar
ket
Total Resource Benefits
Total Resource Costs
Total Resource Net Benefits
Total Resource
BCR 443 Res FF Heat/CAC to GSHP - Gas Heat G UP Res NC $ 9,928,558 $ 99,795,140 $ (89,866,583) 0.10 446 Res FF Heat/CAC to GSHP - Oil Heat O UP Res RET $ 10,836,951,937 $ 7,104,098,025 $ 3,732,853,912 1.53 447 Res FF Heat/CAC to GSHP - Oil Heat O UP Res NC $ 169,985,441 $ 49,493,926 $ 120,491,515 3.43 450 Res Resist Heat/Room AC to DMSHP -Heat E UP Res RET $ 396,045,199 $ 348,593,112 $ 47,452,087 1.14 451 Res Resist Heat/Room AC to DMSHP -Heat E UP Res NC $ 7,547,723 $ 4,279,586 $ 3,268,137 1.76 454 Air Source Heat Pump ESTAR -Cool E UP Res NC $ 84,439 $ 141,277 $ (56,838) 0.60 455 Air Source Heat Pump ESTAR -Cool E UP Res REPL $ 314,442 $ 526,102 $ (211,660) 0.60 458 Res Heat Pump Water Htr replace Oil O UP Res NC $ 26,543,931 $ 6,239,125 $ 20,304,806 4.25 459 Res Heat Pump Water Htr replace Oil O UP Res REPL $ 130,368,882 $ 30,643,079 $ 99,725,803 4.25
A-8

Appendix B: Measure Screening, Year One, BCR Comparison by Zone Table B-1 shows the same Benefit-Cost Ratios (BCRs) as Appendix A, but consolidated for comparison of BCRs by zone.
Gray shading indicates measures that did not pass cost-effectiveness in year one.
Primary Fuel: G = Gas, O = Petroleum Fuels, E = Electric
Zone: NYC = New York City, LI = Long Island, HV = Hudson Valley, UP = Upstate
Market: MD = Market Driven, RET = Retrofit, REPL = Natural Replacement
Table B-1. Benefit-Cost Ratios consolidated by Zone
# Prim
ary
Fuel
Sect
or
Mar
ket
NYC LI HV UP 1 Com Boiler/unitary AC to ASHP - Gas Heat G Com RET 0.26 0.30 0.47 0.40 2 Com Boiler/unitary AC to ASHP - Gas Heat G Com NC 0.19 0.24 0.53 0.30 5 Com Boiler/unitary AC to ASHP - Oil Heat O Com RET 1.13 1.42 1.80 2.90 6 Com Boiler/unitary AC to ASHP - Oil Heat O Com NC 2.35 3.27 4.44 9.15 9 Com Boiler/Chiller to ASHP - Gas Heat G Com RET 0.00 0.06 0.09 -0.02
10 Com Boiler/Chiller to ASHP - Gas Heat G Com NC 0.63 0.96 1.10 0.90 13 Com Boiler/Chiller to ASHP - Oil Heat O Com RET 0.69 1.00 1.31 2.38 14 Com Boiler/Chiller to ASHP - Oil Heat O Com NC -2.60 -2.86 -3.46 -5.33 17 Com Boiler/CAC to DMSHP - Gas Heat G Com RET 0.18 0.18 0.29 0.22 18 Com Boiler/CAC to DMSHP - Gas Heat G Com NC 0.13 0.18 0.28 0.16 21 Com Boiler/CAC to DMSHP - Oil Heat O Com RET 0.61 0.71 0.87 1.24 22 Com Boiler/CAC to DMSHP - Oil Heat O Com NC 0.74 0.94 1.13 1.69 25 Com Boiler/RoomAC to DMSHP - Gas Heat G Com RET 0.18 0.17 0.27 0.20 26 Com Boiler/RoomAC to DMSHP - Gas Heat G Com NC 0.15 0.19 0.29 0.18 29 Com Boiler/RoomAC to DMSHP - Oil Heat O Com RET 0.66 0.75 0.90 1.27 30 Com Boiler/RoomAC to DMSHP - Oil Heat O Com NC 0.64 0.80 0.95 1.37 33 Com Boiler/Unitary AC to VRF - Gas Heat G Com RET 0.35 0.34 0.48 0.39 34 Com Boiler/Unitary AC to VRF - Gas Heat G Com NC 0.39 0.46 0.63 0.40 37 Com Boiler/Unitary AC to VRF - Oil Heat O Com RET 1.08 1.21 1.44 2.03 38 Com Boiler/Unitary AC to VRF - Oil Heat O Com NC 1.55 1.89 2.23 3.28 41 Com Boiler/Chiller to VRF - Gas Heat G Com RET 0.18 0.19 0.27 0.18 42 Com Boiler/Chiller to VRF - Gas Heat G Com NC 0.72 0.69 0.99 0.10 45 Com Boiler/Chiller to VRF - Oil Heat O Com RET 0.77 0.93 1.13 1.71 46 Com Boiler/Chiller to VRF - Oil Heat O Com NC 5.71 7.04 8.54 13.55 49 Com Boiler/Unitary AC to GSHP - Gas Heat G Com RET 0.14 0.14 0.24 0.21 50 Com Boiler/Unitary AC to GSHP - Gas Heat G Com NC 0.15 0.24 0.41 0.29 53 Com Boiler/Unitary AC to GSHP - Oil Heat O Com RET 0.56 0.64 0.79 1.14 54 Com Boiler/Unitary AC to GSHP - Oil Heat O Com NC 0.93 1.20 1.45 2.19 57 Com Boiler/Chiller to GSHP - Gas Heat G Com RET 0.04 0.05 0.14 0.12 58 Com Boiler/Chiller to GSHP - Gas Heat G Com NC -0.06 0.04 0.23 0.12
B-1

# Prim
ary
Fuel
Sect
or
Mar
ket
NYC LI HV UP 61 Com Boiler/Chiller to GSHP - Oil Heat O Com RET 0.38 0.48 0.62 0.97 62 Com Boiler/Chiller to GSHP - Oil Heat O Com NC 0.97 1.32 1.68 2.77 65 High-eff HP CEE Tier II -Cool E Com RET 0.65 0.48 0.41 0.41 66 High-eff HP CEE Tier II -Cool E Com NC 2.29 1.64 1.48 1.48 67 High-eff HP CEE Tier II -Cool E Com REPL 2.28 1.64 1.48 1.48 71 Com Heat Pump Water Htr replace Oil O Com NC 3.31 3.92 4.02 4.16 72 Com Heat Pump Water Htr replace Oil O Com REPL 3.31 3.92 4.02 4.16 73 Res FF Heat/CAC to ASHP - Gas Heat G Res RET 0.10 0.07 0.16 -0.02 74 Res FF Heat/CAC to ASHP - Gas Heat G Res NC 0.27 0.18 0.47 -0.12 77 Res FF Heat/CAC to ASHP - Oil Heat O Res RET 1.61 1.57 1.54 2.75 78 Res FF Heat/CAC to ASHP - Oil Heat O Res NC 5.39 5.29 5.20 9.50 81 Res FFHeat/CAC to DMSHP - Gas Heat G Res RET 0.24 0.21 0.29 0.21 82 Res FFHeat/CAC to DMSHP - Gas Heat G Res NC 0.21 0.16 0.24 0.11 85 Res FFHeat/CAC to DMSHP - Oil Heat O Res RET 1.05 1.02 1.02 1.72 86 Res FFHeat/CAC to DMSHP - Oil Heat O Res NC 1.57 1.52 1.49 2.65 89 Res FFHeat/Room AC to DMSHP - Gas Heat G Res RET 0.22 0.19 0.25 0.16 90 Res FFHeat/Room AC to DMSHP - Gas Heat G Res NC 0.18 0.14 0.20 0.10 93 Res FFHeat/Room AC to DMSHP - Oil Heat O Res RET 1.07 1.04 1.03 1.72 94 Res FFHeat/Room AC to DMSHP - Oil Heat O Res NC 1.20 1.16 1.14 1.98 97 Res FF Heat/CAC to GSHP - Gas Heat G Res RET 0.23 0.19 0.24 0.18 98 Res FF Heat/CAC to GSHP - Gas Heat G Res NC 0.30 0.19 0.24 0.10 101 Res FF Heat/CAC to GSHP - Oil Heat O Res RET 0.97 0.93 0.91 1.53 102 Res FF Heat/CAC to GSHP - Oil Heat O Res NC 2.09 1.99 1.89 3.43 105 Res Resist Heat/Room AC to DMSHP -Heat E Res RET 1.45 1.33 1.26 1.14 106 Res Resist Heat/Room AC to DMSHP -Heat E Res NC 2.23 2.06 1.94 1.76 109 Air Source Heat Pump ESTAR -Cool E Res NC 0.80 0.69 0.64 0.60 110 Air Source Heat Pump ESTAR -Cool E Res REPL 0.80 0.69 0.64 0.60 113 Res Heat Pump Water Htr replace Oil O Res NC 3.50 4.03 4.12 4.25 114 Res Heat Pump Water Htr replace Oil O Res REPL 3.50 4.03 4.12 4.25
B-2

Appendix C: Measure Screening, BCRs for Selected Years Table C-1 shows the Benefit-Cost Ratios (BCRs) for each measure for selected years.
Gray shading of BCRs indicates measures that did not pass cost-effectiveness.
Primary Fuel: G = Gas, O = Petroleum Fuels, E = Electric
Zone: NYC = New York City, LI = Long Island, HV = Hudson Valley, UP = Upstate
Market: MD = Market Driven, RET = Retrofit, REPL = Natural Replacement
Table C-1. Benefit-Cost Ratios by Zone for Selected Years
# Measure Name Prim
ary
Fuel
Zone
Sect
or
Mar
ket
2015 2020 2025 2030 2034 1 Com Boiler/unitary AC to ASHP - Gas Heat G NYC Com RET 0.26 0.29 0.31 0.32 0.35 2 Com Boiler/unitary AC to ASHP - Gas Heat G NYC Com NC 0.19 0.25 0.29 0.31 0.36 5 Com Boiler/unitary AC to ASHP - Oil Heat O NYC Com RET 1.13 1.21 1.27 1.32 1.36 6 Com Boiler/unitary AC to ASHP - Oil Heat O NYC Com NC 2.35 2.53 2.67 2.77 2.86 9 Com Boiler/Chiller to ASHP - Gas Heat G NYC Com RET 0.00 0.03 0.03 0.03 0.04
10 Com Boiler/Chiller to ASHP - Gas Heat G NYC Com NC 0.63 0.53 0.52 0.55 0.54 13 Com Boiler/Chiller to ASHP - Oil Heat O NYC Com RET 0.69 0.76 0.79 0.82 0.84 14 Com Boiler/Chiller to ASHP - Oil Heat O NYC Com NC (2.60) (2.84) (3.00) (3.10) (3.19) 17 Com Boiler/CAC to DMSHP - Gas Heat G NYC Com RET 0.18 0.20 0.22 0.24 0.26 18 Com Boiler/CAC to DMSHP - Gas Heat G NYC Com NC 0.13 0.16 0.18 0.21 0.23 21 Com Boiler/CAC to DMSHP - Oil Heat O NYC Com RET 0.61 0.65 0.69 0.73 0.76 22 Com Boiler/CAC to DMSHP - Oil Heat O NYC Com NC 0.74 0.80 0.85 0.89 0.93 25 Com Boiler/RoomAC to DMSHP - Gas Heat G NYC Com RET 0.18 0.20 0.23 0.25 0.28 26 Com Boiler/RoomAC to DMSHP - Gas Heat G NYC Com NC 0.15 0.17 0.20 0.22 0.25 29 Com Boiler/RoomAC to DMSHP - Oil Heat O NYC Com RET 0.66 0.70 0.75 0.79 0.82 30 Com Boiler/RoomAC to DMSHP - Oil Heat O NYC Com NC 0.64 0.69 0.74 0.78 0.81 33 Com Boiler/Unitary AC to VRF - Gas Heat G NYC Com RET 0.35 0.38 0.41 0.44 0.48 34 Com Boiler/Unitary AC to VRF - Gas Heat G NYC Com NC 0.39 0.44 0.50 0.55 0.60 37 Com Boiler/Unitary AC to VRF - Oil Heat O NYC Com RET 1.08 1.14 1.21 1.27 1.32 38 Com Boiler/Unitary AC to VRF - Oil Heat O NYC Com NC 1.55 1.67 1.77 1.86 1.92 41 Com Boiler/Chiller to VRF - Gas Heat G NYC Com RET 0.18 0.20 0.21 0.22 0.24 42 Com Boiler/Chiller to VRF - Gas Heat G NYC Com NC 0.72 0.86 0.98 1.04 1.15 45 Com Boiler/Chiller to VRF - Oil Heat O NYC Com RET 0.77 0.82 0.86 0.90 0.93 46 Com Boiler/Chiller to VRF - Oil Heat O NYC Com NC 5.71 6.13 6.48 6.73 6.93 49 Com Boiler/Unitary AC to GSHP - Gas Heat G NYC Com RET 0.14 0.15 0.17 0.19 0.21 50 Com Boiler/Unitary AC to GSHP - Gas Heat G NYC Com NC 0.15 0.18 0.22 0.27 0.30 53 Com Boiler/Unitary AC to GSHP - Oil Heat O NYC Com RET 0.56 0.59 0.62 0.66 0.68 54 Com Boiler/Unitary AC to GSHP - Oil Heat O NYC Com NC 0.93 0.99 1.06 1.12 1.16 57 Com Boiler/Chiller to GSHP - Gas Heat G NYC Com RET 0.04 0.05 0.06 0.08 0.09 58 Com Boiler/Chiller to GSHP - Gas Heat G NYC Com NC (0.06) (0.02) 0.01 0.05 0.08 61 Com Boiler/Chiller to GSHP - Oil Heat O NYC Com RET 0.38 0.41 0.43 0.45 0.47 62 Com Boiler/Chiller to GSHP - Oil Heat O NYC Com NC 0.97 1.04 1.11 1.17 1.21 65 High-eff HP CEE Tier II -Cool E NYC Com RET 0.65 0.66 0.70 0.76 0.81
C-1

# Measure Name Prim
ary
Fuel
Zone
Sect
or
Mar
ket
2015 2020 2025 2030 2034 66 High-eff HP CEE Tier II -Cool E NYC Com NC 2.29 2.37 2.60 2.87 3.06 67 High-eff HP CEE Tier II -Cool E NYC Com REPL 2.28 2.37 2.59 2.86 3.05 71 Com Heat Pump Water Htr replace Oil O NYC Com NC 3.31 3.77 4.08 4.27 4.39 72 Com Heat Pump Water Htr replace Oil O NYC Com REPL 3.31 3.77 4.08 4.27 4.39 73 Res FF Heat/CAC to ASHP - Gas Heat G NYC Res RET 0.10 0.14 0.18 0.20 0.25 74 Res FF Heat/CAC to ASHP - Gas Heat G NYC Res NC 0.27 0.41 0.52 0.60 0.73 77 Res FF Heat/CAC to ASHP - Oil Heat O NYC Res RET 1.61 1.73 1.83 1.92 1.99 78 Res FF Heat/CAC to ASHP - Oil Heat O NYC Res NC 5.39 5.80 6.15 6.42 6.64 81 Res FFHeat/CAC to DMSHP - Gas Heat G NYC Res RET 0.24 0.26 0.29 0.31 0.34 82 Res FFHeat/CAC to DMSHP - Gas Heat G NYC Res NC 0.21 0.25 0.29 0.32 0.36 85 Res FFHeat/CAC to DMSHP - Oil Heat O NYC Res RET 1.05 1.12 1.18 1.24 1.28 86 Res FFHeat/CAC to DMSHP - Oil Heat O NYC Res NC 1.57 1.68 1.78 1.86 1.93 89 Res FFHeat/Room AC to DMSHP - Gas Heat G NYC Res RET 0.22 0.25 0.27 0.30 0.33 90 Res FFHeat/Room AC to DMSHP - Gas Heat G NYC Res NC 0.18 0.21 0.24 0.27 0.30 93 Res FFHeat/Room AC to DMSHP - Oil Heat O NYC Res RET 1.07 1.15 1.21 1.27 1.31 94 Res FFHeat/Room AC to DMSHP - Oil Heat O NYC Res NC 1.20 1.29 1.37 1.43 1.48 97 Res FF Heat/CAC to GSHP - Gas Heat G NYC Res RET 0.23 0.25 0.27 0.29 0.31 98 Res FF Heat/CAC to GSHP - Gas Heat G NYC Res NC 0.30 0.35 0.40 0.45 0.50
101 Res FF Heat/CAC to GSHP - Oil Heat O NYC Res RET 0.97 1.02 1.07 1.11 1.15 102 Res FF Heat/CAC to GSHP - Oil Heat O NYC Res NC 2.09 2.22 2.33 2.44 2.51 105 Res Resist Heat/Room AC to DMSHP -Heat E NYC Res RET 1.45 1.47 1.53 1.59 1.58 106 Res Resist Heat/Room AC to DMSHP -Heat E NYC Res NC 2.23 2.26 2.34 2.42 2.41 109 Air Source Heat Pump ESTAR -Cool E NYC Res NC 0.80 0.85 0.92 1.00 1.06 110 Air Source Heat Pump ESTAR -Cool E NYC Res REPL 0.80 0.85 0.92 1.00 1.06 113 Res Heat Pump Water Htr replace Oil O NYC Res NC 3.50 3.92 4.24 4.45 4.59 114 Res Heat Pump Water Htr replace Oil O NYC Res REPL 3.50 3.92 4.24 4.45 4.59 116 Com Boiler/unitary AC to ASHP - Gas Heat G LI Com RET 0.30 0.31 0.35 0.40 0.44 117 Com Boiler/unitary AC to ASHP - Gas Heat G LI Com NC 0.24 0.27 0.36 0.46 0.55 120 Com Boiler/unitary AC to ASHP - Oil Heat O LI Com RET 1.42 1.50 1.60 1.69 1.75 121 Com Boiler/unitary AC to ASHP - Oil Heat O LI Com NC 3.27 3.47 3.70 3.93 4.07 124 Com Boiler/Chiller to ASHP - Gas Heat G LI Com RET 0.06 0.06 0.08 0.11 0.14 125 Com Boiler/Chiller to ASHP - Gas Heat G LI Com NC 0.96 1.00 0.97 0.90 0.82 128 Com Boiler/Chiller to ASHP - Oil Heat O LI Com RET 1.00 1.06 1.13 1.19 1.24 129 Com Boiler/Chiller to ASHP - Oil Heat O LI Com NC (2.86) (3.03) (3.24) (3.46) (3.61) 132 Com Boiler/CAC to DMSHP - Gas Heat G LI Com RET 0.18 0.19 0.23 0.26 0.29 133 Com Boiler/CAC to DMSHP - Gas Heat G LI Com NC 0.18 0.20 0.25 0.30 0.34 136 Com Boiler/CAC to DMSHP - Oil Heat O LI Com RET 0.71 0.75 0.81 0.86 0.90 137 Com Boiler/CAC to DMSHP - Oil Heat O LI Com NC 0.94 1.00 1.09 1.17 1.22 140 Com Boiler/RoomAC to DMSHP - Gas Heat G LI Com RET 0.17 0.19 0.22 0.26 0.29 141 Com Boiler/RoomAC to DMSHP - Gas Heat G LI Com NC 0.19 0.22 0.26 0.31 0.35 144 Com Boiler/RoomAC to DMSHP - Oil Heat O LI Com RET 0.75 0.79 0.85 0.91 0.95 145 Com Boiler/RoomAC to DMSHP - Oil Heat O LI Com NC 0.80 0.86 0.94 1.01 1.05 148 Com Boiler/Unitary AC to VRF - Gas Heat G LI Com RET 0.34 0.36 0.41 0.45 0.49 149 Com Boiler/Unitary AC to VRF - Gas Heat G LI Com NC 0.46 0.51 0.60 0.69 0.75 152 Com Boiler/Unitary AC to VRF - Oil Heat O LI Com RET 1.21 1.29 1.37 1.46 1.51 153 Com Boiler/Unitary AC to VRF - Oil Heat O LI Com NC 1.89 2.02 2.18 2.32 2.42 156 Com Boiler/Chiller to VRF - Gas Heat G LI Com RET 0.19 0.20 0.22 0.25 0.27 157 Com Boiler/Chiller to VRF - Gas Heat G LI Com NC 0.69 0.76 0.95 1.16 1.34
C-2

# Measure Name Prim
ary
Fuel
Zone
Sect
or
Mar
ket
2015 2020 2025 2030 2034 160 Com Boiler/Chiller to VRF - Oil Heat O LI Com RET 0.93 0.98 1.04 1.10 1.14 161 Com Boiler/Chiller to VRF - Oil Heat O LI Com NC 7.04 7.46 7.96 8.42 8.72 164 Com Boiler/Unitary AC to GSHP - Gas Heat G LI Com RET 0.14 0.15 0.18 0.20 0.22 165 Com Boiler/Unitary AC to GSHP - Gas Heat G LI Com NC 0.24 0.28 0.34 0.40 0.44 168 Com Boiler/Unitary AC to GSHP - Oil Heat O LI Com RET 0.64 0.68 0.72 0.76 0.79 169 Com Boiler/Unitary AC to GSHP - Oil Heat O LI Com NC 1.20 1.29 1.38 1.47 1.52 172 Com Boiler/Chiller to GSHP - Gas Heat G LI Com RET 0.05 0.06 0.08 0.09 0.11 173 Com Boiler/Chiller to GSHP - Gas Heat G LI Com NC 0.04 0.08 0.13 0.18 0.22 176 Com Boiler/Chiller to GSHP - Oil Heat O LI Com RET 0.48 0.51 0.54 0.57 0.59 177 Com Boiler/Chiller to GSHP - Oil Heat O LI Com NC 1.32 1.42 1.52 1.61 1.67 180 High-eff HP CEE Tier II -Cool E LI Com RET 0.48 0.51 0.53 0.55 0.56 181 High-eff HP CEE Tier II -Cool E LI Com NC 1.64 1.79 1.89 1.95 1.98 182 High-eff HP CEE Tier II -Cool E LI Com REPL 1.64 1.79 1.89 1.95 1.98 186 Com Heat Pump Water Htr replace Oil O LI Com NC 3.92 4.23 4.55 4.83 5.00 187 Com Heat Pump Water Htr replace Oil O LI Com REPL 3.92 4.23 4.55 4.83 5.00 188 Res FF Heat/CAC to ASHP - Gas Heat G LI Res RET 0.07 0.08 0.14 0.20 0.25 189 Res FF Heat/CAC to ASHP - Gas Heat G LI Res NC 0.18 0.22 0.39 0.60 0.78 192 Res FF Heat/CAC to ASHP - Oil Heat O LI Res RET 1.57 1.67 1.79 1.92 2.00 193 Res FF Heat/CAC to ASHP - Oil Heat O LI Res NC 5.29 5.62 6.04 6.44 6.72 196 Res FFHeat/CAC to DMSHP - Gas Heat G LI Res RET 0.21 0.23 0.26 0.30 0.33 197 Res FFHeat/CAC to DMSHP - Gas Heat G LI Res NC 0.16 0.18 0.23 0.29 0.34 200 Res FFHeat/CAC to DMSHP - Oil Heat O LI Res RET 1.02 1.08 1.15 1.22 1.27 201 Res FFHeat/CAC to DMSHP - Oil Heat O LI Res NC 1.52 1.62 1.73 1.84 1.91 204 Res FFHeat/Room AC to DMSHP - Gas Heat G LI Res RET 0.19 0.20 0.24 0.28 0.31 205 Res FFHeat/Room AC to DMSHP - Gas Heat G LI Res NC 0.14 0.16 0.20 0.24 0.28 208 Res FFHeat/Room AC to DMSHP - Oil Heat O LI Res RET 1.04 1.10 1.18 1.25 1.30 209 Res FFHeat/Room AC to DMSHP - Oil Heat O LI Res NC 1.16 1.24 1.33 1.41 1.46 212 Res FF Heat/CAC to GSHP - Gas Heat G LI Res RET 0.19 0.20 0.23 0.25 0.27 213 Res FF Heat/CAC to GSHP - Gas Heat G LI Res NC 0.19 0.23 0.28 0.34 0.38 216 Res FF Heat/CAC to GSHP - Oil Heat O LI Res RET 0.93 0.98 1.03 1.07 1.11 217 Res FF Heat/CAC to GSHP - Oil Heat O LI Res NC 1.99 2.10 2.22 2.33 2.40 220 Res Resist Heat/Room AC to DMSHP -Heat E LI Res RET 1.33 1.41 1.41 1.37 1.32 221 Res Resist Heat/Room AC to DMSHP -Heat E LI Res NC 2.06 2.17 2.17 2.10 2.02 224 Air Source Heat Pump ESTAR -Cool E LI Res NC 0.69 0.75 0.79 0.82 0.84 225 Air Source Heat Pump ESTAR -Cool E LI Res REPL 0.69 0.75 0.79 0.82 0.84 228 Res Heat Pump Water Htr replace Oil O LI Res NC 4.03 4.35 4.67 4.95 5.12 229 Res Heat Pump Water Htr replace Oil O LI Res REPL 4.03 4.35 4.67 4.95 5.12 231 Com Boiler/unitary AC to ASHP - Gas Heat G HV Com RET 0.47 0.51 0.56 0.62 0.67 232 Com Boiler/unitary AC to ASHP - Gas Heat G HV Com NC 0.53 0.63 0.76 0.89 1.00 235 Com Boiler/unitary AC to ASHP - Oil Heat O HV Com RET 1.80 1.91 2.03 2.13 2.21 236 Com Boiler/unitary AC to ASHP - Oil Heat O HV Com NC 4.44 4.75 5.07 5.36 5.54 239 Com Boiler/Chiller to ASHP - Gas Heat G HV Com RET 0.09 0.11 0.14 0.18 0.21 240 Com Boiler/Chiller to ASHP - Gas Heat G HV Com NC 1.10 1.08 1.03 0.94 0.85 243 Com Boiler/Chiller to ASHP - Oil Heat O HV Com RET 1.31 1.40 1.49 1.57 1.63 244 Com Boiler/Chiller to ASHP - Oil Heat O HV Com NC (3.46) (3.73) (4.00) (4.25) (4.43) 247 Com Boiler/CAC to DMSHP - Gas Heat G HV Com RET 0.29 0.31 0.35 0.39 0.42 248 Com Boiler/CAC to DMSHP - Gas Heat G HV Com NC 0.28 0.33 0.39 0.44 0.49 251 Com Boiler/CAC to DMSHP - Oil Heat O HV Com RET 0.87 0.93 1.00 1.06 1.10
C-3

# Measure Name Prim
ary
Fuel
Zone
Sect
or
Mar
ket
2015 2020 2025 2030 2034 252 Com Boiler/CAC to DMSHP - Oil Heat O HV Com NC 1.13 1.22 1.31 1.40 1.46 255 Com Boiler/RoomAC to DMSHP - Gas Heat G HV Com RET 0.27 0.30 0.35 0.39 0.42 256 Com Boiler/RoomAC to DMSHP - Gas Heat G HV Com NC 0.29 0.33 0.39 0.44 0.48 259 Com Boiler/RoomAC to DMSHP - Oil Heat O HV Com RET 0.90 0.96 1.04 1.10 1.15 260 Com Boiler/RoomAC to DMSHP - Oil Heat O HV Com NC 0.95 1.03 1.11 1.18 1.23 263 Com Boiler/Unitary AC to VRF - Gas Heat G HV Com RET 0.48 0.52 0.58 0.63 0.67 264 Com Boiler/Unitary AC to VRF - Gas Heat G HV Com NC 0.63 0.71 0.81 0.91 0.98 267 Com Boiler/Unitary AC to VRF - Oil Heat O HV Com RET 1.44 1.54 1.64 1.73 1.79 268 Com Boiler/Unitary AC to VRF - Oil Heat O HV Com NC 2.23 2.40 2.57 2.72 2.82 271 Com Boiler/Chiller to VRF - Gas Heat G HV Com RET 0.27 0.29 0.32 0.35 0.38 272 Com Boiler/Chiller to VRF - Gas Heat G HV Com NC 0.99 1.16 1.40 1.64 1.84 275 Com Boiler/Chiller to VRF - Oil Heat O HV Com RET 1.13 1.20 1.27 1.34 1.38 276 Com Boiler/Chiller to VRF - Oil Heat O HV Com NC 8.54 9.14 9.73 10.26 10.61 279 Com Boiler/Unitary AC to GSHP - Gas Heat G HV Com RET 0.24 0.27 0.29 0.32 0.34 280 Com Boiler/Unitary AC to GSHP - Gas Heat G HV Com NC 0.41 0.47 0.54 0.60 0.65 283 Com Boiler/Unitary AC to GSHP - Oil Heat O HV Com RET 0.79 0.83 0.88 0.93 0.96 284 Com Boiler/Unitary AC to GSHP - Oil Heat O HV Com NC 1.45 1.55 1.66 1.75 1.81 287 Com Boiler/Chiller to GSHP - Gas Heat G HV Com RET 0.14 0.15 0.18 0.20 0.21 288 Com Boiler/Chiller to GSHP - Gas Heat G HV Com NC 0.23 0.29 0.36 0.42 0.47 291 Com Boiler/Chiller to GSHP - Oil Heat O HV Com RET 0.62 0.66 0.69 0.73 0.75 292 Com Boiler/Chiller to GSHP - Oil Heat O HV Com NC 1.68 1.80 1.91 2.02 2.09 295 High-eff HP CEE Tier II -Cool E HV Com RET 0.41 0.43 0.44 0.45 0.45 296 High-eff HP CEE Tier II -Cool E HV Com NC 1.48 1.56 1.62 1.64 1.64 297 High-eff HP CEE Tier II -Cool E HV Com REPL 1.48 1.56 1.62 1.64 1.64 301 Com Heat Pump Water Htr replace Oil O HV Com NC 4.02 4.37 4.71 4.99 5.15 302 Com Heat Pump Water Htr replace Oil O HV Com REPL 4.02 4.37 4.71 4.99 5.15 303 Res FF Heat/CAC to ASHP - Gas Heat G HV Res RET 0.16 0.19 0.25 0.31 0.36 304 Res FF Heat/CAC to ASHP - Gas Heat G HV Res NC 0.47 0.59 0.77 0.96 1.12 307 Res FF Heat/CAC to ASHP - Oil Heat O HV Res RET 1.54 1.65 1.77 1.88 1.96 308 Res FF Heat/CAC to ASHP - Oil Heat O HV Res NC 5.20 5.59 6.00 6.37 6.61 311 Res FFHeat/CAC to DMSHP - Gas Heat G HV Res RET 0.29 0.32 0.35 0.39 0.42 312 Res FFHeat/CAC to DMSHP - Gas Heat G HV Res NC 0.24 0.28 0.33 0.38 0.43 315 Res FFHeat/CAC to DMSHP - Oil Heat O HV Res RET 1.02 1.09 1.17 1.23 1.27 316 Res FFHeat/CAC to DMSHP - Oil Heat O HV Res NC 1.49 1.60 1.71 1.81 1.87 319 Res FFHeat/Room AC to DMSHP - Gas Heat G HV Res RET 0.25 0.28 0.31 0.35 0.38 320 Res FFHeat/Room AC to DMSHP - Gas Heat G HV Res NC 0.20 0.23 0.27 0.31 0.35 323 Res FFHeat/Room AC to DMSHP - Oil Heat O HV Res RET 1.03 1.10 1.17 1.24 1.29 324 Res FFHeat/Room AC to DMSHP - Oil Heat O HV Res NC 1.14 1.22 1.31 1.38 1.43 327 Res FF Heat/CAC to GSHP - Gas Heat G HV Res RET 0.24 0.26 0.28 0.31 0.33 328 Res FF Heat/CAC to GSHP - Gas Heat G HV Res NC 0.24 0.29 0.34 0.40 0.43 331 Res FF Heat/CAC to GSHP - Oil Heat O HV Res RET 0.91 0.96 1.01 1.06 1.09 332 Res FF Heat/CAC to GSHP - Oil Heat O HV Res NC 1.89 2.01 2.12 2.22 2.29 335 Res Resist Heat/Room AC to DMSHP -Heat E HV Res RET 1.26 1.30 1.30 1.28 1.24 336 Res Resist Heat/Room AC to DMSHP -Heat E HV Res NC 1.94 2.00 2.00 1.95 1.88 339 Air Source Heat Pump ESTAR -Cool E HV Res NC 0.64 0.68 0.71 0.73 0.73 340 Air Source Heat Pump ESTAR -Cool E HV Res REPL 0.64 0.68 0.71 0.73 0.73 343 Res Heat Pump Water Htr replace Oil O HV Res NC 4.12 4.48 4.81 5.09 5.25 344 Res Heat Pump Water Htr replace Oil O HV Res REPL 4.12 4.48 4.81 5.09 5.25
C-4

# Measure Name Prim
ary
Fuel
Zone
Sect
or
Mar
ket
2015 2020 2025 2030 2034 346 Com Boiler/unitary AC to ASHP - Gas Heat G UP Com RET 0.40 0.43 0.49 0.57 0.63 347 Com Boiler/unitary AC to ASHP - Gas Heat G UP Com NC 0.30 0.36 0.55 0.78 0.97 350 Com Boiler/unitary AC to ASHP - Oil Heat O UP Com RET 2.90 3.07 3.26 3.44 3.55 351 Com Boiler/unitary AC to ASHP - Oil Heat O UP Com NC 9.15 9.72 10.35 10.93 11.31 354 Com Boiler/Chiller to ASHP - Gas Heat G UP Com RET (0.02) (0.02) 0.02 0.08 0.14 355 Com Boiler/Chiller to ASHP - Gas Heat G UP Com NC 0.90 0.93 0.86 0.73 0.61 358 Com Boiler/Chiller to ASHP - Oil Heat O UP Com RET 2.38 2.51 2.67 2.83 2.93 359 Com Boiler/Chiller to ASHP - Oil Heat O UP Com NC (5.33) (5.65) (6.03) (6.40) (6.64) 362 Com Boiler/CAC to DMSHP - Gas Heat G UP Com RET 0.22 0.24 0.28 0.33 0.37 363 Com Boiler/CAC to DMSHP - Gas Heat G UP Com NC 0.16 0.19 0.25 0.31 0.36 366 Com Boiler/CAC to DMSHP - Oil Heat O UP Com RET 1.24 1.33 1.42 1.50 1.56 367 Com Boiler/CAC to DMSHP - Oil Heat O UP Com NC 1.69 1.81 1.94 2.06 2.14 370 Com Boiler/RoomAC to DMSHP - Gas Heat G UP Com RET 0.20 0.23 0.27 0.32 0.36 371 Com Boiler/RoomAC to DMSHP - Gas Heat G UP Com NC 0.18 0.21 0.26 0.32 0.36 374 Com Boiler/RoomAC to DMSHP - Oil Heat O UP Com RET 1.27 1.36 1.45 1.54 1.60 375 Com Boiler/RoomAC to DMSHP - Oil Heat O UP Com NC 1.37 1.47 1.57 1.67 1.74 378 Com Boiler/Unitary AC to VRF - Gas Heat G UP Com RET 0.39 0.42 0.48 0.53 0.58 379 Com Boiler/Unitary AC to VRF - Gas Heat G UP Com NC 0.40 0.46 0.55 0.64 0.72 382 Com Boiler/Unitary AC to VRF - Oil Heat O UP Com RET 2.03 2.15 2.29 2.41 2.49 383 Com Boiler/Unitary AC to VRF - Oil Heat O UP Com NC 3.28 3.49 3.72 3.93 4.07 386 Com Boiler/Chiller to VRF - Gas Heat G UP Com RET 0.18 0.19 0.22 0.26 0.30 387 Com Boiler/Chiller to VRF - Gas Heat G UP Com NC 0.10 0.16 0.41 0.73 1.01 390 Com Boiler/Chiller to VRF - Oil Heat O UP Com RET 1.71 1.81 1.92 2.02 2.09 391 Com Boiler/Chiller to VRF - Oil Heat O UP Com NC 13.55 14.38 15.30 16.14 16.69 394 Com Boiler/Unitary AC to GSHP - Gas Heat G UP Com RET 0.21 0.24 0.27 0.30 0.32 395 Com Boiler/Unitary AC to GSHP - Gas Heat G UP Com NC 0.29 0.34 0.41 0.48 0.53 398 Com Boiler/Unitary AC to GSHP - Oil Heat O UP Com RET 1.14 1.21 1.27 1.33 1.37 399 Com Boiler/Unitary AC to GSHP - Oil Heat O UP Com NC 2.19 2.33 2.46 2.58 2.67 402 Com Boiler/Chiller to GSHP - Gas Heat G UP Com RET 0.12 0.14 0.16 0.19 0.21 403 Com Boiler/Chiller to GSHP - Gas Heat G UP Com NC 0.12 0.17 0.24 0.31 0.37 406 Com Boiler/Chiller to GSHP - Oil Heat O UP Com RET 0.97 1.03 1.08 1.13 1.16 407 Com Boiler/Chiller to GSHP - Oil Heat O UP Com NC 2.77 2.93 3.10 3.25 3.35 410 High-eff HP CEE Tier II -Cool E UP Com RET 0.41 0.44 0.46 0.46 0.46 411 High-eff HP CEE Tier II -Cool E UP Com NC 1.48 1.60 1.65 1.66 1.65 412 High-eff HP CEE Tier II -Cool E UP Com REPL 1.48 1.59 1.65 1.66 1.65 416 Com Heat Pump Water Htr replace Oil O UP Com NC 4.16 4.47 4.80 5.09 5.26 417 Com Heat Pump Water Htr replace Oil O UP Com REPL 4.16 4.47 4.80 5.09 5.26 418 Res FF Heat/CAC to ASHP - Gas Heat G UP Res RET (0.02) (0.00) 0.06 0.15 0.22 419 Res FF Heat/CAC to ASHP - Gas Heat G UP Res NC (0.12) (0.07) 0.15 0.44 0.69 422 Res FF Heat/CAC to ASHP - Oil Heat O UP Res RET 2.75 2.93 3.13 3.33 3.46 423 Res FF Heat/CAC to ASHP - Oil Heat O UP Res NC 9.50 10.11 10.80 11.47 11.92 426 Res FFHeat/CAC to DMSHP - Gas Heat G UP Res RET 0.21 0.23 0.27 0.32 0.36 427 Res FFHeat/CAC to DMSHP - Gas Heat G UP Res NC 0.11 0.14 0.20 0.27 0.34 430 Res FFHeat/CAC to DMSHP - Oil Heat O UP Res RET 1.72 1.83 1.94 2.05 2.12 431 Res FFHeat/CAC to DMSHP - Oil Heat O UP Res NC 2.65 2.82 3.00 3.17 3.29 434 Res FFHeat/Room AC to DMSHP - Gas Heat G UP Res RET 0.16 0.18 0.22 0.27 0.31 435 Res FFHeat/Room AC to DMSHP - Gas Heat G UP Res NC 0.10 0.12 0.17 0.22 0.27 438 Res FFHeat/Room AC to DMSHP - Oil Heat O UP Res RET 1.72 1.83 1.94 2.05 2.13
C-5
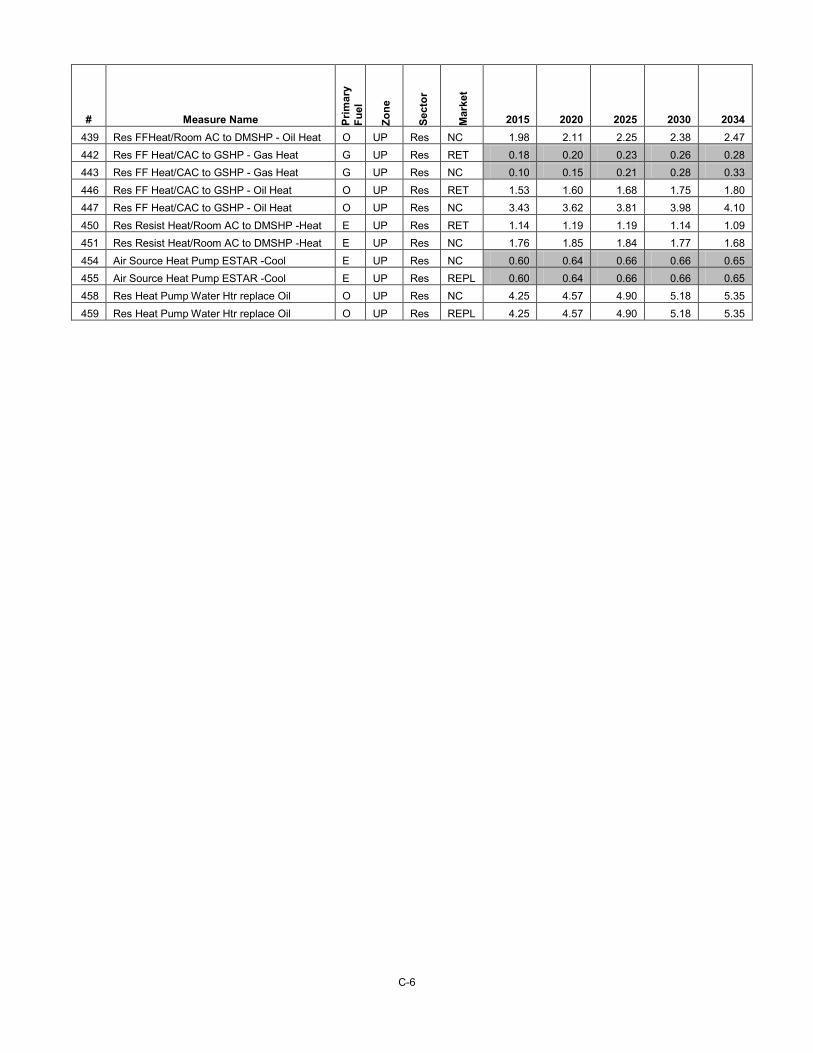
# Measure Name Prim
ary
Fuel
Zone
Sect
or
Mar
ket
2015 2020 2025 2030 2034 439 Res FFHeat/Room AC to DMSHP - Oil Heat O UP Res NC 1.98 2.11 2.25 2.38 2.47 442 Res FF Heat/CAC to GSHP - Gas Heat G UP Res RET 0.18 0.20 0.23 0.26 0.28 443 Res FF Heat/CAC to GSHP - Gas Heat G UP Res NC 0.10 0.15 0.21 0.28 0.33 446 Res FF Heat/CAC to GSHP - Oil Heat O UP Res RET 1.53 1.60 1.68 1.75 1.80 447 Res FF Heat/CAC to GSHP - Oil Heat O UP Res NC 3.43 3.62 3.81 3.98 4.10 450 Res Resist Heat/Room AC to DMSHP -Heat E UP Res RET 1.14 1.19 1.19 1.14 1.09 451 Res Resist Heat/Room AC to DMSHP -Heat E UP Res NC 1.76 1.85 1.84 1.77 1.68 454 Air Source Heat Pump ESTAR -Cool E UP Res NC 0.60 0.64 0.66 0.66 0.65 455 Air Source Heat Pump ESTAR -Cool E UP Res REPL 0.60 0.64 0.66 0.66 0.65 458 Res Heat Pump Water Htr replace Oil O UP Res NC 4.25 4.57 4.90 5.18 5.35 459 Res Heat Pump Water Htr replace Oil O UP Res REPL 4.25 4.57 4.90 5.18 5.35
C-6

Appendix D: Measure Characterizations The heat pump measures are modeled with separate heating (MMBtu saved, saved or increased kWh) and cooling (saved or increased kWh) components.
Table D-1 describes the measures assessed, and Table D-2 shows the combined costs and benefits for the two components of each heat pump measure.
Table D-1. Measure Descriptions
Meas # Mkt End Use Measure Long Name Heat Pump
Technology Heating Baseline Cooling Baseline Baseline Description Units for Costs & Savings Values
594 Ret Heating Com Boiler/unitary AC to ASHP - Gas Heat
Air Source Heat Pump C&I Ret
Boiler C&I Ret Unitary AC C&I Ret Standard efficiency boiler (AFUE 0.85) Per ton of heating
595 Ret Cooling Com Boiler/unitary AC to ASHP - Gas Cool
Air Source Heat Pump C&I Ret
Boiler C&I Ret Unitary AC C&I Ret Standard efficiency unitary AC (IPLV 10.7 for 15 ton, 9.7 for 25 ton)
Per ton of cooling
596 Ret Heating Com Boiler/unitary AC to ASHP - Oil Heat
Air Source Heat Pump C&I Ret
Boiler C&I Ret Unitary AC C&I Ret Standard efficiency boiler (AFUE 0.85) Per ton of heating
597 Ret Cooling Com Boiler/unitary AC to ASHP - Oil Cool
Air Source Heat Pump C&I Ret
Boiler C&I Ret Unitary AC C&I Ret Standard efficiency unitary AC (IPLV 10.7 for 15 ton, 9.7 for 25 ton)
Per ton of cooling
594 MD Heating Com Boiler/unitary AC to ASHP - Gas Heat
Air Source Heat Pump C&I NC
Boiler C&I NC Unitary AC C&I NC Standard efficiency boiler (AFUE 0.85) Per ton of heating
595 MD Cooling Com Boiler/unitary AC to ASHP - Gas Cool
Air Source Heat Pump C&I NC
Boiler C&I NC Unitary AC C&I NC Standard efficiency unitary AC (IPLV 13.0 for 15 ton, 12.7 for 25 ton)
Per ton of cooling
596 MD Heating Com Boiler/unitary AC to ASHP - Oil Heat
Air Source Heat Pump C&I NC
Boiler C&I NC Unitary AC C&I NC Standard efficiency boiler (AFUE 0.85) Per ton of heating
597 MD Cooling Com Boiler/unitary AC to ASHP - Oil Cool
Air Source Heat Pump C&I NC
Boiler C&I NC Unitary AC C&I NC Standard efficiency unitary AC (IPLV 13.0 for 15 ton, 12.7 for 25 ton)
Per ton of cooling
598 Ret Heating Res FF ASHP -
Heat/CAC to Gas Heat
Air Source Heat Pump Res Ret
gas furnace/boiler Res Ret
CAC Res Ret Standard efficiency boiler/furnace (average AFUE 0.79)
Per ton of heating
599 Ret Cooling Res FF ASHP -
Heat/CAC to Gas Cool
Air Source Heat Pump Res Ret
gas furnace/boiler Res Ret
CAC Res Ret Standard efficiency CAC (SEER 10.0) Per ton of cooling
600 Ret Heating Res FF ASHP -
Heat/CAC to Oil Heat
Air Source Heat Pump Res Ret
oil furnace/boiler Res Ret
CAC Res Ret Standard efficiency boiler/furnace (average AFUE 0.79)
Per ton of heating
601 Ret Cooling Res FF ASHP -
Heat/CAC to Oil Cool
Air Source Heat Pump Res Ret
oil furnace/boiler Res Ret
CAC Res Ret Standard efficiency CAC (SEER 10.0) Per ton of cooling
598 MD Heating Res FF ASHP -
Heat/CAC to Gas Heat
Air Source Heat Pump Res NC
gas furnace/boiler Res NC
CAC Res NC Standard efficiency boiler/furnace (average AFUE 0.81)
Per ton of heating
D-1

Meas # Mkt End Use Measure Long Name Heat Pump
Technology Heating Baseline Cooling Baseline Baseline Description Units for Costs & Savings Values
599 MD Cooling Res FF Heat/CAC to ASHP - Gas Cool
Air Source Heat Pump Res NC
gas furnace/boiler Res NC
CAC Res NC Standard efficiency CAC (SEER 14.0) Per ton of cooling
600 MD Heating Res FF Heat/CAC to ASHP - Oil Heat
Air Source Heat Pump Res NC
oil furnace/boiler Res NC
CAC Res NC Standard efficiency boiler/furnace (average AFUE 0.81)
Per ton of heating
601 MD Cooling Res FF Heat/CAC to ASHP - Oil Cool
Air Source Heat Pump Res NC
oil furnace/boiler Res NC
CAC Res NC Standard efficiency CAC (SEER 14.0) Per ton of cooling
602 Ret Heating Com Boiler/Chiller to ASHP - Gas Heat
Air Source Heat Pump C&I Ret
Boiler C&I Ret Chiller C&I Ret Standard efficiency boiler (AFUE 0.85) Per ton of heating
603 Ret Cooling Com Boiler/Chiller to ASHP - Gas Cool
Air Source Heat Pump C&I Ret
Boiler C&I Ret Chiller C&I Ret Standard efficiency chiller (COP 5 for 100 ton, 5.5 for 200 ton)
Per ton of cooling
604 Ret Heating Com Boiler/Chiller to ASHP - Oil Heat
Air Source Heat Pump C&I Ret
Boiler C&I Ret Chiller C&I Ret Standard efficiency boiler (AFUE 0.85) Per ton of heating
605 Ret Cooling Com Boiler/Chiller to ASHP - Oil Cool
Air Source Heat Pump C&I Ret
Boiler C&I Ret Chiller C&I Ret Standard efficiency chiller (COP 5 for 100 ton, 5.5 for 200 ton)
Per ton of cooling
602 MD Heating Com Boiler/Chiller to ASHP - Gas Heat
Air Source Heat Pump C&I NC
Boiler C&I NC Chiller C&I NC Standard efficiency boiler (AFUE 0.85) Per ton of heating
603 MD Cooling Com Boiler/Chiller to ASHP - Gas Cool
Air Source Heat Pump C&I NC
Boiler C&I NC Chiller C&I NC Standard efficiency chiller (IPLV 0.62 for 100 ton, 0.58 for 200 ton)
Per ton of cooling
604 MD Heating Com Boiler/Chiller to ASHP - Oil Heat
Air Source Heat Pump C&I NC
Boiler C&I NC Chiller C&I NC Standard efficiency boiler (AFUE 0.85) Per ton of heating
605 MD Cooling Com Boiler/Chiller to ASHP - Oil Cool
Air Source Heat Pump C&I NC
Boiler C&I NC Chiller C&I NC Standard efficiency chiller (IPLV 0.62 for 100 ton, 0.58 for 200 ton)
Per ton of cooling
606 Ret Heating Res FFHeat/CAC to DMSHP - Gas Heat
Ductless Mini Split Res Ret
gas furnace/boiler Res Ret
CAC Res Ret Standard efficiency boiler/furnace (average AFUE 0.79)
Per ton of heating
607 Ret Cooling Res FFHeat/CAC to DMSHP - Gas Cool
Ductless Mini Split Res Ret
gas furnace/boiler Res Ret
CAC Res Ret Standard efficiency CAC (SEER 10.0) Per ton of cooling
608 Ret Heating Res FFHeat/CAC to DMSHP - Oil Heat
Ductless Mini Split Res Ret
oil furnace/boiler Res Ret
CAC Res Ret Standard efficiency boiler/furnace (average AFUE 0.79)
Per ton of heating
609 Ret Cooling Res FFHeat/CAC to DMSHP - Oil Cool
Ductless Mini Split Res Ret
oil furnace/boiler Res Ret
CAC Res Ret Standard efficiency CAC (SEER 10.0) Per ton of cooling
606 MD Heating Res FFHeat/CAC to DMSHP - Gas Heat
Ductless Mini Split Res NC
gas furnace/boiler Res NC
CAC Res NC Standard efficiency boiler/furnace (average AFUE 0.81)
Per ton of heating
607 MD Cooling Res FFHeat/CAC to DMSHP - Gas Cool
Ductless Mini Split Res NC
gas furnace/boiler Res NC
CAC Res NC Standard efficiency CAC (SEER 14.0) Per ton of cooling
608 MD Heating Res FFHeat/CAC to DMSHP - Oil Heat
Ductless Mini Split Res NC
oil furnace/boiler Res NC
CAC Res NC Standard efficiency boiler/furnace (average AFUE 0.81)
Per ton of heating
D-2
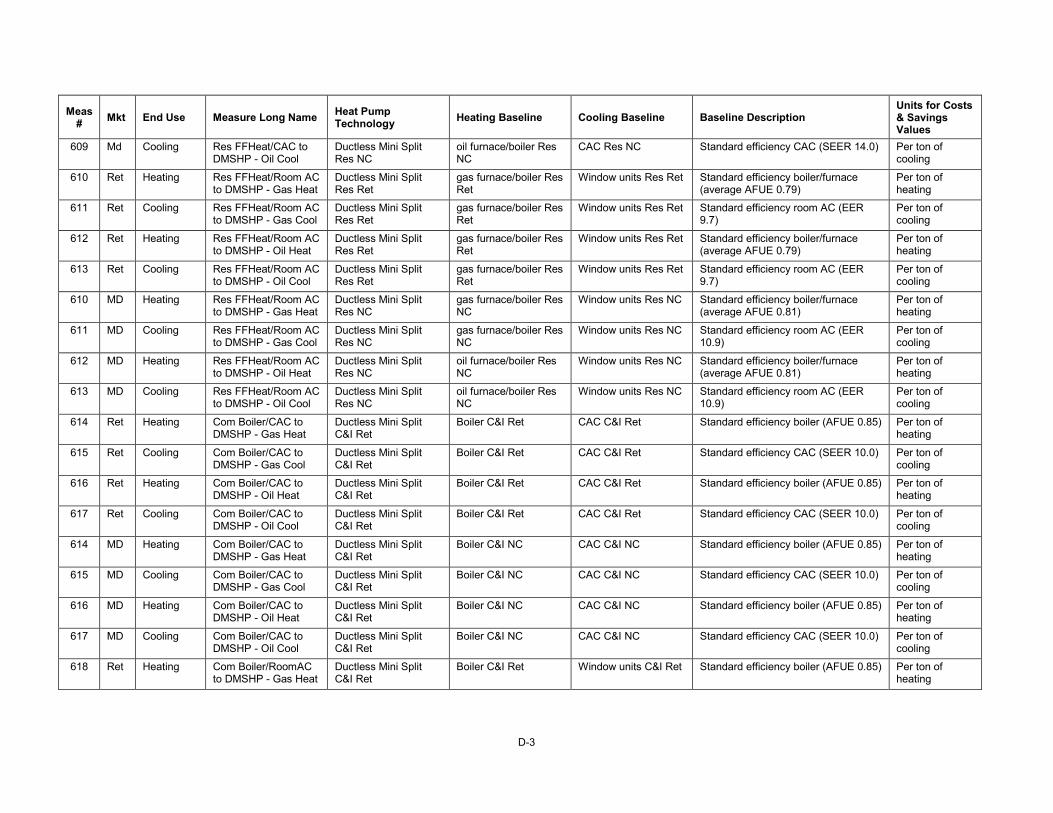
Meas # Mkt End Use Measure Long Name Heat Pump
Technology Heating Baseline Cooling Baseline Baseline Description Units for Costs & Savings Values
609 Md Cooling Res FFHeat/CAC to DMSHP - Oil Cool
Ductless Mini Split Res NC
oil furnace/boiler Res NC
CAC Res NC Standard efficiency CAC (SEER 14.0) Per ton of cooling
610 Ret Heating Res FFHeat/Room AC to DMSHP - Gas Heat
Ductless Mini Split Res Ret
gas furnace/boiler Res Ret
Window units Res Ret Standard efficiency boiler/furnace (average AFUE 0.79)
Per ton of heating
611 Ret Cooling Res FFHeat/Room AC to DMSHP - Gas Cool
Ductless Mini Split Res Ret
gas furnace/boiler Res Ret
Window units Res Ret Standard efficiency room AC (EER 9.7)
Per ton of cooling
612 Ret Heating Res FFHeat/Room AC to DMSHP - Oil Heat
Ductless Mini Split Res Ret
gas furnace/boiler Res Ret
Window units Res Ret Standard efficiency boiler/furnace (average AFUE 0.79)
Per ton of heating
613 Ret Cooling Res FFHeat/Room AC to DMSHP - Oil Cool
Ductless Mini Split Res Ret
gas furnace/boiler Res Ret
Window units Res Ret Standard efficiency room AC (EER 9.7)
Per ton of cooling
610 MD Heating Res FFHeat/Room AC to DMSHP - Gas Heat
Ductless Mini Split Res NC
gas furnace/boiler Res NC
Window units Res NC Standard efficiency boiler/furnace (average AFUE 0.81)
Per ton of heating
611 MD Cooling Res FFHeat/Room AC to DMSHP - Gas Cool
Ductless Mini Split Res NC
gas furnace/boiler Res NC
Window units Res NC Standard efficiency room AC (EER 10.9)
Per ton of cooling
612 MD Heating Res FFHeat/Room AC to DMSHP - Oil Heat
Ductless Mini Split Res NC
oil furnace/boiler Res NC
Window units Res NC Standard efficiency boiler/furnace (average AFUE 0.81)
Per ton of heating
613 MD Cooling Res FFHeat/Room AC to DMSHP - Oil Cool
Ductless Mini Split Res NC
oil furnace/boiler Res NC
Window units Res NC Standard efficiency room AC (EER 10.9)
Per ton of cooling
614 Ret Heating Com Boiler/CAC to DMSHP - Gas Heat
Ductless Mini Split C&I Ret
Boiler C&I Ret CAC C&I Ret Standard efficiency boiler (AFUE 0.85) Per ton of heating
615 Ret Cooling Com Boiler/CAC to DMSHP - Gas Cool
Ductless Mini Split C&I Ret
Boiler C&I Ret CAC C&I Ret Standard efficiency CAC (SEER 10.0) Per ton of cooling
616 Ret Heating Com Boiler/CAC to DMSHP - Oil Heat
Ductless Mini Split C&I Ret
Boiler C&I Ret CAC C&I Ret Standard efficiency boiler (AFUE 0.85) Per ton of heating
617 Ret Cooling Com Boiler/CAC to DMSHP - Oil Cool
Ductless Mini Split C&I Ret
Boiler C&I Ret CAC C&I Ret Standard efficiency CAC (SEER 10.0) Per ton of cooling
614 MD Heating Com Boiler/CAC to DMSHP - Gas Heat
Ductless Mini Split C&I Ret
Boiler C&I NC CAC C&I NC Standard efficiency boiler (AFUE 0.85) Per ton of heating
615 MD Cooling Com Boiler/CAC to DMSHP - Gas Cool
Ductless Mini Split C&I Ret
Boiler C&I NC CAC C&I NC Standard efficiency CAC (SEER 10.0) Per ton of cooling
616 MD Heating Com Boiler/CAC to DMSHP - Oil Heat
Ductless Mini Split C&I Ret
Boiler C&I NC CAC C&I NC Standard efficiency boiler (AFUE 0.85) Per ton of heating
617 MD Cooling Com Boiler/CAC to DMSHP - Oil Cool
Ductless Mini Split C&I Ret
Boiler C&I NC CAC C&I NC Standard efficiency CAC (SEER 10.0) Per ton of cooling
618 Ret Heating Com Boiler/RoomAC to DMSHP - Gas Heat
Ductless Mini Split C&I Ret
Boiler C&I Ret Window units C&I Ret Standard efficiency boiler (AFUE 0.85) Per ton of heating
D-3

Meas # Mkt End Use Measure Long Name Heat Pump
Technology Heating Baseline Cooling Baseline Baseline Description Units for Costs & Savings Values
619 Ret Cooling Com Boiler/RoomAC to DMSHP - Gas Cool
Ductless Mini Split C&I Ret
Boiler C&I Ret Window units C&I Ret Standard efficiency window AC (EER 9.7)
Per ton of cooling
620 Ret Heating Com Boiler/RoomAC to DMSHP - Oil Heat
Ductless Mini Split C&I Ret
Boiler C&I Ret Window units C&I Ret Standard efficiency boiler (AFUE 0.85) Per ton of heating
621 Ret Cooling Com Boiler/RoomAC to DMSHP - Oil Cool
Ductless Mini Split C&I Ret
Boiler C&I Ret Window units C&I Ret Standard efficiency window AC (EER 9.7)
Per ton of cooling
618 MD Heating Com Boiler/RoomAC to DMSHP - Gas Heat
Ductless Mini Split C&I Ret
Boiler C&I NC Window units C&I NC Standard efficiency boiler (AFUE 0.85) Per ton of heating
619 MD Cooling Com Boiler/RoomAC to DMSHP - Gas Cool
Ductless Mini Split C&I Ret
Boiler C&I NC Window units C&I NC Standard efficiency window AC (EER 10.9)
Per ton of cooling
620 MD Heating Com Boiler/RoomAC to DMSHP - Oil Heat
Ductless Mini Split C&I Ret
Boiler C&I NC Window units C&I NC Standard efficiency boiler (AFUE 0.85) Per ton of heating
621 MD Cooling Com Boiler/RoomAC to DMSHP - Oil Cool
Ductless Mini Split C&I Ret
Boiler C&I NC Window units C&I NC Standard efficiency window AC (EER 10.9)
Per ton of cooling
622 Ret Heating Com Boiler/Unitary AC to VRF - Gas Heat
VRF C&I Ret Boiler C&I Ret Unitary AC C&I Ret Standard efficiency boiler (AFUE 0.85) Per ton of heating
623 Ret Cooling Com Boiler/Unitary AC to VRF - Gas Cool
VRF C&I Ret Boiler C&I Ret Unitary AC C&I Ret Standard efficiency unitary AC (IPLV 10.7 for 15 ton, 9.7 for 25 ton)
Per ton of cooling
624 Ret Heating Com Boiler/Unitary AC to VRF - Oil Heat
VRF C&I Ret Boiler C&I Ret Unitary AC C&I Ret Standard efficiency boiler (AFUE 0.85) Per ton of heating
625 Ret Cooling Com Boiler/Unitary AC to VRF - Oil Cool
VRF C&I Ret Boiler C&I Ret Unitary AC C&I Ret Standard efficiency unitary AC (IPLV 10.7 for 15 ton, 9.7 for 25 ton)
Per ton of cooling
622 MD Heating Com Boiler/Unitary AC to VRF - Gas Heat
VRF C&I NC Boiler C&I NC Unitary AC C&I NC Standard efficiency boiler (AFUE 0.85) Per ton of heating
623 MD Cooling Com Boiler/Unitary AC to VRF - Gas Cool
VRF C&I NC Boiler C&I NC Unitary AC C&I NC Standard efficiency unitary AC (IPLV 13.0 for 15 ton, 12.7 for 25 ton)
Per ton of cooling
624 MD Heating Com Boiler/Unitary AC to VRF - Oil Heat
VRF C&I NC Boiler C&I NC Unitary AC C&I NC Standard efficiency boiler (AFUE 0.85) Per ton of heating
625 MD Cooling Com Boiler/Unitary AC to VRF - Oil Cool
VRF C&I NC Boiler C&I NC Unitary AC C&I NC Standard efficiency unitary AC (IPLV 13.0 for 15 ton, 12.7 for 25 ton)
Per ton of cooling
626 Ret Heating Com Boiler/Chiller to VRF - Gas Heat
VRF C&I Ret Boiler C&I Ret Chiller C&I Ret Standard efficiency boiler (AFUE 0.85) Per ton of heating
627 Ret Cooling Com Boiler/Chiller to VRF - Gas Cool
VRF C&I Ret Boiler C&I Ret Chiller C&I Ret Standard efficiency chiller (COP 5 for 100 ton, 5.5 for 200 ton)
Per ton of cooling
628 Ret Heating Com Boiler/Chiller to VRF - Oil Heat
VRF C&I Ret Boiler C&I Ret Chiller C&I Ret Standard efficiency boiler (AFUE 0.85) Per ton of heating
D-4

Meas # Mkt End Use Measure Long Name Heat Pump
Technology Heating Baseline Cooling Baseline Baseline Description Units for Costs & Savings Values
629 Ret Cooling Com Boiler/Chiller to VRF - Oil Cool
VRF C&I Ret Boiler C&I Ret Chiller C&I Ret Standard efficiency chiller (COP 5 for 100 ton, 5.5 for 200 ton)
Per ton of cooling
626 MD Heating Com Boiler/Chiller to VRF - Gas Heat
VRF C&I NC Boiler C&I NC Chiller C&I NC Standard efficiency boiler (AFUE 0.85) Per ton of heating
627 MD Cooling Com Boiler/Chiller to VRF - Gas Cool
VRF C&I NC Boiler C&I NC Chiller C&I NC Standard efficiency chiller (IPLV 0.62 for 100 ton, 0.58 for 200 ton)
Per ton of cooling
628 MD Heating Com Boiler/Chiller to VRF - Oil Heat
VRF C&I NC Boiler C&I NC Chiller C&I NC Standard efficiency boiler (AFUE 0.85) Per ton of heating
629 MD Cooling Com Boiler/Chiller to VRF - Oil Cool
VRF C&I NC Boiler C&I NC Chiller C&I NC Standard efficiency chiller (IPLV 0.62 for 100 ton, 0.58 for 200 ton)
Per ton of cooling
630 Ret Heating Res FF Heat/CAC to GSHP - Gas Heat
GSHP Res Ret gas furnace/boiler Res Ret
CAC Res Ret Standard efficiency boiler/furnace (average AFUE 0.79)
Per ton of heating
631 Ret Cooling Res FF Heat/CAC to GSHP - Gas Cool
GSHP Res Ret gas furnace/boiler Res Ret
CAC Res Ret Standard efficiency CAC (SEER 10.0) Per ton of cooling
632 Ret Heating Res FF Heat/CAC to GSHP - Oil Heat
GSHP Res Ret oil furnace/boiler Res Ret
CAC Res Ret Standard efficiency boiler/furnace (average AFUE 0.79)
Per ton of heating
633 Ret Cooling Res FF Heat/CAC to GSHP - Oil Cool
GSHP Res Ret oil furnace/boiler Res Ret
CAC Res Ret Standard efficiency CAC (SEER 10.0) Per ton of cooling
630 MD Heating Res FF Heat/CAC to GSHP - Gas Heat
GSHP Res NC gas furnace/boiler Res NC
CAC Res NC Standard efficiency boiler/furnace (average AFUE 0.81)
Per ton of heating
631 MD Cooling Res FF Heat/CAC to GSHP - Gas Cool
GSHP Res NC gas furnace/boiler Res NC
CAC Res NC Standard efficiency CAC (SEER 14.0) Per ton of cooling
632 MD Heating Res FF Heat/CAC to GSHP - Oil Heat
GSHP Res NC oil furnace/boiler Res NC
CAC Res NC Standard efficiency boiler/furnace (average AFUE 0.81)
Per ton of heating
633 MD Cooling Res FF Heat/CAC to GSHP - Oil Cool
GSHP Res NC oil furnace/boiler Res NC
CAC Res NC Standard efficiency CAC (SEER 14.0) Per ton of cooling
634 Ret Heating Com Boiler/Unitary AC to GSHP - Gas Heat
GSHP C&I Ret Boiler C&I Ret Unitary AC C&I Ret Standard efficiency boiler (AFUE 0.85) Per ton of heating
635 Ret Cooling Com Boiler/Unitary AC to GSHP - Gas Cool
GSHP C&I Ret Boiler C&I Ret Unitary AC C&I Ret Standard efficiency unitary AC (IPLV 10.7 for 15 ton, 9.7 for 25 ton)
Per ton of cooling
636 Ret Heating Com Boiler/Unitary AC to GSHP - Oil Heat
GSHP C&I Ret Boiler C&I Ret Unitary AC C&I Ret Standard efficiency boiler (AFUE 0.85) Per ton of heating
637 Ret Cooling Com Boiler/Unitary AC to GSHP - Oil Cool
GSHP C&I Ret Boiler C&I Ret Unitary AC C&I Ret Standard efficiency unitary AC (IPLV 10.7 for 15 ton, 9.7 for 25 ton)
Per ton of cooling
634 MD Heating Com Boiler/Unitary AC to GSHP - Gas Heat
GSHP C&I NC Boiler C&I NC Unitary AC C&I NC Standard efficiency boiler (AFUE 0.85) Per ton of heating
D-5

Meas # Mkt End Use Measure Long Name Heat Pump
Technology Heating Baseline Cooling Baseline Baseline Description Units for Costs & Savings Values
635 MD Cooling Com Boiler/Unitary AC to GSHP - Gas Cool
GSHP C&I NC Boiler C&I NC Unitary AC C&I NC Standard efficiency unitary AC (IPLV 13.0 for 15 ton, 12.7 for 25 ton)
Per ton of cooling
636 MD Heating Com Boiler/Unitary AC to GSHP - Oil Heat
GSHP C&I NC Boiler C&I NC Unitary AC C&I NC Standard efficiency boiler (AFUE 0.85) Per ton of heating
637 MD Cooling Com Boiler/Unitary AC to GSHP - Oil Cool
GSHP C&I NC Boiler C&I NC Unitary AC C&I NC Standard efficiency unitary AC (IPLV 13.0 for 15 ton, 12.7 for 25 ton)
Per ton of cooling
638 Ret Heating Com Boiler/Chiller to GSHP - Gas Heat
GSHP C&I Ret Boiler C&I Ret Chiller C&I Ret Standard efficiency boiler (AFUE 0.85) Per ton of heating
639 Ret Cooling Com Boiler/Chiller to GSHP - Gas Cool
GSHP C&I Ret Boiler C&I Ret Chiller C&I Ret Standard efficiency chiller (COP 5 for 100 ton, 5.5 for 200 ton)
Per ton of cooling
640 Ret Heating Com Boiler/Chiller to GSHP - Oil Heat
GSHP C&I Ret Boiler C&I Ret Chiller C&I Ret Standard efficiency boiler (AFUE 0.85) Per ton of heating
641 Ret Cooling Com Boiler/Chiller to GSHP - Oil Cool
GSHP C&I Ret Boiler C&I Ret Chiller C&I Ret Standard efficiency chiller (COP 5 for 100 ton, 5.5 for 200 ton)
Per ton of cooling
638 MD Heating Com Boiler/Chiller to GSHP - Gas Heat
GSHP C&I NC Boiler C&I NC Chiller C&I NC Standard efficiency boiler (AFUE 0.85) Per ton of heating
639 MD Cooling Com Boiler/Chiller to GSHP - Gas Cool
GSHP C&I NC Boiler C&I NC Chiller C&I NC Standard efficiency chiller (IPLV 0.62 for 100 ton, 0.58 for 200 ton)
Per ton of cooling
640 MD Heating Com Boiler/Chiller to GSHP - Oil Heat
GSHP C&I NC Boiler C&I NC Chiller C&I NC Standard efficiency boiler (AFUE 0.85) Per ton of heating
641 MD Cooling Com Boiler/Chiller to GSHP - Oil Cool
GSHP C&I NC Boiler C&I NC Chiller C&I NC Standard efficiency chiller (IPLV 0.62 for 100 ton, 0.58 for 200 ton)
Per ton of cooling
642 Ret Space Heating
Res Resist Heat/Room AC to DMSHP -Heat
Resistance heat, room AC meeting federal standards
1.5-ton unit
643 Ret Cooling Res Resist Heat/Room AC to DMSHP -Cool
Resistance heat, room AC meeting federal standards
1.5-ton unit
642 MD Space Heating
Res Resist Heat/Room AC to DMSHP -Heat
Resistance heat, room AC meeting federal standards
40 kBtu/hr HP
643 MD Cooling Res Resist Heat/Room AC to DMSHP -Cool
Resistance heat, room AC meeting federal standards
40 kBtu/hr HP
177 MD Cooling High-efficiency Heat Pump CEE Tier II -Cool
Standard efficiency new unitary heat pump. Baseline efficiency will reflect weighted average by size and type.
per Ton
D-6

Meas # Mkt End Use Measure Long Name Heat Pump
Technology Heating Baseline Cooling Baseline Baseline Description Units for Costs & Savings Values
177 RET Cooling High-efficiency Heat Existing stock efficiency unitary heat per Ton Pump CEE Tier II - pump. Existing stock efficiency will Cool reflect weighted average by size and
type.
178 MD Space High-efficiency Heat Standard efficiency new unitary heat per Ton Heating Pump CEE Tier II - pump. Baseline efficiency will reflect
Heat weighted average by size and type.
178 RET Space High-efficiency Heat Existing stock efficiency unitary heat per Ton Heating Pump CEE Tier II - pump. Existing stock efficiency will
Heat reflect weighted average by size and type.
404 MD Cooling Air Source Heat Standard efficiency, ducted, ASHP, 13 Per ton cooling Pump, Ducted, Energy SEER, 11 EER Star
405 MD Space Air Source Heat Standard efficiency, ducted, ASHP, Per 1 kBtu Heating Pump, Ducted, Energy 7.7 HSPF heating capacity
Star 430 MD Water Res heat pump water Oil fired standalone DHW tank Oil water heater
Heating heater for oil
646 MD Water Com heat pump water Oil fired standalone DHW tank Oil water heater Heating heater for oil
D-7

Table D-2. Measure Costs and Savings
Meas # Mkt End Use Measure Long Name
kWh Savings
% Savings (primary
fuel)
Incre-mental Cost
Incremental Cost per kWh (or MMBtu)
Saved
Base-line
Equip. Life
Base line
Equip. Age
Baseline Cost per kWh (or MMBtu) saved
Baseline shift
savings factor (for
RET)
Fossil Fuel (or Elec) Savings -
increased use is negative
(MMBtu/yr | kWh/yr)
Annual Fossil Fuel (or Elec) Savings -
increased is negative
(MMBtu/kWh | kWh/MMBtu saved)
594 Ret Heating Com Boiler/unitary AC to ASHP - Gas Heat
100% $229.34 20 15 $36.00 100.0% -547.4 -70.8
595 Ret Cooling Com Boiler/unitary AC to ASHP - Gas Cool
17% $0.78 15 10 $3.65 -23.8%
596 Ret Heating Com Boiler/unitary AC to ASHP - Oil Heat
100% $229.34 20 15 $36.00 100.0% -547.4 -70.8
597 Ret Cooling Com Boiler/unitary AC to ASHP - Oil Cool
17% $0.78 15 10 $3.65 -23.8%
594 MD Heating Com Boiler/unitary AC to ASHP - Gas Heat
100% $96.53 -547.4 -70.8
595 MD Cooling Com Boiler/unitary AC to ASHP - Gas Cool
-5% $0.33
596 MD Heating Com Boiler/unitary AC to ASHP - Oil Heat
100% $96.53 -547.4 -70.8
597 MD Cooling Com Boiler/unitary AC to ASHP - Oil Cool
-5% $0.33
598 Ret Heating Res FF ASHP -
Heat/CAC to Gas Heat
100% $132.61 23 18 $23.21 97.5% -1633.4 -92.9
599 Ret Cooling Res FF ASHP -
Heat/CAC to Gas Cool
33% $0.45 15 10 $5.34 14.3%
600 Ret Heating Res FF ASHP -
Heat/CAC to Oil Heat
100% $132.61 23 18 $23.21 97.5% -1633.4 -92.9
601 Ret Cooling Res FF ASHP -
Heat/CAC to Oil Cool
33% $0.45 15 10 $5.34 14.3%
598 MD Heating Res FF ASHP -
Heat/CAC to Gas Heat
100% $40.07 -1633.4 -95.3
599 MD Cooling Res FF ASHP -
Heat/CAC to Gas Cool
7% $0.14
600 MD Heating Res FF ASHP -
Heat/CAC to Oil Heat
100% $40.07 -1633.4 -95.3
601 MD Cooling Res FF ASHP -
Heat/CAC to Oil Cool
7% $0.14
D-8

Meas # Mkt End Use Measure Long Name
kWh Savings
% Savings (primary
fuel)
Incre-mental Cost
Incremental Cost per kWh (or MMBtu)
Saved
Base-line
Equip. Life
Base line
Equip. Age
Baseline Cost per kWh (or MMBtu) saved
Baseline shift
savings factor (for
RET)
Fossil Fuel (or Elec) Savings -
increased use is negative
(MMBtu/yr | kWh/yr)
Annual Fossil Fuel (or Elec) Savings -
increased is negative
(MMBtu/kWh | kWh/MMBtu saved)
602 Ret Heating Com Boiler/Chiller to ASHP - Gas Heat
100% $319.18 20 13 $36.00 100.0% -547.4 -70.8
603 Ret Cooling Com Boiler/Chiller to ASHP - Gas Cool
-46% $1.09 20 13 $(1.73) 124.0%
604 Ret Heating Com Boiler/Chiller to ASHP - Oil Heat
100% $319.18 20 13 $36.00 100.0% -547.4 -70.8
605 Ret Cooling Com Boiler/Chiller to ASHP - Oil Cool
-46% $1.09 20 13 $(1.73) 124.0%
602 MD Heating Com Boiler/Chiller to ASHP - Gas Heat
100% $(77.21) -547.4 -70.8
603 MD Cooling Com Boiler/Chiller to ASHP - Gas Cool
-64% $(0.26)
604 MD Heating Com Boiler/Chiller to ASHP - Oil Heat
100% $(77.21) -547.4 -70.8
605 MD Cooling Com Boiler/Chiller to ASHP - Oil Cool
-64% $(0.26)
606 Ret Heating Res FFHeat/CAC to DMSHP - Gas Heat
100% $232.01 23 18 $23.21 97.5% -1388.4 -79.0
607 Ret Cooling Res FFHeat/CAC to DMSHP - Gas Cool
52% $0.79 15 10 $3.40 45.5%
608 Ret Heating Res FFHeat/CAC to DMSHP - Oil Heat
100% $232.01 23 18 $23.21 97.5% -1388.4 -79.0
609 Ret Cooling Res FFHeat/CAC to DMSHP - Oil Cool
52% $0.79 15 10 $3.40 45.5%
606 MD Heating Res FFHeat/CAC to DMSHP - Gas Heat
100% $148.58 -1388.4 -81.0
607 MD Cooling Res FFHeat/CAC to DMSHP - Gas Cool
33% $0.51
608 MD Heating Res FFHeat/CAC to DMSHP - Oil Heat
100% $148.58 -1388.4 -81.0
609 Md Cooling Res FFHeat/CAC to DMSHP - Oil Cool
33% $0.51
610 Ret Heating Res FFHeat/Room AC to DMSHP - Gas Heat
100% $231.03 23 18 $23.21 97.5% -1388.4 -79.0
D-9

Meas # Mkt End Use Measure Long Name
kWh Savings
% Savings (primary
fuel)
Incre-mental Cost
Incremental Cost per kWh (or MMBtu)
Saved
Base-line
Equip. Life
Base line
Equip. Age
Baseline Cost per kWh (or MMBtu) saved
Baseline shift
savings factor (for
RET)
Fossil Fuel (or Elec) Savings -
increased use is negative
(MMBtu/yr | kWh/yr)
Annual Fossil Fuel (or Elec) Savings -
increased is negative
(MMBtu/kWh | kWh/MMBtu saved)
611 Ret Cooling Res FFHeat/Room AC to DMSHP - Gas Cool
54% $0.79 9 4 $0.98 79.5%
612 Ret Heating Res FFHeat/Room AC to DMSHP - Oil Heat
100% $231.03 23 18 $23.21 97.5% -1388.4 -79.0
613 Ret Cooling Res FFHeat/Room AC to DMSHP - Oil Cool
54% $0.79 9 4 $0.98 79.5%
610 MD Heating Res FFHeat/Room AC to DMSHP - Gas Heat
100% $195.49 -1388.4 -81.0
611 MD Cooling Res FFHeat/Room AC to DMSHP - Gas Cool
48% $0.67
612 MD Heating Res FFHeat/Room AC to DMSHP - Oil Heat
100% $195.49 -1388.4 -81.0
613 MD Cooling Res FFHeat/Room AC to DMSHP - Oil Cool
48% $0.67
614 Ret Heating Com Boiler/CAC to DMSHP - Gas Heat
100% $407.77 20 15 $36.00 100.0% -657.6 -85.0
615 Ret Cooling Com Boiler/CAC to DMSHP - Gas Cool
52% $1.39 15 10 $1.51 45.5%
616 Ret Heating Com Boiler/CAC to DMSHP - Oil Heat
100% $407.77 20 15 $36.00 100.0% -657.6 -85.0
617 Ret Cooling Com Boiler/CAC to DMSHP - Oil Cool
52% $1.39 15 10 $1.51 45.5%
614 MD Heating Com Boiler/CAC to DMSHP - Gas Heat
100% $307.58 -657.6 -85.0
615 MD Cooling Com Boiler/CAC to DMSHP - Gas Cool
33% $1.05
616 MD Heating Com Boiler/CAC to DMSHP - Oil Heat
100% $307.58 -657.6 -85.0
617 MD Cooling Com Boiler/CAC to DMSHP - Oil Cool
33% $1.05
618 Ret Heating Com Boiler/RoomAC to DMSHP - Gas Heat
100% $401.10 20 15 $36.00 100.0% -657.6 -85.0
619 Ret Cooling Com Boiler/RoomAC to DMSHP - Gas Cool
54% $1.37 9 4 $0.44 79.5%
D-10

Meas # Mkt End Use Measure Long Name
kWh Savings
% Savings (primary
fuel)
Incre-mental Cost
Incremental Cost per kWh (or MMBtu)
Saved
Base-line
Equip. Life
Base line
Equip. Age
Baseline Cost per kWh (or MMBtu) saved
Baseline shift
savings factor (for
RET)
Fossil Fuel (or Elec) Savings -
increased use is negative
(MMBtu/yr | kWh/yr)
Annual Fossil Fuel (or Elec) Savings -
increased is negative
(MMBtu/kWh | kWh/MMBtu saved)
620 Ret Heating Com Boiler/RoomAC to DMSHP - Oil Heat
100% $401.10 20 15 $36.00 100.0% -657.6 -85.0
621 Ret Cooling Com Boiler/RoomAC to DMSHP - Oil Cool
54% $1.37 9 4 $0.44 79.5%
618 MD Heating Com Boiler/RoomAC to DMSHP - Gas Heat
100% $363.32 -657.6 -85.0
619 MD Cooling Com Boiler/RoomAC to DMSHP - Gas Cool
48% $1.24
620 MD Heating Com Boiler/RoomAC to DMSHP - Oil Heat
100% $363.32 -657.6 -85.0
621 MD Cooling Com Boiler/RoomAC to DMSHP - Oil Cool
48% $1.24
622 Ret Heating Com Boiler/Unitary AC to VRF - Gas Heat
100% $262.17 20 15 $36.00 100.0% -504.0 -65.2
623 Ret Cooling Com Boiler/Unitary AC to VRF - Gas Cool
50% $0.89 15 10 $1.24 57.9%
624 Ret Heating Com Boiler/Unitary AC to VRF - Oil Heat
100% $262.17 20 15 $36.00 100.0% -504.0 -65.2
625 Ret Cooling Com Boiler/Unitary AC to VRF - Oil Cool
50% $0.89 15 10 $1.24 57.9%
622 MD Heating Com Boiler/Unitary AC to VRF - Gas Heat
100% $159.89 -504.0 -65.2
623 MD Cooling Com Boiler/Unitary AC to VRF - Gas Cool
36% $0.55
624 MD Heating Com Boiler/Unitary AC to VRF - Oil Heat
100% $159.89 -504.0 -65.2
625 MD Cooling Com Boiler/Unitary AC to VRF - Oil Cool
36% $0.55
626 Ret Heating Com Boiler/Chiller to VRF - Gas Heat
100% $341.30 20 13 $36.00 100.0% -504.0 -65.2
627 Ret Cooling Com Boiler/Chiller to VRF - Gas Cool
12% $1.16 20 13 $6.91 4.3%
628 Ret Heating Com Boiler/Chiller to VRF - Oil Heat
100% $341.30 20 13 $36.00 100.0% -504.0 -65.2
D-11
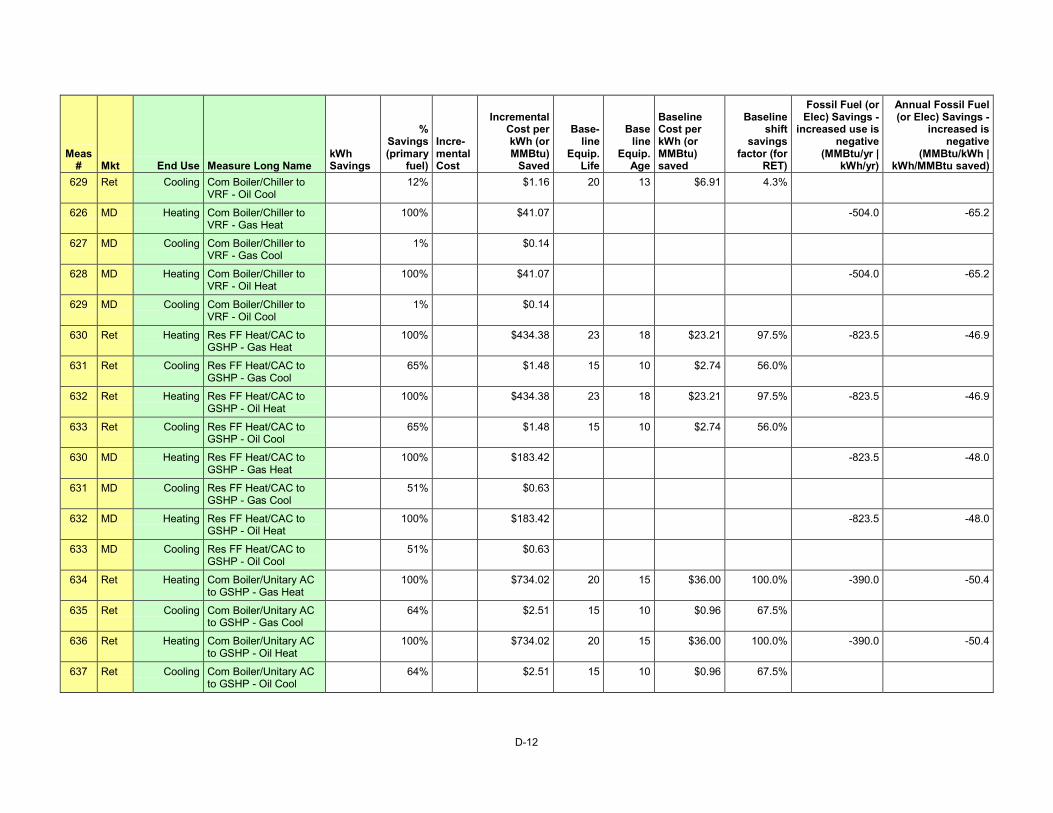
Meas # Mkt End Use Measure Long Name
kWh Savings
% Savings (primary
fuel)
Incre-mental Cost
Incremental Cost per kWh (or MMBtu)
Saved
Base-line
Equip. Life
Base line
Equip. Age
Baseline Cost per kWh (or MMBtu) saved
Baseline shift
savings factor (for
RET)
Fossil Fuel (or Elec) Savings -
increased use is negative
(MMBtu/yr | kWh/yr)
Annual Fossil Fuel (or Elec) Savings -
increased is negative
(MMBtu/kWh | kWh/MMBtu saved)
629 Ret Cooling Com Boiler/Chiller to VRF - Oil Cool
12% $1.16 20 13 $6.91 4.3%
626 MD Heating Com Boiler/Chiller to VRF - Gas Heat
100% $41.07 -504.0 -65.2
627 MD Cooling Com Boiler/Chiller to VRF - Gas Cool
1% $0.14
628 MD Heating Com Boiler/Chiller to VRF - Oil Heat
100% $41.07 -504.0 -65.2
629 MD Cooling Com Boiler/Chiller to VRF - Oil Cool
1% $0.14
630 Ret Heating Res FF Heat/CAC to GSHP - Gas Heat
100% $434.38 23 18 $23.21 97.5% -823.5 -46.9
631 Ret Cooling Res FF Heat/CAC to GSHP - Gas Cool
65% $1.48 15 10 $2.74 56.0%
632 Ret Heating Res FF Heat/CAC to GSHP - Oil Heat
100% $434.38 23 18 $23.21 97.5% -823.5 -46.9
633 Ret Cooling Res FF Heat/CAC to GSHP - Oil Cool
65% $1.48 15 10 $2.74 56.0%
630 MD Heating Res FF Heat/CAC to GSHP - Gas Heat
100% $183.42 -823.5 -48.0
631 MD Cooling Res FF Heat/CAC to GSHP - Gas Cool
51% $0.63
632 MD Heating Res FF Heat/CAC to GSHP - Oil Heat
100% $183.42 -823.5 -48.0
633 MD Cooling Res FF Heat/CAC to GSHP - Oil Cool
51% $0.63
634 Ret Heating Com Boiler/Unitary AC to GSHP - Gas Heat
100% $734.02 20 15 $36.00 100.0% -390.0 -50.4
635 Ret Cooling Com Boiler/Unitary AC to GSHP - Gas Cool
64% $2.51 15 10 $0.96 67.5%
636 Ret Heating Com Boiler/Unitary AC to GSHP - Oil Heat
100% $734.02 20 15 $36.00 100.0% -390.0 -50.4
637 Ret Cooling Com Boiler/Unitary AC to GSHP - Oil Cool
64% $2.51 15 10 $0.96 67.5%
D-12

Meas # Mkt End Use Measure Long Name
kWh Savings
% Savings (primary
fuel)
Incre-mental Cost
Incremental Cost per kWh (or MMBtu)
Saved
Base-line
Equip. Life
Base line
Equip. Age
Baseline Cost per kWh (or MMBtu) saved
Baseline shift
savings factor (for
RET)
Fossil Fuel (or Elec) Savings -
increased use is negative
(MMBtu/yr | kWh/yr)
Annual Fossil Fuel (or Elec) Savings -
increased is negative
(MMBtu/kWh | kWh/MMBtu saved)
634 MD Heating Com Boiler/Unitary AC to GSHP - Gas Heat
100% $372.32 -390.0 -50.4
635 MD Cooling Com Boiler/Unitary AC to GSHP - Gas Cool
55% $1.27
636 MD Heating Com Boiler/Unitary AC to GSHP - Oil Heat
100% $372.32 -390.0 -50.4
637 MD Cooling Com Boiler/Unitary AC to GSHP - Oil Cool
55% $1.27
638 Ret Heating Com Boiler/Chiller to GSHP - Gas Heat
100% $934.89 20 13 $36.00 100.0% -390.0 -50.4
639 Ret Cooling Com Boiler/Chiller to GSHP - Gas Cool
37% $3.19 20 13 $2.13 70.5%
640 Ret Heating Com Boiler/Chiller to GSHP - Oil Heat
100% $934.89 20 13 $36.00 100.0% -390.0 -50.4
641 Ret Cooling Com Boiler/Chiller to GSHP - Oil Cool
37% $3.19 20 13 $2.13 70.5%
638 MD Heating Com Boiler/Chiller to GSHP - Gas Heat
100% $305.05 -390.0 -50.4
639 MD Cooling Com Boiler/Chiller to GSHP - Gas Cool
30% $1.04
640 MD Heating Com Boiler/Chiller to GSHP - Oil Heat
100% $305.05 -390.0 -50.4
641 MD Cooling Com Boiler/Chiller to GSHP - Oil Cool
30% $1.04
642 Ret Space Heating
Res Resist Heat/Room AC to DMSHP -Heat
9313.4 45% $7,500 $0.69
643 Ret Cooling Res Resist Heat/Room AC to DMSHP -Cool
1530.0 52% $0.69
642 MD Space Heating
Res Resist Heat/Room AC to DMSHP -Heat
7488.0 58% $4,000 $0.44
643 MD Cooling Res Resist Heat/Room AC to DMSHP -Cool
1530.0 52% $0.44
177 MD Cooling High-efficiency Heat Pump CEE Tier II -Cool
187.2 11.3% $175 $0.692
D-13

Meas # Mkt End Use Measure Long Name
kWh Savings
% Savings (primary
fuel)
Incre-mental Cost
Incremental Cost per kWh (or MMBtu)
Saved
Base-line
Equip. Life
Base line
Equip. Age
Baseline Cost per kWh (or MMBtu) saved
Baseline shift
savings factor (for
RET)
Fossil Fuel (or Elec) Savings -
increased use is negative
(MMBtu/yr | kWh/yr)
Annual Fossil Fuel (or Elec) Savings -
increased is negative
(MMBtu/kWh | kWh/MMBtu saved)
177 RET Cooling High-efficiency Heat 387.1 22.2% $1,536 $3.151 15.00 9 2.25 51.0% Pump CEE Tier II -Cool
178 MD Space High-efficiency Heat 65.9 10.7% $- $0.692 Heating Pump CEE Tier II -Heat
178 RET Space High-efficiency Heat 100.5 14.5% $- $3.151 15.00 9 2.25 73.8% Heating Pump CEE Tier II -Heat
404 MD Cooling Air Source Heat Pump, 48.3 10% $137 $2.84 Ducted, EnergyStar
405 MD Space Heating
Air Source Heat Pump, Ducted, EnergyStar
8.65 6% $11.42 $1.32
430 MD Water Oil to HP fuel Switch 20.35 100% $950 $46.68 -1660.0 -81.6 Heating
646 MD Water Com Heat Pump Water 20.35 100% $950 $46.68 -1660.0 -81.6 Heating Htr replace Oil
D-14


NYSERDA, a public benefit corporation, offers objective information and analysis, innovative programs, technical expertise, and funding to help New Yorkers increase energy efficiency, save money, use renewable energy, and reduce reliance on fossil fuels. NYSERDA professionals work to protect the environment and create clean-energy jobs. NYSERDA has been developing partnerships to advance innovative energy solutions in New York State since 1975.
To learn more about NYSERDA’s programs and funding opportunities, visit
nyserda.ny.gov or follow us on Twitter, Facebook, YouTube, or Instagram.
New York State Energy Research and
Development Authority
17 Columbia CircleAlbany, NY 12203-6399
toll free: 866-NYSERDAlocal: 518-862-1090fax: 518-862-1091

Heat Pumps Potential for Energy Savings in New York State
Final Report July 2014 Revised March 2015
Report Number 14-39
New York State Energy Research and Development Authority
Richard L. Kauffman, Chair | John B. Rhodes, President and CEO
State of New York
Andrew M. Cuomo, Governor