heat-pulse measurements of sap flow in olives for automating
TRANSCRIPT
Heat-pulse measurements of sap flow in olives for automating irrigation: tests, root flow and
diagnostics of water stress
J.E. Fernándeza• , M.J. Palomo a, A. Díaz-Espejoa, B.E. Clothierb,
S.R. Greenb, LF. Giróna, F. Morenoa
alnstituto de Recursos Naturales y Agrobiología, CSIC, Apartado 1052, 41080 Sevilla, Spain bEnvironment Group, HortResearch, PB 11-030, Palmerston North 5301, New Zealand
Abstraet
The compensation heat-pulse method for measuring sap flow is tested here in olive trees (Olea europaea L.). We describe a rigorous three-way examination of the robustness of the technique for this species, and examine the potential of the technique for an automatic control of the irrigation system. Two tests were carried out using heat-pulse gear inserted into the stem of 12-year-old 'Manzanilla' olive trees. One test used forced-flow through a stem section, and the other involved measured water uptake by an excised tree. The measured sap flow in these two tests was in agreement with calculations from heat-pulse velocities when using a standard 'wound correction' to account for the presence of the probes and the disruption to the sap flow. Thus, this technique for monitoring transpiration can, we feel, be used with confidence in olives.
The third experiment was carried out in the field , where we analysed sap flow data from two 29-year-old olive trees - one tree was under regular drip irrigation and the other was from dry-farming conditions. We use measurements of sap flow in the trunk to examine the hydraulic functioning of the tree, and to explore sorne diagnostics of water stress. Our heat-pulse measurements in the irrigated olive tree exhibited a profile of sap flow that was weighted towards the outer xylem of the tree trunk while the water-stressed trees in the field showed a profile of sap flow weighted towards the centre of the trunk. The loss of hydraulic functioning in the outermost section of the vascular system, as a result of water stress, we consider to be due both to stomatal control and to embolisms in the xylem vessels.
The fourth experiment was also carried out in the field, in which sap flow measurements were made at three locations in the trunk as well as in two roots of another 29-year-old olive tree. The soil explored by each root, on opposite sides of the trunk, was differentially wetted by separate irrigation of each side. Our data showed that the surface roots were able to absorb water
irnmediately after wetting, despite a reasonably prolonged period of moderate drought. Root activity quickIy shifted to the regions where the soil had been wetted. A root in dry soil exhibited no flow at night, whereas sap flows of about 0.021 h 1 were measured around midnight in the root drawing water from the wetter soil. Our observations suggest that the hydraulic behaviour of the trunk and surface roots might be used as a diagnostic of the onset, or severity, of water stress. Rere there is not the imperative to replicate, for the prime goal is not transpiration estimation. Rather interpretation of the diurnal dynamics is used to infer the onset, or severity of water stress.
The compensation heat-pulse seems a suitable technique for automatically controlling the irrigation system of olives, and probably other trees, based either on the estimation of the short-time dynamics of transpiration, or on changes in the hydraulic behaviour of the trees.
1. Introduction
Irrigation is seen as irnportant for the future developrnent of olives in the water-short Medilerranean region (Fernández and Moreno, 1999). It is imperative for suslainab1e irrigation of olives in the Mediterranean and elsewhere, that water be usedjudiciously and without wastage. To achieve this, the water use of the olive tree needs to be known, in real time if possible. Further advantage will accrue if a technique can be developed to diagnose the onset and severity of water stress in the olive tree, for such a technique could be used to schedule the tirning of irrigation based on the plants' actual need for water.
A variety of rnethods are available to rneasure, or estirnate, plant water use in the field. Real-pulse (Ruber, 1932; Cohen el al., 1981) and heal-balance measuremenls (Vieweg and Ziegler, 1960; Sakuralani, 1981) of sap flow can be used lo monilor tree transpiration, and explore the short-terrn water-use dynarnics of trees (Green et al., 1989; Moreno et al., 1996). The relative rnerits of these techniques have been the subject of recent reviews (Swanson, 1994; Braun, 1997; Srnilh and Allen, 1996). Research on lhe developmenl of an autornatic control unit for irrigation systerns, based on the heat balance systern for stem segmenls, has already been conducted by Nadezhdina and Cermak (1997). As we rnove beyond of the use of these techniques in research, towards routine rnonitoring and srnart irrigation controllers, we now consider it prudent to test rigorously the applicability of the cornpensation heat-pulse technique in the xerophytic olive.
In the case of heat-pulse, which is necessarily an invasive procedure, there is a disruption of xylern tissue associated with the placernent of the sensors. Consequently, the rneasured heat-pulse velocity rnust be corrected for the effects of probe placernent and socalled wounding. Swanson and Whitfield (1981) were lhe frrsl lo publish a sel of correction factors derived frorn a nurnerical solution to the equation for heat and water flow in a porous mediurn (Marshall, 1958). Green and Clolhier (1988) subsequently investigated these correction factors for two different tree species. Apple trees behaved as expected, while kiwifruil did no!. Green and Clolhier (1988) conc1uded lhal lhe large xylern vessels and interstitial woody rnatrix affects the therrnal hornogeneity ofkiwifruit. They also derived new correction factors specific to their Teflon probes and the wider probe spacing used in kiwifruil, and lhey conc1uded lhal it would be prudenl lo carry oul a

immediately after wetting, despite a reasonably prolonged period of moderate drought. Root
activity quickly shifted to the regions where the soil had been wetted. A root in dry soil exhibited no
flow at night, whereas sap flows of about 0.02 l h�1 were measured around midnight in the root
drawing water from the wetter soil. Our observations suggest that the hydraulic behaviour of the
trunk and surface roots might be used as a diagnostic of the onset, or severity, of water stress. Here
there is not the imperative to replicate, for the prime goal is not transpiration estimation. Rather
interpretation of the diurnal dynamics is used to infer the onset, or severity of water stress.
The compensation heat-pulse seems a suitable technique for automatically controlling the
irrigation system of olives, and probably other trees, based either on the estimation of the short-time
dynamics of transpiration, or on changes in the hydraulic behaviour of the trees. # 2001 Elsevier
Science B.V. All rights reserved.
Keywords: Olive; Water stress; Roots; Heat pulse; Hydraulic behaviour; Xylem; Embolisms
1. Introduction
Irrigation is seen as important for the future development of olives in the water-short
Mediterranean region (Fernandez and Moreno, 1999). It is imperative for sustainable
irrigation of olives in the Mediterranean and elsewhere, that water be used judiciously and
without wastage. To achieve this, the water use of the olive tree needs to be known, in real
time if possible. Further advantage will accrue if a technique can be developed to
diagnose the onset and severity of water stress in the olive tree, for such a technique could
be used to schedule the timing of irrigation based on the plants’ actual need for water.
A variety of methods are available to measure, or estimate, plant water use in the field.
Heat-pulse (Huber, 1932; Cohen et al., 1981) and heat-balance measurements (Vieweg
and Ziegler, 1960; Sakuratani, 1981) of sap flow can be used to monitor tree transpiration,
and explore the short-term water-use dynamics of trees (Green et al., 1989; Moreno et al.,
1996). The relative merits of these techniques have been the subject of recent reviews
(Swanson, 1994; Braun, 1997; Smith and Allen, 1996). Research on the development of
an automatic control unit for irrigation systems, based on the heat balance system for
stem segments, has already been conducted by Nadezhdina and Cermak (1997). As we
move beyond of the use of these techniques in research, towards routine monitoring and
smart irrigation controllers, we now consider it prudent to test rigorously the applicability
of the compensation heat-pulse technique in the xerophytic olive.
In the case of heat-pulse, which is necessarily an invasive procedure, there is a
disruption of xylem tissue associated with the placement of the sensors. Consequently, the
measured heat-pulse velocity must be corrected for the effects of probe placement and so-
called wounding. Swanson and Whitfield (1981) were the first to publish a set of
correction factors derived from a numerical solution to the equation for heat and water
flow in a porous medium (Marshall, 1958). Green and Clothier (1988) subsequently
investigated these correction factors for two different tree species. Apple trees behaved as
expected, while kiwifruit did not. Green and Clothier (1988) concluded that the large
xylem vessels and interstitial woody matrix affects the thermal homogeneity of kiwifruit.
They also derived new correction factors specific to their Teflon probes and the wider
probe spacing used in kiwifruit, and they concluded that it would be prudent to carry out a
100 J.E. Fernandez et al. / Agricultural Water Management 51 (2001) 99–123

test of the heat-pulse technique when embarking on a detailed study in trees with a greatly
different xylem structure.
Thus, the first objective of this study was to evaluate the heat-pulse technique for its
applicability with the xerophytic olive tree whose xylem vessels are extremely narrow,
with a diameter rarely greater than 50 mm (Fernandez and Moreno, 1999). For this species
we expected the standard wound corrections of Swanson and Whitfield (1981) would be
appropriate, but an assessment was carried out using mature olive trees in order to check
the accuracy of the heat-pulse technique. Two tests were performed, using a stem section
through which water was forced at a known rate, and using an excised olive tree placed in
a bucket of water.
As the heat-pulse technique moves beyond a research tool (Moreno et al., 1996; Dichio
et al., 1998), towards being a instrument that might have potential in a smart irrigation-
control system (Fernandez et al., 1998), it is necessary to understand the limitations of the
technique, and to explore its full potential. The second objective of this study, therefore,
was to assess the natural spatial-variability of sap flow in the tree trunk since this will
largely determine the appropriate number of probes needed for a reliable measure of tree
transpiration. We will then introduce a gradient in soil water availability, by partially
irrigating the tree’s root zone, to see if such an irrigation changes the pattern of sap flow
within the tree trunk. We anticipate that changes in sap flow in the xylem of the outer
annulus will be related to changes in soil–water availability in the root zone. Next, we
examine flow in surface roots that draw their water from zones of differing water content.
The impact of irrigation on sap flow in these roots, and the ability of the plant to
selectively remove water from the drip zone is discussed. Finally, we scrutinise the
diurnal traces of flow in these roots to see whether any diagnostics of the onset, or
severity, of water stress can be derived. Earlier, Moreno et al. (1996) and Fernandez et al.
(1996) used the heat-pulse method to monitor the attempt by a severely droughted olive
tree to recover from water stress. In that case, the tree was unable to rehydrate the
embolised vascular system of its surface roots with a single wetting. Rather it maintained
its reliance on the restricted supply of water it could obtain from its deep roots. Here we
are interested in understanding hydraulic behaviour under the less-severe stress
conditions that might prevail during normal irrigation, or even regulated deficit irrigation.
Furthermore, we seek plant-based measures that might be used to schedule irrigation so
that a certain level, or absence, of water stress can be maintained.
2. Materials and methods
2.1. Experimental site and instrumentation
Experiments were carried out on La Hampa, the experimental farm of the Instituto de
Recursos Naturales y Agrobiologıa, at Coria del Rıo near Seville in Spain (latitude
378170N, longitude 6830W, altitude 30 m). The soil at the La Hampa station is a sandy
loam of about 2 m depth, and has a saturated volumetric water content of 0.33 m3 m�3,
and a water content of 0.10 m3 m�3 at a soil matrix potential of �1.5 MPa. Weather
variables were continuously measured using an automatic weather station located some
J.E. Fernandez et al. / Agricultural Water Management 51 (2001) 99–123 101
40 m from the experimental trees. Average values for global solar radiation, net radiation,
photosynthetically active radiation, wind speed, rainfall, and the temperature and relative
humidity of the air, were recorded at 30 min intervals.
In May 1997, both an excision experiment and a forced-flow perfusion experiment
were carried out using stem sections from an olive tree (Olea europaea L., ‘Manzanilla’).
These experiments were similar to those of Green and Clothier (1988), except that for our
perfusion experiment, we had to use much higher pressures to force water through the
olive stems because of the extremely low hydraulic conductivity of the olive wood.
Throughout the dry season of 1997, we also measured sap flow in both an irrigated and a
dryland tree in the field, as well as in a tree with irrigation applied to just half of the root
zone. Sap flow measurements were also carried out in the trunk of both trees during the
dry season of 1998.
The heat-pulse instrumentation consisted of two temperature probes inserted 15 mm
downstream and 5 mm upstream from a linear heater probe. The temperature probes had a
diameter of 1.8 mm, and comprised four copper–constantan thermocouples to measure
the sap velocity at four radial depths. For the perfusion and the excision experiments the
thermocouple sensors were at depths of 10, 20, 30 and 40 mm below the cambium and for
the field measurements these depths were 5, 12, 22 and 35 mm. For the experiments we
used a pulse length of 2 s. The probes, and the associated electronics and software to run
the system and calculate sap flows were made by the Environment and Risk Management
Group of the HortResearch in Palmerston North, New Zealand. The whole system was
controlled by a Campbell CR10X data logger (Campbell Scientific Inc., USA), and
powered by a 12 V battery.
2.2. Perfusion experiment
A special high-pressure device was built to force water through stem sections from the
olive tree (Fig. 1). For this perfusion experiment we used a 0.3 m long stem section
obtained from a tree of similar age and character to the tree used in the excision
experiment. After removing the bark, the stem section was sealed into a thick-walled
aluminium box using epoxy resin for strength, and silicon rubber to ensure an airtight seal
(Fig. 1). This process took about 2 days for the glue and sealant to dry. Two sets of heat-
pulse probes were then installed in the stem section some 150 mm away from where the
stem exited the pressurised box.
A 0.05 mol l�1 KCl solution, made with distilled water containing the red-dye safranin
that had been filtered through a 0.45 mm membrane, was used as the injection fluid. The
chamber was pressurised up to 0.4 MPa, and the solution forced through the stem at rates
of between 0.5 and 14 l h�1. Flow through the stem section was collected at the distal end
that was vented to the atmosphere. Once a steady flow rate was achieved, the heat-pulse
velocity was monitored using two sets of probes on opposite sides of the stem. The
diameter of the stem section where the probes were located was about 80 mm, excluding
the bark. After the device was dismantled, the stem section was cut transversally and the
cross sectional area of flow, A (mm2), was inferred by planimetry of the safranin-stained
area. For the test described here, A ¼ 5530 mm2, so that all of the sapwood was
conducting the injection fluid.
102 J.E. Fernandez et al. / Agricultural Water Management 51 (2001) 99–123
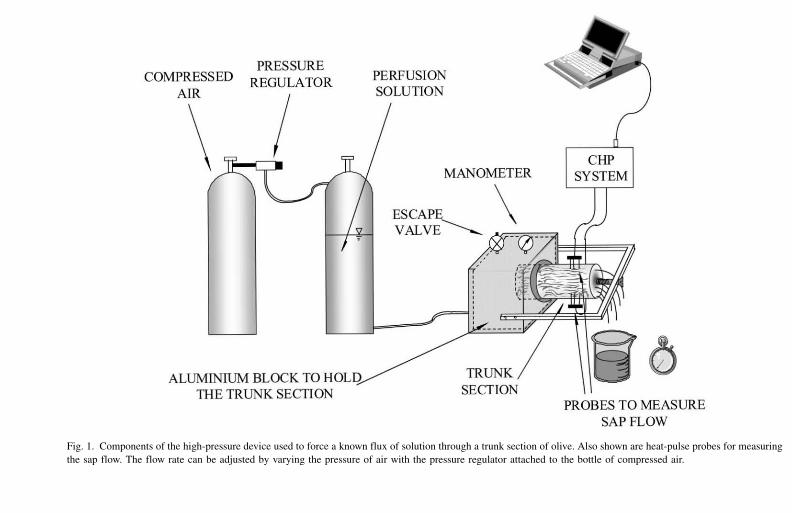
Fig. 1. Components of the high-pressure device used to force a known flux of solution through a trunk section of olive. Also shown are heat-pulse probes for measuring
the sap flow. The flow rate can be adjusted by varying the pressure of air with the pressure regulator attached to the bottle of compressed air.
J.E.
Fern
an
dez
eta
l./Ag
ricultu
ral
Wa
terM
an
ag
emen
t5
1(2
00
1)
99
–1
23
10
3
COMPRESSED AIR
PRESSURE REGULATOR
I \ TF-c=-
PERFUSION SOLUTION
MANOMETER
ESCAPE \ VALVE~ -'"===
ALUMINJUM BLOCK TO 'VLU../
THE TRUNK SECTION
TRUNK SECfION
CHP SYSTEM
PROBES TO MEASURE SAP FLOW

2.3. Excision experiment
A 12-year-old tree of height about 4 m was selected for the excision experiment. This
tree, was slightly smaller, and had somewhat fewer leaves (�2/3) than the orchard trees
used in later experiments (Table 1). The excision experiment commenced before dawn,
when the stem was cut at ground level. Immediately, the butt was placed in a container of
clean water, while the tree was kept in an upright position by a metal support specially
built for that purpose. The trunk was then recut under water some 150 mm from the butt
to remove any air emboli that might have been created during the first cutting. While still
submerged, the butt was then placed in another container that was filled with distilled
water containing the red-dye safranin. Shortly after dawn, sets of heat-pulse probes were
installed into the north and south side of the tree trunk. Sap flow was subsequently
monitored every 30 min. The trunk diameter where the probes were located was
estimated to be 108 mm, excluding bark. Water consumption by the tree was measured by
regularly refilling the container back to a constant water level. The water surface in the
container was covered with vegetable oil to minimise evaporative water loss. The entire
system was maintained operational for 3 days.
2.4. Data analysis
Signals from the heat-pulse equipment were analysed using the standard compensation
technique (Swanson and Whitfield, 1981; Green and Clothier, 1988) so only the salient
details are repeated here. The temperature rise following the release of a pulse of heat is
measured at distances Xd (15 mm) downstream and Xu (�5 mm) upstream from the heater
needle. The heat-pulse velocity, V (mm s�1), is then calculated as
V ¼ Xd þ Xu
2tz
(1)
Table 1
Physical and physiological characteristics of the two trees whose sap flow profiles are shown in Fig. 5 a
Irrigated tree
(treatment I)
Dryland tree
(treatment D)
Trunk radius at height of 0.6 m (mm) 94 92
Days since soil last wetted 1 68
Average water content near tree (0–1 m), y (m3 m�3) 0.27 0.14
Tree height (m) 4.6 4.4
Tree leaf area (m2) 61.2 64.4
Midday leaf water potential (MPa)
22 July �1.73 �2.18
16 September �1.41 �2.16
Daily evaporation calculated using FAO–Penman (mm) 6.1 7.7
Daily transpiration from sap flow measurements (l) 74.0 38.8
a The information for the irrigated tree relate to 6 August, whereas for the dryland tree they are for 15
August.
104 J.E. Fernandez et al. / Agricultural Water Management 51 (2001) 99–123
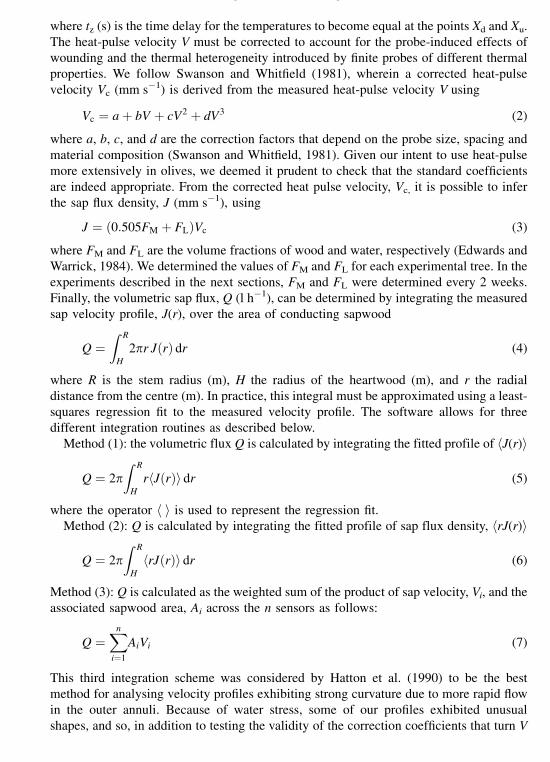
where tz (s) is the time delay for the temperatures to become equal at the points Xd and Xu.
The heat-pulse velocity V must be corrected to account for the probe-induced effects of
wounding and the thermal heterogeneity introduced by finite probes of different thermal
properties. We follow Swanson and Whitfield (1981), wherein a corrected heat-pulse
velocity Vc (mm s�1) is derived from the measured heat-pulse velocity V using
Vc ¼ a þ bV þ cV2 þ dV3 (2)
where a, b, c, and d are the correction factors that depend on the probe size, spacing and
material composition (Swanson and Whitfield, 1981). Given our intent to use heat-pulse
more extensively in olives, we deemed it prudent to check that the standard coefficients
are indeed appropriate. From the corrected heat pulse velocity, Vc, it is possible to infer
the sap flux density, J (mm s�1), using
J ¼ ð0:505FM þ FLÞVc (3)
where FM and FL are the volume fractions of wood and water, respectively (Edwards and
Warrick, 1984). We determined the values of FM and FL for each experimental tree. In the
experiments described in the next sections, FM and FL were determined every 2 weeks.
Finally, the volumetric sap flux, Q (l h�1), can be determined by integrating the measured
sap velocity profile, J(r), over the area of conducting sapwood
Q ¼Z R
H
2pr JðrÞ dr (4)
where R is the stem radius (m), H the radius of the heartwood (m), and r the radial
distance from the centre (m). In practice, this integral must be approximated using a least-
squares regression fit to the measured velocity profile. The software allows for three
different integration routines as described below.
Method (1): the volumetric flux Q is calculated by integrating the fitted profile of hJ(r)i
Q ¼ 2pZ R
H
rhJðrÞi dr (5)
where the operator h i is used to represent the regression fit.
Method (2): Q is calculated by integrating the fitted profile of sap flux density, hrJ(r)i
Q ¼ 2pZ R
H
hrJðrÞi dr (6)
Method (3): Q is calculated as the weighted sum of the product of sap velocity, Vi, and the
associated sapwood area, Ai across the n sensors as follows:
Q ¼Xn
i¼1
AiVi (7)
This third integration scheme was considered by Hatton et al. (1990) to be the best
method for analysing velocity profiles exhibiting strong curvature due to more rapid flow
in the outer annuli. Because of water stress, some of our profiles exhibited unusual
shapes, and so, in addition to testing the validity of the correction coefficients that turn V
J.E. Fernandez et al. / Agricultural Water Management 51 (2001) 99–123 105

into Vc (Eq. (2)), we also assessed the need to consider the influence of the integration
scheme on the estimates of Q via Eqs. (5)–(7).
2.5. Impact of Irrigation amount on tree water use
Two separate field experiments were set up at the La Hampa site. In the first field
experiment, sap flow measurements were carried out in a 0.5 ha grove of 29-year-old
‘Manzanilla’ olive trees planted at a spacing of 7 m 5 m. Two 4.5 m tall trees were
selected from the middle of the olive grove. Each tree had a single trunk with two main
branches bifurcating at about 1–1.5 m from ground level. On 16 July 1997, we inserted
three sets of heat-pulse probes into the trunks of both trees, and subsequently we
monitored sap flow every 30 min. The entire system was kept running until the beginning
of October.
Different irrigation regimes were applied to the two trees. One tree was growing under
dry-farming conditions with rainfall as the only source of water. We will refer to this tree
as being from treatment D. The other tree received a daily irrigation to replace the crop–
water demand as calculated using the FAO–Penman equation (Doorenbos and Pruitt,
1977). Mantovani et al. (1991) have shown this calculation to be the most appropriate for
this area of Spain. Irrigation to this tree was supplied by a single drip line along the row,
using five (3 l h�1) emitters per tree placed on the soil surface at a spacing of about 1 m
apart. We will refer to this irrigated tree as being from treatment I.
Routine measurements of soil water content (y, m3 m�3), were made around each of
the instrumented trees, at intervals of 10–15 days apart. The depthwise profile of the soil’s
volumetric water content from 0.2 down to 1.5 m was measured every 0.1 m using a
neutron probe (Troxler 3300, NC, USA) in access tubes installed at a distance of 0.5, 1.5
and 2.5 m away from the trunk. For the top 0.2 m layer of the soil, y was measured
gravimetrically.
Prior to the sap flow measurements, there had been just 101 mm of rainfall between the
end of March until 6 June, and negligible rainfall was recorded during the rest of the
experiment. Some additional details are given in Table 1. As a result, the soil around Tree
D was just 0.04 m3 m�3 off the permanent wilting point (�1.5 MPa) whereas the soil
around Tree I remained quite close to its saturated value (Table 1). Although
measurements of leaf water potential, cL, were not made on the 3 days for which we
present heat-pulse data (6 and 15 August), intensive measurements of cL were made on
other days which bracketed these (22 July and 16 September; Table 1).
Sap flow measurements were also carried out in the same D and I trees during the
irrigation season of 1998. The water supply treatments were the same as in 1997. New
sets of heat-pulse probes were inserted in the trunk of both trees on 14 and 15 July. The
probes recorded sap velocities every 30 min, until the end of August.
2.6. Partial irrigation and root-sap flow
In the second field experiment, a single representative tree was selected at the
beginning of May 1997, from another part of the orchard where the trees were of a similar
size but planted at a 7 m 7 m spacing. Until the middle of summer this tree had been
106 J.E. Fernandez et al. / Agricultural Water Management 51 (2001) 99–123

irrigated once per week by supplying water inside a small earthen-dyke of 2.5 m radius
around the tree. Then, on 2 June the pond was divided by a small transverse earthen-dyke
along the northwest–southeast diagonal. This permitted separate semi-irrigations to the
‘north’ and ‘south’ side of the tree. On 14 October, day-of-year (DOY) 287, the northern
pond was irrigated with 70 mm of water. The irrigation began at 10.25 GMT, and lasted
for l h. Three days later (DOY 290), the southern pond was irrigated with 155 mm of
water. Irrigation began at 10.22 GMT and lasted for 31 min.
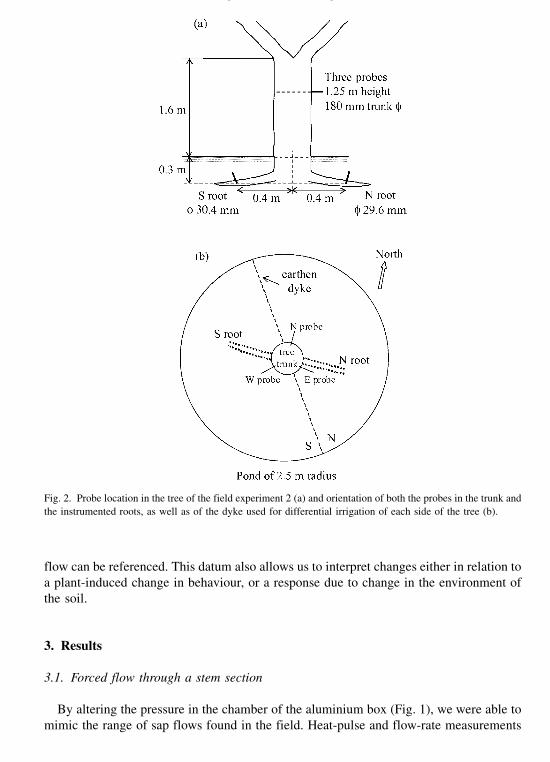
Two small soil pits were excavated on the north and south side of the tree trunk, to a
depth of about 0.3 m, and a significant lateral root was partially exposed in each pit. A
single set of heat pulse probes was installed in each root, and a distance of about 0.4 m
from the trunk, so we could monitor root-sap flow. The root diameters at the implantation
sites were 30.4 mm for the southern root and 29.6 mm for the northern root. The
excavated soil was gently repacked into the pit after probe installation.
Heat-pulse probes were also installed at three equal spacings around the azimuth of the
tree trunk, some 1.25 m above the ground where the trunk diameter, excluding the bark,
was about 180 mm. One probe set was installed in the north side of the trunk, the so-
called N probe, another at west–southwest, our W probe, and the third was at east–
southeast side which we termed our E probe. Thus, the N and E probes should tend to be
influenced by water uptake derived from the northern dyke, whereas the W probe set
would be expected to be more influenced by water uptake from the southern dyke (Fig. 2).
Between DOY 284 and DOY 297, sap flow was monitored in the trunk and in the two
roots, once every half-hour. Our intention here was to examine spatial variability in sap
flow around the trunk, as induced by azimuthal variation in soil water availability. We
also wanted to assess the consequence of this variability on the determination of the
transpiration of the whole tree as calculated from the sap flow measurements.
The volumetric water content of the soil from 0.3 to 1.6 m depth was measured every
0.1 m using the neutron probe. An access tube was installed on 2 June in each of the
dyked areas about 1.7 m from the trunk. At the surface, y was measured by time-domain-
reflectometry (TDR) using a Tektronix cable tester (Model 1502C, Beaverton, OR, USA).
Two TDR waveguides of length 150 and 300 mm were installed close to each access tube.
We measured y on the days before and after the irrigation of DOY 287, and thereafter ywas measured at 3–4-day intervals.
2.7. Penman–Monteith model of tree transpiration
The weather data, together with certain plant physiological measurements, were used
in 1997 to calculate transpiration rates of the tree of the second field experiment using the
Penman–Monteith equation (Green, 1993; Moreno et al., 1996). However, as we had no
direct measures of the canopy leaf area, the Penman–Monteith calculations are expressed
solely on a per unit leaf area basis (l h�1 m�2). We will refer to these calculations as the
normalised Penman–Monteith transpiration (E�p). The calculation procedure directly
followed that carried out by Moreno et al. (1996) and represents the three-way sum of
transpiration due to net radiation falling directly on lit leaves, plus water loss due to a
vapour pressure deficit in the air surrounding both the sunlit and shaded leaves. The
normalised values of E�p provided us with a datum against which our observations of sap
J.E. Fernandez et al. / Agricultural Water Management 51 (2001) 99–123 107
flow can be referenced. This datum also allows us to interpret changes either in relation to
a plant-induced change in behaviour, or a response due to change in the environment of
the soil.
3. Results
3.1. Forced flow through a stem section
By altering the pressure in the chamber of the aluminium box (Fig. 1), we were able to
mimic the range of sap flows found in the field. Heat-pulse and flow-rate measurements
Fig. 2. Probe location in the tree of the field experiment 2 (a) and orientation of both the probes in the trunk and
the instrumented roots, as well as of the dyke used for differential irrigation of each side of the tree (b).
108 J.E. Fernandez et al. / Agricultural Water Management 51 (2001) 99–123

were made at the same time, at approximately 15–20 min intervals. Fig. 3 shows first a
sequence of flow decreasing from about 9 down to 0.5 l h�1. This drop in sap flow was
achieved by reducing the chamber pressure from 0.22 down to 0.02 MPa. When the
pressure was incrementally raised back up 0.31 MPa, the corresponding flow rate climbed
back to around 11 l h�1. On the right-hand side of Fig. 3, we present for comparative
purposes the average sap flux density (mm h�1) simply calculated from the left-hand axis
values of Q (l h�1) divided by the stem cross-sectional area, A (m2). The values of sap
flow, Q, for the two probes in Fig. 3, were calculated using a wound width of 2.0 mm in
the analysis procedure of Green and Clothier (1988), following Swanson’s model (1983).
In calculating Q, the first integration method (Eq. (5)) gave the best results, although
there was little difference between the three methods. These test results obtained from a
single stem-section under forced flow provide our first evidence that standard heat-pulse
procedures will work in the xerophytic olive tree.
3.2. Water uptake by an excised tree
We now examine the results obtained from the excised tree. During the first day of the
excision test, the tree consumed water from the reservoir at rates that peaked at around
3–4 l h�1 (Fig. 4). Such rates are expected for a tree of this size, under these ambient
weather conditions. Unfortunately, measured transpiration decreased markedly on the
second day, and there was only a negligible amount of water consumption on the third
Fig. 3. A comparison of actual sap flow to that measured by heat-pulse during the perfusion experiment. The
average of both probes if shown, as well as the flow rate through the trunk as recorded by the measured efflux.
The measurements were 10–15 min apart, using a pressure gradient which first varied from 0.22 down to
0.02 MPa, and then returned back to 0.31 MPa. The sap flows were calculated from the measured heat-pulse
velocities using the analysis procedure of Green and Clothier (1988) and a wound width of 2.0 mm.
J.E. Fernandez et al. / Agricultural Water Management 51 (2001) 99–123 109
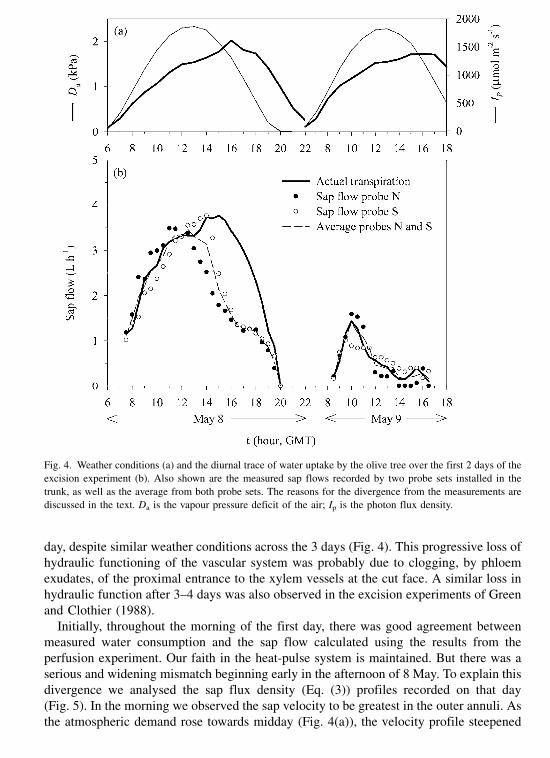
day, despite similar weather conditions across the 3 days (Fig. 4). This progressive loss of
hydraulic functioning of the vascular system was probably due to clogging, by phloem
exudates, of the proximal entrance to the xylem vessels at the cut face. A similar loss in
hydraulic function after 3–4 days was also observed in the excision experiments of Green
and Clothier (1988).
Initially, throughout the morning of the first day, there was good agreement between
measured water consumption and the sap flow calculated using the results from the
perfusion experiment. Our faith in the heat-pulse system is maintained. But there was a
serious and widening mismatch beginning early in the afternoon of 8 May. To explain this
divergence we analysed the sap flux density (Eq. (3)) profiles recorded on that day
(Fig. 5). In the morning we observed the sap velocity to be greatest in the outer annuli. As
the atmospheric demand rose towards midday (Fig. 4(a)), the velocity profile steepened
Fig. 4. Weather conditions (a) and the diurnal trace of water uptake by the olive tree over the first 2 days of the
excision experiment (b). Also shown are the measured sap flows recorded by two probe sets installed in the
trunk, as well as the average from both probe sets. The reasons for the divergence from the measurements are
discussed in the text. Da is the vapour pressure deficit of the air; Ip is the photon flux density.
110 J.E. Fernandez et al. / Agricultural Water Management 51 (2001) 99–123

so that the bulk of the flow was in the outermost 20 mm. However by 14.00 h, the profile
near the cambium first flattened, then developed a reverse slope with some loss of flow in
the outer vessels. The weather conditions and water consumption would suggest that the
level of sap flow should have been maintained. An internal change in hydraulic behaviour
must have occurred, and this is also borne out by the divergence of the measured
consumption from the calculated sap flow (Fig. 4(b)). This downward trend of flow in the
outer annulus continued through 18.00 h, until at 20.00 h the greatest velocities were then
being recorded in the interior depths. When analysing the cross-section of the trunk at the
location of the heat-pulse probes, the area stained by the safranin revealed that in some
areas the sapwood reached a maximum depth of 49 mm below the cambium.
We suggest that this loss of sap flow is a result of emboli forming in those vessels of
the outer annuli, due to the water stress probably caused by blockages to water supply at
the entrance to the xylem vessels in the butt. The changed velocity profiles indicate a
greater reliance on flow towards the centre of the trunk, beyond a depth of 30 mm, in a
zone where the sensors in our probes have not, it would seem, adequately sampled the
flow. Hence the late-afternoon divergence of our sap flow estimates from the
measurements of consumption is considered to be due to sampling inadequacies in our
current set up. Our probes are designed to detect the flows nearer the cambium, which
normally dominate the integral for Q. In addition, any changes in the azimuthal
distribution of sap flow around the stem circumference could contribute to the mismatch
of results. Despite this loss of water supply to the tree, there was some small amount of
transpiration the next day (9 May), that is in reasonable agreement with our sap flow
calculations.
Fig. 5. The within-trunk profile of sap density for the north probe set in the excised tree on 8 May (see Fig. 4).
The sapwood had a radius of 59 mm, so that the inner sensor was a distance of 19 mm from the stem centre.
J.E. Fernandez et al. / Agricultural Water Management 51 (2001) 99–123 111

The change in the radial pattern of sap flow during the excision experiment may be
attributed to water stress brought about by xylem blockages as a result of excision. We
now show that a changing radial pattern of flow can also occur naturally when olive trees
experience water stress. Indeed we have frequently observed in the field changes in the
radial pattern of sap flow following the onset of water stress.
3.3. Field experiment 1
Here we present some typical examples of sap velocity profiles to highlight the critical
role of the xylem in the outermost annuli. Fig. 6(a) shows a set of velocity profiles
measured on 6 August from a representative tree in the irrigated plot (treatment I). This
tree had received regular daily irrigation, and the midday leaf water potential, cL, would
have been in the normal range of �1.4 to �1.7 MPa (Table 1). Integration of the velocity
profiles on this day, suggests the tree would have transpired about 74.0 l of water. Fig. 6(b)
shows similar measurements from a tree in the dryland plot (treatment D) which had not
received any water for over two months (Table 1). These results were obtained on 15
August, when the midday cL was lower than �2.1 MPa and the tree was likely to be
under a mild water stress. The total transpiration from this tree, on this day, was just
38.8 l, which was much lower than that of the irrigated tree, even though the weather was
both warmer and drier than the 6 August (Table 1).
Despite the unusual shape of the sap velocity profile in this water-stressed tree, there
was very little change in the calculated sap flow as determined by the three radial
integration schemes of Eqs. (5)–(7). Therefore we used Eq. (5) as in the experiments
described in the previous sections. For the dryland tree (Fig. 6(b)), the temporal pattern in
the sap velocity profile remained similar to that of the well-watered tree for the innermost
three sensors only (Fig. 6(a)). Flow in the outer annulus always remained low. This loss of
flow in the most recent and largest xylem vessels is, we feel, due to a breakdown in the
hydraulic functioning of the vascular system brought about by prolonged water-stress as a
result of a shortage in available soil–water. It would seem that the major conducting
vessels have embolised to the extent that there is neither continuity, nor flow, through the
outer annulus of sapwood.
On the other hand, stomatal control in the younger leaves (Fernandez et al., 1997a,b)
linked to the outer xylem vessels may also have played a role in reducing the sap flow in
that area of the xylem. Since this annulus comprises a significant part of the tree’s
conducting area (�20%), the olive’s water use is curtailed, and as a consequence the
midday cL has dropped to more than 0.5 MPa below that of its well-watered neighbour
(Table 1). The sap velocity profile here is reminiscent of that which became evident in the
excised tree after 14.00 h (Fig. 5). Furthermore, we have observed elsewhere this same
phenomenon in a single probe set due to the onset of water stress. Variability aside, it
would almost seem by comparison of Fig. 6(a) and (b), there has been some
compensation by the innermost xylem vessels to partly offset the lack of flow in the
outermost vessels.
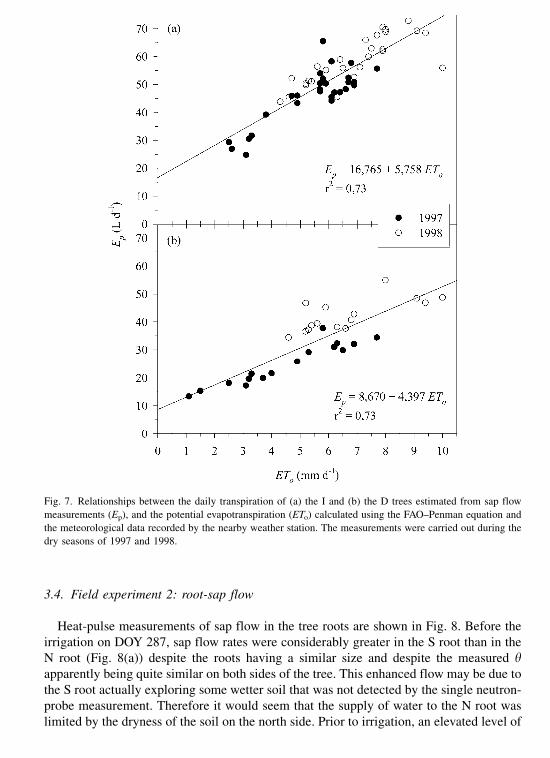
Fig. 7 shows the relationships between the daily transpiration values (Ep), of both the D
and I trees, and the potential evapotranspiration (ETo) calculated using the FAO–Penman
equation and the meteorological data recorded by the weather station of the farm.
112 J.E. Fernandez et al. / Agricultural Water Management 51 (2001) 99–123

A similar agreement (r2 ¼ 0:73) was obtained for the I and the D trees. As expected,
lower values of Ep were recorded in the D tree than in the I tree, for the same ETo value.
In fact, the maximum value of Ep recorded in the D tree was 55 l per day, whereas in the I
tree it amounted to more than 70 l per day. The atmospheric demand was greater in 1998
than in 1997, and so was Ep. In the D tree, greater values of Ep were recorded in 1998
than in 1997, for ETo values of about 4–8 mm per day. This could be due to a greater leaf
area in the second experimental year.
Fig. 6. The diurnal change in the radial pattern of sap flow from probes in (a) a well-watered olive tree
(treatment I; see text for details) at La Hampa on 6 August 1997; and (b) a water-stressed olive tree (treatment D;
see text for details) at La Hampa on 15 August 1997. Both figures shows the sap flows measured with one of the
three sets of probes installed in the trunk of each tree. The others sets of probes gave similar results.
J.E. Fernandez et al. / Agricultural Water Management 51 (2001) 99–123 113
3.4. Field experiment 2: root-sap flow
Heat-pulse measurements of sap flow in the tree roots are shown in Fig. 8. Before the
irrigation on DOY 287, sap flow rates were considerably greater in the S root than in the
N root (Fig. 8(a)) despite the roots having a similar size and despite the measured yapparently being quite similar on both sides of the tree. This enhanced flow may be due to
the S root actually exploring some wetter soil that was not detected by the single neutron-
probe measurement. Therefore it would seem that the supply of water to the N root was
limited by the dryness of the soil on the north side. Prior to irrigation, an elevated level of
Fig. 7. Relationships between the daily transpiration of (a) the I and (b) the D trees estimated from sap flow
measurements (Ep), and the potential evapotranspiration (ETo) calculated using the FAO–Penman equation and
the meteorological data recorded by the nearby weather station. The measurements were carried out during the
dry seasons of 1997 and 1998.
114 J.E. Fernandez et al. / Agricultural Water Management 51 (2001) 99–123

nocturnal sap flow was recorded in the S root, which no doubt supplied water to recharge
the tree’s water status during the night. However, at the same time in the N root,
negligible sap flow was recorded at night, presumably due again to a limitation of readily
available water in the soil root zone.
Following irrigation, we observed a rapid rise in the sap flow in the wetted, N root just
about 1 h after irrigation on the N side. The roots obviously took up water soon after the
surrounding soil became wet. At the same time that the sap flow dramatically increased in
Fig. 8. Sap flows monitored in a root of the north side (N root) and south side (S root) of the olive tree used in the
field experiment 2. In (a), the arrow represents an irrigation of 70 mm of water applied to the northern sector of the
tree on DOY 287 at 10.25 GMT; (b) the arrow represents an irrigation of 155 mm of water applied to the southern
sector of the tree on DOY 290 at 10.22 GMT. The number at the top of each daily curve is the ETo of that day.
J.E. Fernandez et al. / Agricultural Water Management 51 (2001) 99–123 115
the N root, there was a small but general decrease in the flow in the S root. The tree
preferentially extracts water from where it is most easily available.
Another more subtle feature of the hydraulic behaviour of these roots is that before the
irrigation of the N side on DOY 287, sap flow in the S root began about half to 1 h earlier
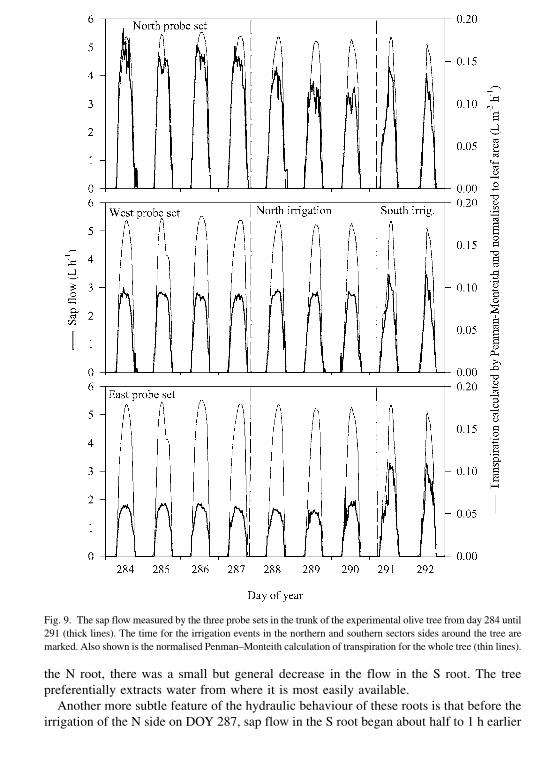
Fig. 9. The sap flow measured by the three probe sets in the trunk of the experimental olive tree from day 284 until
291 (thick lines). The time for the irrigation events in the northern and southern sectors sides around the tree are
marked. Also shown is the normalised Penman–Monteith calculation of transpiration for the whole tree (thin lines).
116 J.E. Fernandez et al. / Agricultural Water Management 51 (2001) 99–123
than in the N root. Likewise flow in the evening ceased about 1 h earlier in the N root.
However, after irrigation, the two diurnal traces of sap flow were more-or-less in concert.
After irrigating the S side on DOY 290 (Fig. 8(b)), the root water uptake of the S root
increased, although the N root continued to be the one with the greatest water uptake.
3.5. Penman–Monteith model of tree transpiration
The predicted values of E�p several days either side of the irrigation events are shown in
Fig. 9. The sap flows determined from the three probe sets are also shown in that figure.
Marked differences in measured sap flow can be seen between the three probe sets. This
is likely due to the naturally irregular nature of the sapwood of mature olive trees
(Fernandez and Moreno, 1999). In cultivated olives this variability is enhanced by
pruning which leaves many gnarled scars and knots around the circumference of the
trunk. Differences in the local transpiration derived from different parts of the canopy
might also contribute to variability in measured sap flow around the trunk.
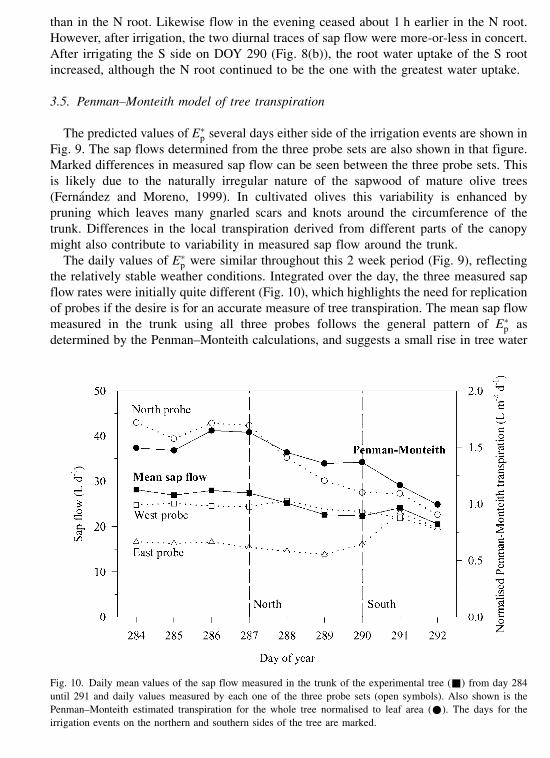
The daily values of E�p were similar throughout this 2 week period (Fig. 9), reflecting
the relatively stable weather conditions. Integrated over the day, the three measured sap
flow rates were initially quite different (Fig. 10), which highlights the need for replication
of probes if the desire is for an accurate measure of tree transpiration. The mean sap flow
measured in the trunk using all three probes follows the general pattern of E�p as
determined by the Penman–Monteith calculations, and suggests a small rise in tree water
Fig. 10. Daily mean values of the sap flow measured in the trunk of the experimental tree (&) from day 284
until 291 and daily values measured by each one of the three probe sets (open symbols). Also shown is the
Penman–Monteith estimated transpiration for the whole tree normalised to leaf area (*). The days for the
irrigation events on the northern and southern sides of the tree are marked.
J.E. Fernandez et al. / Agricultural Water Management 51 (2001) 99–123 117

use following the second irrigation on DOY 290. The values of E�p are between 1.0 and
1.6 l m�2 per day (Fig. 10). Three years earlier, Moreno et al. (1996) reported values of E�p
around 1.65 l m�2 per day for a well-irrigated tree in the same experimental orchard, but
closer to 0.78 l m�2 per day for an unirrigated tree. These latter measurements were made at
about the same time of the year and on trees having a similar size to the present study.
4. Discussion
For both the excision and the perfusion experiments, the best agreement between the
actual sap flow and the rates calculated from heat-pulse measurements was obtained
using the correction factors for a wound width of 2.0 mm (Green and Clothier, 1988), and
with the integration method of Eq. (5). Our confidence on these results is strengthened by
the fact that, despite no replications of either the perfusion or the excision experiments,
both experiments showed similar results. In addition, the data analysis of the sap flow
velocities measured in the field, under very different conditions of atmospheric demand
and soil water content, led to consistent results across the whole range (Fig. 7).
Anatomical studies by Barret et al. (1995) in rainforest and eucalypt forest species
showed the effective diameter of the wound extends about 0.3 mm either side of the drill
hole. On the other hand, when the distance between xylem vessels is lower than 400 mm a
wound width of 2.0 mm was reported as adequate by Swanson (1983). Our own anatomical
measurements of the xylem vessels in olive showed the averaged distance between a group
of vessels is about 193:5 � 71:5 mm (n ¼ 20), with an average distance of 19:8 � 5:3 mm
(n ¼ 20) between the vessels within a group. Thus, a wound width of 2.0 mm is justified for
olive. While Hatton et al. (1990) recommended Eq. (7) as the most adequate when the sap
velocity profiles has a strong curvature close to the cambium, our own results for the olive
show there to be little difference between the three integration methods described above.
In this study, we observed a large variability in sap velocities within the tree trunk
(Figs. 9 and 10). Fernandez et al. (1998) has already commented on the variability in the
cross-sectional area in the trunk of a mature olive tree. This variation is exacerbated by
the gnarled scars and knots left by pruning in the early years. We also observed that the
degree of sap flow variability can change in response to a change in the spatial pattern of
readily-available soil–water within the tree’s root-zone. For example, prior to irrigation,
the three stem probes gave peak sap flows of 1.9, 2.8 and 4.5 l h�1 (Fig. 8), yet after the
first irrigation to just the northern part of the root zone the corresponding flow rates
peaked at 1.9, 3.0, 3.5 l h�1, respectively. Here it would seem that an increase in
azimuthal variation of y in the root zone, has resulted in a drop in the variability between
our three probes sets. By DOY 292, following the second semi-irrigation on DOY 290,
whereas the mean mid-afternoon flow rate is little changed at 2.6 l h�1, the variation,
given as the range over the mean of the three probes, is much reduced at 19%. For this
day, the range in the daily total of the three measures of sap flow is just 3.2 l out of a daily
flow of some 20.5 l. So it would now seem that just one to two probes would only be
required to provide a robust measure of the tree’s transpiration. Thus, somewhat
paradoxically, an increase (DOY 287–290), then a decrease (>DOY 290) in the azimuthal
variation in water content around the tree, has lead to a reduction in the variation in the
results from the different probe sets.
118 J.E. Fernandez et al. / Agricultural Water Management 51 (2001) 99–123
If a good measure of the olive tree’s transpiration is sought, then somewhere between
two to four probe sets will be needed. But it is likely that through judicious selection of
implantation sites, albeit with difficulty around the trunk of cultivated olive, the number
required will be at the lower end of this bracketing. However, if it is only sought to
observe variations in the dynamics and relative changes in the hydraulic functioning of
the tree, then the requirement for replication lessens.
In looking at the flows of sap in the two roots over DOY 284–286 (Fig. 8), the N root is
seen not to be conducting as much water as its diametrically opposite companion. It
would seem initially that the N root is drawing water from drier soil, for although the S
root is just 5% bigger in cross-sectional area, the flow there is 1.4 times that of the N root.
The response to irrigation is sudden when this N root is wetted. Here the root has
responded more dramatically than the well-irrigated root of Moreno et al. (1996) because
the ‘catchment’ soil here is drier. Also the root here was still hydraulic functioning prior
to wetting, whereas the lack of response in the unirrigated root of Moreno et al. (1996)
was presumably because emboli there had resulted in a cessation of significant sap flow.
The rapid response here is similar to other non-root observations of the quick recovery
of the olive tree following periods of drought (Natali et al., 1985; Jorba et al., 1985;
Fernandez et al., 1997a,b). After the first semi-irrigation, the ratio of flow in these
similar-sized roots now favours the N root in the ratio of 1.65. Prior to irrigation, the N
root was supplying about 1.7% of the tree’s water, whereas afterwards this had doubled to
3.4%. Thus, the tree has preferentially shifted its root activity to favour uptake from that
region of soil which had recently been wetted. The same behaviour has also been
observed in kiwifruit vines by Green and Clothier (1995), although they noted a sustained
rise in the dependence of uptake from the wetted soil, over a period of days after wetting.
This they attributed to new root growth in the wetted soil. Our data do not extend
sufficiently long after the irrigation to see if the same response might have occurred here.
Nocturnal flow, presumably to supply recharge of the tree’s storage, also occurs now in
the N root once the northern-sector soil has been wetted. The complete absence of
measured root flow at night prior to the irrigation in the N root, and the sluggishness in
the measured diurnal trace of this root prior to wetting, might be due to one of two causes,
or a combination of both. We stopped searching for a cross-over time in the temperature
traces of the up and downstream sensors after 500 s, and so we may have missed
recording some really low flows at night in the N root. Alternatively, it may have been
that reverse flow at night (Sakuratani et al., 1999), the so-called hydraulic lift, may have
been acting in the counter direction to result in the unusual shape of the trace of sap flow
in the N root prior to DOY 287. Such a flow would result in nocturnal measurement of
zero values, and the onset of reverse flow in the late afternoon, and its maintenance in the
morning, would lead to a shortened period of measured positive flow. Resolution of this
will need to await a detailed study.
In this study, we did not measure in detail the leaf area of the entire tree, so in
referencing our sap flow measurements to the ambient weather using the Penman–
Monteith formula, we have had to limit our comparison to a matching with that
normalised to the leaf area. This stresses the need to measure the total leaf area of the tree,
and highlights the need for better and easier techniques to measure leaf area in the field.
Prior to the irrigation on DOY 287, our tree had been without water for a period of some 38
J.E. Fernandez et al. / Agricultural Water Management 51 (2001) 99–123 119

days. As a measure of the impact of the two semi-irrigations, we examine changes in the
ratio of the measured sap flow to the normalised Penman–Monteith transpiration. Over the
days 284–286, prior to the first wetting, the ratio of the measured sap flow to the normalised
E�p was 18.0 m2, whereas over the 2 days 291–292 following both wettings, this was
20.7 m2. A rough estimation of the leaf area showed that this latter value is more likely to be
closer to the actual leaf area. The 15% change in this ratio, following wetting, is probably
due to a rise in the canopy conductance as a result of some release of the water stress. So it
would seem that over the period of 35 days without irrigation or rain, this tree had, by DOY
284, developed some degree of water stress. Comparison of the transpiration determined
from sap flow measurement over 8 days, with the calculated E�p values in Figs. 8 and 9,
reveals a coherency that confirms that the heat-pulse technique is a useful tool for
monitoring both the short and medium-term dynamics of water use in olives.
We have found the compensation heat-pulse technique to be suitable for the design of
an automatic system for the irrigation of an olive orchard. It appears possible to irrigate
with the adequate doses and frequency to keep the plants within a certain prescribed level
of water stress. Our results show that three different strategies, at least, could be adopted
in the development of such a system.
Estimation of the total water consumed by representative trees in the orchard. This
approach requires of a high number of sensors for an accurate estimation of Ep. In
addition, the soil evaporation (Es, mm) must be estimated to obtain the value of ETo in the
orchard, needed for the calculation of the irrigation dose. This can be done either from
empirical measurements or from models especially adapted for the orchard conditions.
Good examples of these two ways of estimating Es in olive tree orchards are given by
Palomo et al. (1998) and Bonachela et al. (1999).
Monitoring the changes in the hydraulic behaviour of the tree induced by water stress.
The shape of the sap velocity profile measured in the trunk, or the features of the
hydraulic behaviour of the roots mentioned in Section 3.4 could be used as signals for the
automatic controller. This approach requires significant data processing.
Monitoring the SP2/SP1 rate (SP1 ¼ sap flow in a representative tree of the orchard,
irrigated with enough water to cover the tree demand; SP2 ¼ sap flow in a representative
tree of the orchard, irrigated with the water dose applied in the orchard). A decrease in the
SP2/SP1 rate indicates that the trees in the orchard are consuming water below the
maximum potential Ep. This is a simple and clear signal for an automatic controller able
to supply water as a function of the transpiration dynamics. This approach does not
require an estimate of Es, and it needs a reduced number of sensors and little data
processing. Besides, the errors due to both the probe location and to the tissue reaction
will be minimised, since the system will only use relative values of sap flow.
5. Conclusions
From the results presented here, we have shown that the heat-pulse technique for
measuring sap flow is a tool of two-fold benefit in olives. With appropriate replication, it
can be used as a research tool to provide a robust measure of the tree’s water use and
hydraulic functioning. Furthermore, it has potential to be used as a device to provide a
120 J.E. Fernandez et al. / Agricultural Water Management 51 (2001) 99–123

signal from which decisions can be made concerning the need for, and timing of,
irrigation.
Our two tests have confirmed that a robust measure of transpiration can be obtained
using the compensation heat pulse technique in olives. The technique can be used with a
wound width of 2.0 mm, and using the standard set of correction coefficients of Green
and Clothier (1988). Little impact was observed in the choice of the integration procedure
that is used to transform the velocity profile into a volume flux. Some differences in flow
were found between the two different probe sets in the stem section, or excised tree. This
illustrates some need to replicate in order to account for spatial variability.
In the water-stressed olive tree of field experiment 1, and in many other instances of
drought-affected trees in the field, we have noted a loss of flow in the xylem vessels of the
outer annuli. This presumably occurs as a result of stomatal control in young leaves and
of cavitation within the vessels. Under such circumstances, the unusual nature of the
velocity profiles means that our standard probes, which are weighted to measure near the
cambium, might not adequately sample the flow. Furthermore, in such cases, the scheme
we normally use for radially integrating J(r) (i.e. Eq. (5)) might not be accurate (cf.
Hatton et al., 1990). This then highlights the need for some care when radially integrating
profiles of sap velocity to infer the volumetric rate of transpiration by trees.
In field experiment 2, we have extended our measurements of sap flow to observe flow
in an olive tree under some degree of water stress. First, we have examined the spatial
variability of measured sap flow in the trunk, and we have noted variation due to the
natural variation in the flow paths in the sapwood. The range in the values from three
sensors was almost equal to the mean value computed from the trio. Furthermore, we
examined how variation might also be dependent on azimuthal variation in the
availability of soil water around the tree. In our case, increasing the latter, actually
decreased the variability in the inter-probe range down to under 20% of the mean. Some
two to four sensors would seem sufficient for olive to permit robust measurement of the
tree’s water use, although this might be further reduced by judicious placement of the
probes in ‘smooth and straight’ sections of the trunk. We consider that monitoring the
flow in the outer annuli of the trunk or main roots may provide an early and sensitive
indicator of either the onset, or severity of water stress. So if heat pulse gear were to be
used as a device for controlling the irrigation system, the need to record accurately the
tree’s water use is diminished. Rather a control device would be seeking to detect
changed hydraulic behaviour consequent upon the onset of water stress. Fewer sensors
will be required, but more analysis of the diurnal traces will be needed to deduce the
appropriate information. It would seem that a focus on flow in the outer xylem vessels
may offer the best hope. Another option, probably the most advantageous one, is simply
to use the slope of the SP2/SP1 ratio for operating the irrigation controller. With this
approach, soil evaporation does not have to be estimated, the required number of sensors
is low and the data processing is reduced to a minimum.
Acknowledgements
We are grateful to the Comision Interministerial de Ciencia y Tecnologıa of the
Spanish Ministry of Education and Science for the financial support of this project.
J.E. Fernandez et al. / Agricultural Water Management 51 (2001) 99–123 121

Thanks are also due to Antonio Ortiz, for his valuable help in the design and construction
of the devices used in the calibration experiments, as well as to Jose Rodrıguez and the
staff of the experimental farm La Hampa, for their help in the experimental work.
References
Barret, D.J., Hatton, T.J., Ash, J.E., Ball, M.C., 1995. Evaluation of the heat-pulse velocity technique for
measurement of sap flow in rainforest and eucalypt forest species of south-eastern Australia. Plant Cell.
Environ. 18, 463–469.
Bonachela, S., Orgaz, F., Villalobos, F.J., Fereres, E., 1999. Measurement and simulation of evaporation from
soil in olive orchards. Irrigat. Sci. 18, 201–205.
Braun, P., 1997. Sap flow measurements in fruit trees — advantages and shortfalls of currently used systems.
Acta Hort. 449, 267–272.
Cohen, Y., Fuchs, M., Green, G.C., 1981. Improvement of the heat pulse method for determining sap flow in
trees. Plant Cell. Environ. 4, 391–397.
Dichio, B., Xiloyannis, C., Celano, G., Arcieri, M., Palese, A.M., 1998. Flussi xilematici e consumi idrici in
olivo in condizioni di diversa disponibilita idrica. In: Proceedings of the Convegno Nazionale Irrigazione e
Ricerca: Progressi nell’uso della risorsa acqua. Bari, 1–2 October, pp. 84–90.
Doorenbos, J., Pruitt, W.O., 1977. Guidelines for predicting crop water requirements. FAO Irrigation and
Drainage Paper 24, 2nd Edition, FAO, Rome, Italy.
Edwards, W.R.N., Warrick, N.W.M., 1984. Transpiration from a kiwifruit vine as estimated by the heat-pulse
technique and the Penman–Monteith equation. N.Z. J. Agric. Res. 27, 537–543.
Fernandez, J.E., Moreno, F., 1999. Water use by the olive tree. J. Crop Product. 2 (2), 101–162.
Fernandez, J.E., Moreno, F., Clothier, B.E., Green, S.R., 1996. Aplicacion de la tecnica de compensacion de
pulso de calor a la medida del flujo de savia en olivo. Comunicaciones al XIV Congreso Nacional de Riegos.
Aguadulce, Almerıa, 11–13 June, pp. 1–7.
Fernandez, J.E., Moreno, F., Giron, I.F., Blazquez, O.M., 1997a. Stomatal control of water use in olive tree
leaves. Plant and Soil 190, 179–192.
Fernandez, J.E., Palomo, M.J., Dıaz-Espejo, A., Giron, I.F., 1997b. Calibrating the compensation heat-pulse
technique for measuring sap flow in olive. Acta Hort. 474 (2), 455–458.
Fernandez, J.E., Palomo, M.J., Dıaz-Espejo, A., Giron, I.F., Moreno, F., 1998. Measuring sap flow in olive trees:
potentialities and limitations of the compensation heat-pulse technique. In: Proceedings of the 4th Workshop
on Measuring Sap Flow in Intact Plants. Zidlochovice, Czech Republic, 3–4 November, p. 16, in press.
Green, S.R., 1993. Radiation balance, transpiration and photosynthesis of an isolated tree. Agric. For. Meteorol.
64, 201–221.
Green, S.R., Clothier, B.E., 1988. Water use of kiwifruit vines and apple trees by the heat-pulse technique. J.
Exp. Bot. 39, 115–123.
Green, S.R., Clothier, B.E., 1995. Root water uptake by kiwifruit vines following partial wetting of the root
zone. Plant and Soil 173, 317–328.
Green, S.R., McNaughton, K.G., Clothier, B.E., 1989. Observations of night-time water use in kiwifruit vines
and apple trees. Agric. For. Meteorol. 48, 251–261.
Hatton, T.J., Catchpole, E.A., Vertessy, R.A., 1990. Integration of sap flow velocity to estimate plant water use.
Tree Physiol. 6, 201–209.
Huber, B., 1932. Beobachtung und Messung pflanzlicher Saftstroeme. Ber. Dtsch. Bot. Ges. 50, 89–109.
Jorba, J., Tapia, L., Sant, D., 1985. Photosynthesis, leaf water potential, and stomatal conductance in Olea
europea under wet and drought conditions. Acta Hort. 171, 237–246.
Mantovani, C.E., Berengena, J., Villalobos, F.J., Orgaz, F., Fereres, E., 1991. Medidas y estimaciones de la
evapotranspiracion real del trigo de regadıo en Cordoba. Actas IX Jornadas Tecnicas de Riego, Granada,
Spain.
Marshall, D.C., 1958. Measurement of sap flow in conifers by heat transport. Plant Physiol. 33, 385–396.
Moreno, F., Fernandez, J.E., Clothier, B.E., Green, S.R., 1996. Transpiration and root water uptake by olive
trees. Plant and Soil 184, 85–96.
122 J.E. Fernandez et al. / Agricultural Water Management 51 (2001) 99–123

Nadezhdina, N., Cermak, J., 1997. Automatic control unit for irrigation systems based on sensing the plant water
status. Ann. Inst. Sup. Agronom. 46, 149–157.
Natali, S., Xiloyannis, C., Angelini, P., 1985. Water consumptive use of olive trees (Olea europaea) and effect of
water stress on leaf water potential and diffusive resistance. Acta Hort. 171, 341–351.
Palomo, M.J., Dıaz-Espejo, A., Fernandez, J.E., Giron, I.F., Moreno, F., 1998. Using sap flow measurements to
quantify water consumption in the olive tree. In: Pereira, L.S., Gowing, J.W. (Eds.), Water and the
Environment: Innovative Issues in Irrigation and Drainage. E&FN Spon, Pereira, pp. 205–212.
Sakuratani, T., 1981. A heat balance method for measuring water flow rate in the stem of intact plants. J. Agric.
Meteorol. 37, 9–17.
Sakuratani, T., Aoe, T., Higuchi, H., 1999. Reverse flow in roots of Sesbania rostrata measured using the
constant power heat balance method. Plant Cell. Environ. 22, 1153–1160.
Smith, D.M., Allen, S.J., 1996. Measurement of sap flow in plant stems. J. Exp. Bot. 47, 1833–1844.
Swanson, R.H., 1983. Numerical and experimental analyses of implanted-probe heat pulse velocity theory. Ph.D.
Thesis, Department of Botany, University of Alberta, Alta., Canada.
Swanson, R.H., 1994. Significant historical developments in thermal methods for measuring sap flow in trees.
Agric. For. Meteorol. 72, 113–132.
Swanson, R.H., Whitfield, D.W.A., 1981. A numerical analysis of heat-pulse velocity theory and practice. J.
Exp. Bot. 32, 221–239.
Vieweg, G.H., Ziegler, H., 1960. Thermoelektrische Registrierung der Geschwindigkeit des Transpirations-
stromes I. Dtsch. Bot. Ges. Ver. 73, 221–226.
J.E. Fernandez et al. / Agricultural Water Management 51 (2001) 99–123 123