heat! a bank health assessment tool - imf · heat! a bank health assessment tool ... relative bank...
TRANSCRIPT

HEAT! A Bank Health Assessment Tool
Li Lian Ong, Phakawa Jeasakul and Sarah Kwoh
WP/13/177

© 2013 International Monetary Fund WP/13/177
IMF Working Paper
Monetary and Capital Markets Department
HEAT! A Bank Health Assessment Tool
Prepared by Li Lian Ong, Phakawa Jeasakul and Sarah Kwoh1
Authorized for distribution by Cheng Hoon Lim
August 2013
Abstract
Developments during the global financial crisis have highlighted the importance of differentiating across financial systems and institutions. Assessments of financial stability have increasingly considered the characteristics of individual banks within a financial system, as well as those with significant international reach, to identify vulnerabilities and inform policy decisions. This paper proposes a simple measure of bank soundness, the Bank Health Index (BHI), to facilitate preliminary analyses of individual financial institutions relative to their peers. The evidence suggests that the BHI is useful for a first-pass identification of bank soundness conditions. Automated spreadsheet templates of the bank Health Assessment Tool (HEAT!) are provided for users with access to the BankScope, Bloomberg and/or SNL database(s).
JEL Classification Numbers: G21.
Keywords: asset quality, Bank Health Index, bank soundness, capital adequacy, earnings, HEAT!, heatmap, leverage, liquidity.
Authors’ E-Mail Addresses: [email protected]; [email protected].
1 We would like to thank Ruchir Agarwal, Serkan Arslanalp, Francesco Columba, Enrica Detragiache, Andy Jobst, Raphael Lam, Srobona Mitra, Hélène Poirson and Faezeh Raei for their useful comments; and Ricardo Cervantes for research assistance. All remaining mistakes are our responsibility.
This Working Paper should not be reported as representing the views of the IMF. The views expressed in this Working Paper are those of the author(s) and do not necessarily represent those of the IMF or IMF policy. Working Papers describe research in progress by the author(s) and are published to elicit comments and to further debate.
2
Contents Page
Abstract ......................................................................................................................................1
I. Introduction ........................................................................................................................3
II. Data and Methodology .......................................................................................................4
III. Application of the BHI and HEAT! ...................................................................................6 A. International Peer Group Example ............................................................................6 B. Back-testing: Spain Case Study ................................................................................6
IV. Main Caveats ......................................................................................................................8
V. Concluding Remarks ..........................................................................................................9
References ................................................................................................................................19 Figures 1. G-SIBS: Heatmap of the BHI and Its Constituent Components by Systemic Bucket .....10 2. Spain: Consolidation of the Banking Sector ....................................................................11 3. Spain: Heatmap of the BHI for Selected Banks ...............................................................12 4. G-SIBS: Heatmaps of Liquidity Ratios by Definition vis-à-vis Government Debt Holdings ...........................................................................................................................13 5. G-SIBS: Heatmaps of the BHI by Database ....................................................................14 Appendix I. User Guide: Operating Instructions for HEAT! ...............................................................15

3
I. INTRODUCTION
The impact of the global financial crisis on individual banking systems and banks has highlighted the importance of differentiating across countries and among financial institutions. Traditionally, macroprudential surveillance of the financial sector has complemented the microprudential oversight of individual financial institutions by supervisors (The World Bank/IMF, 2005). However, the growing systemic importance of these institutions, notably banks, and their potential impact on policy and the public purse have underscored the need to extend any macroprudential analysis to include individual systemic institutions as well.
The depth and protracted nature of the current crisis have revealed vast divergences in the resilience of individual banks. This is, in large part, attributable to banks’ business models and management quality, sometimes mitigated by the various pre-emptive or supportive policy actions taken by country authorities. In many cases, specific knowledge of characteristics underpinning individual banks’ financial health has been crucial for identifying vulnerabilities and informing policy decisions for crisis prevention or management purposes. Looking ahead, lessons learned from this crisis suggest that more granular, bank-specific analysis will become increasingly more important in that it could:
enable early identification of vulnerabilities in global systemically important banks (G-SIBs) and domestic systemically important banks (D-SIBs), which could help prevent widespread spillovers from any realization of tail risks if appropriate mitigation actions are put in place;
inform system-wide reform strategies by differentiating the core, healthy banks from the very weak ones that require significant restructuring or even resolution, so that the strong banks are not burdened with a “one size fits all” solution for an entire system; and
inform restructuring decisions, such as mergers and acquisitions, recapitalization and/or liquidity support, by highlighting banks’ weaknesses or identifying the weak banks.
To this end, this paper proposes a simple, broadly-based measure of bank soundness that would allow preliminary, first-pass analysis of the health of individual financial institutions and, consequently, financial systems. We develop a Bank Health Index (BHI) and provide automated spreadsheet templates, the bank Health Assessment Tool (HEAT!), to facilitate the exercise. We show that the BHI, albeit simple, can be useful for initial identification of relative bank soundness and is also able to identify more specific areas of vulnerability. However, we also note its limitations and acknowledge that such analyses would need to be complemented by more rigorous and robust quantitative (e.g., stress tests) and qualitative (e.g., supervisory and regulatory frameworks) assessments.

4
The paper is structured as follows: Section II describes the data requirements and the construction of the BHI, as well as the generation of the BHI heatmap using the HEAT! template. Section III provides an example of its application, as well as a back-test for the usefulness of the BHI using a well-known country example. A discussion of the main caveats associated with the BHI and its constituent components is presented in Section IV, followed by some concluding remarks in Section V. The user guide for HEAT! is provided in Appendix I.
II. DATA AND METHODOLOGY
Banks’ financial statements data (preferably audited) are required for calculating the BHI. For the purposes of this paper and the application of the enclosed HEAT! template, data from the BankScope, Bloomberg and SNL databases are used. As a rough and ready measure of individual banks’ health, we calculate simple CAMELS2-type ratings for each institution in the defined sample. A BHI is subsequently derived from the ratings and a heatmap is generated to provide a snapshot of a particular bank or banking system. A description of the method follows:
1. First, the following five financial ratios are calculated. Their definitions vary slightly depending on the database:
Capital adequacy: Capital adequacy ratio, defined as total equity to RWA (BankScope); or as Tier 1 capital to RWA (Bloomberg and SNL);
Asset quality: Non-performing loans (NPL) ratio, defined as impaired loans to gross loans, less ratio of provisions to gross loans (BankScope and SNL); or as NPL to gross loans, less ratio of provisions to gross loans (Bloomberg and SNL).3
Earnings: Profitability ratio, defined as the return on average assets (BankScope and SNL); or as the return on total assets (Bloomberg).
Liquidity: Liquidity ratio, defined as liquid assets to deposits and short-term borrowing (both BankScope and Bloomberg); or as liquid assets to total liabilities (SNL).
Leverage: Leverage ratio, defined as tangible common equity to tangible assets (BankScope, Bloomberg and SNL).
2. Each financial ratio is then normalized to facilitate comparability, such that:
2 “CAMELS” integrates ratings from six component areas: Capital adequacy, Asset quality, Management, Earnings, Liquidity, and Sensitivity to market risk.
3 For SNL, the availability of NPL or impaired loans depends on the accounting standard applied in a particular system.
5
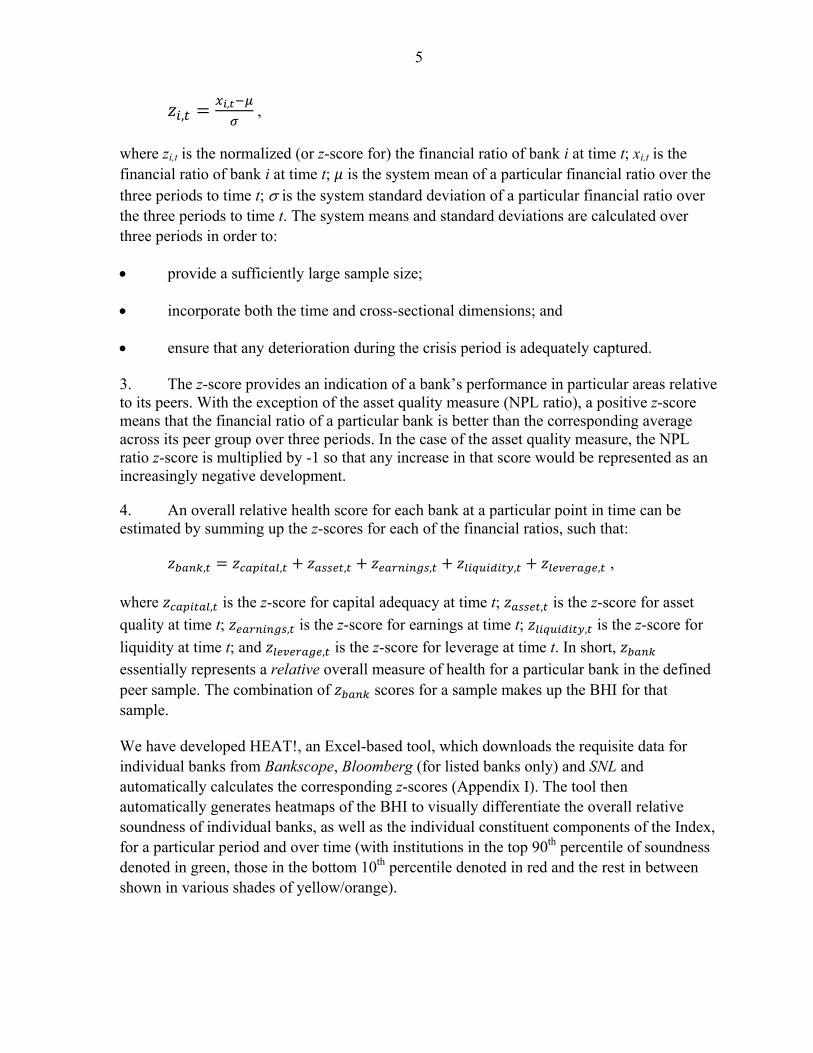
,, ,
where zi,t is the normalized (or z-score for) the financial ratio of bank i at time t; xi,t is the financial ratio of bank i at time t; is the system mean of a particular financial ratio over the three periods to time t; is the system standard deviation of a particular financial ratio over the three periods to time t. The system means and standard deviations are calculated over three periods in order to:
provide a sufficiently large sample size;
incorporate both the time and cross-sectional dimensions; and
ensure that any deterioration during the crisis period is adequately captured.
3. The z-score provides an indication of a bank’s performance in particular areas relative to its peers. With the exception of the asset quality measure (NPL ratio), a positive z-score means that the financial ratio of a particular bank is better than the corresponding average across its peer group over three periods. In the case of the asset quality measure, the NPL ratio z-score is multiplied by -1 so that any increase in that score would be represented as an increasingly negative development.
4. An overall relative health score for each bank at a particular point in time can be estimated by summing up the z-scores for each of the financial ratios, such that:
, , , , , , , where , is the z-score for capital adequacy at time t; , is the z-score for asset
quality at time t; , is the z-score for earnings at time t; , is the z-score for
liquidity at time t; and , is the z-score for leverage at time t. In short, essentially represents a relative overall measure of health for a particular bank in the defined peer sample. The combination of scores for a sample makes up the BHI for that sample.
We have developed HEAT!, an Excel-based tool, which downloads the requisite data for individual banks from Bankscope, Bloomberg (for listed banks only) and SNL and automatically calculates the corresponding z-scores (Appendix I). The tool then automatically generates heatmaps of the BHI to visually differentiate the overall relative soundness of individual banks, as well as the individual constituent components of the Index, for a particular period and over time (with institutions in the top 90th percentile of soundness denoted in green, those in the bottom 10th percentile denoted in red and the rest in between shown in various shades of yellow/orange).

6
III. APPLICATION OF THE BHI AND HEAT!
In this section, we show the application of the BHI and the output from the HEAT! template. First, we analyze the soundness of a widely-known peer group of major international banks, both in terms of their overall health (i.e., the BHI) and the associated individual constituent components, as an example. We subsequently introduce a familiar case study of a domestic banking system which has undergone significant restructuring in recent years, for back-testing purposes. It is important to emphasize that these exercises are not aimed at providing assessments of particular banks in the sample but rather, to use well-known events and examples for demonstration purposes only.
A. International Peer Group Example
We begin by comparing the BHI of a selected group of banks as well as the constituent components of the Index. A ready-made peer group, officially identified as global systemically important banks (G-SIBs) by the Basel Committee on Banking Supervision (BCBS, 2011) and consisting of the 28 banks listed by the Financial Stability Board (FSB, 2012), is used to demonstrate the tool. For this reason, we deliberately anonymize the individual banks to avoid implicating any particular institution; we also combine the banks in systemic buckets 3 and 4 to avoid easy identification of those institutions.
We apply data to December 2012 to show clear differentiation across the G-SIBs (Figure 1). An overview of the results suggests that:
G-SIBs have improved their earnings performance relative to the “trough” in 2008.
The majority of banks appear to have deleveraged since 2008 as evidenced by their improved leverage ratios.
When compared across the various buckets of systemic importance, the heatmaps indicate that:
A smattering of G-SIBs in the various buckets exhibit distinct overall weakness relative to their peers.
The G-SIBs in Bucket 1 have relatively lower capital adequacy, are less liquid and more leveraged; the banks in Bucket 2 have recorded relatively weaker earnings and remain more leveraged; while asset quality and leverage are the main weaknesses in Bucket 3+4.
B. Back-testing: Spain Case Study
The now well-known history of the Spanish banking system serves as an appropriate backdrop for back-testing the usefulness of the BHI. The Spanish banking system has undergone significant consolidation since the onset of the global financial crisis:
7
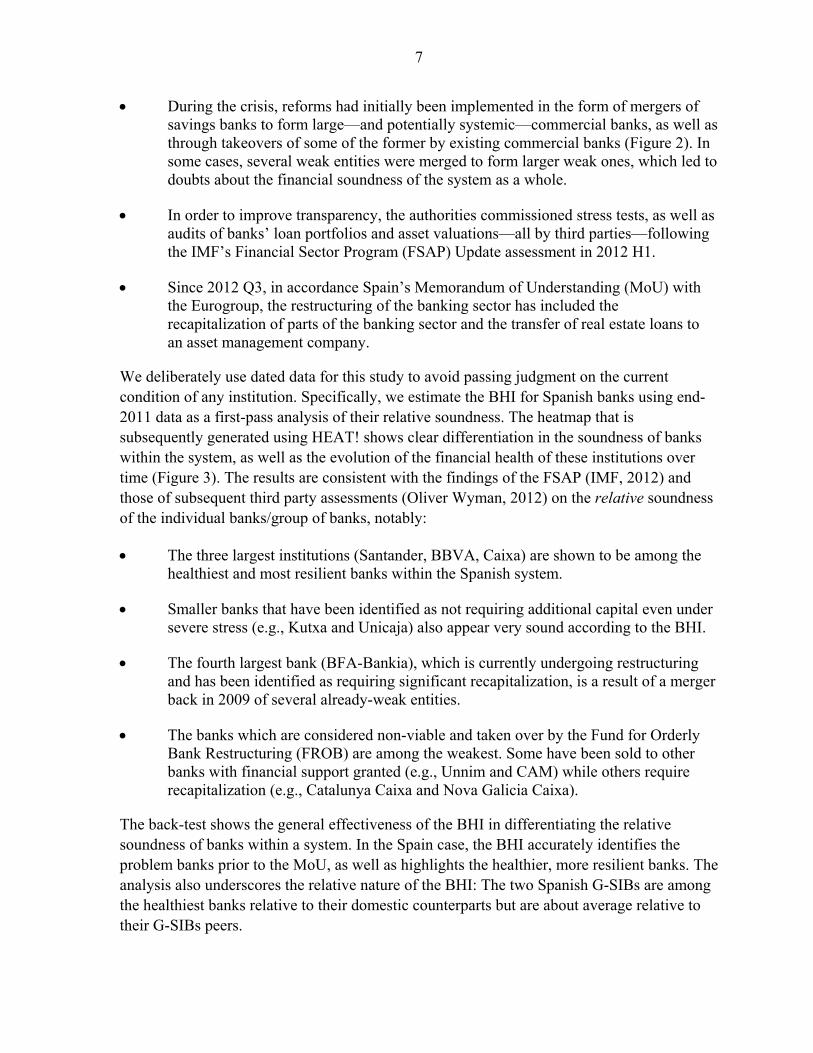
During the crisis, reforms had initially been implemented in the form of mergers of savings banks to form large—and potentially systemic—commercial banks, as well as through takeovers of some of the former by existing commercial banks (Figure 2). In some cases, several weak entities were merged to form larger weak ones, which led to doubts about the financial soundness of the system as a whole.
In order to improve transparency, the authorities commissioned stress tests, as well as audits of banks’ loan portfolios and asset valuations—all by third parties—following the IMF’s Financial Sector Program (FSAP) Update assessment in 2012 H1.
Since 2012 Q3, in accordance Spain’s Memorandum of Understanding (MoU) with the Eurogroup, the restructuring of the banking sector has included the recapitalization of parts of the banking sector and the transfer of real estate loans to an asset management company.
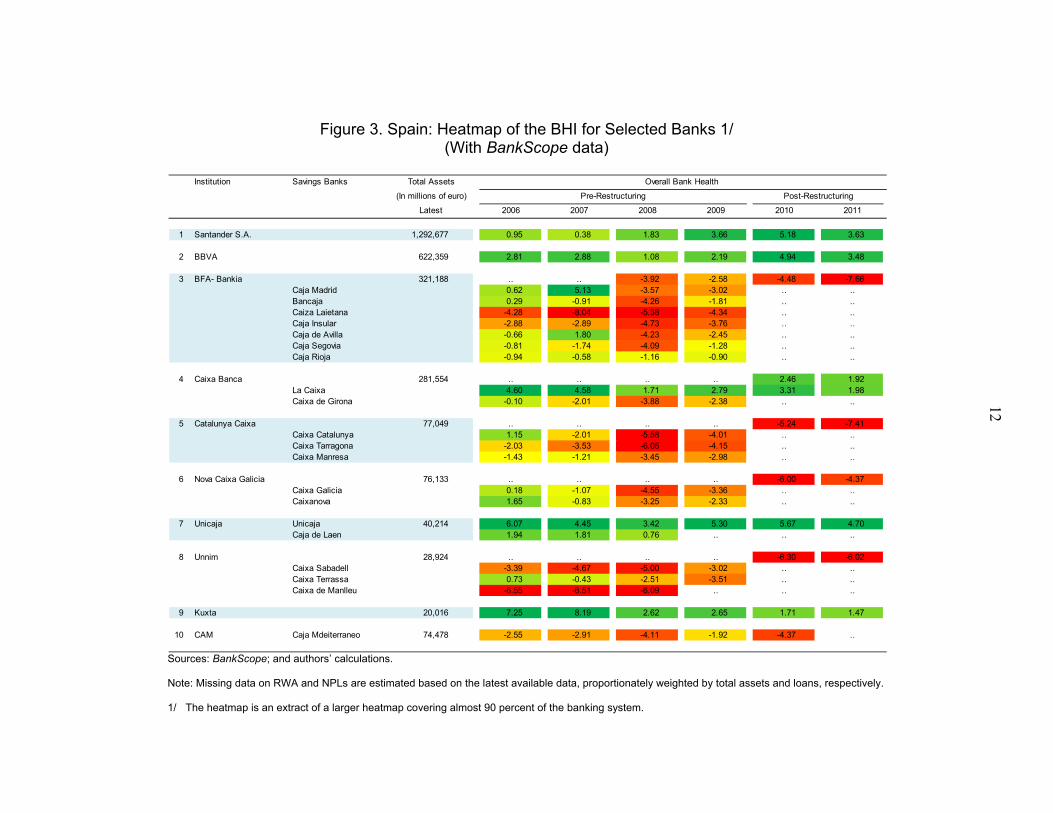
We deliberately use dated data for this study to avoid passing judgment on the current condition of any institution. Specifically, we estimate the BHI for Spanish banks using end-2011 data as a first-pass analysis of their relative soundness. The heatmap that is subsequently generated using HEAT! shows clear differentiation in the soundness of banks within the system, as well as the evolution of the financial health of these institutions over time (Figure 3). The results are consistent with the findings of the FSAP (IMF, 2012) and those of subsequent third party assessments (Oliver Wyman, 2012) on the relative soundness of the individual banks/group of banks, notably:
The three largest institutions (Santander, BBVA, Caixa) are shown to be among the healthiest and most resilient banks within the Spanish system.
Smaller banks that have been identified as not requiring additional capital even under severe stress (e.g., Kutxa and Unicaja) also appear very sound according to the BHI.
The fourth largest bank (BFA-Bankia), which is currently undergoing restructuring and has been identified as requiring significant recapitalization, is a result of a merger back in 2009 of several already-weak entities.
The banks which are considered non-viable and taken over by the Fund for Orderly Bank Restructuring (FROB) are among the weakest. Some have been sold to other banks with financial support granted (e.g., Unnim and CAM) while others require recapitalization (e.g., Catalunya Caixa and Nova Galicia Caixa).
The back-test shows the general effectiveness of the BHI in differentiating the relative soundness of banks within a system. In the Spain case, the BHI accurately identifies the problem banks prior to the MoU, as well as highlights the healthier, more resilient banks. The analysis also underscores the relative nature of the BHI: The two Spanish G-SIBs are among the healthiest banks relative to their domestic counterparts but are about average relative to their G-SIBs peers.

8
IV. MAIN CAVEATS
As with all indicators and tools, specific caveats are attached to the use of the BHI and HEAT! and should be taken into consideration in any analysis. We discuss the main caveats in this section.
Aggregation The BHI should be complemented by an analysis of its individual constituent components (Figure 1). The Index comprises aggregated z-scores, which provide an overall measure of bank health but which may also hide valuable information about particular aspects of individual banks’ performance.
Relativity The BHI and heatmap only show the relative health of banks within a chosen sample. The Index is a relative rather than an absolute indicator, i.e., a particular bank is merely the “healthiest” or “weakest” bank in the peer group sample, not necessarily in absolute terms. In other words, all the banks in a particular sample may actually be very sound or very weak, but the bank with the highest overall z-score in the group will show up as the healthiest (green on the heatmap). A comparison on absolute terms would require the inclusion in the sample of a peer institution that is known to be a representative global benchmark for financial strength.
Cross-sectional and inter-temporal comparisons The BHI does not adjust for nuances associated with heterogeneity across banks. HEAT! should ideally be applied in a homogeneous environment, i.e., to institutions with similar business models and subject to the same regulatory requirements, to facilitate consistency in comparisons. Where this is not the case, any analysis of the resulting BHI should take differences into consideration.
Comparisons over a longer time period may be affected by the method of calculating the z-scores. The system means and standard deviations are calculated over three periods on a rolling basis, which means that the z-scores for any one period are based on different means and standard deviations than for other periods, and the differences may be quite significant over an extended period.
Definition of variables within a database and across databases Definitions matter. The relative soundness of banks may be different depending on country peculiarities in definitions, and on the definition of variables within a database and across databases, specifically:

9
The definition of a variable may be inconsistent within a database itself owing to regulatory differences across countries. Non-performing loans (NPLs) are a case in point: There is no single international standard for the categorization of loans. Data for “impaired loans” in BankScope are used to calculate the NPL ratio, but not all countries may have the same definition for this classification. In some countries, “impaired loans” may be defined as the sum of doubtful and defaulted loans, while “NPL” refers to doubtful loans; in others, “NPL” may comprise the sum of substandard, doubtful and defaulted loans.
The relativities may be different depending on the user’s preferred definition of a particular ratio. An example is that of the calculation of liquidity ratios using BankScope. As demonstrated in Figure 4, the liquidity situation at the various banks in the sample may appear vastly different depending on whether the pre-defined liquidity ratio is used, or if government securities are included in the calculation of liquid assets to reflect the Basel III requirements (BCBS, 2013). In the latter case, banks which hold high levels of government securities are likely to appear very liquid.
The definitions of the variables in the BHI may differ across the BankScope, Bloomberg and SNL databases, as presented in Section II and presented in Figure 5.
V. CONCLUDING REMARKS
The global financial crisis has underscored the importance of individual banks to the stability of their own or even the global financial system. Thus, analyses of the health of individual banks, especially the systemic ones, are becoming a matter of course for surveillance purposes and for crisis management decisions. We have developed the BHI to enable simple, preliminary analyses of individual banks in financial systems around the world and introduced an Excel-based spreadsheet tool (HEAT!) to facilitate its calculation and presentation. Our back-test, based on actual developments in the Spanish banking system, suggests that the BHI is able to accurately differentiate banks according to their financial soundness.
That said, there are strong caveats attached to the use of the BHI and its components. Any representation about the health of individual banks using this method should be made with care. Specifically, the Index is an aggregation of ratios, so the performance of the individual components should also be considered in any analysis. Moreover, the associated z-scores do not provide an absolute assessment of the health of banks, but rather, their relative health within a sample, which means that the selection of the sample itself matters. The differences in banks’ business models at any point in time and their changing nature over time, as well as the definitions used in calculating the constituent components of the BHI should also be taken into account when interpreting the results. Last but not least, it is also important for the user to be familiar with the peculiarities of any banking system being analyzed and to ensure that any assessment is supplemented with other quantitative and qualitative information.

10
Figure 1. G-SIBs: Heatmap of the BHI and Its Constituent Components by Systemic Bucket (With BankScope data)
Sources: BankScope; BCBS; and authors’ calculations. Note: Overall z-scores not available for the banks for which asset quality is not relevant. Indicators in the top 90th percentile of soundness denoted in green, those in the bottom 10th percentile denoted in red and the rest in between shown in various shades of yellow. 1/ The bucket approach is described in BCBS (2011).
Systemic Institution
Bucket 1/ 2006 2007 2008 2009 2010 2011 2012 2006 2007 2008 2009 2010 2011 2012 2006 2007 2008 2009 2010 2011 2012 2006 2007 2008 2009 2010 2011 2012 2006 2007 2008 2009 2010 2011 2012 2006 2007 2008 2009 2010 2011 2012
Bank 1 -2.1 -1.8 -2.5 -0.3 -0.2 -1.7 -1.9 0.1 0.2 -0.2 0.5 0.3 -0.1 -0.1 0.6 0.5 0.5 0.9 -0.2 0.1 0.0 -1.2 -1.1 -1.3 -0.2 -0.4 -0.5 -0.8 1.2 1.1 1.0 1.2 0.7 0.7 0.6 -1.6 -1.5 -1.5 -0.9 -1.1 -1.8 -1.6
Bank 2 1.4 1.4 -1.6 0.4 0.1 -0.2 0.0 0.1 0.1 -0.8 -0.1 0.1 -0.3 -0.2 -0.1 -0.2 0.0 0.2 1.3 0.9 0.7 0.5 0.4 -0.5 -0.2 0.5 0.6 0.5 0.1 0.0 -0.2 -0.1 -0.1 -0.1 -0.1 0.6 0.6 -0.2 0.9 1.0 0.5 0.5
Bank 3 3.6 4.1 2.5 3.7 3.7 3.2 2.8 0.3 0.1 -0.1 0.3 0.3 -0.1 -0.3 -1.5 -2.2 -2.8 -2.3 -1.6 -1.5 -1.4 0.8 0.7 -0.4 0.3 0.9 1.0 1.0 0.2 0.3 -0.1 -0.2 0.0 0.0 -0.1 0.8 0.8 0.3 1.0 1.0 0.8 0.9
Bank 4 2.3 -0.8 -4.4 2.7 3.9 3.5 3.4 -0.1 -0.7 -1.1 0.6 0.8 0.7 0.7 -0.8 -2.3 -1.8 -1.1 -1.0 -0.3 -0.5 1.2 -1.6 -3.2 -0.8 0.4 0.3 0.3 0.0 0.1 0.0 0.3 0.3 0.2 0.1 0.4 -1.0 -1.9 1.5 1.4 1.9 1.8
Bank 5 -2.5 -4.9 -4.0 -0.7 -2.9 -2.4 -2.3 -0.7 -1.2 -0.8 0.3 0.1 0.1 -0.1 0.7 1.9 1.9 1.9 3.6 2.0 0.5 -0.8 -0.9 -0.4 0.4 0.0 -0.4 -1.1 1.0 0.9 0.4 0.7 0.8 0.6 0.5 -1.3 -1.7 -1.3 -0.1 -0.2 -0.6 -0.9
Bank 6 .. -1.7 -1.9 -1.8 -1.1 -2.1 -1.5 -0.4 -0.6 -0.7 -0.1 -0.1 -0.4 -0.2 .. 1.5 0.8 1.3 1.0 0.7 0.7 -0.7 -0.7 -0.6 -0.1 0.2 -0.2 0.1 1.9 2.0 1.2 0.0 0.0 -0.1 -0.1 -0.8 -0.9 -1.0 -0.3 -0.3 -0.6 -0.6
Bank 7 .. .. -3.1 -1.0 -0.7 -0.6 -0.6 .. .. -1.2 -0.5 -0.4 -0.6 -0.7 0.3 0.0 -0.1 -0.1 -0.4 -0.5 -0.6 -0.8 -1.1 -1.1 -0.3 -0.2 0.2 -0.2 -1.1 -1.1 -0.9 -0.9 -0.9 -0.8 -0.8 1.1 0.5 0.0 0.5 0.5 0.1 0.4
Bank 8 -2.4 -2.4 -6.9 -2.0 -2.3 -3.5 -4.3 -0.5 0.5 -0.5 1.0 0.5 0.3 0.1 0.5 0.5 1.1 2.0 1.8 1.8 1.6 -0.1 -0.6 -3.6 -0.8 -0.8 -1.3 -2.0 -0.5 -0.4 -0.8 -0.6 -0.4 -0.3 -0.4 -0.8 -1.4 -0.9 0.5 0.2 -0.3 -0.4
Bank 9 3.5 0.5 -1.4 1.1 0.2 0.2 1.1 0.3 0.1 -0.2 0.5 0.3 0.4 0.5 -1.4 -0.9 -0.9 -0.6 -0.4 0.1 0.0 1.9 0.4 -0.6 -0.1 -0.8 -0.8 -0.1 -0.6 -0.7 -0.9 -0.4 -0.3 -0.3 -0.3 0.5 -0.1 -0.7 0.5 0.6 1.0 1.0
Bank 10 -0.5 -4.1 -6.8 -2.2 2.4 2.4 1.4 1.0 -0.4 -1.2 0.5 2.1 2.4 1.9 0.3 0.3 2.0 1.0 0.3 -0.4 -0.6 -0.7 -2.6 -2.6 -0.9 0.5 -0.3 -0.7 1.3 1.2 1.2 0.8 0.8 0.9 0.7 -1.8 -2.0 -2.2 -1.6 -0.8 -1.0 -1.0
Bank 11 4.8 2.7 0.3 4.1 2.9 1.1 0.3 3.4 2.1 1.8 2.2 1.2 0.9 0.5 0.2 0.2 0.3 0.0 -0.2 -0.5 -0.6 0.1 -0.5 -2.0 0.4 0.3 -0.5 -0.8 1.5 1.4 1.3 1.6 1.6 1.4 1.2 0.1 -0.1 -0.5 -0.2 -0.4 -1.2 -1.2
Bank 12 .. .. .. .. .. .. .. .. .. 0.3 0.8 0.6 0.0 0.1 .. .. .. .. .. .. .. 1.1 1.0 -0.6 1.6 1.1 0.1 -0.2 2.1 2.4 3.0 2.4 3.5 3.6 3.3 0.4 0.4 1.5 2.8 2.4 1.9 1.6
Bank 13 .. .. .. .. .. .. .. .. .. .. .. 0.7 1.4 1.3 .. .. .. .. .. .. .. -0.1 -1.3 -0.6 -0.6 0.7 0.4 -0.3 0.2 0.7 2.6 1.4 3.2 2.8 2.9 -0.5 -0.6 1.0 0.7 1.4 2.6 2.5
Bank 14 .. 5.0 3.0 3.5 7.3 5.9 4.7 .. 3.7 2.9 3.7 4.0 3.6 3.2 .. -0.9 -1.0 -0.9 -1.3 -1.3 -1.4 .. 0.6 0.1 -1.5 1.4 1.0 0.4 .. -0.4 0.0 -0.1 0.1 0.2 0.0 .. 0.2 -1.0 0.5 0.5 -0.2 -0.3
Bank 15 -0.5 -1.6 -2.2 -1.1 -0.9 -2.5 -1.2 0.0 -0.2 -0.1 0.4 0.0 -0.4 -0.5 0.0 -0.1 0.2 0.0 0.0 -0.1 -0.2 -0.7 -0.9 -0.7 -0.3 -0.2 -0.9 -0.8 0.6 -0.1 -0.7 -0.9 -0.5 -0.6 0.7 -0.4 -0.4 -0.5 -0.2 -0.2 -0.8 -0.8
Bank 16 .. .. .. .. -2.3 -2.8 -1.8 .. .. .. .. -1.0 -1.1 -1.2 0.6 0.8 0.4 0.2 0.0 -0.2 -0.3 -0.9 -1.5 -1.6 -0.3 0.0 -0.2 0.1 -1.1 -0.7 -0.7 -0.7 -0.5 -0.6 -0.6 -0.6 -1.1 -1.6 -1.0 -0.8 -1.1 -0.4
Bank 17 2.6 3.7 3.7 2.9 3.4 3.4 3.2 0.1 0.2 0.3 -0.3 -0.3 -0.6 -0.8 0.4 -0.3 -0.6 -0.9 -1.2 -1.5 -1.7 0.3 0.8 0.8 1.2 1.5 1.7 1.8 -0.9 -0.8 -0.7 -0.8 -0.7 -0.6 -0.6 3.4 3.2 2.7 2.0 1.7 1.4 1.1
Bank 18 .. .. .. .. -1.8 -2.2 -2.5 .. .. .. .. -0.4 -0.6 -0.7 .. .. .. .. 0.4 0.0 -0.1 .. .. .. .. 0.1 -0.3 -0.4 .. .. .. .. -0.9 -0.9 -0.9 .. .. .. .. -0.3 -0.5 -0.7
Bank 19 0.4 -0.1 -0.3 0.0 -0.3 -1.6 -1.7 -0.5 -0.5 -0.2 0.0 -0.2 -0.3 -0.2 -0.9 -0.6 0.1 0.4 0.2 0.3 0.2 0.5 0.8 0.6 0.8 0.8 0.1 -0.4 -0.5 -0.7 -0.6 -0.7 -0.6 -0.6 -0.1 0.0 -0.4 0.0 0.3 -0.1 -0.5 -0.8
Bank 20 -2.0 -4.7 -3.1 -2.7 -1.5 -2.2 -2.1 -0.3 -0.9 -0.5 0.0 -0.1 -0.3 -0.3 1.4 1.4 1.3 2.1 1.3 1.0 0.9 -0.5 -1.7 -0.5 -0.5 0.1 -0.5 -0.7 0.9 0.6 -0.1 0.1 0.3 0.2 0.5 -0.7 -1.3 -0.7 -0.3 -0.5 -0.6 -0.7
Bank 21 .. .. .. -3.1 -0.9 -1.9 -2.1 .. .. .. -0.7 -0.4 -0.7 -0.5 .. .. 0.5 1.0 0.6 0.3 0.3 .. .. -1.3 -0.7 0.1 -0.4 -0.7 .. .. 0.1 -0.2 -0.2 -0.2 -0.2 .. .. -0.8 -0.5 0.2 -0.3 -0.4
Bank 22 .. 1.3 -2.0 1.4 1.7 2.2 3.0 .. -0.5 -1.3 -0.3 -0.2 -0.3 -0.3 -0.8 -1.5 -2.2 -1.2 -0.3 -0.1 -0.2 2.5 1.9 -0.5 1.0 1.2 1.9 2.4 -1.2 -1.4 -1.2 -1.2 -1.0 -1.0 -1.0 0.1 -0.3 -1.2 0.8 1.4 1.6 1.8
Bank 23 -2.3 -2.3 -2.7 -2.1 -2.2 -6.4 -3.2 -0.4 -0.1 0.1 0.5 0.4 -0.5 -0.2 1.9 2.1 2.0 2.4 2.3 2.1 2.4 -0.2 -0.2 -0.2 -0.3 -0.3 -3.2 -0.6 0.0 -0.3 -0.6 -0.6 -0.7 -0.8 -0.6 0.2 0.4 0.0 0.7 0.7 0.2 0.6
Bank 24 -4.9 -4.3 -4.8 -2.9 -1.6 -2.1 -1.6 -1.5 -1.3 -1.5 -0.8 -0.7 -0.8 -0.6 1.0 0.7 0.9 0.8 0.4 0.2 0.1 -1.1 -1.1 -0.8 -0.5 0.3 0.0 -0.2 -0.5 -0.7 -0.9 -1.0 -0.8 -0.8 -0.5 -0.8 -0.6 -0.6 0.2 0.1 -0.4 -0.2
Bank 25 -1.7 -1.1 -1.6 0.0 -0.6 -1.6 -1.2 -1.0 -0.9 -0.8 0.0 -0.3 -0.6 -0.6 0.4 0.1 0.3 0.3 0.0 -0.2 -0.2 0.3 0.1 0.1 0.2 0.3 -0.1 -0.1 -0.8 -0.6 -0.8 -0.4 -0.7 -0.5 0.0 0.3 0.4 0.2 0.6 0.2 -0.6 -0.6
Bank 26 2.1 1.8 -0.2 -0.6 0.5 -0.6 -0.5 -0.8 -0.6 -0.5 -0.3 -0.2 -0.5 -0.4 -1.7 -1.5 0.0 1.2 0.6 0.3 0.1 1.1 1.6 0.8 0.8 1.1 0.4 0.3 -0.7 -0.7 -0.8 -0.9 -0.8 -0.8 -0.8 0.8 0.1 0.3 1.0 1.1 0.7 0.6
Bank 27 -0.4 0.8 -0.6 0.7 2.3 1.9 1.6 -0.1 0.0 -0.1 0.0 0.3 0.0 -0.3 0.5 0.2 0.4 0.2 0.0 -0.4 -0.3 0.4 0.5 0.5 0.7 1.1 1.0 1.3 -1.0 -0.6 -0.7 -0.7 -0.6 -0.5 -0.3 0.7 1.0 0.2 0.9 1.5 1.0 0.6
Bank 28 .. 2.0 2.0 1.4 4.1 3.4 3.9 1.2 1.8 1.2 2.3 3.4 2.2 2.3 .. -0.2 -0.4 -0.9 1.5 0.6 0.1 0.7 0.5 1.0 -2.5 1.2 1.3 1.4 -0.7 -0.8 -0.3 -0.8 -0.8 -0.3 -0.6 1.6 0.2 -0.2 1.6 1.8 0.8 1.0
3 and 4
2
1
Overall Bank Health Capital Adequacy Asset Quality Earning Liquidity Leverage

11
Figure 2. Spain: Consolidation of the Banking Sector
Source: IMF (2012).
2009 2010 2011 2012 Asset Share
Banco Santander Banco Santander Banco Santander Banco Santander 18.9
BBVA BBVA BBVA
Caixa Sabadell BBVA 14.9Caixa Terrasa Unnim UnnimCaixa Menlleu (intervened by FROB and so ld to BBVA)
La Caixa La Caixa La CaixaCaixa Girona Caixabank 12.1
Cajasol Cajasol-GuadalajaraGuadalajara Banca Cívica
Caja NavarraCaja Burgos Banca CívicaCaja Canarias
Caja MadridBancajaCaja Insular CanariasCaixa Laietana BFA-Bankia BFA-Bankia BFA-Bankia 11.9Caja ÁvilaCaja SegoviaCaja Rioja
Caixa CatalunyaCaixa Tarragona Catalunya Caixa Catalunya Caixa Catalunya Caixa 2.5Caixa Manresa (Major stake owned by FROB) (Major stake owned by FROB)
Caixa Galicia Nova Caixa Galicia Nova Caixa Galicia Nova Caixa Galicia 2.5Caixanova (Major stake owned by FROB) (Major stake owned by FROB)
Banco Sabadell Banco SabadellBanco Guipuzcoana Banco Sabadell Banco Sabadell 5.6
CAM CAM(Intervened by FROB and sold to Banco Sabadell)
Banco Popular Banco Popular Banco Popular Banco Popular 5.5Banco Pastor Banco Pastor Banco Pastor
Unicaja Unicaja UnicajaCaja Jaén Unicaja* 2.7
Caja Duero Ceiss CeissCaja España
BBK BBKCajasur Kutxa Bank Kutxa Bank 2.6
Caja Vital Caja VitalKutxa Kutxa
Caja MurciaCaixa Penedés Banco Mare Nostrum Banco Mare Nostrum Banco Mare Nostrum* 2.4Caja GranadaSa Nostra
Ibercaja Ibercaja Ibercaja
CAI CAI Ibercaja 2.3Caja Círculo Caja Círculo Caja 3Caja Badajoz Caja Badajoz
Bankinter Bankinter Bankinter Bankinter 2.1
Cajastur CajasturCCMCaja Extremadura Caja Extremadura Liberbank Liberbank 1.9Caja Cantabria Caja Cantabria
Total 14 large and medium-sized banks 88.0Small private banks 3.1All other non-foreign banks not included above 5.1Cooperative sector 3.7Total banking sector, excluding foreign bank branches 100.0
12
Figure 3. Spain: Heatmap of the BHI for Selected Banks 1/ (With BankScope data)
Sources: BankScope; and authors’ calculations. Note: Missing data on RWA and NPLs are estimated based on the latest available data, proportionately weighted by total assets and loans, respectively. 1/ The heatmap is an extract of a larger heatmap covering almost 90 percent of the banking system.
Institution Savings Banks Total Assets
(In millions of euro)
Latest 2006 2007 2008 2009 2010 2011
1 Santander S.A. 1,292,677 0.95 0.38 1.83 3.66 5.18 3.63
2 BBVA 622,359 2.81 2.88 1.08 2.19 4.94 3.48
3 BFA- Bankia 321,188 .. .. -3.92 -2.58 -4.48 -7.66Caja Madrid 0.62 5.13 -3.57 -3.02 .. ..Bancaja 0.29 -0.91 -4.26 -1.81 .. ..Caiza Laietana -4.28 -8.04 -5.38 -4.34 .. ..Caja Insular -2.88 -2.89 -4.73 -3.76 .. ..Caja de Avilla -0.66 1.80 -4.23 -2.45 .. ..Caja Segovia -0.81 -1.74 -4.09 -1.28 .. ..Caja Rioja -0.94 -0.58 -1.16 -0.90 .. ..
4 Caixa Banca 281,554 .. .. .. .. 2.46 1.92La Caixa 4.60 4.58 1.71 2.79 3.31 1.98Caixa de Girona -0.10 -2.01 -3.88 -2.38 .. ..
5 Catalunya Caixa 77,049 .. .. .. .. -5.24 -7.41Caixa Catalunya 1.15 -2.01 -5.58 -4.01 .. ..Caixa Tarragona -2.03 -3.53 -6.05 -4.15 .. ..Caixa Manresa -1.43 -1.21 -3.45 -2.98 .. ..
6 Nova Caixa Galicia 76,133 .. .. .. .. -6.00 -4.37Caixa Galicia 0.18 -1.07 -4.55 -3.36 .. ..Caixanova 1.65 -0.83 -3.25 -2.33 .. ..
7 Unicaja Unicaja 40,214 6.07 4.45 3.42 5.30 5.67 4.70Caja de Laen 1.94 1.81 0.76 .. .. ..
8 Unnim 28,924 .. .. .. .. -6.30 -6.02Caixa Sabadell -3.39 -4.67 -5.00 -3.02 .. ..Caixa Terrassa 0.73 -0.43 -2.51 -3.51 .. ..Caixa de Manlleu -6.55 -6.51 -6.09 .. .. ..
9 Kuxta 20,016 7.25 8.19 2.62 2.65 1.71 1.47
10 CAM Caja Mdeiterraneo 74,478 -2.55 -2.91 -4.11 -1.92 -4.37 ..
Pre-Restructuring Post-Restructuring
Overall Bank Health

13
Figure 4. G-SIBs: Heatmaps of Liquidity Ratios by Definition vis-à-vis Government Debt Holdings (With BankScope data)
Sources: BankScope; BCBS; and authors’ calculations. Note: Indicators in the top 90th percentile of soundness denoted in green, those in the bottom 10th percentile denoted in red and the rest in between shown in various shades of yellow. 1/ The bucket approach is described in BCBS (2011). 2/ Liquidity Ratio (BankScope) = Liquid assets / (Deposits + Short-term Borrowing), where Liquid Assets = Trading Securities + Loans and Advances to Banks + Reverse Repos and Cash Collateral + Cash
and Due from Banks – Mandatory Reserves. 3/ HQLA = Cash and Due from Banks + Government Securities. 4/ Simplified LCR = HQLA / (10 percent of Deposits + 100 percent of Short-term Borrowing). 5/ The share of government securities is calculated as government securities held in a bank’s portfolio as a percentage of its total securities.
Systemic Institution Liquidity Ratio = High Quality Liquid Assets (HQLA) 3
Bucket 1/
2006 2007 2008 2009 2010 2011 2012 2006 2007 2008 2009 2010 2011 2012 2006 2007 2008 2009 2010 2011 2012 2006 2007 2008 2009 2010 2011 2012
Bank 1 0.1 0.0 -0.1 0.0 -0.1 -0.1 -0.1 0.3 0.2 0.0 0.5 -0.2 -0.4 -0.6 1.7 0.5 0.4 1.0 0.4 0.1 -0.1 20 16 16 28 15 13 11
Bank 2 1.2 1.1 1.0 1.2 0.8 0.8 0.7 .. -1.7 -0.8 -1.0 -0.8 -0.5 -0.7 .. -1.5 -0.6 -0.8 -0.6 -0.3 -0.5 .. 1 0 1 2 1 2
Bank 3 0.2 0.3 -0.1 -0.1 0.0 0.0 0.0 .. -0.1 0.3 0.3 -0.2 -0.1 0.1 .. 0.1 0.3 0.2 -0.2 0.0 0.1 .. 28 27 33 28 26 28
Bank 4 0.0 -0.2 -0.2 0.1 0.0 0.0 -0.2 .. -0.6 0.5 1.2 1.3 1.1 0.9 .. -0.8 0.2 1.3 1.0 0.7 0.5 .. 24 33 43 51 49 52
Bank 5 1.9 2.0 1.2 0.0 0.0 -0.1 -0.1 0.5 1.3 0.8 0.1 0.0 -0.1 -0.5 -0.2 0.2 0.1 -0.5 -0.5 -0.5 -0.7 13 19 16 23 25 21 17
Bank 6 1.0 0.9 0.4 0.7 0.5 0.3 0.3 1.9 2.0 -0.4 -0.3 -0.6 -0.5 -0.5 1.3 0.5 -0.6 -0.6 -0.8 -0.7 -0.7 14 13 6 11 12 12 14
Bank 7 -1.1 -1.1 -0.9 -0.9 -0.8 -0.8 -0.7 -0.8 -1.1 -0.6 -0.1 0.0 0.1 0.0 -0.4 -0.7 -0.2 0.2 0.3 0.1 -0.1 32 25 32 43 46 46 44
Bank 8 -0.6 -0.7 -0.9 -0.4 -0.3 -0.3 -0.3 .. -0.6 0.0 -0.4 -0.1 -0.1 0.0 .. -0.7 -0.1 -0.2 0.0 0.0 -0.1 .. 39 55 34 41 43 46
Bank 9 -0.5 -0.4 -0.8 -0.6 -0.3 -0.1 -0.2 -0.2 0.4 -0.6 -0.3 -0.2 -0.3 -0.2 -0.3 -0.2 -0.7 -0.3 -0.2 -0.3 -0.4 24 22 8 19 17 15 20
Bank 10 1.3 1.2 1.2 0.8 0.9 1.0 0.5 0.1 0.7 -0.7 0.0 -0.1 -0.6 -0.6 -0.4 0.0 -0.8 -0.2 -0.5 -0.7 -0.7 16 16 7 16 16 10 11
Bank 11 1.5 1.4 1.3 1.7 1.6 1.4 1.1 -1.6 -1.8 -1.5 -1.4 .. -1.6 -1.6 -1.6 -1.6 -1.2 -1.1 .. -1.1 -1.1 2 2 2 3 .. 1 0
Bank 12 2.1 2.4 3.0 2.5 3.6 3.7 3.1 1.9 2.3 4.0 2.3 2.0 2.4 -0.9 .. .. .. .. .. .. .. 11 9 11 17 18 20 0
Bank 13 0.2 0.7 2.6 1.4 3.3 2.8 2.4 -0.9 -0.3 1.3 0.6 1.2 1.7 1.2 .. .. .. .. .. .. .. 8 6 9 14 17 21 14
Bank 14 .. -0.4 0.1 -0.1 0.1 0.2 0.1 .. 0.0 2.2 2.6 2.6 3.2 2.0 .. 1.2 4.3 4.5 3.7 4.3 2.7 .. 3 27 56 48 57 19
Bank 15 0.6 -0.1 -0.7 -0.8 -0.5 -0.4 -0.3 -0.2 -0.2 -0.3 .. .. -0.7 -0.4 0.5 0.1 -0.5 .. .. -0.6 -0.5 13 12 16 .. .. 15 15
Bank 16 -0.9 -0.8 -0.6 -0.8 -0.7 -0.6 -0.6 0.5 1.0 1.2 0.5 0.6 0.6 0.7 2.9 2.4 2.2 1.2 0.9 0.8 0.6 43 47 56 56 58 53 54
Bank 17 -1.1 -0.7 -0.7 -0.7 -0.5 -0.6 -0.6 -1.0 -0.9 -0.6 -0.1 -0.1 .. -0.2 -1.0 -0.9 -0.5 -0.2 -0.2 .. -0.5 23 25 32 40 41 .. 39
Bank 18 .. .. .. -1.0 -0.9 -0.9 .. .. .. .. -0.7 -0.1 0.1 … .. .. .. -0.1 0.3 0.3 .. .. .. .. 37 60 60 ..
Bank 19 -0.5 -0.7 -0.6 -0.6 -0.5 -0.6 -0.5 -0.8 -0.9 -0.6 -0.5 -0.6 -0.7 -0.7 -1.0 -1.0 -0.6 -0.4 -0.4 -0.6 -0.5 15 15 17 29 33 33 32
Bank 20 0.9 0.6 -0.1 0.2 0.3 0.2 0.7 -0.8 -0.7 -0.6 -0.5 -0.6 .. .. -1.1 -1.1 -0.8 -0.7 -0.7 .. .. 9 8 8 11 12 .. ..
Bank 21 .. .. 0.1 -0.2 -0.2 -0.3 -0.2 .. .. 0.1 -0.2 -0.5 -0.5 -0.5 .. .. -0.2 -0.5 -0.6 -0.7 -0.7 .. .. 6 9 8 9 17
Bank 22 -1.2 -1.4 -1.2 -1.2 -1.0 -1.0 -0.9 .. -1.2 -0.8 -0.8 -0.7 -0.8 -0.3 .. -0.6 -0.2 0.4 0.4 0.3 0.8 .. 51 36 41 41 43 45
Bank 23 0.0 -0.2 -0.6 -0.5 -0.6 -0.8 -0.8 -0.2 -0.5 -0.3 -0.1 -0.3 -0.6 -0.4 -0.3 -0.5 -0.3 0.1 -0.1 -0.6 -0.5 16 13 16 24 30 24 30
Bank 24 -0.5 -0.7 -0.9 -0.9 -0.8 -0.8 -0.8 .. .. .. -0.8 -0.8 -0.9 -0.9 .. .. .. -0.6 -0.5 -0.6 -0.5 .. .. .. 21 21 22 23
Bank 25 -0.8 -0.6 -0.8 -0.4 -0.7 -0.4 -0.4 -0.7 -0.8 -0.9 -1.1 -1.0 -0.6 -1.3 -0.7 -0.8 -0.9 -1.0 -0.9 -0.7 -1.0 8 9 4 7 17 7 9
Bank 26 -0.7 -0.7 -0.8 -0.8 -0.8 -0.8 -0.8 -0.4 -0.3 -0.3 -0.1 -0.4 -0.5 -0.4 -0.5 -0.5 -0.3 -0.2 -0.4 -0.5 -0.5 41 41 31 46 43 40 42
Bank 27 -1.0 -0.6 -0.7 -0.7 -0.6 -0.5 -0.5 -0.5 -0.3 0.3 0.3 -0.1 0.0 0.0 0.2 0.7 1.2 1.0 1.0 0.8 0.8 22 11 24 31 30 28 31
Bank 28 -0.7 -0.8 -0.3 -0.8 -0.7 -0.3 -0.5 .. 0.3 2.2 1.3 1.3 1.9 1.4 .. 0.9 2.4 0.9 1.3 3.1 2.5 .. 31 33 33 37 34 27
3 and 4
2
1
Liquidity Ratio as Defined by BankScope 2/ Simplified Liquidity Coverage Ratio (LCR) 4/ Share of Government Securities 5/
Deposits + Short-term Borrowing

14
Figure 5. G-SIBs: Heatmaps of the BHI by Database
Sources: BankScope; BCBS; Bloomberg; SNL; and authors’ calculations. Note: Indicators in the top 90th percentile of soundness denoted in green, those in the bottom 10th percentile denoted in red and the rest in between shown in various shades of yellow. 1/ The bucket approach is described in BCBS (2011).
Systemic Institution
Bucket 1/ 2007 2008 2009 2010 2011 2012 2007 2008 2009 2010 2011 2012 2007 2008 2009 2010 2011 2012
Bank 1 -1.2 -4.6 2.4 3.7 3.3 2.4 -1.1 -1.5 3.0 4.3 4.4 3.7 -2.3 -3.0 0.9 3.2 3.0 2.5
Bank 2 -1.8 -2.5 -0.3 -0.2 -1.5 -1.9 1.5 2.5 2.6 1.5 1.5 1.4 -1.9 -0.4 0.9 0.7 0.5 0.5
Bank 3 1.4 -1.5 0.5 0.2 -0.1 0.2 0.8 -1.4 -0.1 0.1 -0.1 0.2 0.6 -1.1 0.6 0.0 0.0 0.6
Bank 4 4.1 2.5 3.8 3.8 3.3 3.2 2.9 2.5 3.7 3.3 2.8 2.8 3.1 2.8 3.5 4.0 3.5 3.3Bank 5 -4.9 -3.9 -0.6 -3.4 -2.6 -3.7 -2.7 -2.9 -0.2 -1.0 -1.9 -2.4 -4.0 -1.4 1.4 -2.4 -1.0 ..
Bank 6 -1.7 -1.8 -1.8 -1.1 -2.0 -0.9 -3.0 0.1 -2.8 -2.1 -2.6 0.1 .. .. -0.8 0.1 -0.4 ..
Bank 7 0.6 -1.4 1.0 0.3 0.3 0.3 -0.2 0.1 1.9 0.9 0.6 0.4 -0.5 -1.1 -0.2 0.2 0.6 0.4
Bank 8 5.0 2.9 3.4 7.2 5.9 5.0 2.1 1.4 -0.1 2.8 2.6 1.9 2.3 1.9 0.7 3.8 4.0 2.8
Bank 9 2.7 0.3 4.0 3.1 1.7 0.6 1.1 -0.3 3.3 2.9 1.1 2.1 0.8 -1.1 3.1 2.7 1.0 2.3
Bank 10 .. .. .. .. .. .. .. .. .. .. .. .. .. .. .. .. .. ..
Bank 11 .. -3.1 -0.9 -0.8 -0.6 0.2 -2.6 -3.2 -1.0 -1.3 -1.2 -1.4 .. .. -3.0 -1.1 -1.7 -1.1
Bank 12 .. .. .. .. .. .. .. .. .. .. .. .. .. .. .. .. .. ..
Bank 13 -2.4 -6.9 -2.0 -2.3 -3.5 -4.9 -3.8 -4.1 -0.9 -2.1 -3.3 -5.1 -4.0 -4.1 -0.5 -0.9 -1.7 -3.1
Bank 14 -4.1 -6.7 -2.2 2.4 2.5 0.1 -1.4 -1.9 0.5 3.0 2.4 2.8 -2.2 -3.2 1.2 3.5 2.8 3.5
Bank 15 3.7 3.8 3.0 3.5 3.5 3.6 2.6 2.7 1.8 2.2 1.7 1.8 .. .. .. .. .. ..
Bank 16 1.9 -0.2 -0.5 0.6 -0.5 -1.1 0.9 -0.7 -0.4 0.3 -1.4 -2.1 1.3 -0.4 -0.6 0.7 -0.4 -1.0
Bank 17 .. .. -3.0 -0.8 -2.1 -2.1 .. .. .. -1.2 -1.5 -1.9 .. .. .. .. .. ..
Bank 18 -1.6 -2.2 -1.0 -0.9 -2.0 -2.4 .. .. .. .. .. .. -2.8 -2.4 -1.9 -2.2 -2.9 ..
Bank 19 -4.3 -4.7 -2.8 -1.5 -2.1 -1.8 .. .. .. .. .. .. .. .. .. .. .. ..
Bank 20 .. -6.6 -3.5 -2.2 -2.7 -1.3 -4.5 -5.4 -3.0 -1.9 -2.2 -2.9 .. .. .. .. .. ..
Bank 21 -1.1 -1.5 0.1 -0.5 -1.4 -1.3 0.3 0.1 1.7 1.2 1.2 1.2 -0.6 0.0 0.8 0.6 0.4 0.3
Bank 22 -0.1 -0.3 0.1 -0.2 -1.5 -1.9 1.2 0.6 0.6 -0.3 -1.3 -2.4 0.7 0.3 0.4 0.0 -0.9 -2.0
Bank 23 -4.7 .. -2.6 -1.4 -2.2 -2.4 -4.7 -2.8 -2.1 -2.2 -3.2 -3.1 .. -1.8 -1.9 -0.8 -1.7 -1.6
Bank 24 0.8 -0.5 1.0 2.5 1.9 1.4 1.3 1.0 2.1 3.2 2.6 1.9 0.4 0.6 1.8 3.3 2.6 1.8
Bank 25 2.0 2.0 1.4 4.1 3.4 3.8 .. .. .. .. 6.1 5.6 0.9 4.7 1.5 3.5 3.3 3.4
Bank 26 .. .. -1.5 -1.7 -2.1 .. -3.8 -4.4 -1.2 -1.4 -2.3 -2.2 .. .. .. .. .. ..
Bank 27 -2.3 -2.7 -2.1 -2.2 -6.3 -3.2 -4.8 -4.9 -4.8 -4.8 -9.0 -5.6 -4.7 -4.4 -4.7 -4.4 -7.6 -4.8
Bank 28 1.3 -1.9 1.5 1.8 2.2 2.8 3.2 -0.5 1.7 2.2 2.7 3.5 2.3 -0.5 1.1 1.7 2.2 2.6
3 and 4
2
1
BloombergBankScope SNL

15
APPENDX I. USER GUIDE: OPERATING INSTRUCTIONS FOR HEAT! This Appendix details the operating instructions for separate HEAT! templates, which automate the calculation of the BHI. The templates are available for data downloads from either BankScope, Bloomberg or SNL and are posted on the IMF website in a zip file together with this Working Paper.
Template instructions for BankScope 1. The requisite software is Excel Add-ins—BankScope.
2. The list of banks may be defined as follows:
Save a copy of the HEAT! file in xls (not .xlsx) format.
Go to the Bank List spreadsheet.
Define the list of BankScope bank IDs, which can be obtained using the Wizard facility in BankScope Excel Add-ins. The Wizard facility has a search function, which allows the selection of banks based on various criteria.
Go to the Soundness spreadsheet and update the Included? column with a “Y” against each bank that should be included in the sample. This feature enables the user to change the banks in a sample.
Go to Formulas on the menu bar and select Calculate Now to update related links in the workbook, if necessary.
3. The tool template may be uploaded as follows:
Open the BankScope Excel Add-ins program.
Go to Add-ins on the menu bar and look for BankScope Add-ins.
Import the HEAT! file. The file will take several minutes to read and update for the changes to the list of banks.
4. The heatmap may be generated as follows:
Ensure that the individual banks appear in the underlying purple-, green- and orange-tabbed spreadsheets:
The purple spreadsheets have the function of downloading data from BankScope.
The green spreadsheets have the function of organizing the data and calculating the values of means and standard deviations used for normalizing the ratios.

16
The orange spreadsheets have the function of computing the normalized ratios (or z-scores).
The blue spreadsheets generate the heatmaps.
5. The file will update only after it is re-imported. Every time changes are made to the workbook, save and close the Excel Add-in application; then re-open the Excel Add-in and re-import the file to update the calculations for the changes.
Template instructions for Bloomberg The BHI and its components can only be calculated for listed banks if the Bloomberg database is used. 1. The requisite software is Excel with linked access to a Bloomberg terminal.
2. The list of banks may be defined as follows:
Save a copy of the HEAT! file in xlsx format.
Go to the Bank List spreadsheet.
Define the list of Bloomberg bank tickers, which can be obtained by entering the bank name and using the [Help] function.
Go to the Soundness spreadsheet and update the Included? column with a “Y” against each bank that should be included in the sample. This feature enables the user to change the banks in a sample.
Go to Formulas on the menu bar and select Calculate Now to update related links in the workbook, if necessary.
3. The tool template may be uploaded as follows:
Open the Excel program with linked access to a Bloomberg terminal.
Open the HEAT! file. The file will update automatically.
4. The heatmap may be generated as follows:
Ensure that the individual banks appear in the underlying purple-, green- and orange-tabbed spreadsheets:
The purple spreadsheets have the function of downloading data from Bloomberg.

17
The green spreadsheets have the function of organizing the data and calculating the values of means and standard deviations used for normalizing the ratios.
The orange spreadsheets have the function of computing the normalized ratios (or z-scores).
The blue spreadsheets generate the heatmaps.
Template instructions for SNL 1. The requisite software is Excel Add-ins—SNLxl.
2. The list of banks may be defined as follows:
Save a copy of the HEAT! file in xlsx format.
Go to the Bank List spreadsheet.
Define the list of SNL institution keys, which can be obtained using the Data Wizard facility in SNL Excel Add-ins. The Data Wizard facility has a search function, which allows the selection of banks based on various criteria.
Go to the Soundness spreadsheet and update the Included? column with a “Y” against each bank that should be included in the sample. This feature enables the user to change the banks in a sample.
Go to Formulas on the menu bar and select Calculate Now to update related links in the workbook, if necessary.
3. The tool template may be uploaded as follows:
Open the SNL Excel Add-ins program.
Open the HEAT! file. The file can be updated using the Refresh Data function.
Ensure that all purple-tabbed spreadsheets do not have empty cells that are supposed to contain SNL institution keys—SNL treats empty cells as “0” and would not be able to obtain any data.
4. The heatmap may be generated as follows:
Ensure that the individual banks appear in the underlying purple-, green- and orange-tabbed spreadsheets:
The purple spreadsheets have the function of downloading data from SNL.

18
The green spreadsheets have the function of organizing the data and calculating the values of means and standard deviations used for normalizing the ratios.
The orange spreadsheets have the function of computing the normalized ratios (or
z-scores).
The blue spreadsheets generate the heatmaps.

19
REFERENCES Basel Committee on Banking Supervision, 2011, “Global Systemically Important Banks:
Assessment Methodology and the Additional Loss Absorbency Requirement,” BCBS Publication No. 207, November, (Basel: Bank for International Settlements), available at http://www.bis.org/publ/bcbs207.htm.
_____, 2013, “Basel III: The Liquidity Coverage Ratio and Liquidity Risk Monitoring Tools,” BCBS Publication No. 238, January, (Basel: Bank for International Settlements), available at http://www.bis.org/publ/bcbs238.htm.
Financial Stability Board, 2012, “Update of Group of Global Systemically Important Banks (G-SIBs),” (Basel, November), available at http://www.financialstabilityboard.org/publications/r_121031ac.pdf.
International Monetary Fund, 2012, “Spain: Financial System Stability Assessment,” IMF Country Report No. 12/137 (Washington, June), available at http://www.imf.org/external/pubs/ft/scr/2012/cr12137.pdf.
Oliver Wyman, 2012, “Asset Quality Review and Bottom-up Stress Test Exercise,” Bank of Spain Stress Testing Exercise (Madrid, September), available at http://www.bde.es/bde/en/secciones/prensa/infointeres/reestructuracion/.
The World Bank/International Monetary Fund, 2005, Financial Sector Assessment: A Handbook (Washington: The World Bank), available at http://www.imf.org/external/pubs/ft/fsa/eng/.