heart and heart diseases - pmt
TRANSCRIPT

1. (a) During the cardiac cycle the heart fills with blood and then the ventricles contract. The table gives the filling time and the contraction time at different heart rates.
Heart rate/beats per minute
Filling time/seconds Contraction time/seconds
39.7 0.37 1.14
49.6 0.38 0.83
71.4 0.38 0.46
81.1 0.38 0.36
87.0 0.39 0.30
(i) Give two conclusions that can be drawn from the figures in the table.
1 ........................................................................................................................
...........................................................................................................................
2 ........................................................................................................................
........................................................................................................................... (2)
(ii) Explain how you would use the figures in the table to calculate the contraction time at a heart rate of 60 beats per minute.
...........................................................................................................................
...........................................................................................................................
...........................................................................................................................
........................................................................................................................... (2)
(iii) What additional information would you need in order to find the cardiac output at a particular heart rate?
........................................................................................................................... (1)
PMT

(b) The diagram shows variations in blood pressure in different parts of the circulatory system.
Left ventricle Aorta VeinA B
Time Time Time
Pressure
(i) Complete the table with ticks to show whether each of the valves is open or closed at the point indicated with the letter A on the diagram.
Valve located between Open Closed
left atrium and left ventricle
left ventricle and aorta
right atrium and right ventricle
right ventricle and pulmonary artery (2)
(ii) A pulse can be felt when the fingers are placed over an artery that is close to the surface. Explain why a pulse cannot be felt when the fingers are placed over a vein which is close to the surface.
...........................................................................................................................
........................................................................................................................... (1)
PMT

(iii) What causes the blood pressure to increase at the point indicated with a letter B on the diagram?
...........................................................................................................................
........................................................................................................................... (1)
(Total 9 marks)
2. The diagram shows a section through a human heart.
A
B
C
D
(a) Which of the blood vessels labelled A to D
(i) takes blood from the heart to the muscles of the arms and legs;
........................................................................................................................... (1)
(ii) is a vein which contains oxygenated blood?
........................................................................................................................... (1)
PMT

(b) Is the right ventricle filling with blood or emptying? Give two pieces of evidence from the diagram to support your answer.
Filling or emptying? ..................................................................................................
Evidence
1 ..................................................................................................................................
.....................................................................................................................................
2 ..................................................................................................................................
..................................................................................................................................... (2)
The graphs show some changes in pressure and volume during part of a cardiac cycle.
Pressure
Volumeofventricle
Aorta
Ventricle
X Y ZTime
PMT

(c) Describe what the graphs show about the pressure and volume in the ventricle between times X and Y.
.....................................................................................................................................
..................................................................................................................................... (1)
(d) At point Y, the valve between the aorta and the ventricle opens. Use the information about pressure on the graph to explain why.
.....................................................................................................................................
..................................................................................................................................... (1)
(e) Explain the changes in the volume of the ventricle between times X and Z.
.....................................................................................................................................
.....................................................................................................................................
.....................................................................................................................................
.....................................................................................................................................
.....................................................................................................................................
..................................................................................................................................... (3)
(Total 9 marks)
PMT

3. The diagram shows the heart and the tissues which control the heart beat. The figures on the diagram show the time in seconds taken for a wave of electrical activity to spread from the sinoatrial node.
A0.01 seconds
B0.04 seconds
C0.16 seconds
D0.17 seconds
(a) (i) The diagram shows that the valve between the right atrium and the right ventricle is closed. What does this indicate about the relative pressures in the right atrium and the right ventricle?
.....................................................................................................................................
.....................................................................................................................................
..................................................................................................................................... (1)
(ii) Complete the diagram to show whether the valve between the left atrium and the left ventricle is open or closed.
(1)
PMT

(b) The rate at which the electrical activity passes from B to C is important in controlling the heart beat. Explain why.
.....................................................................................................................................
.....................................................................................................................................
.....................................................................................................................................
..................................................................................................................................... (2)
(c) The heart rate of a sleeping person is low. Explain how nerves supplying the heart may produce a low heart rate in a sleeping person.
.....................................................................................................................................
.....................................................................................................................................
.....................................................................................................................................
.....................................................................................................................................
.....................................................................................................................................
..................................................................................................................................... (3)
(Total 7 marks)
4. (a) Explain why both the heart and arteries are described as organs.
.....................................................................................................................................
..................................................................................................................................... (1)
PMT

The table shows changes in the volume of blood in the left ventricle over a period of one second.
Time / s Volume of blood as percentage of maximum
0 70
0.1 100
0.2 70
0.3 30
0.4 0
0.5 35
0.6 60
0.7 70
0.8 70
0.9 100
1.0 70
Use information in the table to answer the following questions.
(b) What is the approximate length of one cardiac cycle?
..................................................................................................................................... (1)
(c) At what time is there least blood in the right ventricle? Explain your answer.
.....................................................................................................................................
..................................................................................................................................... (1)
PMT

(d) (i) Between which times are the muscles in the wall of the left atrium contracting? Give the reason for your answer.
Times ..........................................................................................................................
Reason ........................................................................................................................
..................................................................................................................................... (1)
(ii) Between which times are the semilunar valves in the arteries open? Give the reason for your answer.
Times ..........................................................................................................................
Reason ........................................................................................................................ (1)
(e) The maximum volume of blood in the left ventricle is 45 cm3. Calculate the volume of blood in the left ventricle at 0.5 s. Show your working.
Volume of blood = ................................................. cm3 (2)
(Total 7 marks)
PMT

5. The graph shows changes in the volume of blood in the left ventricle.
140
120
100
80
60
40
20
00 0.2 0.4 0.6 0.8 1.0
Time / s
Volume /cm3
(a) Between which times is the left atrium contracting? Give the evidence from the graph that supports your answer.
Times ..........................................................................................................................
Evidence …….............................................................................................................
............………............................................................................................................. (2)
(b) Use the graph to calculate.
(i) the heart rate;
Answer ............................................ (2)
PMT

(ii) stroke volume.
Answer ............................................ (1)
(c) Describe how you would calculate cardiac output from heart rate and stroke volume.
............………..............................................................................................................
............……….............................................................................................................. (1)
The table shows the rate of blood flow to some organs when a person is at rest and during a period of vigorous exercise.
Organ Rate of blood flow / cm3 minute–1
at rest during exercise
Skeletal muscles 1 000 16 000
Kidney 1 200 1 200
Brain 750
Heart muscle 300 1 200
(d) Suggest a value for the rate of blood flow to the brain during exercise.
............……….............................................................................................................. (1)
(e) (i) The coronary arteries take blood to the muscles in the wall of the heart. Calculate the ratio of the rate of blood flow into the coronary arteries during exercise to the rate flowing into these arteries at rest.
Answer............................................. (1)
PMT

(ii) At rest the rate of flow of blood to the heart muscle is 0.9 cm3 g–1 per minute. Calculate the volume of blood 1g of heart muscle would receive in 5 minutes of vigorous exercise.
Answer............................................. (1)
(Total 9 marks)
6. (a) (i) Explain the meaning of the term atheroma.
...........................................................................................................................
........................................................................................................................... (1)
(ii) Explain why atheroma may lead to a blood clot.
...........................................................................................................................
...........................................................................................................................
...........................................................................................................................
........................................................................................................................... (2)
PMT

(b) The diagram shows an external view of the heart. The position of a blood clot is marked.
(i) On the diagram, shade the area of the heart muscle which is likely to die as a result of the blood clot.
(1)
(ii) Explain why this area of the heart muscle is likely to die.
...........................................................................................................................
........................................................................................................................... (1)
(c) High blood pressure is a risk factor associated with damage to the circulatory system. Suggest two ways in which prolonged high blood pressure may affect the arteries.
1 ............……….......................................................................................................…
............………..............................................................................................................
2 ............……….....................................…..................................................................
............……….............................................................................................................. (2)
(Total 7 marks)
PMT

7. This diagram shows a human heart seen from the front.
B C
A D
X
Y
(a) (i) Which one or more of vessels A to D contains oxygenated blood?
........................................................................................................................... (1)
(ii) During a cardiac cycle, the pressure of the blood in vessel C is higher than the pressure of the blood in vessel B. Explain what causes this difference in pressure.
...........................................................................................................................
........................................................................................................................... (1)
(b) What does the diagram suggest about the pressure in the atria compared to the pressure in the ventricles at the stage in the cardiac cycle represented in the diagram? Explain your answer.
.....................................................................................................................................
.....................................................................................................................................
.....................................................................................................................................
..................................................................................................................................... (2)
PMT

(c) The wave of electrical activity which coordinates the heart beat is delayed slightly at part X. It then passes along part Y to the base of the ventricles.
Explain the importance of
(i) the slight delay at part X;
...........................................................................................................................
...........................................................................................................................
...........................................................................................................................
........................................................................................................................... (2)
(ii) the electrical activity being passed to the base of the ventricles.
...........................................................................................................................
...........................................................................................................................
...........................................................................................................................
........................................................................................................................... (2)
(Total 8 marks)
8. The diagram shows a section through a human heart.
A
Y
B
CD
X
PMT

(a) Complete the table to show whether the valves are open or closed when the pressure in chamber C is at its highest.
Location of valve Valve open or closed
between chamber C and chamber B
between chamber D and chamber A
between chamber C and blood vessel Y
(2)
(b) Explain the advantage of having:
(i) a large amount of elastic tissue in blood vessel Y;
...........................................................................................................................
...........................................................................................................................
...........................................................................................................................
........................................................................................................................... (2)
(ii) valves in blood vessels such as blood vessel X.
...........................................................................................................................
........................................................................................................................... (1)
(Total 5 marks)
PMT

9. The diagram shows a human heart
(a) On the diagram, label the position of the atrioventricular node. (1)
PMT

An electro-cardiogram (ECG) is produced by placing electrodes on the chest to detect electrical changes in the heart. The diagram shows an ECG and the pressure changes during a human cardiac cycle.
Bloodpressure
0 0.1 0.2 0.3 0.4 0.5 0.6 0.7 0.8Time/seconds
Pressurein aorta
Pressure inleft ventricle
PPECG
R
Q S
T
(b) (i) The QRS wave is associated with the spread of electrical activity over the ventricle. Explain the evidence in the graph which supports this.
...........................................................................................................................
...........................................................................................................................
...........................................................................................................................
........................................................................................................................... (2)
(ii) Explain why there is no change in the electrical activity between 0.31s and 0.77s.
...........................................................................................................................
........................................................................................................................... (1)
PMT

(c) (i) At what time in the cardiac cycle does the aortic semilunar valve open?
........................................................................................................................... (1)
(ii) The pressure changes shown in the diagram are on the left side of the heart. Sketch a curve on the graph to show the pressure changes in the right ventricle.
(2) (Total 7 marks)
10. (a) The graph shows the changes in pressure which take place in the left side of the heart.
15
10
5
0
Pressure/kPa
0.2 0.4 0.6 0.8 1.0Time/seconds
Leftatrium
Aorta
Left ventricle
(i) Use the graph to calculate the heart rate in beats per minute. Show your working.
Answer .............................. (2)
(ii) The atrioventricular valve closes at 0.1 seconds. Explain the evidence from the graph which supports this statement.
..........................................................................................................................
.......................................................................................................................... (1)
PMT

(b) The blood pressure in the aorta is higher than in the pulmonary artery. Explain what causes the blood pressure in the aorta to be higher.
.....................................................................................................................................
..................................................................................................................................... (1)
(Total 4 marks)
11. The diagram shows the pathways in the heart for the conduction of electrical impulses during
the cardiac cycle.
(a) The table shows the blood pressure in the left atrium, the left ventricle and the aorta at different times during part of a cardiac cycle.
Blood pressure / kPa
Time / s Left atrium Left ventricle Aorta
0.0 0.5 0.4 10.6
0.1 1.2 0.7 10.6
0.2 0.3 6.7 10.6
0.3 0.4 17.3 16.0
0.4 0.8 8.0 12.0
(i) At which time is blood flowing into the aorta?
......................................................................................................................…. (1)
PMT
(ii) Between which times are the atrioventricular valves closed?
......................................................................................................................…. (1)
(b) The maximum pressure in the left ventricle is higher than the maximum pressure in the right ventricle. What causes this difference in pressure?
.....................................................................................................................................
..................................................................................................................................... (1)
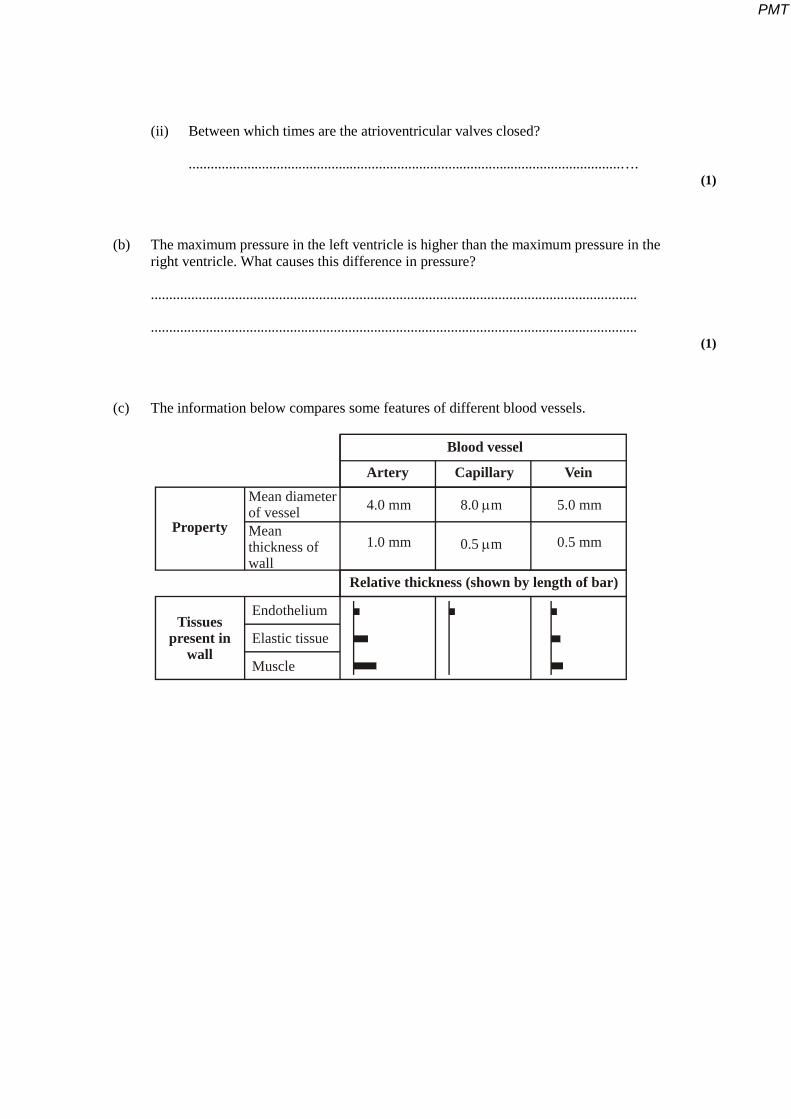
(c) The information below compares some features of different blood vessels.
Property
Tissuespresent in
wall
Mean diameterof vesselMeanthickness ofwall
Artery
4.0 mm
1.0 mm
5.0 mm
0.5 mm
8.0 m
0.5 m
µ
µ
Capillary Vein
Blood vessel
Relative thickness (shown by length of bar)
Endothelium
Elastic tissue
Muscle
PMT

Use the information to explain how the structures of the walls of arteries, veins and capillaries are related to their functions.
.....................................................................................................................................
.....................................................................................................................................
.....................................................................................................................................
.....................................................................................................................................
.....................................................................................................................................
.....................................................................................................................................
.....................................................................................................................................
.....................................................................................................................................
.....................................................................................................................................
.....................................................................................................................................
.....................................................................................................................................
..................................................................................................................................... (6)
(Total 9 marks)
PMT