healthy chicago lawn community assessments – part 1 september 21, 2004
TRANSCRIPT

Healthy Chicago Lawn
Community Assessments – Part 1
September 21, 2004

Healthy Chicago LawnCommunity Assessments – Part 1
1. Community Health Status
• Statistics
2. Health Behaviors
• BRFSS survey
3. Forces and Trends
Healthy Chicago LawnCommunity Assessments – Part 2
1. Community Perceptions
• Focus groups
• Key Informant Interviews
2. CLAM
3. Resource Inventory
At the next meeting we will present:

Indicators
1. Demographics
2. Health Care
3. Disease related
4. Maternal and Child Health
5. Education
6. Crime
7. Behaviors (in BRFSS presentation by Bill Baldyga)

1. Demographics
• Age• Race/ethnicity• Employment• Household information• Educational attainment• Income• Housing• Languages
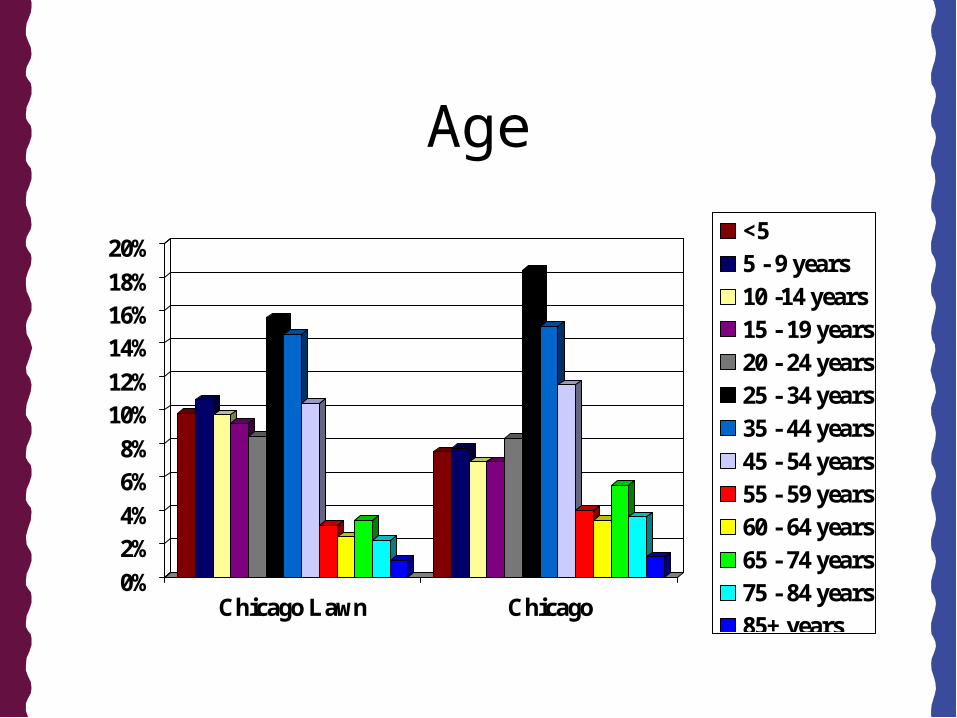
Age
0%
2%4%
6%8%
10%12%
14%16%18%
20%
Chicago Lawn Chicago
<55 - 9 years10 -14 years15 - 19 years20 - 24 years25 - 34 years35 - 44 years45 - 54 years55 - 59 years60 - 64 years65 - 74 years75 - 84 years85+ years

Age: less than 18 years
0%
5%
10%
15%
20%
25%
30%
35%
40%
less than 18 years
Chicago LawnWest LawnWest ElsdonGage ParkWest EnglewoodAshburn

Race/EthnicityTrends: 1990 - 2000
43.4%
26.2%28.4%23.6%
52.5%
35.10%
0%
10%
20%
30%
40%
50%
60%
1990 2000
Non-Hispanic White
African American
Hispanic

Foreign born population
• 21% born outside of United States– 37% entered U.S. between 1990 and 2000– 8.8% from Europe– 6.8% from Asia– 2% from Africa– 82.3% from Latin America

Family Composition
Household Information Chicago Lawn Chicago
Female householder, no husband present
29.8% 18.9%
Female householder, no husband present, with children < 18
38.3% 28.9%
Grandparents living in household 1 or more grandchildren < 18 years and responsible for grandchildren
38% 40.8%

Employment: Unemployment rate
15.7%
7.30%7.1%
10.6%
24.50%
8.80%10.10%
0%
5%
10%
15%
20%
25%
Unemployment rate
Chicago LawnWest LawnWest ElsdonGage ParkWest EnglewoodAshburnChicago

Employment:Occupations
0%
5%
10%
15%
20%
25%
30%
35%
Chicago Lawn Chicago
Management,professional and related
Service
Sales and office
Farming, fishing andforestry
Construction, extractionand maintenance
Production,transportation, andmaterial moving

Educational Attainment
0%
5%
10%
15%
20%
25%
30%
Chicago Lawn Chicago
< 9th grade
9th - 12th
High school grad orGEDSome college
Associate's
Bachelor's
Graduate orprofessional
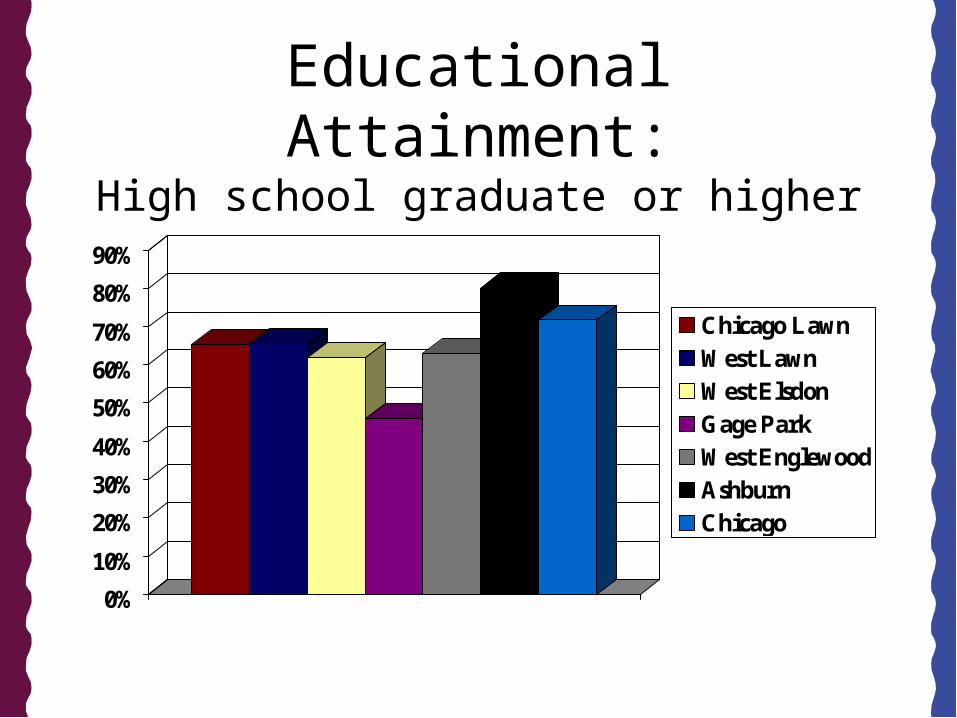
Educational Attainment:High school graduate or higher
0%
10%
20%
30%
40%
50%
60%
70%
80%
90%
Chicago LawnWest LawnWest ElsdonGage ParkWest EnglewoodAshburnChicago

Educational Attainment:Bachelor’s degree or higher
9.4%11.4%
9.1%
5.8% 4.8%
19%
25.5%
0%
5%
10%
15%
20%
25%
30%
Chicago LawnWest LawnWest ElsdonGage ParkWest EnglewoodAshburnChicago
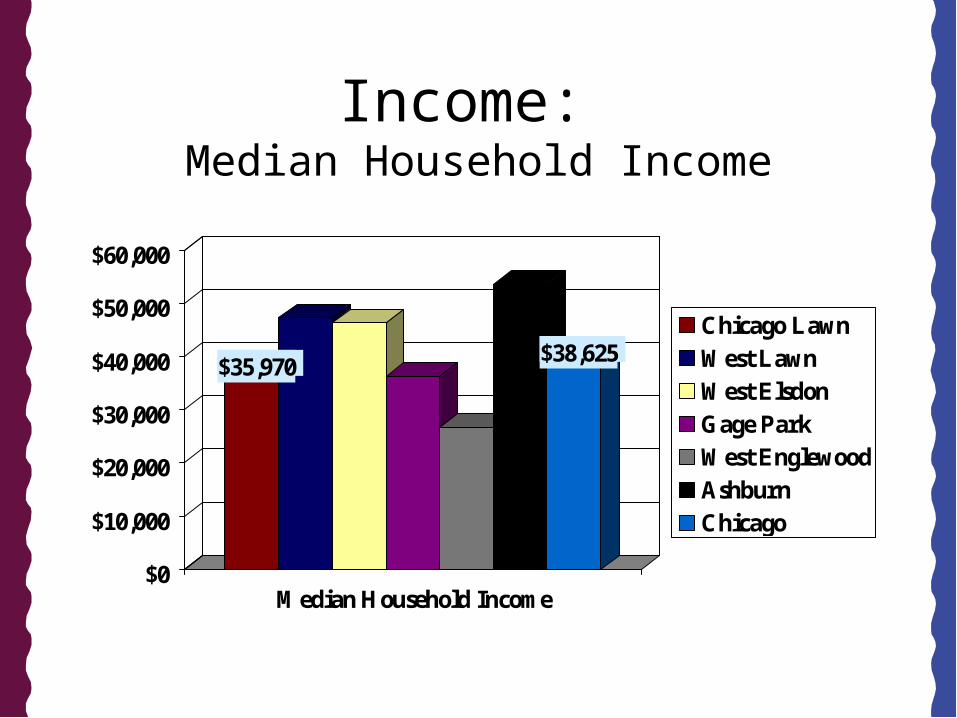
Income: Median Household Income
$35,970$38,625
$0
$10,000
$20,000
$30,000
$40,000
$50,000
$60,000
Median Household Income
Chicago LawnWest LawnWest ElsdonGage ParkWest EnglewoodAshburnChicago
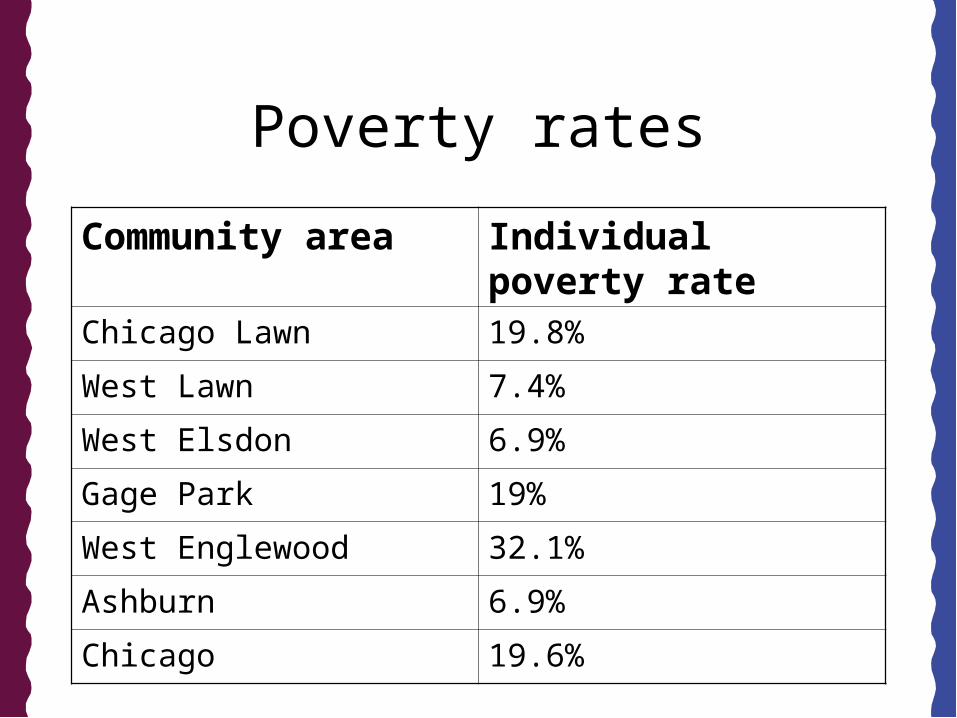
Poverty rates
Community area Individual poverty rateChicago Lawn 19.8%
West Lawn 7.4%
West Elsdon 6.9%
Gage Park 19%
West Englewood 32.1%
Ashburn 6.9%
Chicago 19.6%
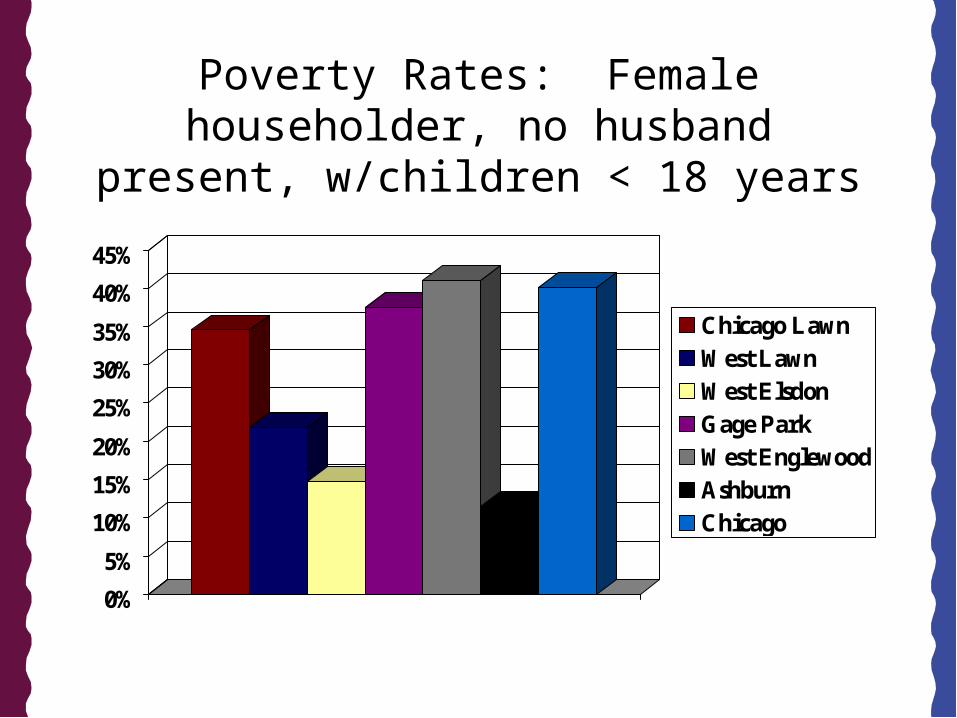
Poverty Rates: Female householder, no husband present, w/children < 18 years
0%
5%
10%
15%
20%
25%
30%
35%
40%
45%
Chicago LawnWest LawnWest ElsdonGage ParkWest EnglewoodAshburnChicago

Housing: Vacancy rates
Community Area Vacancy Rate
Chicago Lawn 7.7%
West Lawn 3.3%
West Elsdon 3.9%
Gage Park 5%
West Englewood 12%
Ashburn 2.5%
Chicago 7.9%
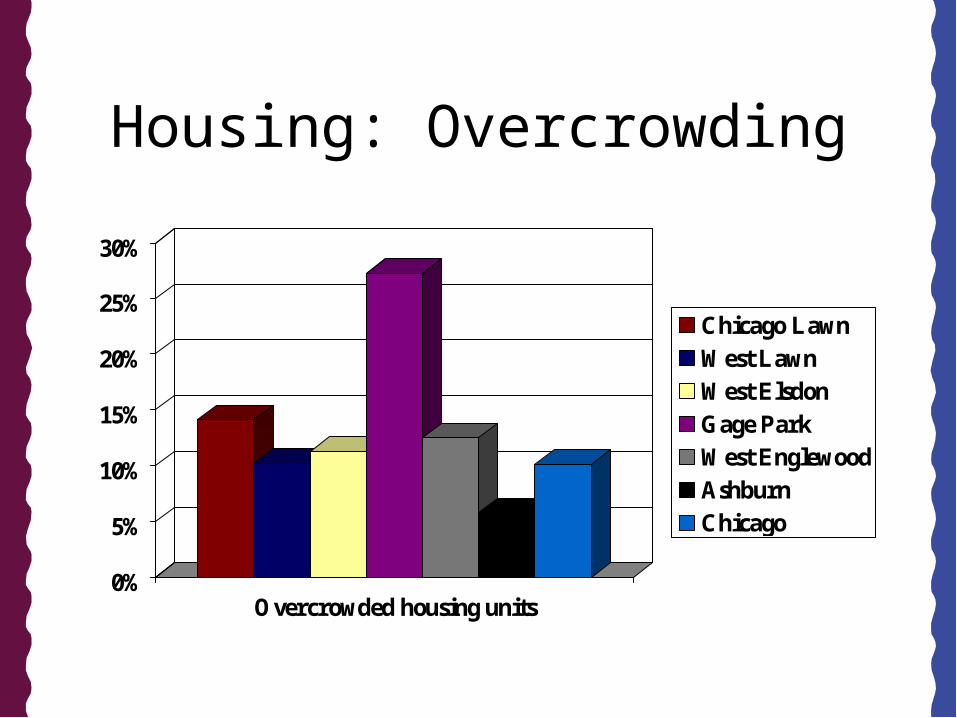
Housing: Overcrowding
0%
5%
10%
15%
20%
25%
30%
Overcrowded housing units
Chicago LawnWest LawnWest ElsdonGage ParkWest EnglewoodAshburnChicago

Housing:Home Ownership
0%
10%20%
30%40%
50%60%
70%80%
90%100%
Home Ownership
Chicago LawnWest LawnWest ElsdonGage ParkWest EnglewoodAshburnChicago
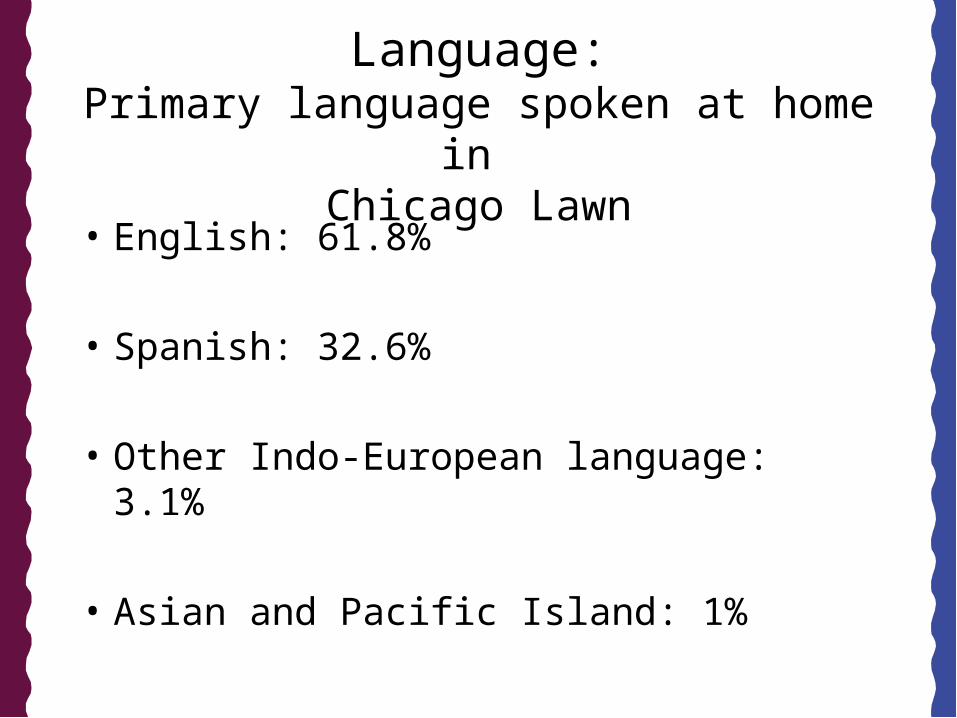
Language:Primary language spoken at home in
Chicago Lawn• English: 61.8%
• Spanish: 32.6%
• Other Indo-European language: 3.1%
• Asian and Pacific Island: 1%

Language:English proficiency
• Of those speaking Spanish, 54% report speaking English less than very well
• Of those speaking another Indo-European language, 47% report speaking English less than very well
• Of those speaking an Asian or Pacific Islander language, 38% report speaking English less than very well
2. Health Care
• Childcare
• Payer Mix for Hospital Discharges
• Physician Supply and Demand

Childcare
Type of CareNumber of Providers Capacity
Total Center Care 16 1,430Child Care Center 8 494Before/After School Only 1 300Head Start/Early Head Start Only 1 51ISBE Pre-K Only 1 68Park/Recreation Only 3 425School Age Program 2 92
Family Child Care 95 715Known License-Exempt Family Child Care (paid by child care assistance program) 698
Total 809 3,575
Demand for Childcare 9,072
Act for Children estimates demand for childcare in Chicago Lawn is 9,072 slots (about 5,500 less than exists). This is a rough estimate based on 2000 census data showing 16,218 children ages 0 to 12, estimating that 9,072 live in families where all parents present in the household work. Not all working parents seek child care outside of the family, and families with a non-working parent may also seek care.

Payer Mix for 2001 (calendar year) Discharges Originating from 60629
Zip CodeDischarges Percent of Total
FEE-FOR-SERVICE 4707 31%
HMO 1047 7%
MEDICAID 4643 31%
MEDICARE 3224 22%
MEDICARE RISK 1 <1%
OTHER 440 3%
SELF-PAY 908 6%
TOTAL 14970 100%

2003 Physician Supply and Demand Primary Care
General and Family Practice: Internal Medicine:
Supply Demand Supply Demand60629 14 25 60629 23 1360636 2 11 60636 2 660652 3 9 60652 4 5
Obstetrics and Gynecology:
Supply Demand Supply Demand60629 4 10 60629 6 1760636 0 4 60636 3 760652 0 4 60652 4 5
Pediatrics:
Primary care (the above 4 specialties) for all 3 zip codes:
Total Supply = 65, Total demand= 116
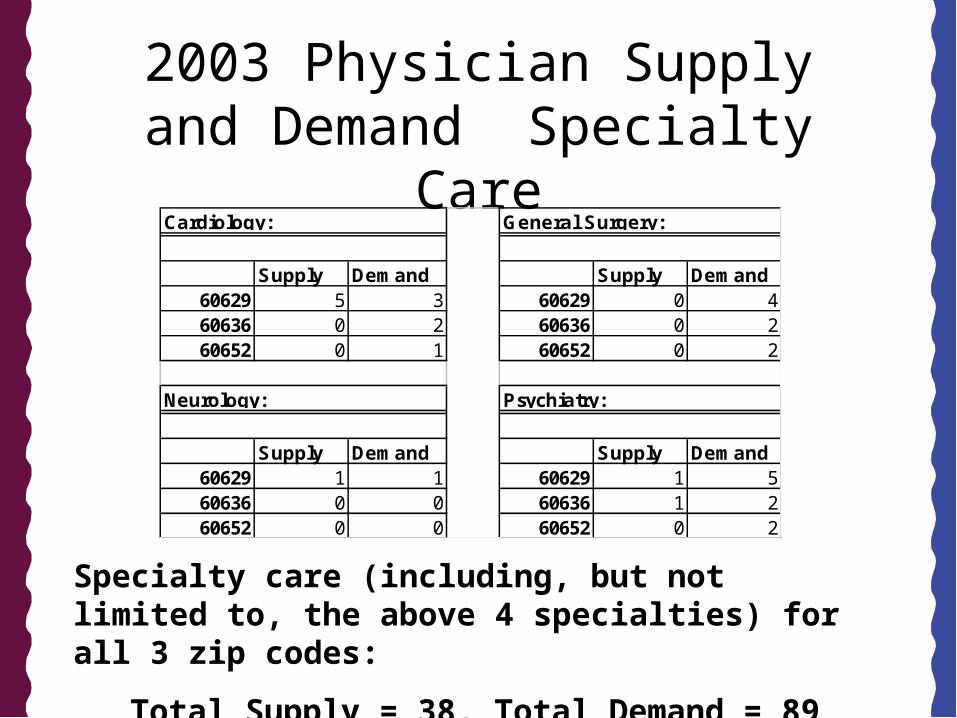
2003 Physician Supply and Demand Specialty Care
Supply Demand Supply Demand60629 5 3 60629 0 460636 0 2 60636 0 260652 0 1 60652 0 2
Supply Demand Supply Demand60629 1 1 60629 1 560636 0 0 60636 1 260652 0 0 60652 0 2
Neurology:
General Surgery:Cardiology:
Psychiatry:
Specialty care (including, but not limited to, the above 4 specialties) for all 3 zip codes:
Total Supply = 38, Total Demand = 89

3. Disease related
• Mortality rates
• Asthma, diabetes, and cardiovascular disease prevalence
• Mental illness rates
• Sexually transmitted infection rates

Mortality Rates, 2001per 100,000
30.9 22.1
0
100
200
300
400
500
600
Chicago Lawn Chicago
Heart disease
Cancer
Stroke
Unintentional injuries
Diabetes
Chronic lower respiratory disease
Septicemia
Homicide
Influenza and Pneumonia
Nephritis
HIV

Mortality rates: Homicide by community area
30.9
55.2
22.1
0
10
20
30
40
50
60
Homicide rate
Chicago LawnWest LawnWest ElsdonGage ParkWest EnglewoodAshburnChicago

Asthma ACSC hospitalizationsper 10,000
Hospitalizations Chicago Lawn
Chicago
Adult asthma hospitalizations
13/10,000 19.6/10,000
Pediatric asthma hospitalizations
9.9/10,000 9.1/10,000
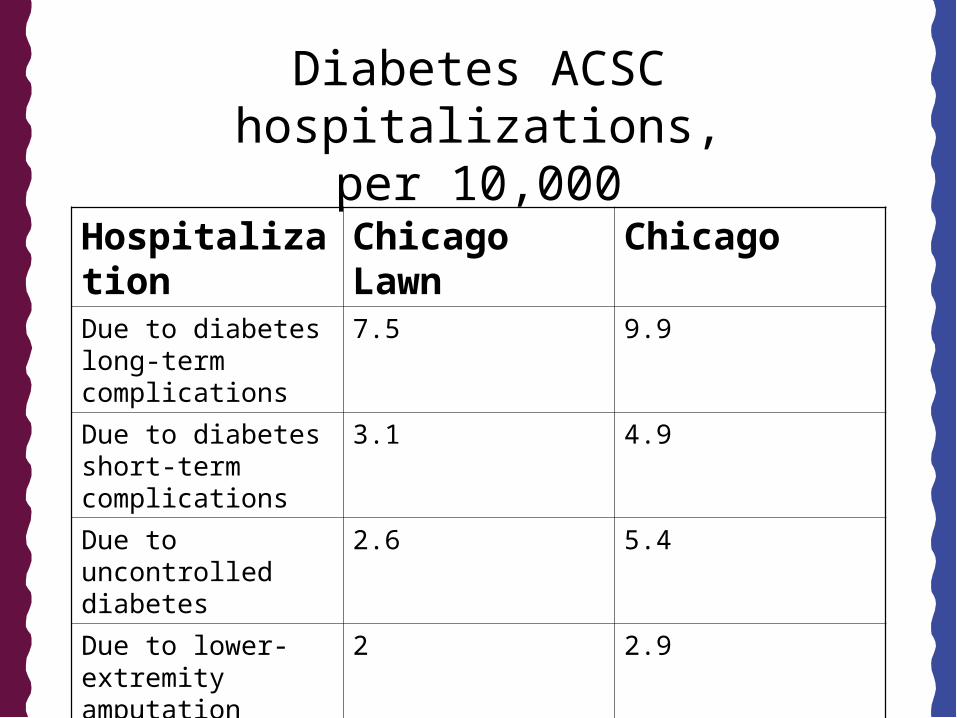
Diabetes ACSC hospitalizations,per 10,000
Hospitalization Chicago Lawn Chicago
Due to diabetes long-term complications
7.5 9.9
Due to diabetes short-term complications
3.1 4.9
Due to uncontrolled diabetes
2.6 5.4
Due to lower-extremity amputation among diabetics
2 2.9

Cardiovascular disease ACSC hospitalizationsper 10,000
Hospitalization Chicago Lawn Chicago
Due to heart disease 120 146
Due to chest pain 29.3 39.7
Due to stroke 26.7 34.8
Due to congestive heart failure
34 51.3
Due to angina without procedure
2.9 4.9
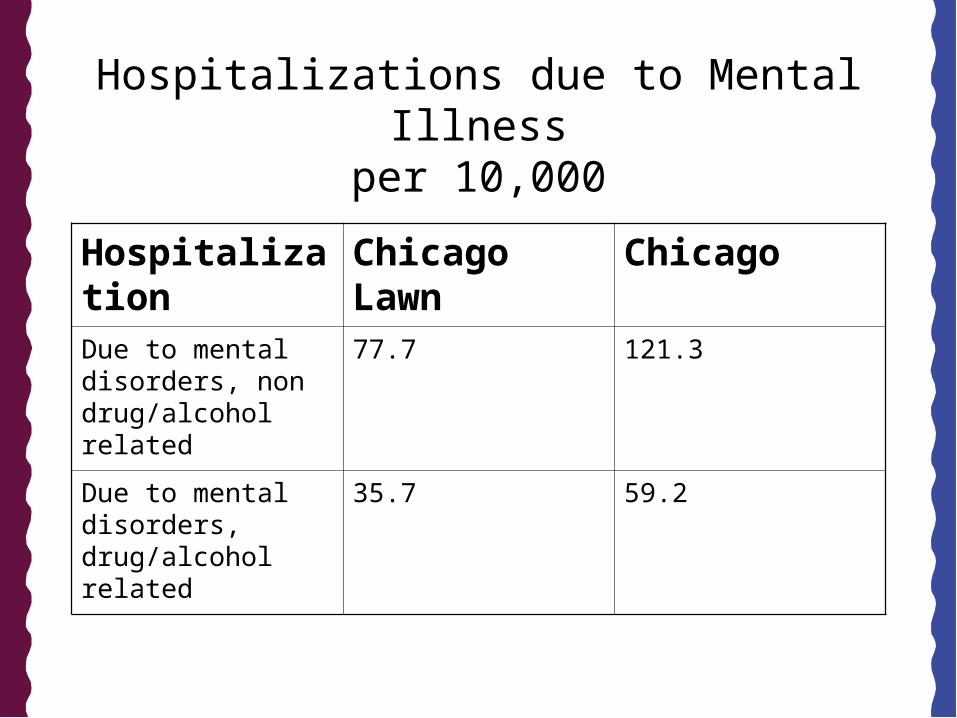
Hospitalizations due to Mental Illnessper 10,000
Hospitalization Chicago Lawn Chicago
Due to mental disorders, non drug/alcohol related
77.7 121.3
Due to mental disorders, drug/alcohol related
35.7 59.2
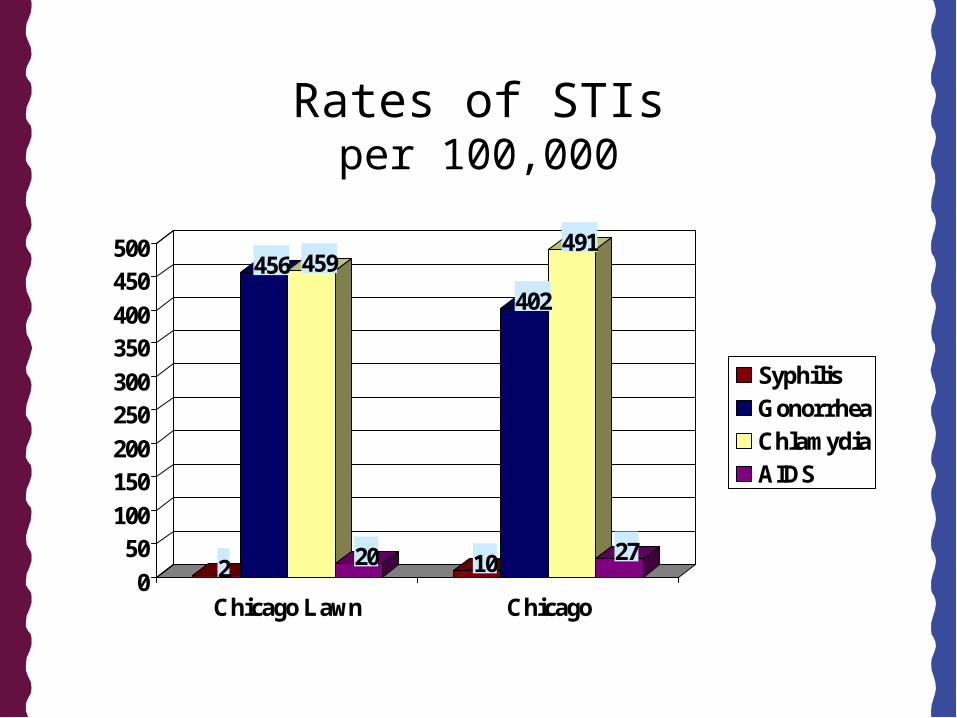
Rates of STIsper 100,000
2
456 459
20 10
402
491
270
50100
150200
250300
350400
450500
Chicago Lawn Chicago
SyphilisGonorrheaChlamydiaAIDS

4. Maternal and Child Health
• Births
• Infant Mortality
• Low birthweight
• No prenatal care
• Teen births
• Maternal smoking
• Elevated blood lead levels

Maternal and Child Health:Birth rate, per 1,000
85.6 85.1 88.7
72.5
0
10
20
30
40
50
60
70
80
90
1989 2000
Chicago LawnChicago

Maternal and Child Health:Infant Mortality rate, per 1,000
11.6
17
11.2
17
0
2
4
6
8
10
12
14
16
18
1989 2000
Chicago LawnChicago

Maternal and Child Health:Low birthweight
7.7%
10.8% 11.2%
9.7%
0%
2%
4%
6%
8%
10%
12%
1989 2000
Chicago LawnChicago

Maternal and Child Health:No prenatal care
5.2%
3.6%
2.2%2.8%
0%
1%
2%
3%
4%
5%
6%
1989 2000
Chicago LawnChicago

Maternal and Child Health:Teen births
17.6%19.6% 20.5%
16.0%
0%
5%
10%
15%
20%
25%
1989 2000
Chicago LawnChicago

Maternal and Child Health:Maternal Smoking
14.9%15.6%
7.9% 7.8%
0%
2%
4%
6%
8%
10%
12%
14%
16%
1989 2000
Chicago LawnChicago

Maternal and Child Health:Elevated lead levels in children 6 and under
0%
5%
10%
15%
20%
25%
2002 elevated blood lead levels
Chicago LawnWest LawnWest ElsdonGage ParkWest EnglewoodAshburnChicago

5. Education
• Elementary and Middle Schools
• High Schools

Elementary and Middle Schools
% ISAT
21.346.9
21.836 27.7 29.3
41.863.9
020406080
% % ISAT
•Accountability Rating: Anderson and Fairfield designated as Probation, McKay and Morrill as Challenge, Eberhart as Merit and Marquette as Opportunity
•None meet the Adequate Yearly Progress Rating
•All area elementary schools are overcrowded

Elementary and Middle Schools
Limited English Proficiency
0
35.1
16.821.6
1.7
22.9
14.5
6.3
05
10152025303540
ANDERSON
EBER
HART
FAIR
FIELD
MARQUETTE
MCKAY
MORRILL
City o
f Chic
ago
Illinois
%LimitedEnglishProficiency
Attendance
8596 91.2 93.7 93.4 93.5 92.2 94
16.11.2 2 2.4
120.6 3.2 1.9
38.320.6
31.4 27.7 30.2 29.1 24.5 16.4
0
20
40
60
80
100
120
ANDERSON
EBER
HART
FAIR
FIELD
MARQUETTE
MCKAY
MORRILL
City o
f Chic
ago
Illinois
%
DailyAttendanceRate
ChronicTruancy
MobilityRate
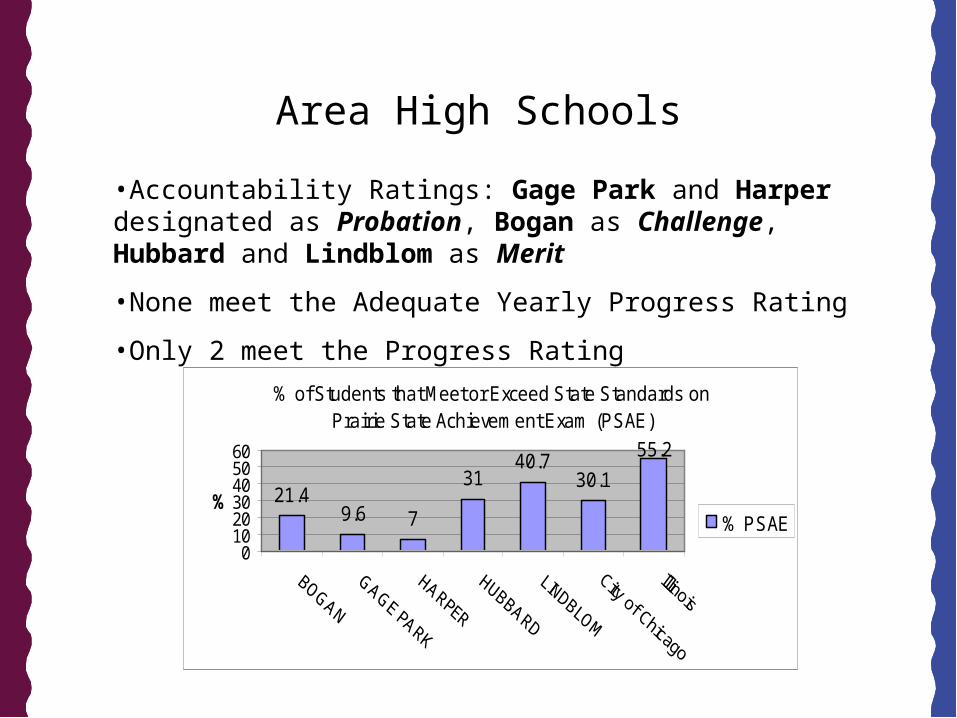
Area High Schools
% of Students that Meet or Exceed State Standards on Prairie State Achievement Exam (PSAE)
21.49.6 7
3140.7
30.1
55.2
0102030405060
%% PSAE
•Accountability Ratings: Gage Park and Harper designated as Probation, Bogan as Challenge, Hubbard and Lindblom as Merit
•None meet the Adequate Yearly Progress Rating
•Only 2 meet the Progress Rating

14.817.4
6.5 8.713.9
4.9
84.5
78.9
90.7 91 92.2 94
9.4
35
1.1
7.53.2 1.9
27.1
38.1
10.35.4
24.5
16.4
0
10
20
30
40
50
60
70
80
90
100
GAGE PARK HARPER HUBBARD LINDBLOM City of Chicago Illinois
dropout rate2002-2003
dailyAttendanceRate
ChronicTruancy
Mobility Rate
Area High Schools

6. Crime
• Index crimes include:– Murder
– Criminal sexual assault
– Robbery
– Aggravated assault/battery
– Burglary
– Theft
– Motor Vehicle Theft
– Arson
Chicago Lawn Index Crimes, 2002
• 4226 crimes total– 0.26% murder
– 1% criminal sexual assault
– 12.3% robbery
– 14.1% aggravated assault/battery
– 16.5% burglary
– 34.7% theft
– 20.5% motor vehicle theft
– 0.5% arson

Index crime comparisonChicago Lawn 4,226 crimes, 61,412 pop
68.8/1000 population
West Lawn 2,071 crimes, 29,235 pop
70.8/1000 population
West Elsdon 793 crimes, 15,921 pop
49.8/1000 population
Gage Park 1,942 crimes, 39,193 pop
49.5/1000 population
West Englewood 4,335 crimes, 45,282
95.7/1000 population
Ashburn 1,729 crimes, 39,584 pop
43.7/1000 population

Hate crimes
• 2002: 8 hate crimes– 3 race, 4 national origin, 1 sexual orientation
• 2001: 25 hate crimes (highest in City)– 7 race, 2 religion, 15 national origin, 1 sexual
orientation
• 2000: 29 hate crimes (highest in City)– 17 race, 2 religion, 6 national origin, 3 sexual
orientation, 1 gender/disability

Domestic Violence
• 60629 zip code– 216 calls to City hotline– 94% female callers– 41% Black, 11% White, 42% Hispanic– 83% conducted in English, 16.2% in Spanish– Services requested:
• 36% shelter• 25% counseling• 28% legal• 6% information