healthtech heartbeat - 2014 market review
TRANSCRIPT


Deep domain expertise in three inter-related sectors… … and broad industry networks
A market-leading corporate finance advisory firm… • Founded in 1991
• Entrepreneurial and owner-managed
• 40 person team; 250+ completed transactions • Broad global network
• Creative solutions
• Senior level focus on every transaction
…with global reach
2
About Results International

50
60
70
80
90
100
110
120
130
Jan
14
Feb
14
Ma
r 1
4
Ap
r 1
4
Ma
y 1
4
Jun
14
Jul 1
4
Au
g 1
4
Se
p 1
4
Oc
t 1
4
No
v 1
4
De
c 1
4
Healthcare IT - Europe Healthcare IT - US Biopharma IT Generalists NASDAQ Composite Index FTSE 100
Results International Global HeathTech Indices
Note: Based on share prices as at 31 December 2014
Note: Indices weighted by market capitalisation
Note: Biopharma IT index predominantly reflects Veeva performance since IPO in October 2013
Note: (1)
Excludes Generalists
Sources: Capital IQ and Results analysis
3
15.8%
11.4%
13.4%
7.0%
-19.2%
-2.7%
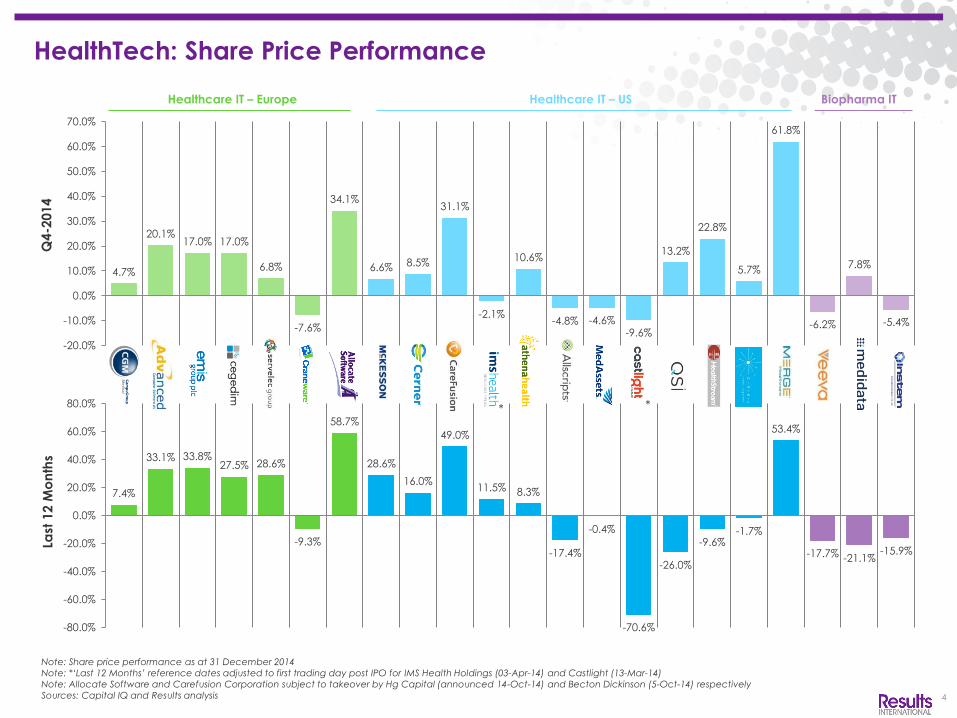
Q4 2014 Performance
Healthcare IT – Europe 7.8%
Healthcare IT - US 6.0%
Biopharma IT -0.6%
Generalists 8.4%
HealthTech(1)
5.7%
4.7%
20.1% 17.0% 17.0%
6.8%
-7.6%
34.1%
6.6% 8.5%
31.1%
-2.1%
10.6%
-4.8% -4.6% -9.6%
13.2%
22.8%
5.7%
61.8%
-6.2%
7.8%
-5.4%
-20.0%
-10.0%
0.0%
10.0%
20.0%
30.0%
40.0%
50.0%
60.0%
70.0%
Q4-2
014
7.4%
33.1% 33.8% 27.5% 28.6%
-9.3%
58.7%
28.6%
16.0%
49.0%
11.5% 8.3%
-17.4%
-0.4%
-70.6%
-26.0%
-9.6% -1.7%
53.4%
-17.7% -21.1% -15.9%
-80.0%
-60.0%
-40.0%
-20.0%
0.0%
20.0%
40.0%
60.0%
80.0%
Last
12 M
on
ths
HealthTech: Share Price Performance
Note: Share price performance as at 31 December 2014
Note: *‘Last 12 Months’ reference dates adjusted to first trading day post IPO for IMS Health Holdings (03-Apr-14) and Castlight (13-Mar-14)
Note: Allocate Software and Carefusion Corporation subject to takeover by Hg Capital (announced 14-Oct-14) and Becton Dickinson (5-Oct-14) respectively
Sources: Capital IQ and Results analysis 4
* *
Healthcare IT – Europe Healthcare IT – US Biopharma IT

Company IPO
Date Description Raised
Indicative
Price Range
($)
IPO Price
($)
Increase vs.
range
Day 1
Increase
Current
Increase(1)
Current
EV
EV / Revenue
2014E
EV / EBITDA
2014E
Apr-14
Healthcare information technology and services
1,300.0 18.00-21.00 20.00 2.5% 15.0% 28.2% 12,334 4.7x 14.1x
Mar-14 Healthcare enterprise management software
177.6 13.00-15.00 16.00 14.3% 148.8% -26.9% 874 19.8x n.m.(2)
Dec-13
Software, hardware and services for the healthcare and energy sectors
199.7 n.a. 2.93 n.a. 20.1% 58.0% 297 3.5x 15.5x
Oct-13
Cloud-based CRM software for the biopharma industry
260.9 16.00-18.00 20.00 17.6% 86% 32.0% 3,036 10.0x 36.3x
HealthTech: Recent IPO Performances
5
NYSE
NYSE
LSE
NYSE
Note: Calendarised to December year end; $ millions, except share price data
Note: (1)
Current increase from IPO price; Market data as of 31 December 2014
Note: (2)
Castlight projecting negative EBITDA for CY2014
Source: Capital IQ
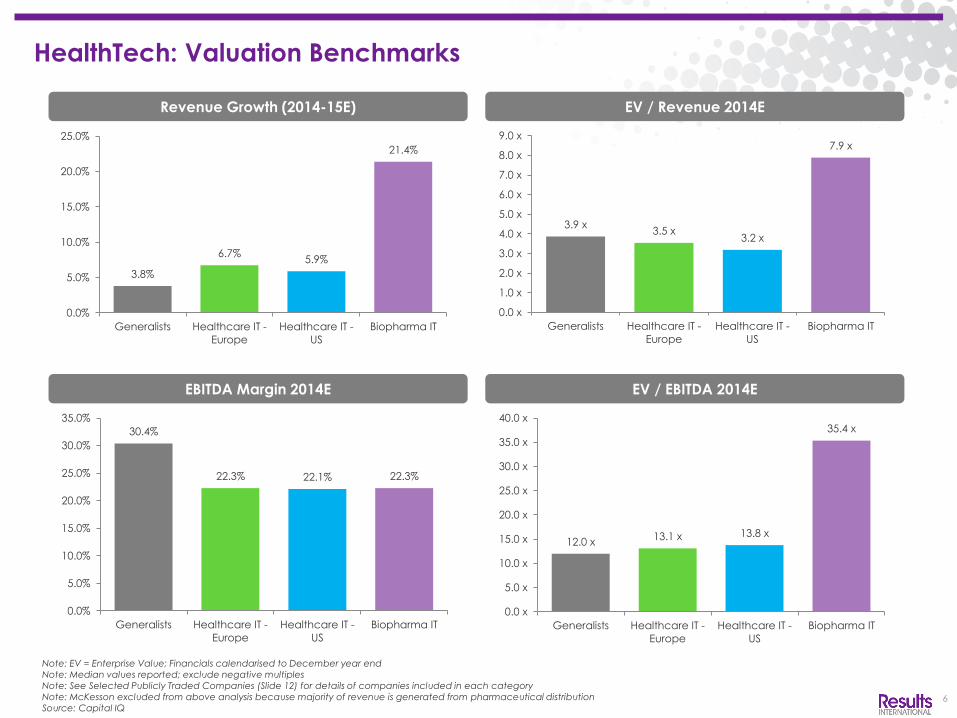
HealthTech: Valuation Benchmarks
6
EBITDA Margin 2014E EV / EBITDA 2014E
Revenue Growth (2014-15E) EV / Revenue 2014E
Note: EV = Enterprise Value; Financials calendarised to December year end
Note: Median values reported; exclude negative multiples
Note: See Selected Publicly Traded Companies (Slide 12) for details of companies included in each category
Note: McKesson excluded from above analysis because majority of revenue is generated from pharmaceutical distribution
Source: Capital IQ
3.8%
6.7% 5.9%
21.4%
0.0%
5.0%
10.0%
15.0%
20.0%
25.0%
Generalists Healthcare IT -
Europe
Healthcare IT -
US
Biopharma IT
30.4%
22.3% 22.1% 22.3%
0.0%
5.0%
10.0%
15.0%
20.0%
25.0%
30.0%
35.0%
Generalists Healthcare IT -
Europe
Healthcare IT -
US
Biopharma IT
3.9 x 3.5 x
3.2 x
7.9 x
0.0 x
1.0 x
2.0 x
3.0 x
4.0 x
5.0 x
6.0 x
7.0 x
8.0 x
9.0 x
Generalists Healthcare IT -
Europe
Healthcare IT -
US
Biopharma IT
12.0 x 13.1 x 13.8 x
35.4 x
0.0 x
5.0 x
10.0 x
15.0 x
20.0 x
25.0 x
30.0 x
35.0 x
40.0 x
Generalists Healthcare IT -
Europe
Healthcare IT -
US
Biopharma IT

16 19
21
17 20
32 29
18
28 27 28
32
44
61
3
4
3
5
1 1
7
2 7 5
6
2
8
0
2,000
4,000
6,000
8,000
10,000
12,000
14,000
16,000
18,000
0
10
20
30
40
50
60
70
80
Q3 2011 Q4 2011 Q1 2012 Q2 2012 Q3 2012 Q4 2012 Q1 2013 Q2 2013 Q3 2013 Q4 2013 Q1 2014 Q2 2014 Q3 2014 Q4 2014
Healthcare IT Biopharma IT Healthcare IT Total Disclosed Deal Value Biopharma IT Total Disclosed Deal Value
HealthTech: Global M&A Activity N
um
be
r o
f D
ea
ls
Sources: Press releases, Capital IQ, Mergermarket, 451 Research and Results analysis 7
Tota
l D
isc
lose
d D
ea
l V
alu
e (
$m
)

HealthTech: Selected Deals in 2014
Date Buyer Target EV ($m) EV /
Revenue
EV /
EBITDA Description
Target
location
Dec-14 10.1 1.0x n.a. Diabetic eye screening and ophthalmology imaging services
Dec-14 n.a. n.a. n.a. Software and services for UK public sector markets including government
agencies, public safety, housing and healthcare
Dec-14 25.4 2.0x 10.1x Risk and compliance management software for healthcare, manufacturing
and aviation
Dec-14 19.7 1.1x 2.8x Image processing software for cancer screening
Dec-14 36.9 2.5x 11.3x Social care case management software
Nov-14 1,230.8 3.7x 16.2x Software provider to private and public sectors including healthcare
Nov-14 52.2 4.1x n.a. Embryo analysis equipment and software for IVF
Nov-14 150 n.a. n.a. Tissue image analysis software
Oct-14 11.7 2.2x 7.8x Orthopaedic procedure planning software
Oct-14 152.1 2.3x 14.2x Workforce management, governance and risk compliance software for
primary, secondary and social care
Oct-14 n.a. n.a. n.a. Digital marketing services and business management software for the life
sciences industry
Oct-14 11,803.0 3.1x 14.7x Medical hardware and software technology
Sep-14 n.a. n.a. n.a. Practice management and analytics software for secondary care
Sep-14 n.a. n.a. n.a. Dispensary management software for pharmacies
Sep-14 2,700.0 3.8x n.a. Healthcare IT solutions for payers and care providers
Sep-14 n.a. n.a. n.a. Pharmacy management software
Aug-14 2.1 n.a. n.a. Mobile technology and patient connectivity
8
Note: Financials relate to the companies’ full fiscal year before the transaction took place
Note: Enterprise Value (EV) = transaction value scaled to 100% shareholding plus net debt (includes minority interest)
Sources: Press releases, Capital IQ, Mergermarket, 451 Research and Results analysis

Note: Financials relate to the companies’ full fiscal year before the transaction took place
Note: Enterprise Value (EV) = transaction value scaled to 100% shareholding plus net debt (includes minority interest)
Sources: Press releases, Capital IQ, Mergermarket, 451 Research and Results analysis
HealthTech: Selected Deals in 2014
Date Buyer Target EV ($m) EV /
Revenue
EV /
EBITDA Description
Target
location
Aug-14
Health Services Assets
1,300.0 n.a. n.a. Healthcare IT for primary and secondary care
Jul-14 n.a. n.a. n.a. Health economics optimisation software
Jul-14 5.5 1.3x 4.6x Data display, integration and messaging solutions for the NHS and private care
providers
Jul-14 71.8 2.8x 9.3x Trial Master File solutions provider
Jul-14 n.a. n.a. n.a. Patient Administration Systems & Electronic Patient Records
Jun-14 Information & CRM Solutions Assets
523.5 0.9x 6.0x Information & CRM solutions for the life sciences industry
Jun-14 n.a. n.a. n.a. Electronic Patient Records for health and social care
May-14 n.a. n.a. n.a. Data analytics solutions for decision-making support
Apr-14 0.2 0.5x n.a. Medical imaging software
Apr-14 550.0 n.a. n.a. Web-based workflow solutions for clinical and administrative tasks
Mar-14 15.4 2.3x n.a. Online compliance training & tracking solutions for secondary care and nursing
facilities
Feb-14 n.a. n.a. n.a. Supply chain management software for healthcare providers, manufacturers
and distributors
Feb-14 n.a. n.a. n.a. Maternity, radiology and primary care information systems
Jan-14 630 3.7x n/m Enterprise management software for drug discovery
Jan-14 n.a. n.a. n.a. Primary care clinical information systems
Jan-14 n.a. n.a. n.a. Software solutions for laboratories and diagnostics
Jan-14 n.a. n.a. n.a. Sales & marketing software for the pharmaceutical industry
9

Date Company Type of
round
Funds
raised ($m) Investor participation Description
Company
headquarters
Dec-14 Series B 8.7 - Point of care hospital information system
Dec-14 - 5.0 Maggioli S.p.A., Tamburi Investment Partners, Ghenos Srl Electronic Medical Record and diagnostic solutions for
primary and secondary healthcare
Dec-14 Series B - Private investor Mobile patient data access platform
Dec-14 Venture 5.0 Scottish Equity Partners, Albion Ventures Patient engagement and data capture software
Nov-14 Venture 16.3 Top Technology Ventures, Invesco Perpetual, IP Group,
Lansdowne Partners, Woodford Investment Management Genomic sequence data analysis software
Nov-14 Venture 1.7 Maxfield Capital Management Fund Patient treatment management telemedicine application
Nov-14 Venture 5.6 Sofinnova Partners, Balderton Capital Online platform for accessing drugs under development
Oct-14 Angel 0.8 Enterprise Ireland Appointment scheduling and CRM software for therapists
and healthcare clinics
Oct-14 Venture 2.5 Participatiemaatschappij Vlaanderen, QBIC Venture
Partners, Fournier-Majoie Foundation Genomic sequence data analysis software
Oct-14 Venture 1.6 Crown Ocean Capital Patient exercise management telemedicine application
Sep-14 Series A 2.0 Isis Innovation, Parkwalk Advisors, Chimera Partners Stroke damage evaluation software for CT scans
Sep-14 Seed 2.6 - Drug development software and consultancy
Sep-14 Venture 0.3 - Mental health tracking telemedicine application
Sep-14 Seed 0.4 Mercia Fund Management Diagnostic and clinical trials software for optometry
Aug-14 Seed 0.1 Bayer AG Cardiac monitoring mobile telemedicine application
Aug-14 Series C 0.6 Amadeus Capital Partners Primary care practice and case management software
Aug-14 Angel 1.2 - Clinical decision support software
HealthTech: Selected European Fundraisings in 2014
10 Sources: VentureSource and Capital IQ

Date Company Type of
round
Funds
raised ($m) Investor participation Description
Company
headquarters
Aug-14 Seed 0.3 Rheingau Founders Web-hosted medical consultation platform
Jul-14 Series B 13.8 Endeavour Vision, Swisscom, Asset Management Arm,
Invoke Capital Data-driven diagnostic testing platform
Jun-14 BREAKBAD Seed 0.3 London Business Angels Addiction management mobile application
Jun-14 Seed - ACT Venture Capital Clinical data capture / analysis and revenue cycle
management
May-14 Seed 0.8 Enterprise Ireland Appointment scheduling and CRM software for therapists
and healthcare clinics
May-14 Venture 5.8 Capricorn Venture Partners, Gemma Frisius Fonds,
Participatiemaatschappij Vlaanderen Genetic information analysis and reporting software
May-14 Venture 3.4 Top Technology Ventures, IP Group, ORA Capital Partners Video software for the measurement of vital signs
May-14 Angel 0.4 Midven Various mobile healthcare applications
May-14 Venture - Peppermint VenturePartners, Stiftung Charité Visual therapy platform
Apr-14 Series D 28.7 QUALCOMM Ventures, Bpifrance Investissement, Cap
Décisif Management, and others
Medication adherence and symptom management
application
Apr-14 Series A 3.8 Index Ventures, Forward Partners Behavioural medicine delivery software
Mar-14 Series A 6.9 ACG Management, EXTENS Interoperabiltiy and security software
Mar-14 Seed 1.0 Technology Strategy Board Knowledge sharing and education platform
Mar-14 Series A 0.7 Intel, Vodafone Mobile patient data access platform
Feb-14 Venture 2.2 - Online platform for accessing drugs under development
Jan-14 Seed - SEED Capital Denmark Stroke treatment support software
Jan-14 Seed 0.1 Wayra Investigación y Desarrollo Genetic matching ePrescription software
HealthTech: Selected European Fundraisings in 2014
11 Sources: VentureSource and Capital IQ

Operating Metrics Valuation Metrics
Price % of 52 Market Total Net Enterprise Revenue Rev. Growth Gross Margin Revenue EBITDA
Company (31-Dec-14) Week High Cap Cash Debt Value CY2014 CY14-15 Historical CY2014 CY2015 CY2014 CY2015 CY2014 CY2015
Generalists with significant HealthTech exposure
Oracle Corporation 44.97 96% 207,407 51,616 (18,469) 188,938 38,920 3.5% 61.3% 47.8% 50.3% 4.9 x 4.7 x 10.2 x 9.3 x
SAP SE 70.62 93% 86,125 3,390 1,253 87,378 21,166 7.9% 72.6% 34.4% 34.9% 4.1 x 3.8 x 12.0 x 11.0 x
EMC Corporation 29.74 96% 61,383 8,147 (1,031) 60,352 24,501 7.4% 62.3% 30.4% 30.6% 2.5 x 2.3 x 8.1 x 7.5 x
Thermo Fisher Scientific, Inc. 125.29 97% 50,930 544 13,939 64,869 16,789 3.8% 42.5% 23.9% 25.4% 3.9 x 3.7 x 16.1 x 14.7 x
Thomson Reuters Corporation 40.47 98% 32,779 1,788 7,694 40,473 10,937 1.5% 27.6% 26.7% 28.7% 3.2 x 3.1 x 12.0 x 11.0 x
Computer Sciences Corporation 63.05 94% 9,052 1,923 892 9,944 12,858 0.7% 25.2% 16.4% 17.2% 0.8 x 0.8 x 4.7 x 4.5 x
Aspen Technology, Inc. 35.02 72% 3,187 265 (265) 2,921 414 12.0% 85.3% 38.4% 42.7% 7.0 x 6.3 x 18.4 x 14.8 x
25th percentile 2.5% 35.0% 25.3% 27.0% 2.8 x 2.7 x 9.1 x 8.4 x
Median 3.8% 61.3% 30.4% 30.6% 3.9 x 3.7 x 12.0 x 11.0 x
75th percentile 7.7% 67.4% 36.4% 38.8% 4.5 x 4.3 x 14.1 x 12.8 x
Healthcare IT - Europe
CompuGroup Medical AG 24.09 93% 1,198 29 408 1,606 628 4.5% 37.4% 19.8% 22.5% 2.6 x 2.4 x 12.9 x 10.9 x
Advanced Computer Software Group plc 2.16 99% 1,144 16 58 1,202 339 6.3% 50.5% 22.1% 23.5% 3.5 x 3.3 x 16.0 x 14.2 x
EMIS Group PLC 13.56 100% 856 12 7 863 212 6.7% 48.5% 31.2% 31.8% 4.1 x 3.8 x 13.0 x 12.0 x
Cegedim SA 35.32 99% 493 63 611 1,104 1,091 (31.7%) 45.1% 17.5% 19.7% 1.0 x 1.5 x 5.8 x 7.5 x
Servelec Group plc 4.63 99% 320 15 (23) 297 86 28.8% 43.8% 22.3% 22.9% 3.5 x 2.7 x 15.5 x 11.7 x
Craneware plc 7.42 75% 200 33 (33) 167 44 12.4% 95.2% 28.8% 29.0% 3.8 x 3.4 x 13.1 x 11.6 x
Allocate Software plc. 2.42 98% 171 14 (21) 149 26 55.4% 71.0% 38.7% 28.0% 5.8 x 3.7 x 14.9 x 13.2 x
25th percentile 5.4% 44.5% 21.0% 22.7% 3.0 x 2.6 x 13.0 x 11.2 x
Median 6.7% 48.5% 22.3% 23.5% 3.5 x 3.3 x 13.1 x 11.7 x
75th percentile 20.6% 60.8% 30.0% 28.5% 3.9 x 3.5 x 15.2 x 12.6 x
Healthcare IT - US
McKesson Corporation 207.58 97% 48,911 3,804 8,363 57,274 167,582 9.0% 6.0% 2.6% 2.8% 0.3 x 0.3 x 13.0 x 11.2 x
Cerner Corporation 64.66 97% 23,115 1,332 (1,185) 21,930 3,381 26.7% 84.3% 33.5% 32.0% 6.5 x 5.1 x 19.3 x 16.0 x
CareFusion Corporation 59.34 100% 12,345 1,736 255 12,600 3,955 4.8% 50.8% 23.7% 25.2% 3.2 x 3.0 x 13.4 x 12.1 x
IMS Health Holdings, Inc. 25.64 90% 8,773 354 3,561 12,334 2,644 5.8% 54.1% 33.1% 33.7% 4.7 x 4.4 x 14.1 x 13.1 x
athenahealth, Inc. 145.70 70% 5,761 105 108 5,868 747 23.0% 59.9% 18.6% 18.0% 7.9 x 6.4 x 42.2 x 35.5 x
Allscripts Healthcare Solutions, Inc. 12.77 65% 2,302 37 550 2,852 1,399 5.6% 45.1% 14.5% 16.6% 2.0 x 1.9 x 14.1 x 11.7 x
MedAssets, Inc. 19.76 76% 1,203 14 895 2,097 716 5.9% 77.7% 33.1% 33.5% 2.9 x 2.8 x 8.8 x 8.3 x
Castlight Health, Inc 11.70 28% 1,056 182 (182) 874 44 83.5% (33.4%) (173.7%) (85.5%) 19.8 x 10.8 x n.m. n.m.
Quality Systems Inc. 15.59 74% 940 124 (124) 816 474 7.4% 56.0% 14.5% 15.7% 1.7 x 1.6 x 11.9 x 10.2 x
Healthstream Inc. 29.48 85% 835 116 (116) 718 171 17.6% 58.0% 16.6% 16.9% 4.2 x 3.6 x 25.3 x 21.1 x
Computer Programs & Systems Inc. 60.75 85% 681 29 (29) 652 210 3.1% 46.7% 27.9% 28.4% 3.1 x 3.0 x 11.1 x 10.6 x
Merge Healthcare Incorporated 3.56 97% 342 34 194 536 215 4.0% 58.6% 22.1% 23.0% 2.5 x 2.4 x 11.2 x 10.4 x
25th percentile 5.2% 48.8% 15.5% 16.7% 2.7 x 2.6 x 11.4 x 10.5 x
Median 5.9% 56.0% 22.1% 23.0% 3.2 x 3.0 x 13.8 x 11.9 x
75th percentile 20.3% 59.2% 30.5% 30.2% 5.6 x 4.8 x 18.0 x 15.3 x
Biopharma IT
Veeva Systems Inc. 26.41 66% 3,429 393 (393) 3,036 303 26.7% 60.4% 27.6% 27.4% 10.0 x 7.9 x 36.3 x 28.8 x
Medidata Solutions, Inc. 47.75 70% 2,675 258 (20) 2,655 337 21.4% 74.7% 22.3% 24.0% 7.9 x 6.5 x 35.4 x 27.0 x
Instem plc 2.06 66% 25 - - 28 20 6.5% 18.1% 13.7% 16.8% 1.2 x 1.2 x 9.1 x 7.0 x
25th percentile 13.9% 39.3% 18.0% 20.4% 4.6 x 3.8 x 22.2 x 17.0 x
Median 21.4% 60.4% 22.3% 24.0% 7.9 x 6.5 x 35.4 x 27.0 x
75th percentile 24.1% 67.6% 24.9% 25.7% 8.9 x 7.2 x 35.8 x 27.9 x
EBITDA Margin
HealthTech: Selected Publicly Traded Companies
12
Note: Calendarised to December year end; $ millions, except share price data; Multiples capped at 20x EV / Revenue and 50x EV / EBITDA; Net debt includes minority interest
Note: (1)
McKesson excluded from ‘Healthcare IT – US’ summary analysis above because majority of revenue is generated from pharmaceutical distribution
Note: (2)
Castlight Health has run a negative gross margin during a period of rapid growth due to additional implementation costs associated with launching new customers
Note: (3)
Cegedim’s revenue growth and EBITDA multiples reflect the divestiture of its Information and CRM solutions assets to IMS Health in June 2014
Source: Capital IQ
(2)
(1)
(2)
(3)

27 Soho Square, London, W1D 3AY
t +44 20 7629 7575 | f +44 20 7629 2233
www.resultsig.com
Chris Lewis
Managing Director
Di: +44 (0) 20 7514 8236
13
Richard Latner
Manager
Di: +44 (0) 20 7514 8241
Disclaimer:
This document has been produced by Results International Group LLP (“Results”) and is furnished to you solely for your information and may not be reproduced or
redistributed, in whole or in part, to any other person. No representation or warranty (expressed or implied) is made as to, and no reliance should be placed on, the fairness,
accuracy or completeness of the information contained herein and, accordingly, none of Results’ officers or employees accepts any liability whatsoever arising directly or
indirectly from the use of this document.
Authorised and regulated by the Financial Conduct Authority.
Contact Us