healthcare, regulatory and reimbursement landscape ... · pdf filemedical device market, ......
TRANSCRIPT

REFERENCE CODE GDHC0080CHR | PUBLICATION DATE JUNE 2015
HEALTHCARE, REGULATORY AND REIMBURSEMENT LANDSCAPE – REPUBLIC OF CHINA (TAIWAN)

Healthcare, Regulatory and Reimbursement Landscape – Republic of China (Taiwan) 2 © GlobalData. This report is a licensed product and is not to be copied, reproduced, shared or resold in any form.
HEALTHCARE, REGULATORY AND REIMBURSEMENT LANDSCAPE – REPUBLIC OF CHINA (TAIWAN)
Executive Summary
An increasingly elderly population and a declining birth rate pose a demographic challenge for the government. Good access to health insurance, a growing healthcare burden and government initiatives are expected to drive market growth, although periodic price cuts have presented a major challenge.
In 2013, the number of people above the age of XX
accounted for XX% of the population of Taiwan
(officially the Republic of China) (NDC, 2014a). It is
increasing significantly, and this will increase the
disease burden. Medical expenditure for chronic
diseases has also increased, although the
government is attempting to reduce the financial
burden through comprehensive healthcare
reforms. The overall population increased slightly
between 2008 and 2013 from XX to XX million,
mainly due to a rising life expectancy. However,
the birth rate decreased at a negative Compound
Annual Growth Rate (CAGR) of XX% between
2008 and 2013 (NDC, 2014a).
Although, at $XX billion, Taiwan’s pharmaceutical
market was smaller than those of Japan, China,
India and South Korea, in 2013, its per-capita
expenditure on medicines was significantly higher,
at $XX. The pharmaceutical market grew at a
CAGR of XX% from 2008 to 2013. The
government is taking various steps to ensure
investment in and the growth of the pharmaceutical
industry. According to the Act for the Development
of Biotech and New Pharmaceuticals Industry, the
government is providing incentives for new
pharmaceutical companies, such as reductions in
income tax.
The Global Budget Payment System was
implemented in 2002, since which the price of
National Health Insurance (NHI)-funded drugs has
been reduced seven times, impacting both
domestic companies and their foreign
counterparts. The last price cut took place in 2011
and led to price cuts on XX drugs amounting to
$XXm. The Ministry of Health and Welfare (MoHW)
introduced the Drug Expenditure System in 2013
on a trial basis. According to this system, prices
would be adjusted, based on the deficits caused by
the difference between the healthcare budget and
the actual spending. If the actual spending for a
particular year were more than the healthcare
budget, a price cut would be brought into effect the
following year. In 2014, there was a deficit of
TWDXX billion ($XXm) that resulted in a price cut
on XX drugs at an average cut rate of XX%. This
went into effect in April 2015 (IRPMA, 2013).
Pharmaceutical prices in Taiwan are on average
approximately XX% of the price of the original
industry developed products marketed in the US
(USTR, 2013). The continual price cuts are a major
challenge for the growth of the pharmaceutical
market.

Healthcare, Regulatory and Reimbursement Landscape – Republic of China (Taiwan) 3 © GlobalData. This report is a licensed product and is not to be copied, reproduced, shared or resold in any form.
HEALTHCARE, REGULATORY AND REIMBURSEMENT LANDSCAPE – REPUBLIC OF CHINA (TAIWAN)
Executive Summary
Pharmaceutical Market, Taiwan, Revenue ($bn), 2008–2020
2008 2013 2017 2020
Rev
enue
($bn
)
Source: Chen, 2010; MOEAIDB, 2013
The Taiwanese market for medical devices is one
of the largest in Asia due to the growing elderly
population and consequent increase in the demand
for healthcare products and services. It was valued
at approximately $XX billion in 2008 and grew at a
CAGR of XX% to $XX billion in 2013. By 2020, it is
expected to have reached $XX billion.
Medical Device Market, Taiwan, Revenue ($bn), 2008–2020
2008 2013 2017 2020R
even
ue ($
m)
Source: GlobalData, Medical eTrack [Accessed on April 26, 2015]
Universal healthcare coverage and access to healthcare facilities and reimbursement are the distinguishing features of the healthcare system.
Taiwan has a compulsory NHI system with
universal coverage: approximately XX% of the
population (NHI, 2014a). The second-generation
NHI system was implemented in January 2013,
and in July 2013, the name Bureau of NHI (BNHI)
was changed to National Health Insurance
Administration (NHIA). Owing to the reforms in the
NHIA system, the NHIA no longer has a deficit in
funding (NHI, 2014a). In 2013, approximately XX%
of all healthcare facilities were contracted by the
NHI system. The government receives funds for
health insurance from general tax revenue.
Healthcare, Regulatory and Reimbursement Landscape – Republic of China (Taiwan) 6 © GlobalData. This report is a licensed product and is not to be copied, reproduced, shared or resold in any form.
Table of Contents
HEALTHCARE, REGULATORY AND REIMBURSEMENT LANDSCAPE – REPUBLIC OF CHINA (TAIWAN)
1 Table of Contents
1 Table of Contents ....................................................................................................................... 6
1.1 List of Tables .................................................................................................................... 10
1.2 List of Figures ................................................................................................................... 14
2 Introduction ............................................................................................................................... 19
2.1 GlobalData Report Guidance ............................................................................................ 19
3 Overview of Pharmaceutical and Medical Device Markets ........................................................ 20
3.1 Pharmaceutical Market ..................................................................................................... 20
3.1.1 Market Overview ........................................................................................................... 20
3.1.2 Pharmaceutical Exports and Imports ............................................................................. 24
3.1.3 Supply Channels ........................................................................................................... 25
3.1.4 Market Segments .......................................................................................................... 25
3.1.5 Overview of Top Five Disease Areas ............................................................................ 28
3.1.6 Major Players ................................................................................................................ 31
3.2 Medical Device Market ...................................................................................................... 64
3.2.1 Market Overview ........................................................................................................... 64
3.2.2 Overview of Top Five Segments.................................................................................... 66
3.2.3 Diagnostic market ......................................................................................................... 77
3.2.4 Major Players ................................................................................................................ 78
3.3 Market Drivers and Barriers ............................................................................................ 108
3.3.1 Drivers......................................................................................................................... 108
3.3.2 Barriers ....................................................................................................................... 109
Healthcare, Regulatory and Reimbursement Landscape – Republic of China (Taiwan) 7 © GlobalData. This report is a licensed product and is not to be copied, reproduced, shared or resold in any form.
Table of Contents
HEALTHCARE, REGULATORY AND REIMBURSEMENT LANDSCAPE – REPUBLIC OF CHINA (TAIWAN)
4 Market Access ........................................................................................................................ 111
4.1 Reimbursement and Payer Landscape ........................................................................... 111
4.1.1 Overview of Healthcare System .................................................................................. 111
4.1.2 Reimbursement Process ............................................................................................. 114
4.1.3 Overview of Insurance Providers ................................................................................. 117
4.1.4 Patient Share in Healthcare Spending ......................................................................... 121
4.1.5 Price Trend in Healthcare Services ............................................................................. 122
4.1.6 Pricing Policies ............................................................................................................ 124
4.2 Regulatory Landscape .................................................................................................... 125
4.2.1 Overview of Regulatory Agencies................................................................................ 125
4.2.2 Market Authorization Procedure for Pharmaceutical Products ..................................... 126
4.2.3 Market Authorization Procedure for Medical Devices .................................................. 131
4.2.4 Licensing Process for Pharmaceutical and Medical Device Manufacturing .................. 134
4.2.5 Licensing Process for Pharmaceutical Exports and Imports ........................................ 137
4.2.6 Intellectual Property Rights.......................................................................................... 138
4.2.7 Clinical Trial Regulations ............................................................................................. 140
4.2.8 Pharmaceutical Advertising Regulations ..................................................................... 142
4.2.9 Pharmacy Regulations ................................................................................................ 143
4.2.10 Labeling and Packaging Regulations .......................................................................... 144
5 Country Analysis ..................................................................................................................... 145
5.1 Political Environment....................................................................................................... 145
5.1.1 Political Structure ........................................................................................................ 145
5.1.2 Analysis of the Current Political Environment .............................................................. 146
Healthcare, Regulatory and Reimbursement Landscape – Republic of China (Taiwan) 8 © GlobalData. This report is a licensed product and is not to be copied, reproduced, shared or resold in any form.
Table of Contents
HEALTHCARE, REGULATORY AND REIMBURSEMENT LANDSCAPE – REPUBLIC OF CHINA (TAIWAN)
5.1.3 Healthcare Policy Initiatives ......................................................................................... 147
5.2 Economic Landscape ...................................................................................................... 149
5.3 Economic Indicators ........................................................................................................ 150
5.3.1 Gross Domestic Product ............................................................................................. 150
5.3.2 National Income per Capita ......................................................................................... 154
5.3.3 Inflation ....................................................................................................................... 155
5.3.4 Currency Exchange Rate ............................................................................................ 159
5.3.5 Foreign Direct Investment ........................................................................................... 160
5.3.6 Foreign Exchange Reserves ....................................................................................... 161
5.3.7 Trade Balance ............................................................................................................. 163
5.3.8 Government Structural Balance................................................................................... 165
5.3.9 General Government Gross Debt ................................................................................ 167
5.3.10 Major Industries ........................................................................................................... 169
5.4 Demographics ................................................................................................................. 170
5.4.1 Population ................................................................................................................... 170
5.4.2 Education and Literacy ................................................................................................ 186
5.4.3 Employment ................................................................................................................ 187
5.4.4 Disease Burden ........................................................................................................... 190
5.5 Healthcare Infrastructure ................................................................................................. 191
5.5.1 Healthcare Facilities .................................................................................................... 191
5.5.2 Healthcare Parameters ............................................................................................... 202
5.5.3 Environmental Health .................................................................................................. 204
5.5.4 Healthcare Personnel .................................................................................................. 207
Healthcare, Regulatory and Reimbursement Landscape – Republic of China (Taiwan) 9 © GlobalData. This report is a licensed product and is not to be copied, reproduced, shared or resold in any form.
Table of Contents
HEALTHCARE, REGULATORY AND REIMBURSEMENT LANDSCAPE – REPUBLIC OF CHINA (TAIWAN)
5.6 Healthcare Expenditure ................................................................................................... 211
5.6.1 Overview ..................................................................................................................... 211
5.6.2 Major Components of Healthcare Spending ................................................................ 212
5.6.3 Public and Private Sector Share .................................................................................. 214
5.6.4 Spending in Pharmaceutical Research and Development ........................................... 216
5.7 Trade Associations ......................................................................................................... 217
5.7.1 Taiwan Medical and Biotech Industry Association ....................................................... 217
5.7.2 Taiwan Public Health Association................................................................................ 217
5.7.3 Taiwan Medical Association ........................................................................................ 217
5.7.4 Taiwan Generic Pharmaceutical Association ............................................................... 217
5.8 Trade Fairs ..................................................................................................................... 218
6 Opportunities and Challenges ................................................................................................. 219
6.1 Opportunities .................................................................................................................. 219
6.2 Challenges ...................................................................................................................... 220
7 Appendix................................................................................................................................. 222
7.1 Abbreviations .................................................................................................................. 222
7.2 Bibliography .................................................................................................................... 226
7.3 Research Methodology ................................................................................................... 239
7.3.1 Coverage .................................................................................................................... 239
7.3.2 Secondary Research ................................................................................................... 240
7.3.3 Forecasts .................................................................................................................... 240
7.3.4 Expert Panel................................................................................................................ 240
7.4 Disclaimer ....................................................................................................................... 241

Healthcare, Regulatory and Reimbursement Landscape – Republic of China (Taiwan) 10 © GlobalData. This report is a licensed product and is not to be copied, reproduced, shared or resold in any form.
Table of Contents
HEALTHCARE, REGULATORY AND REIMBURSEMENT LANDSCAPE – REPUBLIC OF CHINA (TAIWAN)
1.1 List of Tables
Table 1: Pharmaceutical Market, Taiwan, Revenue ($bn), 2008–2013 ...................................................... 22
Table 2: Pharmaceutical Market, Taiwan, Revenue Forecast ($bn), 2014–2020 ........................................ 23
Table 3: Pharmaceutical Market, Taiwan, Exports and Imports ($bn), 2008–2013 ..................................... 24
Table 4: Pharmaceutical Device Market, Taiwan, Market Segments of Newly Emerging Biotech Industry by
Share (%), 2009 .......................................................................................................................... 28
Table 5: Pharmaceutical Device Market, Taiwan, Top Five Therapeutic Areas by Expenditure on Personal
Health Care, 2013 ....................................................................................................................... 29
Table 6: Pfizer, Global, Major Products, Revenue, 2014 ............................................................................ 32
Table 7: Pharmaceutical Market, Global, Late-Stage Pipeline, Pfizer, 2015 ............................................... 33
Table 8: Sanofi, Global, Major Products, Revenue ($m), 2013 ................................................................... 40
Table 9: Sanofi, Global, Late-stage Pipeline, 2015 .................................................................................... 41
Table 10: GlaxoSmithKline, Global, Major Products, Revenue ($bn) and Annual Growth (%), 2014 ............. 48
Table 11: Pharmaceutical Market, Global, Late-Stage Pipeline, GlaxoSmithKline, 2014 .............................. 49
Table 12: Major Products, China Chemical and Pharmaceutical Co., 2013 .................................................. 60
Table 13: Medical Device Market, Taiwan, Revenue ($bn), 2008–2013 ....................................................... 65
Table 14: Medical Device Market, Taiwan, Revenue Forecast ($bn), 2014–2020 ........................................ 66
Table 15: Medical Device Market, Taiwan, Nephrology and Urology Device Market ($m), 2008–2013 ......... 68
Table 16: Medical Device Market, Taiwan, Nephrology and Urology Device Market, Sales Trend for Major
Players, 2012 .............................................................................................................................. 68
Table 17: Medical Device Market, Taiwan, Ophthalmic Device Market ($m), 2008–2013 ............................. 70
Table 18: Medical Device Market, Taiwan, Ophthalmic Device Market, Sales Trend for Major Players, 2012
................................................................................................................................................... 70
Table 19: Medical Device Market, Taiwan, In Vitro Diagnostics Device Market ($m), 2008–2013 ................. 72
Healthcare, Regulatory and Reimbursement Landscape – Republic of China (Taiwan) 11 © GlobalData. This report is a licensed product and is not to be copied, reproduced, shared or resold in any form.
Table of Contents
HEALTHCARE, REGULATORY AND REIMBURSEMENT LANDSCAPE – REPUBLIC OF CHINA (TAIWAN)
Table 20: Medical Device Market, Taiwan, In Vitro Diagnostics Device Market, Sales Trend for Major
Players, 2012 .............................................................................................................................. 72
Table 21: Medical Device Market, Taiwan, Cardiovascular Device Market ($m), 2008–2013 ....................... 74
Table 22: Medical Device Market, Taiwan, Cardiovascular Device Market, Sales Trend for Major Players,
2012............................................................................................................................................ 74
Table 23: Medical Device Market, Taiwan, Orthopedic Device Market ($m), 2008–2013 .............................. 76
Table 24: Medical Device Market, Taiwan, Orthopedic Device Market, Sales Trend for Major Players, 2012 76
Table 25: Medical Device Market, Taiwan, Diagnostic Market, Revenue ($bn), 2008–2013 ......................... 77
Table 26: Medical Device Market, Taiwan, Diagnostic Market, Revenue ($bn), 2014–2020 ......................... 78
Table 27: Major Products, Baxter International, Global, Revenue, 2014 ...................................................... 79
Table 28: Major Products, Fresenius Medical Care, 2014 ............................................................................ 86
Table 29: Major Products, Medtronic, 2014 ............................................................................................... 103
Table 30: Healthcare System, Taiwan, NHI Premium Formulas, 2014 ....................................................... 119
Table 31: Healthcare System, Taiwan, Basic Outpatient Care Co-payments, 2014 .................................... 120
Table 32: Healthcare System, Taiwan, Basic Outpatient Care Co-payments, 2014 .................................... 121
Table 33: Healthcare Spending, Taiwan, Out-of-Pocket Expenditure (%), 2008–2013 ............................... 122
Table 34: Price of Prescription Drugs, Taiwan, Price Trend in Healthcare Services (%), 2008–2013 .......... 123
Table 35: Healthcare System, Taiwan, Registration Fee Structure for New Drug Application ($), 2014 ...... 130
Table 36: Healthcare System, Taiwan, Regulatory Requirement for Medical Devices, 2013 ...................... 131
Table 37: Market Access, Taiwan, Schedule of Patent Fees, 2014 ............................................................ 139
Table 38: Market Access, Taiwan, Schedule of Trademark Fees, 2014 ..................................................... 140
Table 39: Economic Indicators, Taiwan, Gross Domestic Product per Capita ($), 2008–2013 .................... 151
Table 40: Economic Indicators, Taiwan, Gross Domestic Product per Capita Forecast ($), 2014–2020 ..... 152
Table 41: Economic Indicators, Taiwan, Gross Domestic Product Annual Growth (%), 2008–2013 ............ 153
Healthcare, Regulatory and Reimbursement Landscape – Republic of China (Taiwan) 12 © GlobalData. This report is a licensed product and is not to be copied, reproduced, shared or resold in any form.
Table of Contents
HEALTHCARE, REGULATORY AND REIMBURSEMENT LANDSCAPE – REPUBLIC OF CHINA (TAIWAN)
Table 42: Economic Indicators, Taiwan, Gross Domestic Product Annual Growth Forecast (%), 2014–2020
................................................................................................................................................. 154
Table 43: Economic Indicators, Taiwan, National Income per Capita ($), 2008–2013 ................................ 155
Table 44: Economic Indicators, Taiwan, Average Consumer Price Index, 2008–2013 ............................... 156
Table 45: Economic Indicators, Taiwan, Average Consumer Price Index Forecast, 2014–2020 ................. 157
Table 46: Economic Indicators, Taiwan, Average Consumer Price Annual Change (%), 2008–2013 .......... 158
Table 47: Economic Indicators, Taiwan, Currency Exchange Rate (TWD/$), 2008–2013 ........................... 159
Table 48: Economic Indicators, Taiwan, Foreign Direct Investment ($bn), 2008–2013 ............................... 161
Table 49: Economic Indicators, Taiwan, Foreign Exchange Reserves ($bn), 2008–2013 ........................... 162
Table 50: Economic Indicators, Taiwan, Imports of Goods and Services ($bn), 2008–2013 ....................... 163
Table 51: Economic Indicators, Taiwan, Exports of Goods and Services ($bn), 2008–2013 ....................... 165
Table 52: Economic Indicators, Taiwan, Government Structural Balance ($bn), 2008–2013 ...................... 166
Table 53: Economic Indicators, Taiwan, General Government Gross Debt (% of GDP), 2008–2013 .......... 167
Table 54: Economic Indicators, Taiwan, General Government Gross Debt Forecast (% of GDP), 2014–2020
................................................................................................................................................. 168
Table 55: Economic Indicators, Taiwan, Major Industries, Gross Domestic Product by Industry ($bn), 2013
................................................................................................................................................. 170
Table 56: Demographics, Taiwan, Population (million), 2008–2013 ........................................................... 171
Table 57: Demographics, Taiwan, Population Forecast (million), 2014–2020 ............................................. 172
Table 58: Demographics, Taiwan, Urban-Rural Population (%), 2008–2013 .............................................. 173
Table 59: Demographics, Taiwan, Population Distribution by Age Group (%), 2008–2013 ......................... 175
Table 60: Demographics, Taiwan, Population Distribution by Age Group Forecast (%), 2014–2020 ........... 175
Table 61: Demographics, Taiwan, Births (per 1,000 population), 2008–2013 ............................................. 177
Table 62: Demographics, Taiwan, Mortality (per 1,000 population), 2008–2013 ........................................ 178
Table 63: Demographics, Taiwan, Major Causes of Mortality (per 100,000 population), 2013 .................... 179
Healthcare, Regulatory and Reimbursement Landscape – Republic of China (Taiwan) 13 © GlobalData. This report is a licensed product and is not to be copied, reproduced, shared or resold in any form.
Table of Contents
HEALTHCARE, REGULATORY AND REIMBURSEMENT LANDSCAPE – REPUBLIC OF CHINA (TAIWAN)
Table 64: Demographics, Taiwan, Children under Five, Infant Mortality Rate (per 1,000 live births), 2008–
2013.......................................................................................................................................... 180
Table 65: Demographics, Taiwan, Immunization Rate (%), 2013 ............................................................... 182
Table 66: Demographics, Taiwan, Gender Ratio (M/F), 2008–2013 ........................................................... 184
Table 67: Demographics, Taiwan, Life Expectancy at Birth (years), 2008–2013 ........................................ 185
Table 68: Demographics, Taiwan, Student Net Enrollment by Level of Education (%), 2013 ...................... 187
Table 69: Demographics, Taiwan, Unemployment Rate (%), 2008–2013................................................... 188
Table 70: Demographics, Taiwan, Employment by Sector (‘000), 2013 ..................................................... 190
Table 71: Demographics, Taiwan, Personal Health Expenditure by Disease (%), 2013.............................. 191
Table 72: Healthcare Infrastructure, Taiwan, Hospitals, 2008–2013 .......................................................... 192
Table 73: Healthcare Infrastructure, Taiwan, Public and Private Hospitals, 2008–2013 ............................. 193
Table 74: Healthcare Infrastructure, Taiwan, Public Hospitals, Share by Ownership, 2013 ........................ 194
Table 75: Healthcare Infrastructure, Taiwan, Private Hospitals, Share by Ownership, 2013 ....................... 195
Table 76: Healthcare Infrastructure, Taiwan, Hospitals by Standard of Care, Contracted by NHIA, 2008–2013
................................................................................................................................................. 196
Table 77: Healthcare Infrastructure, Taiwan, Hospitals by Services Rendered, 2013 ................................. 197
Table 78: Healthcare Infrastructure, Taiwan, Beds by Type of Hospital, 2008–2013 .................................. 198
Table 79: Healthcare Infrastructure, Taiwan, Beds by Specialty Care, 2013 .............................................. 200
Table 80: Healthcare Infrastructure, Taiwan, Diagnostic Equipment, 2008–2013 ....................................... 201
Table 81: Healthcare Infrastructure, Taiwan, Hospital Beds (per 1,000 population), 2008–2013 ................ 202
Table 82: Healthcare Infrastructure, Taiwan, Doctors (per 1,000 population), 2008–2013 .......................... 203
Table 83: Healthcare Infrastructure, Taiwan, PM10 (µgm/m3), 2008–2013 ................................................ 205
Table 84: Healthcare Infrastructure, Taiwan, CO2 emissions (million tons), 2008–2013 ............................. 207
Table 85: Healthcare Infrastructure, Taiwan, Nurses (per 1,000 population), 2008–2013 ........................... 208
Table 86: Healthcare Infrastructure, Taiwan, Pharmacists (per 1,000 population), 2008–2013 ................... 209

Healthcare, Regulatory and Reimbursement Landscape – Republic of China (Taiwan) 14 © GlobalData. This report is a licensed product and is not to be copied, reproduced, shared or resold in any form.
Table of Contents
HEALTHCARE, REGULATORY AND REIMBURSEMENT LANDSCAPE – REPUBLIC OF CHINA (TAIWAN)
Table 87: Healthcare Infrastructure, Taiwan, Dentists (per 1,000 population), 2008–2013 ......................... 210
Table 88: Healthcare Expenditure, Taiwan, Healthcare Expenditure (% of GDP), 2008–2013 .................... 212
Table 89: Healthcare Expenditure, Taiwan, Primary Healthcare Expenditure, Current Health Expenditure by
Provider (%), 2011 .................................................................................................................... 213
Table 90: Healthcare Expenditure, Taiwan, Primary Healthcare Expenditure, Current Health Expenditure by
Mode of Production (%), 2011 ................................................................................................... 214
Table 91: Healthcare Expenditure, Taiwan, Healthcare Expenditure, Public-Private Share (%), 2008–2013
................................................................................................................................................. 215
Table 92: Healthcare Expenditure, Taiwan, Pharmaceutical R&D Expenditure, 2008–2013 ....................... 216
Table 93: Healthcare Expenditure, Taiwan, Major Healthcare Trade Fairs, 2015 ....................................... 218
1.2 List of Figures
Figure 1: Pharmaceutical Market, Taiwan, Revenue ($bn), 2008–2013 ...................................................... 22
Figure 2: Pharmaceutical Market, Taiwan, Revenue Forecast ($bn), 2014–2020 ........................................ 23
Figure 3: Pharmaceutical Market, Taiwan, Exports and Imports ($bn), 2008–2013 ..................................... 24
Figure 4: Pharmaceutical Market, Taiwan, Market Segments of Newly Emerging Biotech Industry by Share
(%), 2009 .................................................................................................................................... 27
Figure 5: Medical Device Market, Taiwan, Revenue ($bn), 2008–2013 ....................................................... 65
Figure 6: Medical Device Market, Taiwan, Revenue Forecast ($bn), 2014–2020 ........................................ 66
Figure 7: Medical Device Market, Taiwan, Nephrology and Urology Device Market ($m), 2008–2013 ......... 67
Figure 8: Medical Device Market, Taiwan, Nephrology and Urology Device Market, Sales Trend for Major
Players ($m), 2008–2012 ............................................................................................................ 68
Figure 9: Medical Device Market, Taiwan, Ophthalmic Device Market ($m), 2008–2013 ............................. 69
Figure 10: Medical Device Market, Taiwan, Ophthalmic Device Market, Sales Trend for Major Players ($m),
2008–2012 .................................................................................................................................. 70
Figure 11: Medical Device Market, Taiwan, In Vitro Diagnostics Device Market ($m), 2008–2013 ................. 71
Healthcare, Regulatory and Reimbursement Landscape – Republic of China (Taiwan) 15 © GlobalData. This report is a licensed product and is not to be copied, reproduced, shared or resold in any form.
Table of Contents
HEALTHCARE, REGULATORY AND REIMBURSEMENT LANDSCAPE – REPUBLIC OF CHINA (TAIWAN)
Figure 12: Medical Device Market, Taiwan, In Vitro Diagnostics Device Market, Sales Trend for Major Players
($m), 2008–2012 ......................................................................................................................... 72
Figure 13: Medical Device Market, Taiwan, Cardiovascular Device Market ($m), 2008–2013 ....................... 73
Figure 14: Medical Device Market, Taiwan, Cardiovascular Device Market, Sales Trend for Major Players
($m), 2008–2012 ......................................................................................................................... 74
Figure 15: Medical Device Market, Taiwan, Orthopedic Device Market ($m), 2008–2013 .............................. 75
Figure 16: Medical Device Market, Taiwan, Orthopedic Device Market, Sales Trend for Major Players ($m),
2008–2012 .................................................................................................................................. 76
Figure 17: Medical Device Market, Taiwan, Diagnostic Market, Revenue ($m), 2008–2013 .......................... 77
Figure 18: Medical Device Market, Taiwan, Diagnostic Market, Revenue ($bn), 2014–2020 ......................... 78
Figure 19: Healthcare Market, Taiwan, Drivers and Barriers, 2014 ............................................................. 110
Figure 20: Healthcare System, Taiwan, Financial Flow in Healthcare System, 2014 ................................... 113
Figure 21: Healthcare System, Taiwan, Evolution of Healthcare System, 2014 ........................................... 114
Figure 22: Healthcare System, Taiwan, Reimbursement Process, 2013 ..................................................... 116
Figure 23: Market Access, Taiwan, Process for Coverage and Reimbursement of Medical Devices, 2013 .. 117
Figure 24: Healthcare System, Taiwan, Premium Collection under Second-Generation NHI System, 2014 . 119
Figure 25: Healthcare Spending, Taiwan, Out-of-Pocket Expenditure (%), 2008–2013 ............................... 122
Figure 26: Price of Prescription Drugs, Taiwan, Price Trend in Healthcare Services (%), 2008–2013 .......... 123
Figure 27: Market Access, Taiwan, Organization Structure of Center for Drug Evaluation, 2014 ................. 126
Figure 28: Market Access, Taiwan, Marketing Authorization Procedure for New Drug, 2014 ....................... 128
Figure 29: Market Access, Taiwan, New Drug Evaluation Process, 2014 .................................................... 129
Figure 30: Market Access, Taiwan, HTA Process for New Drug Listing Application with the NHIA, 2014 ..... 130
Figure 31: Market Access, Taiwan, Marketing Authorization Procedure for Medical Devices, 2013 ............. 134
Figure 32: Market Access, Taiwan, Clinical Trial Regulation Process for an Investigational New Drug, 2014
................................................................................................................................................. 142
Healthcare, Regulatory and Reimbursement Landscape – Republic of China (Taiwan) 16 © GlobalData. This report is a licensed product and is not to be copied, reproduced, shared or resold in any form.
Table of Contents
HEALTHCARE, REGULATORY AND REIMBURSEMENT LANDSCAPE – REPUBLIC OF CHINA (TAIWAN)
Figure 33: Economic Indicators, Taiwan, Gross Domestic Product per Capita ($), 2008–2013 .................... 151
Figure 34: Economic Indicators, Taiwan, Gross Domestic Product per Capita Forecast ($), 2014–2020 ..... 152
Figure 35: Economic Indicators, Taiwan, GDP Annual Growth (%), 2008–2013 .......................................... 153
Figure 36: Economic Indicators, Taiwan, Gross Domestic Product Annual Growth Forecast (%), 2014–2020
................................................................................................................................................. 154
Figure 37: Economic Indicators, Taiwan, National Income per Capita ($), 2008–2013 ................................ 155
Figure 38: Economic Indicators, Taiwan, Average Consumer Price Index, 2008–2013 ............................... 156
Figure 39: Economic Indicators, Taiwan, Average Consumer Price Index Forecast, 2014–2020 ................. 157
Figure 40: Economic Indicators, Taiwan, Average Consumer Price Annual Change (%), 2008–2013 .......... 158
Figure 41: Economic Indicators, Taiwan, Currency Exchange Rate (TWD/$), 2008–2013 ........................... 159
Figure 42: Economic Indicators, Taiwan, Foreign Direct Investment ($bn), 2008–2013 ............................... 161
Figure 43: Economic Indicators, Taiwan, Foreign Exchange Reserves ($bn), 2008–2013 ........................... 162
Figure 44: Economic Indicators, Taiwan, Imports of Goods and Services ($bn), 2008–2013 ....................... 163
Figure 45: Economic Indicators, Taiwan, Exports of Goods and Services ($bn), 2008–2013 ....................... 165
Figure 46: Economic Indicators, Taiwan, Government Structural Balance ($bn), 2008–2013 ...................... 166
Figure 47: Economic Indicators, Taiwan, General Government Gross Debt (% of GDP), 2008–2013 .......... 167
Figure 48: Economic Indicators, Taiwan, General Government Gross Debt Forecast (% of GDP), 2014–2020
................................................................................................................................................. 168
Figure 49: Economic Indicators, Taiwan, Major Industries, Gross Domestic Product by Industry ($bn), 2013
................................................................................................................................................. 169
Figure 50: Demographics, Taiwan, Population (million), 2008–2013 ........................................................... 171
Figure 51: Demographics, Taiwan, Population Forecast (million), 2014–2020 ............................................. 172
Figure 52: Demographics, Taiwan, Urban-Rural Population (%), 2008–2013 .............................................. 173
Figure 53: Demographics, Taiwan, Population Distribution by Age Group (%), 2008–2013 ......................... 174
Figure 54: Demographics, Taiwan, Population Distribution by Age Group Forecast (%), 2014–2020 ........... 175
Healthcare, Regulatory and Reimbursement Landscape – Republic of China (Taiwan) 17 © GlobalData. This report is a licensed product and is not to be copied, reproduced, shared or resold in any form.
Table of Contents
HEALTHCARE, REGULATORY AND REIMBURSEMENT LANDSCAPE – REPUBLIC OF CHINA (TAIWAN)
Figure 55: Demographics, Taiwan, Births (per 1,000 population), 2008–2013 ............................................. 176
Figure 56: Demographics, Taiwan, Mortality (per 1,000 population), 2008–2013 ........................................ 177
Figure 57: Demographics, Taiwan, Major Causes of Mortality (per 100,000 population), 2013 .................... 178
Figure 58: Demographics, Taiwan, Children under Five, Infant Mortality Rate (per 1,000 live births), 2008–
2013.......................................................................................................................................... 180
Figure 59: Demographics, Taiwan, Immunization Rate (%), 2013 ............................................................... 182
Figure 60: Demographics, Taiwan, Gender Ratio (M/F), 2008–2013 ........................................................... 183
Figure 61: Demographics, Taiwan, Life Expectancy at Birth (years), 2008–2013 ........................................ 185
Figure 62: Demographics, Taiwan, Student Net Enrollment by Level of Education (%), 2013 ...................... 187
Figure 63: Demographics, Taiwan, Unemployment Rate (%), 2008–2013................................................... 188
Figure 64: Demographics, Taiwan, Employment by Sector (‘000), 2013 ..................................................... 189
Figure 65: Demographics, Taiwan, Personal Health Expenditure by Disease (%), 2013.............................. 190
Figure 66: Healthcare Infrastructure, Taiwan, Hospitals, 2008–2013 .......................................................... 192
Figure 67: Healthcare Infrastructure, Taiwan, Public and Private Hospitals, 2008–2013 ............................. 193
Figure 68: Healthcare Infrastructure, Taiwan, Public Hospitals, Share by Ownership (%), 2013 .................. 194
Figure 69: Healthcare Infrastructure, Taiwan, Private Hospitals, Share by Ownership (%), 2013................. 195
Figure 70: Healthcare Infrastructure, Taiwan, Hospitals by Standard of Care, Contracted by NHIA, 2008–2013
................................................................................................................................................. 196
Figure 71: Healthcare Infrastructure, Taiwan, Hospitals by Services Rendered (%), 2013 ........................... 197
Figure 72: Healthcare Infrastructure, Taiwan, Beds by Type of Hospital, 2008–2013 .................................. 198
Figure 73: Healthcare Infrastructure, Taiwan, Beds by Specialty Care, 2013 .............................................. 199
Figure 74: Healthcare Infrastructure, Taiwan, Diagnostic Equipment, 2008–2013 ....................................... 201
Figure 75: Healthcare Infrastructure, Taiwan, Hospital Beds (per 1,000 population), 2008–2013 ................ 202
Figure 76: Healthcare Infrastructure, Taiwan, Doctors (per 1,000 population), 2008–2013 .......................... 203
Figure 77: Healthcare Infrastructure, Taiwan, PM10 (µgm/m3), 2008–2013 ................................................ 205
Healthcare, Regulatory and Reimbursement Landscape – Republic of China (Taiwan) 18 © GlobalData. This report is a licensed product and is not to be copied, reproduced, shared or resold in any form.
Table of Contents
HEALTHCARE, REGULATORY AND REIMBURSEMENT LANDSCAPE – REPUBLIC OF CHINA (TAIWAN)
Figure 78: Healthcare Infrastructure, Taiwan, CO2 emissions (million tons), 2008–2013 ............................. 206
Figure 79: Healthcare Infrastructure, Taiwan, Nurses (per 1,000 population), 2008–2013 ........................... 208
Figure 80: Healthcare Infrastructure, Taiwan, Pharmacists (per 1,000 population), 2008–2013 ................... 209
Figure 81: Healthcare Infrastructure, Taiwan, Dentists (per 1,000 population), 2008–2013 ......................... 210
Figure 82: Healthcare Expenditure, Taiwan, Healthcare Expenditure (% of GDP), 2008–2013 .................... 211
Figure 83: Healthcare Expenditure, Taiwan, Primary Healthcare Expenditure, Current Health Expenditure by
Provider (%), 2011 .................................................................................................................... 212
Figure 84: Healthcare Expenditure, Taiwan, Primary Healthcare Expenditure, Current Health Expenditure by
Mode of Production (%), 2011 ................................................................................................... 213
Figure 85: Healthcare Expenditure, Taiwan, Healthcare Expenditure, Public-Private Share (%), 2008–2013
................................................................................................................................................. 215
.Figure 86: Healthcare Expenditure, Taiwan, Pharmaceutical R&D Expenditure ($m), 2008–2013 ............... 216
Figure 87: Healthcare Market, Taiwan, Opportunities and Challenges, 2014 .............................................. 221

Healthcare, Regulatory and Reimbursement Landscape – Republic of China (Taiwan) 19 © GlobalData. This report is a licensed product and is not to be copied, reproduced, shared or resold in any form.
HEALTHCARE, REGULATORY AND REIMBURSEMENT LANDSCAPE – REPUBLIC OF CHINA (TAIWAN)
Introduction
2 Introduction
2.1 GlobalData Report Guidance
The chapter begins with an executive summary, which gives an overview of the Taiwan’s
healthcare market and the key driving factors. It also gives a snapshot of the demographic,
regulatory, and reimbursement landscape, and the healthcare infrastructure.
Chapter three provides an overview of Taiwan’s pharmaceutical and medical device markets,
covering size; generic, Over-the-Counter (OTC) and biologic/biosimilar product shares; and the
key drivers and barriers. It also includes profiles of the major players, as well as SWOT
assessments.
Chapter four covers the reimbursement and payer landscape, and includes details of the
reimbursement process, insurance providers, pricing policies and drug price trends in Taiwan.
It also looks at the regulatory landscape, and gives an overview of the regulatory agencies and
approval processes for new drugs and medical devices. Also covered is the licensing process
for the manufacture, export and import of pharmaceuticals; regulations for pharmaceutical
advertising, labeling, packaging and clinical trials; and an overview of intellectual property
rights.
Chapter five provides detailed analysis of the political and economic environment in Taiwan,
and analyses economic indicators, demographics, and healthcare infrastructure and
expenditure.
Chapter six provides an overview of the opportunities for and challenges to growth in Taiwan’s
healthcare market.
Healthcare, Regulatory and Reimbursement Landscape – Republic of China (Taiwan) 193 © GlobalData. This report is a licensed product and is not to be copied, reproduced, shared or resold in any form.
Country Analysis
HEALTHCARE, REGULATORY AND REIMBURSEMENT LANDSCAPE – REPUBLIC OF CHINA (TAIWAN)
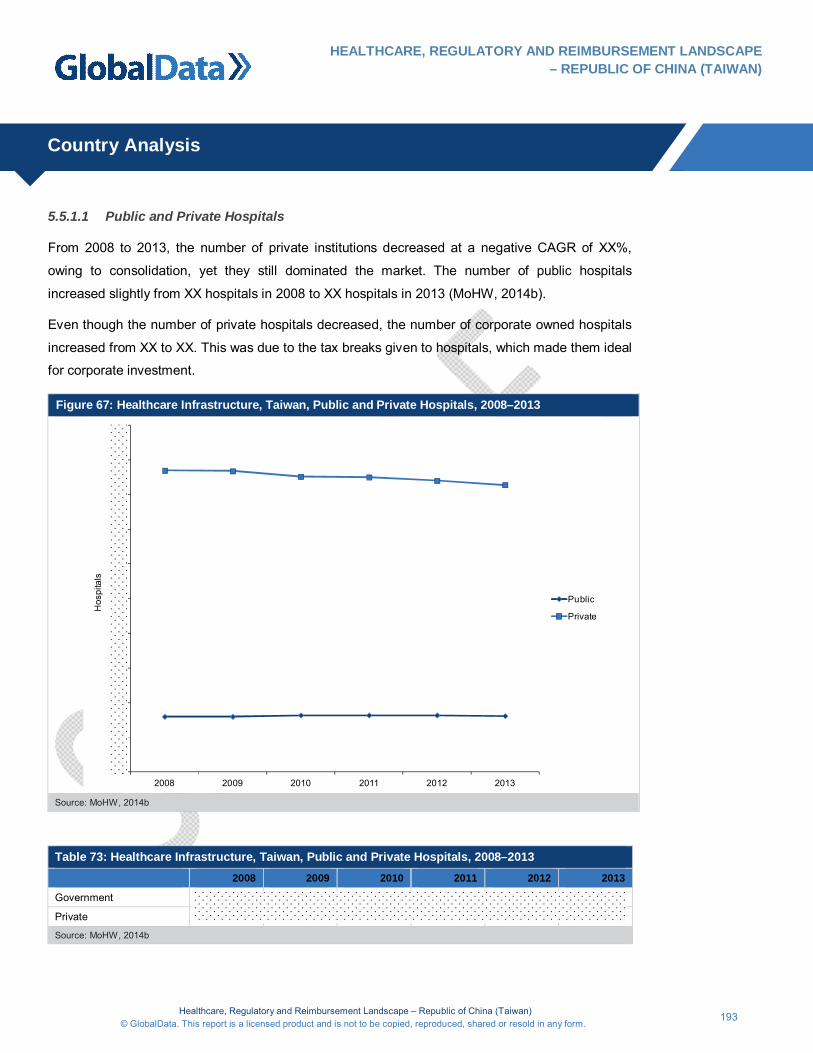
5.5.1.1 Public and Private Hospitals
From 2008 to 2013, the number of private institutions decreased at a negative CAGR of XX%,
owing to consolidation, yet they still dominated the market. The number of public hospitals
increased slightly from XX hospitals in 2008 to XX hospitals in 2013 (MoHW, 2014b).
Even though the number of private hospitals decreased, the number of corporate owned hospitals
increased from XX to XX. This was due to the tax breaks given to hospitals, which made them ideal
for corporate investment.
Figure 67: Healthcare Infrastructure, Taiwan, Public and Private Hospitals, 2008–2013
2008 2009 2010 2011 2012 2013
Hos
pita
ls
Public
Private
Source: MoHW, 2014b
Table 73: Healthcare Infrastructure, Taiwan, Public and Private Hospitals, 2008–2013 2008 2009 2010 2011 2012 2013
Government
Private
Source: MoHW, 2014b
Healthcare, Regulatory and Reimbursement Landscape – Republic of China (Taiwan) 194 © GlobalData. This report is a licensed product and is not to be copied, reproduced, shared or resold in any form.
Country Analysis
HEALTHCARE, REGULATORY AND REIMBURSEMENT LANDSCAPE – REPUBLIC OF CHINA (TAIWAN)
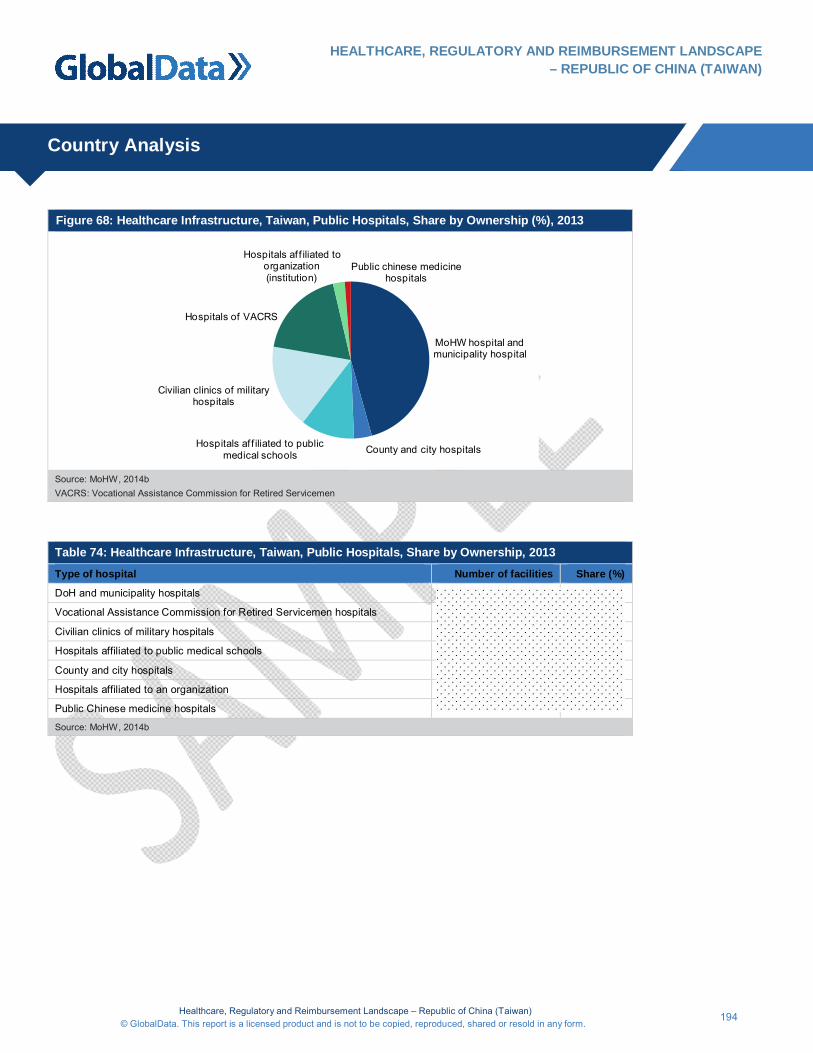
Figure 68: Healthcare Infrastructure, Taiwan, Public Hospitals, Share by Ownership (%), 2013
MoHW hospital and municipality hospital
County and city hospitalsHospitals af f iliated to public medical schools
Civilian clinics of military hospitals
Hospitals of VACRS
Hospitals af f iliated to organization (institution)
Public chinese medicine hospitals
Source: MoHW, 2014b VACRS: Vocational Assistance Commission for Retired Servicemen
Table 74: Healthcare Infrastructure, Taiwan, Public Hospitals, Share by Ownership, 2013
Type of hospital Number of facilities Share (%)
DoH and municipality hospitals
Vocational Assistance Commission for Retired Servicemen hospitals
Civilian clinics of military hospitals
Hospitals affiliated to public medical schools
County and city hospitals
Hospitals affiliated to an organization
Public Chinese medicine hospitals
Source: MoHW, 2014b
Healthcare, Regulatory and Reimbursement Landscape – Republic of China (Taiwan) 222 © GlobalData. This report is a licensed product and is not to be copied, reproduced, shared or resold in any form.
Appendix
HEALTHCARE, REGULATORY AND REIMBURSEMENT LANDSCAPE – REPUBLIC OF CHINA (TAIWAN)
7 Appendix
7.1 Abbreviations
µgm/m3: micrograms per cubic meter
5in1: DTaP-Hib-IPV
AC: Advisory Committee
ANDA: Abbreviated New Drug Application
API: Active Pharmaceutical Ingredients
ASEAN: Association of Southeast Asian Nations
BACE: Beta Secretase
BNHI: Bureau of NHI
BOPA: Bureau of Pharmaceutical Affairs
CAGR: Compound Annual Growth Rate
CCPC: China Chemical & Pharmaceutical Co.
CDE: Center for Drug Evaluation
CDI: Clostridium Difficile Infection
cGMP: Current Good Manufacturing Practice
CKD: Chronic Kidney Disease
CMO: Contract Manufacturing Outsourcing
CNS: Central Nervous System
CE: Conformité Européenne
COPD: Chronic Obstructive Pulmonary Disease
CPI: Consumer Price Index
CRAMS: Contract Research and Manufacturing Services
CRL: Complete Response Letter
Healthcare, Regulatory and Reimbursement Landscape – Republic of China (Taiwan) 223 © GlobalData. This report is a licensed product and is not to be copied, reproduced, shared or resold in any form.
Appendix
HEALTHCARE, REGULATORY AND REIMBURSEMENT LANDSCAPE – REPUBLIC OF CHINA (TAIWAN)
CRO: Contract Research Outsourcing
CT: Computed Tomography
DBC: Drug Benefit Committee
DET: Drug Expenditure Target
DoH: Department of Health
DP: Doctors-to-Population
DPP: Democratic Progressive Party
ECFA: Economic Cooperation Framework Agreement
EMA: European Medicines Agency EMA
EMAP: Emerging Markets Asia-Pacific
EPA: Environmental Protection Administration
ESRD: End-Stage Renal Disease
FDA: Food and Drug Administration
FDI: Foreign Direct Investments
Forex: Foreign exchange
FEPZ Free Economic Pilot Zones
GCP: Good Clinical Practice
GCRC: General Clinical Research Center
GDP: Gross Domestic Product
GMP: Good Manufacturing Practice
HBP: Hospital-Beds-to-Population
HPA Health Promotion Agency
HepB: Hepatitis B vaccine
HIV: Human Immunodeficiency Virus

Healthcare, Regulatory and Reimbursement Landscape – Republic of China (Taiwan) 224 © GlobalData. This report is a licensed product and is not to be copied, reproduced, shared or resold in any form.
Appendix
HEALTHCARE, REGULATORY AND REIMBURSEMENT LANDSCAPE – REPUBLIC OF CHINA (TAIWAN)
HTA: Health Technology Assessment
ICD: Implantable Cardioverter-Defibrillators
IDEA: International Design Excellence Awards
IDSA: Industrial Designers Society of America
IMF: International Monetary Fund
iMPRO: Integrated Medicinal Products Review Office
IPR : Intellectual Property Right
IRB: Institutional Review Boards
IVD: In Vitro Diagnostics
JE: Japan Encephalitis vaccine
JIRB: Joint Institutional Review Boards
KMT: Nationalist Party (Kuomintang)
LIS: Laboratory Information System
MMR: Measles, Mumps and Rubella combination vaccine
MoHW: Ministry of Health and Welfare
MRI: Magnetic Resonance Imaging
NCE: New Chemical Entity
NDA: New Drug Application
NHE: National Health Expenditure
NHI: National Health Insurance
NHIA: National Health Insurance Administration
NRPB: National Research Program for Biopharmaceuticals
OECD: Organization for Economic Co-operation and Development
OTC: Over-the-Counter
Healthcare, Regulatory and Reimbursement Landscape – Republic of China (Taiwan) 225 © GlobalData. This report is a licensed product and is not to be copied, reproduced, shared or resold in any form.
Appendix
HEALTHCARE, REGULATORY AND REIMBURSEMENT LANDSCAPE – REPUBLIC OF CHINA (TAIWAN)
PACS: Picture Archiving Communication Systems
PM10: Particulate Matter with an aerodynamic diameter of less than 10 micrometers
PET) Positron Emission Tomography
PMF: Plant Master Files
PUD: Peptic Ulcer Disease
QSD: Quality Systems Documentation
R&D: Research and Development
ROC: Republic of China
CDC Taiwan Center for Disease Control
TCM: Traditional Chinese Medicine
TEPA: Taiwan Environmental Protection Agency
TFDA: Taiwan Food and Drug Administration
TGPA: Taiwan Generic Pharmaceutical Association
TIPO: Taiwan Intellectual Property Office
UNFCCC: United Nations Framework Convention on Climate Change
UNICEF: United Nations Children’s Fund
VACRS: Vocational Assistance Commission for Retired Servicemen
VAR: Varicella vaccine
WTO: World Trade Organization
YSP: Yung Shin Pharmaceutical
Healthcare, Regulatory and Reimbursement Landscape – Republic of China (Taiwan) 226 © GlobalData. This report is a licensed product and is not to be copied, reproduced, shared or resold in any form.
Appendix
HEALTHCARE, REGULATORY AND REIMBURSEMENT LANDSCAPE – REPUBLIC OF CHINA (TAIWAN)
7.2 Bibliography
10times (2015). Medical and pharmaceutical trade shows in Taiwan. 10times. Available from:
http://10times.com/taiwan/medical-pharma [Accessed on April 22, 2015]
Baxter (2014). Baxter 10k filings. Baxter. Available from:
http://www.baxter.com/downloads/investors/reports_and_financials/annual_report/2014/2014_
baxter_form10-K.pdf
CBC (2015). Monthly Releases: Foreign Exchange Reserves. Central Bank of the Republic of
China (Taiwan). Available from: http://www.cbc.gov.tw/ct.asp?xItem=1866&ctNode=511&mp=2
[Accessed on April 21, 2015]
CCPC (2014). China Chemical & Pharmaceutical company info. China Chemical &
Pharmaceutical. Available from:
http://www.ccpc.com.tw/english/01_person/02_detail.aspx?MID2=25 [Accessed on May 13,
2015]
CDC (2014). Annual report 2013–2014. Center for Disease Control. Available from:
http://www.cdc.gov.tw/uploads/files/201408/533702a2-eedd-40da-8570-c2e15369825d.pdf
CDE (2014a). Organization. Center for Drug Evaluation. Available from:
http://www.cde.org.tw/English/Pages/Organization.aspx [Accessed on May 6, 2015]
CDE (2014b). Drug Review and Registration Guideline. Center for Drug Evaluation. Available
from: http://www.cde.org.tw/eng/drugs/ [Accessed on May 6, 2015]
CDE (2014c). Fee schedule for the application of examination and registration of
pharmaceuticals and medical equipment. Center for Drug Evaluation. Available from:
http://www2.cde.org.tw/English/Regulations/Pages/Drug%20Registration.aspx [Accessed on
May 6, 2015]
CDE (2014d). Guideline for Registration of Medical Devices. Center for Drug Evaluation.
Available from: http://www2.cde.org.tw/English/Regulations/SubLink/Document%2014.pdf
CDE (2014e). Guideline for Good Clinical Practice. Center for Drug Evaluation. Available from:
http://www2.cde.org.tw/English/Regulations/SubLink/Document%2015.pdf [Accessed on May
6, 2015].
Healthcare, Regulatory and Reimbursement Landscape – Republic of China (Taiwan) 239 © GlobalData. This report is a licensed product and is not to be copied, reproduced, shared or resold in any form.
Appendix
HEALTHCARE, REGULATORY AND REIMBURSEMENT LANDSCAPE – REPUBLIC OF CHINA (TAIWAN)
7.3 Research Methodology
GlobalData’s dedicated research and analysis teams consist of experienced professionals with
advanced statistical expertise and marketing, market research and consulting backgrounds in the
pharmaceutical industry.
GlobalData adheres to the codes of practice of the Market Research Society (www.mrs.org.uk) and
Strategic and Competitive Intelligence Professionals (www.scip.org).
All GlobalData databases are continuously updated and revised. The following research
methodology is followed for all databases and reports.
7.3.1 Coverage
The objective of updating GlobalData’s coverage is to ensure that it represents the most up-to-date
vision of the industry possible.
Changes to the industry taxonomy are built on the basis of extensive research of company,
association and competitor sources.
Company coverage is based on three key factors: revenue; products; and media attention,
innovation and market potential.
The estimated revenue of all major companies, including private and governmental, are
gathered and used to prioritize coverage.
Companies that are making the news or are of particular interest due to their innovative
approach are prioritized.
GlobalData aims to cover all major news events and deals in the pharmaceutical industry, updated
on a daily basis.
The coverage is further streamlined and strengthened with additional input from GlobalData’s
expert panel (see below).

Healthcare, Regulatory and Reimbursement Landscape – Republic of China (Taiwan) 240 © GlobalData. This report is a licensed product and is not to be copied, reproduced, shared or resold in any form.
Appendix
HEALTHCARE, REGULATORY AND REIMBURSEMENT LANDSCAPE – REPUBLIC OF CHINA (TAIWAN)
7.3.2 Secondary Research
The research process begins with extensive secondary research using internal and external
sources to gather qualitative and quantitative information relating to each market.
The secondary research sources that are typically referred to include, but are not limited to:
Company websites, annual reports, financial reports, broker reports, investor presentations and
SEC filings
Industry trade journals, scientific journals and other technical literature
Internal proprietary databases
Relevant patent and regulatory databases
National government documents, statistical databases and market reports
Procedure registries
News articles, press releases and web-casts specific to the companies operating in the market
The CountryFocus reports are largely based on secondary research and use reliable and
authoritative sources such as the IMF, the World Bank, OECD, WHO, UNICEF, UNStats, BEA,
MHLW and NHS, among others.
7.3.3 Forecasts
The CountryFocus reports use the data available from the secondary sources to forecast and
validate the future trends for a country’s healthcare market, as well as parameters related to the
economy and healthcare infrastructure and expenditure.
7.3.4 Expert Panel
GlobalData uses a panel of experts to cross-verify its databases and forecasts.
GlobalData’s expert panel comprises marketing managers, product specialists, international sales
managers from pharmaceutical companies, academics from research universities, consultants from
venture capital funds, and distributors/suppliers of pharmaceuticals and supplies.
Historic data and forecasts are relayed to GlobalData’s expert panel and adjusted in accordance
with their feedback.
Healthcare, Regulatory and Reimbursement Landscape – Republic of China (Taiwan) 241 © GlobalData. This report is a licensed product and is not to be copied, reproduced, shared or resold in any form.
Appendix
HEALTHCARE, REGULATORY AND REIMBURSEMENT LANDSCAPE – REPUBLIC OF CHINA (TAIWAN)
7.4 Disclaimer
All Rights Reserved.
No part of this publication may be reproduced, stored in a retrieval system or transmitted in any
form by any means, electronic, mechanical, photocopying, recording or otherwise, without the prior
permission of the publisher, GlobalData.