healthcare: products & supplies to analyze a medical device company ... healthcare: products...
TRANSCRIPT

Current Environment ............................................................................................ 1
Industry Profile .................................................................................................... 18
Industry Trends ................................................................................................... 19
How the Industry Operates ............................................................................... 38
Key Industry Ratios and Statistics ................................................................... 46
How to Analyze a Medical Device Company ................................................. 47
Glossary ................................................................................................................ 51
Industry References ........................................................................................... 53
Comparative Company Analysis ...................................................................... 55
This issue updates the one dated August 9, 2012. The next update of this Survey is scheduled for August 2013.
Industry Surveys Healthcare: Products & Supplies Phillip M. Seligman, Healthcare Equipment & Supplies Equity Analyst
JANUARY 2013
CONTACTS:
INQUIRIES & CLIENT RELATIONS 800.852.1641 clientrelations@ standardandpoors.com
SALES 877.219.1247 [email protected]
MEDIA Michael Privitera 212.438.6679 michael_privitera@ standardandpoors.com
S&P CAPITAL IQ 55 Water Street New York, NY 10041

Topics Covered by Industry Surveys
Aerospace & Defense Airlines Alcoholic Beverages & Tobacco Apparel & Footwear:
Retailers & Brands Autos & Auto Parts Banking Biotechnology Broadcasting, Cable & Satellite Chemicals Communications Equipment Computers: Commercial Services Computers: Consumer Services &
the Internet Computers: Hardware Computers: Software Computers: Storage & Peripherals Electric Utilities
Environmental & Waste ManagementFinancial Services: Diversified Foods & Nonalcoholic Beverages Healthcare: Facilities Healthcare: Managed Care Healthcare: Products & Supplies Heavy Equipment & Trucks Homebuilding Household Durables Household Nondurables Industrial Machinery Insurance: Life & Health Insurance: Property-Casualty Investment Services Lodging & Gaming Metals: Industrial Movies & Entertainment
Natural Gas Distribution Oil & Gas: Equipment & Services Oil & Gas: Production & Marketing Paper & Forest Products Pharmaceuticals Publishing & Advertising Real Estate Investment Trusts Restaurants Retailing: General Retailing: Specialty Semiconductor Equipment Semiconductors Supermarkets & Drugstores Telecommunications: Wireless Telecommunications: Wireline Thrifts & Mortgage Finance Transportation: Commercial
Global Industry Surveys
Airlines: Asia Autos & Auto Parts: Europe Banking: Europe Food Retail: Europe
Foods & Beverages: EuropeMedia: Europe Oil & Gas: Europe Pharmaceuticals: Europe
Telecommunications: Asia Telecommunications: Europe Tobacco: Europe
S&P Capital IQ Industry Surveys 55 Water Street, New York, NY 10041
EXECUTIVE EDITOR: EILEEN M. BOSSONG-MARTINES ASSOCIATE EDITOR: CHARLES MACVEIGH STATISTICIAN: SALLY KATHRYN NUTTALL
CLIENT SUPPORT: 1-800-523-4534. ISSN 0196-4666.
VISIT THE S&P CAPITAL IQ WEBSITE: www.spcapitaliq.com
S&P CAPITAL IQ INDUSTRY SURVEYS (ISSN 0196-4666) is published weekly. Reproduction in whole or in part (including inputting into a computer) prohibited except by permission of S&P Capital IQ. To learn more about Industry Surveys and the S&P Capital IQ product offering, please contact our Product Specialist team at 1-877-219-1247 or visit getmarketscope.com. Executive and Editorial Office: S&P Capital IQ, 55 Water Street, New York, NY 10041. Officers of The McGraw-Hill Companies, Inc.: Harold McGraw III, Chairman, President, and Chief Executive Officer; Jack F. Callahan, Jr., Executive Vice President and Chief Financial Officer; John Berisford, Executive Vice President, Human Resources; D. Edward Smyth, Executive Vice President, Corporate Affairs; Charles L. Teschner, Jr., Executive Vice President, Global Strategy; and Kenneth M. Vittor, Executive Vice President and General Counsel. Information has been obtained by S&P Capital IQ INDUSTRY SURVEYS from sources believed to be reliable. However, because of the possibility of human or mechanical error by our sources, INDUSTRY SURVEYS, or others, INDUSTRY SURVEYS does not guarantee the accuracy, adequacy, or completeness of any information and is not responsible for any errors or omissions or for the results obtained from the use of such information.
Copyright © 2013 Standard & Poor’s Financial Services LLC, a subsidiary of The McGraw-Hill Companies, Inc. All rights reserved. STANDARD & POOR’S, S&P, S&P 500, S&P MIDCAP 400, and S&P SMALLCAP 600 are registered trademarks of Standard & Poor’s Financial Services LLC.

INDUSTRY SURVEYS HEALTHCARE: PRODUCTS & SUPPLIES / JANUARY 2013 1
CURRENT ENVIRONMENT
With healthcare reform in focus, fundamentals stabilize, visibility improves
Continued economic weakness, along with high unemployment rates in the US and the European Union (EU), continue to crimp the growth prospects for medical device companies. However, with the healthcare reform bill signed into law in March 2010, S&P Capital IQ believes visibility for the group is improving, as investors gain some clarity on the extent to which the industry will be involved in the reform process.
We believe that, while the high level of unemployment caused by the recession has resulted in lower hospital inpatient and outpatient utilization and higher hospital uncompensated care costs, hospital capital
expenditures (capex), now near historic lows, may have touched bottom. The drop in hospital capex had resulted in a slowing in demand for the medical devices industry. We believe demand has begun to improve selectively for devices that hospitals use to drive volume and that provide a relatively high return on investment. However, unit demand in certain categories—such as cardiac rhythm management (primarily implantable cardioverter defibrillators, or ICDs, and pacemakers), and hip and knee implants—have not held up in the US, albeit for different reasons. Meanwhile, based on the quarterly results reported by medical device companies up to the time this Survey went to press in late January 2013, procedure rates in the EU have continued to remain soft, with only mild signs of stabilization in countries such as the UK, Germany, and France as of the third quarter of 2012. In addition, we still see pressure on those devices used for elective medical procedures, such as cosmetic surgery. The medical devices industry has begun to rely increasingly on other international markets, particularly emerging countries, to compensate for sluggish US and EU growth.
Favorable global demographic trends, such as aging populations, more active seniors, and an expanding middle class in emerging markets, has supported this highly diversified industry. We also note generally positive patient outcome data relative to competing pharmaceutical treatment options across many major therapeutic
categories, and strong patent protection relative to branded pharmaceuticals. In addition, healthcare reform in the US promises to bring insurance coverage to millions of people who currently do not have it, thereby expanding the potential domestic customer base.
Chart H06: THE UNEMPLOYMENT SITUATION
Chart ManagH01: THE UNINSURED POPULATION IN THE US
12
13
14
15
16
17
30
35
40
45
50
55
2001 02 03 04 05 06 07 08 09 10 2011
THE UNINSURED POPULATION IN THE US
Number of uninsured (millions, left scale)
Percent of total population (right scale)
Source: US Census Bureau.
(1,250)
(1,000)
(750)
(500)
(250)
0
250
5004
5
6
7
8
9
10
11
2008 2009 2010 2011 2012
Net change in nonfarm employees (thousands, right scale)
Unemployment rate (%, left scale)
THE UNEMPLOYMENT SITUATION
Source: US Bureau of Labor Statistics.
(Inverted scale, thousands)(%)

2 HEALTHCARE: PRODUCTS & SUPPLIES / JANUARY 2013 INDUSTRY SURVEYS
We believe these benefits outweigh the pressures medical device companies will face in coming years. These pressures include increased scrutiny and a lengthier product approval process by the US Food & Drug Administration (FDA); an excise tax enacted to support US healthcare reform measures; and the likelihood of intensified competition among various therapies, partly as a result of the growing role of comparative effectiveness research. Further, the absence of a permanent tax credit for research and development (R&D) initiatives, in our view, can worsen conditions for the medical devices industry, which relies heavily on such activities to spur its growth.
Overall, S&P Capital IQ has a neutral outlook for the medical devices industry. We continue to view many product categories as historically recession-resistant, and we expect they will continue to grow, albeit more slowly than they did prior to the recent recession. This view of industry performance is not necessarily contrary to the findings of a survey released in June 2012 by Axendia Inc., a research and consulting firm focused on the life sciences and healthcare markets. Axendia surveyed 125 medical technology executives representing 89 different companies in 16 countries. A majority of the survey respondents (91%) expect strong annual growth in the medical technology industry in the next three years, with 88% expecting increased sales in emerging markets and 69% expecting increased sales in developed markets. This is a longer time horizon than S&P Capital IQ uses for its projections, and we think these forecasts may come to fruition due to demographic trends and assuming the macroeconomic crises impacting both sides of the Atlantic Ocean dissipate in that time. In addition, 65% of the survey respondents see the global regulatory environment as the top business threat over the next three years.
Meanwhile, we see a scarcity of life-altering new products coming out of R&D, such as ICDs and cardiac stents, which spurred industry growth over the past decade. Although we see products that will help expand existing categories (such as second-generation, bio-absorbable drug-coated stents, cardiac resynchronization therapy defibrillators, or CRT-Ds, and transcatheter aortic valves), we have seen little in the way of new products that would be considered revolutionary. In April 2012, the Advanced Medical Technology Association (AdvaMed), the medical device industry trade association, announced a strategic three-year plan to help the US medical devices industry maintain its competitive edge and encourage innovation. The key objectives of the plan include the following: strengthen AdvaMed’s presence in emerging markets such as Brazil, India, and China; build its own in-house research capability; focus its resources on important policy issues; and improve communication with, and among, member companies of AdvaMed and patient groups.
The US unemployment rate stood at 7.8% in December 2012, down from 8.5% in December 2011. (Standard & Poor’s Economics, which operates separately from S&P Capital IQ, believes this measure peaked at 10.1% in October 2009.) We expect the industry to continue to face a difficult but modestly improving macroeconomic environment in 2013 and afterward. While we continue to expect these conditions to lead to elongated capital equipment procurement cycles, additional deferrals of nonessential equipment, and reduced spending on add-on features, we see hospitals spending in areas where they can differentiate themselves from competitors. We also look for healthcare products and supplies companies to see a continuation of the pricing pressures seen over the last several years, as the macroeconomic factors described contribute to slower sales growth.
Amid such headwinds as the slowdown in surgical procedure growth in the mature US and Western European markets, the new excise tax, the absence of a permanent R&D tax credit, and a slow regulatory process, we think that the industry is turning to emerging markets (such as China and India) to continue its growth.
IN RESPONSE TO HEALTHCARE NEEDS, HEALTHCARE REFORM ARRIVES
Despite the tremendous amount of resources it devotes to healthcare, the US ranks among the lowest in the industrialized world in terms of access to healthcare for its citizens. Moreover, even with the expansion of Medicare, Medicaid, the Children’s Health Insurance Plan, and other private and government programs, the percentage of uninsured has remained stubbornly high since 2002. The US Census Bureau reported that the percentage of people covered by private health insurance has continued to decline, falling to 63.9% in 2011 from 64.0% in 2010, 64.5% in 2009, and 67.5% in 2008. Furthermore, although Standard & Poor’s Economics in January 2013 projected that the unemployment rate would decline to 6.9% by the fourth

INDUSTRY SURVEYS HEALTHCARE: PRODUCTS & SUPPLIES / JANUARY 2013 3
quarter of 2013, we note that employment does not guarantee the availability of health insurance. Indeed, many small businesses have dropped health insurance coverage during the recession and afterward, most likely due to untenable insurance premium price hikes. According to the Census Bureau, the number of uninsured, however, decreased in 2011 to 48.6 million (15.7% of the population), from 50.0 million (16.3%) in 2010. We believe this drop was due partly to the healthcare reform law.
Healthcare reform, as defined by the Patient Protection and Affordable Care Act (PPACA; H.R. 3590; now more commonly referred to as the ACA), which was signed into law by President Obama on March 23, 2010, will require most US citizens and legal residents to have minimum essential health insurance coverage. (Accompanying that bill was the Health Care and Education Reconciliation Act of 2010, or H.R. 4872, which was signed into law on March 30, 2010; its primary focus was to provide financing mechanisms to cover most of the healthcare reform costs.) The nonpartisan Congressional Budget Office (CBO), a research arm of Congress, has estimated the cost of the ACA at $1.168 trillion over the 2012–22 period.
Republican critics attempted to roll back some or all of the healthcare reform law both through legislation and in the courts. Several appeals courts gave various rulings on the law’s validity. On November 14, 2011, the US Supreme Court agreed to hear an Obama administration appeal defending the law, as well as two separate appeals by 26 states and an independent business group challenging the constitutionality of the law. On June 28, 2012, the US Supreme Court’s ruling on the healthcare reform kept intact all but one of the insurance reforms of the ACA (noting that states are not required to expand Medicaid eligibility).
The new device excise tax To help finance healthcare reform, the ACA introduced a number of new fees and taxes for almost everyone in the healthcare continuum, including manufacturers, providers, and even citizens and legal residents who choose not to acquire health insurance. For the medical device group, there is a 2.3% excise tax on sales of most kinds of supplies and equipment sold in the US. The tax takes effect on January 1, 2013, and is expected to generate up to $29 billion over the subsequent 10 years. Excluded from this tax are certain kinds of medical devices (such as eyeglasses, contact lenses, and hearing aids) that the FDA classifies as devices generally sold directly to the public for individual use, and all products sold outside of the US. In December 2012, the US Internal Revenue Service (IRS) issued its final regulations regarding the excise tax.
According to a survey of 190 financial executives in medical device firms, which was conducted by the audit, tax, and advisory firm KPMG LLP in March 2012, 40% of the respondents said that their companies were already planning such actions as price increases and cost reductions (such as downsizing the workforce and changing manufacturing processes) to stay competitive. Moreover, 61% said that the medical device tax would hurt their company’s bottom line.
S&P Capital IQ (S&P) believes that the 2013 start date gave the industry time to take the actions needed to realign its cost structure to diffuse the tax’s impact on future profitability. The industry also benefited from the levy being an excise tax, which is deductible for income tax purposes and should yield a net rate of about 1.5% (assuming a 35% income tax rate). One big player, Stryker Corp., estimates that the new excise tax will cost it about $100 million in 2013, while another, Medtronic Inc., sees the tax costing it $125 million–$175 million a year. However, we believe the levy will have the greatest impact on small and mid-sized companies, particularly those developing new technologies (and thus having relatively high R&D expenses as a percentage of revenues) and those deriving most of their sales in the US. We would not be surprised if the tax leads to more acquisitions of smaller firms by the medical device giants.
Over the last few years, several of the larger device companies have begun to reduce their costs in anticipation of the tax, although we think that many of these cost-reduction activities would have occurred eventually in order to help earnings.
� In August 2012, St. Jude Medical Inc. announced a restructuring plan under which the company will realign its product divisions into two new operating units and will lay off around 300 employees, thereby saving $50 million–$60 million annually starting in 2013, which is about the same amount that the company expects to pay for the new excise tax. However, according to an 8-K government filing in November, the company has initiated additional workforce reductions, seeking to eliminate 500 more

4 HEALTHCARE: PRODUCTS & SUPPLIES / JANUARY 2013 INDUSTRY SURVEYS
positions; it did not delineate the expected savings. Consequently, we cannot attribute all of its planned restructuring efforts toward offsetting the tax.
� In July 2012, Medtronic laid off 500 employees and announced plans to lay off another 500 by the end of fiscal 2013 (ending April 2013), which it estimated would save about $125 million a year. However, the company is looking to add staff to work in the faster-growing emerging markets.
� In March 2012, Zimmer Holdings Inc. announced layoffs at its Warsaw (Indiana) headquarters, part of its plan to offset the entire burden posed by the impending tax through cost-cutting efforts aimed at finding $400 million in cost savings before 2016 and to pay for an estimated $60 million tax bill in 2013.
� In November 2011, Stryker announced plans to cut about 1,000 jobs (5% of its workforce) and to restructure operations to save more than $100 million by 2013 to allow for the impact of the tax.
Other medical device makers are placing their expansion plans on hold, given the pressure to save costs to prepare for the excise tax. For example, Cook Medical Inc., a Bloomington, Indiana–based medical device maker, announced in July 2012 that it had cancelled plans to open five new manufacturing plants in the Midwest over the next five years. The company estimated the tax would cost $20 million–$30 million annually.
Let the sunshine in The Physician Payment Sunshine Act (Sunshine Act), first introduced in 2007 and included as a provision in the ACA, requires medical device and pharmaceutical manufacturers to disclose payments or gifts of $10 or more as of January 1, 2012. (The date was subsequently delayed to January 1, 2013, as discussed below.) Drug and device makers covered by Medicare, Medicaid, and CHIP must report gifts made to physicians and teaching hospitals. The information will be posted on a public Department of Health & Human Services website starting on September 20, 2013, and will include the amount and nature of each payment, the date it was made, and the recipient. Knowingly failing to submit payment information will result in a fine of $10,000 to $100,000 for each omitted payment, up to $1 million per year.
Many medical, consumer, and industry groups—such as the Medicare Payment Advisory Commission (MedPAC), an independent Congressional agency, and the Institute of Medicine (IOM), an independent, nonprofit organization—believe the legislation will bring greater transparency to the financial relationships between health professionals and teaching hospitals, and the pharmaceutical and medical device companies. The industry at large believes that the law should not only require a disclosure of the payments, but should also ask for the reasons for such payments.
In December 2011, the Centers for Medicare and Medicaid Services (CMS), the arm of the US Department of Health and Human Services (HHS) responsible for Medicare and Medicaid, released the proposed rule on the Sunshine Act. On May 3, 2012, the CMS announced a delay in implementation of the Sunshine Act. It said that data collection from manufacturers would not begin until January 1, 2013, stating that the additional time would help the industry prepare for submission of the required information. On November 27, 2012, the CMS sent the final rule on the Sunshine Act to the Office of Management and Budget (OMB) for review. The final rule was scheduled to be issued within 90 days. Meanwhile, several healthcare advocacy groups, including the AARP (American Association of Retired Persons) and the AFL-CIO (American Federation of Labor and Congress of Industrial Organizations), have sent letters to the White House and OMB, pressing them to issue the regulations.
UNRELENTING PRICING PRESSURE
Since the onset of the recent recession, as hospitals have looked to control capital expenditures and as overall industry demand has softened in response to both macroeconomic and industry factors, the medical device sector has faced increasing pricing pressure. We expect additional pricing pressure to come from some areas: declines in the rate of reimbursement for medical supplies and equipment that some providers (particularly acute-care hospitals) will experience; hospitals’ increasing acquisitions of physicians’ practices, which could shift control of product choice from the physician to the hospital; and hospitals’ reducing the number of vendors with which they do business. Nonetheless, we expect the impacts from pricing pressures

INDUSTRY SURVEYS HEALTHCARE: PRODUCTS & SUPPLIES / JANUARY 2013 5
and the aforementioned excise tax to be more than offset by companies’ focus on improving administrative cost control, and the increase in coverage and utilization of services by those previously uninsured.
Cardiovascular: more competition in stents We believe pricing pressure, particularly in the drug-eluting stent (DES) market, reflects a number of factors:
� Increased competition. The XIENCE DES stent (from Abbott Laboratories) and the private-label PROMUS (Boston Scientific), both approved in July 2008, demonstrated superior restenosis rates compared with existing stents (ENDEAVOR from Medtronic Inc. and Cypher from Johnson & Johnson). We believe the latter two companies were forced to cut prices and seek volume deals. With Cypher sales continuing to decline, J&J exited the DES market at the end of 2011.
� Hospital purchasing changes. The desire to leverage purchasing power and contain supply costs have spurred hospitals to seek preferred provider contracts or deploy standardized purchasing initiatives.
� Declining DES volumes between 2006 and early 2008. We believe price competition intensified for the reduced volumes available and estimate that pricing declined in the high single-digits each year from 2008 to 2011.
However, in its three quarterly earnings calls in 2012 (in April, July, and October), Boston Scientific indicated that it saw signs of stabilization in the US DES market and an easing of pricing pressures. The company also has been introducing new products in the category and has been working on its DES pipeline. It had plans to commence the EVOLVE II clinical trial (to assess the SYNERGY stent system) by the end of 2012. Meanwhile, a New York Times blog reported in October 2012 that a number of leading vascular physicians have criticized the overuse of carotid stents. Some of the surgeons commented on the tendency among doctors to use stents to treat patients with high blood pressure and cholesterol. Such patients should be treated with drugs as the use of stents heightens the chances of a heart attack or stroke in patients with no stroke symptoms originally.
We think long-term growth in worldwide volumes will stabilize in the flat to low-single-digit growth range going forward, partly because the risks involved in using a DES versus bare-metal stent (BMS) for percutaneous coronary intervention (PCI) remain uncertain. Moreover, there are concerns about the overuse of either DES or BMS. A study published in the July 6, 2011, issue of the Journal of the American Medical Association, and cited by Reuters, found that stenting procedures were inappropriate for the 12% of US patients (or one in eight) who have non-emergency procedures to clear blocked arteries. In fact, researchers found that more than one-half of the inappropriate procedures were performed on patients without any symptoms of heart disease. A study published July 11, 2011, in the Archives of Internal Medicine found that the controversial use of stents days after a heart attack has continued unabated, despite a major study funded by the US Department of Veterans Affairs and published in March 2007. This study, known by the acronym COURAGE, found that the combination of percutaneous coronary intervention (PCI) plus stenting and optimal medical therapy (drugs) is no better than optimal medical therapy alone at preventing heart attacks in patients with stable coronary disease. (PCI—previously called angioplasty, percutaneous transluminal coronary, or balloon angioplasty—is a procedure that threads a thin tube or catheter through blood vessels leading to the heart in order to clear them and relieve pain from angina. A stent may or may not be used following PCI.)
However, a more recent study conducted by a multi-institutional team that analyzed data from 1.5 million PCI procedures included in the National Cardiovascular Data Registry (NCDR) CathPCI Registry and published on July 10, 2012, in the Archives of Internal Medicine came to several conclusions. The study found that DES use was prevalent, even among patients at low risk for restenosis; there was a significant variation in the rate of DES use by physicians; and there was risk in the need for patients to take anticlotting medications for at least a year, as complications could occur if the medications were ended early. The authors noted that DESs are effective in reducing restenosis and the benefits are greatest in patients at the highest risk of target vessel revascularization (TVR; a procedure to unblock or bypass a clogged artery when a patient experiences a recurrence of symptoms). However, DES cost more than BMS, and requires prolonged dual antiplatelet therapy (the use of anticlotting medications), which increases costs. Hence, the authors stated, “the reduction of DES use among patients at low risk for restenosis was projected to be

6 HEALTHCARE: PRODUCTS & SUPPLIES / JANUARY 2013 INDUSTRY SURVEYS
associated with substantial cost savings with only a small increase in TVR events.” They projected that a 50% reduction in the use of DES in low-TVR-risk patients would reduce healthcare expenditures by about $205 billion a year in the US, while increasing the overall TVR event rate by 0.5%.
ICDs: slower growth In the implantable cardioverter defibrillator (ICD) market, following the Medtronic and Guidant ICD recalls between 2005 and 2007, volume growth rates declined from approximately 20% to the low single digits. We believe the market experienced price declines of 1%–2% in 2008, as volumes continued to remain soft, in part reflecting residual concerns by both doctors and patients about product safety due to recalls related to defibrillator lead wires. We believe that pricing deteriorated by this rate again in 2009, and worsened in 2010 and 2011, as clinicians adopted a more conservative approach in their practice of implanting ICDs.
In any event, we note that these trends are an approximation, reflecting the average of each company’s experience in the ICD market. Medtronic, for example, said in February 2010 that a year earlier, it was experiencing price declines of 50 to 100 basis points (0.5%–1.0%); however, in November 2010 and again in February 2011, the company reported that it was seeing mid-single-digit price declines in the US. In May 2011, Medtronic said that its pricing stabilized in the April 2011 quarter for the first time in seven quarters, which it attributes to an ICD product line launched in the quarter. However, in November 2011, in its fiscal 2012 second-quarter earnings call, the company said that it had been seeing mid-single-digit price declines in its US market. Further, in its fiscal 2013 second-quarter earnings call in November 2012, the company said that ICD implant rates are stabilizing, with the US ICD market witnessing relatively stable sequential growth in the second quarter. In January 2011, US researchers reported cases of unnecessary implantations among patients, following which the US Department of Justice (DOJ) started an investigation of ICD procedures. In September 2012, the DOJ announced a new method to expedite its current investigation under which it has asked hospitals to assess each ICD case from October 1, 2003 in light of the reimbursement guidelines issued in the CMS’s 2005 National Coverage Decision (NCD) for Implantable Automatic Defibrillators. A number of hospitals subject to the DOJ probe are at risk to face damages under the False Claims Act.
Frost & Sullivan, a market research firm, had previously forecast a compound annual growth rate (CAGR) of nearly 17% for CRT-Ds (cardiac resynchronization therapy defibrillators) between 2005 and 2011. CRT-Ds are similar to standard ICDs, but have an additional lead (wire) on the left ventricle to make the heart pump in a coordinated way. However, expectations have shifted downward because the ICD subsector experienced an abrupt slowdown in 2006 as a result of major product recalls. In addition, the subsector declined in late 2010 and early 2011, mainly due to the DOJ probe mentioned above. Indeed, while Frost & Sullivan also saw the US ICD market growing from $4.3 billion in 2010 to about $5.0 billion in 2015 (reflecting a 4.0% CAGR), it projected that all of the growth would be from the sale of CRT-Ds, which it estimated to account for 45% of the ICD market. In contrast, it expected US sales of standard ICDs (55% of the global ICD market) to show no growth and possibly continue to decline over the period to 2015. Previously, ICDs, which shock hearts with abnormal heart rhythms into beating normally, had enjoyed annual worldwide growth of roughly 20% a year.
Within the cardiac rhythm management market, the global market for pacemakers has been strong, aided by development in design and technology, according to market intelligence company Transparency Market Research, thus compensating for the drop in the demand for defibrillators. For instance, in its fiscal 2013 second quarter (ended October 2012), Medtronic gained share in international markets through the launch of its Advisa MRI pacemaker, designed for safe access to MRI (magnetic resonance imaging, a type of diagnostic imaging) in Japan. The company expected to launch the device in the US in fiscal 2014.
Orthopedics: slower growth in hip, knee replacements Orthopedic device makers are experiencing slower growth in the number of hip and knee replacement procedures in the US. According to Novation, a group purchasing organization, the joint market grew by only 3.2% in 2010 (latest available), after growing 5.3% in 2009. We attribute this trend mainly to still-high unemployment, following the 2007–09 recession, and the accompanying loss of health insurance

INDUSTRY SURVEYS HEALTHCARE: PRODUCTS & SUPPLIES / JANUARY 2013 7
coverage, as well as increased cost-sharing required by the health insurance policies of those still covered. In addition, health insurers may be showing increased resistance to procedures they deem pricey and, in many cases, unnecessary. We would expect these factors to exacerbate competition among device makers and lead to further downward price pressure for their products. Nevertheless, in conference calls and interviews, companies continue to say that the pricing pressure in the orthopedics arena is no different than it had been before the recession. However, we believe the competition remains very high in the knee and hip implant markets. Indeed, we see indications that companies have been facing pricing pressure for the past few years from the legal, regulatory, and market fronts, and do not see this easing in the foreseeable future.
To counter the pricing pressure, companies have sought innovative ways to meet customer needs, including the development of new technologies, biomaterials, and minimally invasive surgical techniques. In addition, many continue to attempt to develop close relations with orthopedic surgeons, though the US government deemed some of these relationships illegal, based on the federal anti-kickback statute. Following an investigation that started in March 2005, many of the financial ties between surgeons and device makers (including consulting arrangements and other inducements) were suspended as a result of settlements between five leading orthopedic device manufacturers and the US Department of Justice (DOJ). In 2007, these orthopedic device makers—Biomet Inc., DePuy (a division of Johnson & Johnson), Smith & Nephew plc, Stryker Corp., and Zimmer Holdings Inc.—agreed to pay $311 million to settle DOJ claims that they paid kickbacks to surgeons in exchange for exclusively using their products.
The aforementioned settlement did not ban all consulting relationships or those wherein the device maker manufactures and markets devices invented by surgeons. The federal prosecutors deferred criminal charges against the companies and required them to disclose the consulting agreements, put payment amounts in their corporate websites, and allow federal monitors to see these activities. According to a report released in October 2011 by the Archives of Internal Medicine, a bimonthly medical journal, 939 orthopedic surgeons received 1,041 payments totaling $198 million in 2007, the year of the settlement. In 2008, there were 568 payments to 526 surgeons amounting to $119 million, plus $109 million in royalty buyouts from Zimmer.
According to a study published in the November/December 2008 issue of Health Affairs, patent data and the American Medical Association Physician Masterfile database provide evidence that physicians contribute to medical device innovation, accounting for almost 20% of about 26,000 medical device patents filed in the US from 1990 to 1996. While device makers suspended certain payments to surgeons, hospitals have begun to benefit from the relationships between their surgeons and the device makers, sometimes in the form of price discounts, according to a May 16, 2008, article in the San Francisco Business Times.
Hospitals seek best prices Meanwhile, hospitals have become more active in attempting to elicit the best prices from device makers. Partly in response to individual hospitals paying different prices for devices that were functionally the same and vendors insisting in their contracts that the hospitals not reveal pricing information (other than to hospitals in the same hospital system), hospitals within the same system have begun to work together to negotiate prices with device makers.
According to Pulse of the Industry: Medical Technology Report 2011, from the accounting and consulting firm Ernst & Young (E&Y), the medical devices industry is facing a highly challenging environment owing to the reimbursement scenario in developed markets. Payers are requesting that medical device companies show how their products improve health outcomes in order to bring greater value for the users. According to the 2010 issue of the same report, some providers have formed joint ventures to share expensive technologies, such as CT scan equipment, within a geographic region. Kaiser Permanente, a large, not-for-profit hospital system, uses teams of surgeons to evaluate devices. We believe other hospital systems have adopted these practices or similar ones. In addition, we see hospitals considering limiting vendor choice, which could give them some leverage over the vendors, while possibly allowing them to obtain quantity discounts. We also see these practices spreading to more facilities as a result of hospital-chain consolidation, a trend that hospitals believe helps them gain economies of scale to function better under healthcare reform. However, according to the 2012 issue of the same report, while prices have remained a priority, hospitals are increasingly putting more stress on value than their costs. Further, according to a report released by the

8 HEALTHCARE: PRODUCTS & SUPPLIES / JANUARY 2013 INDUSTRY SURVEYS
Boston Consulting Group in October 2012, medical device makers will have to revise their sales strategies to focus on the emerging bulk-buying concept being utilized by purchasing groups and accountable care organizations (ACOs). (ACOs are a form of healthcare organization in which provider reimbursements are tied to quality metrics and a reduction in the total cost of care. Hospitals, as well as physician practice groups, can qualify as ACOs.) According to the report, the emphasis would shift from minor improvements in medical devices to value-based purchases where larger groups of buyers would buy devices in higher volumes.
According to a report released by the US Government Accountability Office (GAO) in January 2012, some hospitals may not be in a strong bargaining position when it comes to a closed group of companies manufacturing certain kinds of implantable medical devices (IMDs). The report further points out that the absence of price transparency and considerable difference in the prices paid for the same IMD by different hospitals suggests that hospitals may not be obtaining the best prices. According to the report, hospital expenditures on IMD procedures grew 4.3% per annum from $16.1 billion in 2004 to $19.8 billion in 2009, which is the same rate of growth for Medicare spending for other hospital procedures.
Amid the controversy surrounding the rising cost of healthcare, the medical devices industry has been attempting to show that it is not the primary cause. According to a study conducted by AdvaMed, spending on medical devices has moved up negligibly from 5.3% to 6% of national health expenditures between 1989 and 2010, with most of the growth occurring between 1989 and 1992. As to price data, the study found the CPI for Medical Care Services to be 5% over that period and the CPI for Medical Care to be 4.7%, while, in comparison, the CPI has been 2.7% and device and diagnostic prices have increased at an annual average rate of 1%.
S&P believes that hospitals play an important role in limiting the impact of medical device costs on the overall rising cost of healthcare. According to a Reuters article dated November 29, 2011, hospitals are increasingly targeting expensive orthopedic and cardiac devices. The article also noted that hospitals are working closely with their physicians, meeting regularly to discuss brand preferences and encouraging lower-priced products that are shown to be equally effective. Some hospitals also use vendor-managed inventory, which means that the devices on their shelves are not paid for until they are used. S&P believes the increasing hiring of physicians by hospital groups will give hospitals greater leverage in their price negotiations with medical device companies.
Even as hospitals are taking measures to curb their spending on devices, hospital costs are rising. The GAO study released in January 2012 (mentioned above) suggested that there was a significant variation in the prices paid by different hospitals for cardiac devices. For example, for a particular automated implantable cardioverter defibrillator (AICD) model, the difference between the highest and the lowest reported price paid by hospitals was as high as $8,723, while for another model, the difference amounted to $6,844. The median cost for the four defibrillator models fell in the range of $16,445 to $19,007. The study identified the growing influence of physicians on hospitals’ purchasing decisions as one of the main factors leading to such high disparity in the prices hospitals pay for devices. Although physicians do not directly participate in price negotiations with suppliers, they might be inclined to buy a specific model or device by a specific manufacturer, which in turn might lead to different physicians working in the same hospital who prefer different devices. This is an obstacle to hospitals getting discounts from manufacturers for bulk purchases, thus lowering their bargaining power. The report also noted that the confidential nature of negotiations between hospitals and device manufacturers adds to the lack of transparency.
Looking ahead, S&P expects comparative effectiveness research (discussed in more detail below) will increasingly be used and will likely include pricing as a determinant for what products offer the best cost efficiency. This means that manufacturers, including both orthopedic and cardiology device makers, will have to be aware of pricing in product design and marketing, and will be required to show that their newer, higher-priced products yield superior results compared with existing technologies.

INDUSTRY SURVEYS HEALTHCARE: PRODUCTS & SUPPLIES / JANUARY 2013 9
OUTLAYS FOR HIGH-PRICED EQUIPMENT RECOVERING, BUT STILL DOWN SIGNIFICANTLY
Reflecting a deteriorating operating environment, rising levels of bad debt, and tighter capital markets, US hospitals have dramatically reduced purchases of high-priced capital equipment that, because of reduced reimbursement and stricter limitations on their use by the government and private payers, do not assure a reasonably quick return on investment. Such big-ticket items include the newer ultra-high-field-strength MRI and premium performance CT diagnostic imaging systems, robotic-assisted systems for surgery and endovascular catheterization, and radiation oncology systems.
In our view, hospitals are carefully evaluating both maintenance and upgrade capital expenditures in terms of return on investment and, given tighter capital budgets, must find clear justification before undertaking such multimillion-dollar investments. Even when industry conditions spur manufacturers to discount such items, price tags nevertheless remain high. Smaller-ticket items—such as patient monitors, which are vital to operating rooms, emergency rooms, and critical care units, as well as blood analyzers and portable ultrasound imaging devices—had also experienced lower sales amid spending cuts by US hospitals.
Nonetheless, some medical equipment and supplies manufacturers reported a small pick-up in hospital purchasing starting in 2010, which we believe is a result of pent-up demand, the replacement of older products, and technological advances that make certain new products more efficacious and cost effective, and provide a high return on investment. For example, Varian Medical Systems Inc., a leading maker of radiation-oncology equipment, reported strong demand for its new TrueBeam system for image-guided radiotherapy and radiosurgery. In its fiscal 2012 fourth-quarter conference call (in October 2012), the company said that the TrueBeam system accounted for over 50% of the high-energy machine orders received by the company in the quarter. In all, the company has received more than 645 orders for TrueBeam since the product’s launch two years earlier. Indeed, according to a June 2012 report by market research company MarketsandMarkets, the global radiotherapy devices market was valued at $4.4 billion in 2011 and is expected to reach $5.8 billion by 2016, at a CAGR of 5.3%. Intuitive Surgical Inc. has reported similarly high demand for its da Vinci robotic surgical systems: the company sold 150 in its 2012 second quarter (versus 129 in the same quarter last year), and 155 in the third quarter (versus 133). The company also said that it expected the volume of da Vinci procedures to grow 24% in 2012 from 2011.
Although none of the small capital equipment companies under S&P’s analytical coverage has highlighted pricing pressures in the US, we believe some manufacturers are discounting in order to reach sales targets. Others, while not actually discounting, are offering newer products with additional features, capabilities, and/or power, but are asking for only modestly higher prices, so buyers perceive they are receiving greater value. In this period of more-cautious hospital capital spending, we expect sales of small-ticket capital equipment, particularly items deemed by providers as vital, to remain relatively more active (albeit at a modest pace) than sales of big-ticket equipment, and to recover faster as hospitals strengthen financially.
In international markets, medical capital equipment makers have been realizing higher sales, but both large- and small-ticket items sold there typically have lower price tags than they would in the US. The reason is that healthcare providers in those markets are primarily government-run or -subsidized and thus seek to limit the rise in their healthcare costs. In our view, pricing practices in the US and overseas have been in place for many years and did not visibly change amid the economic downturn. Nevertheless, we believe healthcare reform and comparative effectiveness research will likely intensify price and feature competition.
A STRICTER 510(k) PRODUCT APPROVAL PROCESS AHEAD?
On January 19, 2011, following public comments by stakeholders (including medical device companies, industry representatives, and consumer and patient groups), the US Food and Drug Administration (FDA) unveiled a plan containing 25 actions it intended to implement during 2011 related to its abbreviated approval process—known as 510(k)—that enables devices categorized as Class II (relatively low-risk) to be marketed in the US. The industry had raised concerns that the process had become less predictable, less consistent, and less transparent, thus stifling innovation and sending companies and jobs overseas, where approvals could be garnered more quickly. In response to these concerns, the FDA developed a new approval process. The

10 HEALTHCARE: PRODUCTS & SUPPLIES / JANUARY 2013 INDUSTRY SURVEYS
process in Europe involves relatively less strict barriers, a quicker response time, and a shorter clinical trial cycle.
To be eligible for consideration and approval under the 510(k) process, such a device must be shown to be “substantially equivalent” to an already approved device (known as a predicate device). A Class II device is also less complex than Class III devices, which are considered to pose the highest risk to patient safety and therefore must go through a rigorous and lengthy premarket approval (PMA) process involving multiple (and costly) clinical trials. (For a background on the FDA, how it categorizes medical devices, and its approval processes, see “Regulation: The FDA’s Role” in the “How the Industry Operates” section of this Survey.) About 3,000 devices are cleared through the 35-year-old 510(k) process each year.
In January 2012, the FDA’s Center for Devices and Radiological Health (CDRH) announced its priorities for 2012, which include starting a pilot program aimed at enhancing the agency’s efficiency in reviewing pre-market applications and coming up with a proposal stating the conditions under which the CDRH can use clinical studies conducted in and for other countries by December 31, 2012. The CDRH will also undertake steps to oversee Class III devices, which currently undergo the 510(k) process. To address the issues related to slower approval of innovative medical devices, the agency said that by September 30, 2012, it would “create processes and tools that will improve the pipeline for innovative medical devices and transform the way CDRH works with medical device innovators.” To this end, on April 9, 2012, the CDRH launched the “Innovation Pathway 2.0” program aimed at reducing the time required to come out with effective products and improve collaboration between the FDA and the device manufacturers, starting with the pre-market submission stage.
In July 2012, the FDA proposed a unique device identification (UDI) system for medical devices that would help the agency in improving patient safety by identifying devices more quickly in case of any adverse events and by facilitating faster product recalls. The FDA later issued an amendment pushing up the deadlines for devices belonging to different classes to get a UDI label. The FDA has released the proposed changes to the UDI deadline for public comment until December 19, 2012.
In July, the FDA also issued draft guidance on the “Pre-Submission” program that would enable medical device makers to collect feedback on their products before they formally apply for approval. This would help manufacturers and researchers save time and costs by identifying the regulatory requirements much earlier in the device development process. The program is essentially the original pre-Investigational Device Exemption (pre-IDE) program launched in 1995, but with significant improvements and modifications. In August 2012, the FDA issued new recommendations to improve the 510(k) process, which primarily include a new objective checklist that would help screen applications before they go for actual review. The FDA believes that this will help expedite the process by removing applications that are incomplete or require more information.
To accelerate the approval process, the FDA has come up with a new organizational structure for the CDRH. The new organizational scheme (effective November 2012) includes 12 new branches and two new separate divisions for surgical and neurological/physical medical devices. The FDA believes that the new structure will help reduce the manager-to-staff ratios and absorb the new MDUFA employees more effectively. (MDUFA is discussed later in this section.)
Finally, in January 2013, the FDA posted on the Federal Register modifications of about 150 standards recognized by the agency for use in premarket reviews. The updates were published “to assist manufacturers who elect to declare conformity with (the FDA’s) consensus standards to meet certain requirements for medical devices.”
Pressure builds on the FDA, political and otherwise Although the FDA is in the midst of revamping its 510(k) approval rules, the agency has come under political pressure to head off the new approval process and ease device approvals. Studies published in late 2010 and early 2011 by PricewaterhouseCoopers (PwC), Stanford University professor Josh Makower, M.D., and the California Healthcare Institute (CHI) and Boston Consulting Group (BCG), cited over-

INDUSTRY SURVEYS HEALTHCARE: PRODUCTS & SUPPLIES / JANUARY 2013 11
regulation as the reason for sagging medical device innovation in the US. As the FDA has become more risk-averse, approval times have lengthened.
As a result of the studies and, we believe, industry pressure, the House Energy & Commerce Health Subcommittee, which oversees the FDA, decided to explore why the European regulatory pipeline moves faster than its equivalent at the FDA, according to an article published on MassDevice.com, an online journal of the medical devices industry, on February 16, 2011. According to the article, at the House subcommittee meeting that day, Dr. Jeffrey Shuren, the director of the CDRH, noted that it is difficult to make direct comparisons between the US and European systems, due to fundamental differences. For example, the European Union “lacks the requirement in U.S. law that a device be shown to be effective.” He also said that one of the three studies overestimated the review times because it counted the “substantial pre-submission assistance” the FDA offers applicants.
According to an August 2012 study conducted by MedTech Resource Alliance, a healthcare knowledge and resource provider, of the 128 medical device makers that were surveyed, 64% were “extremely dissatisfied” or “somewhat dissatisfied” with the 510(k) regulatory process. The major concerns voiced by the device makers were lack of scientific expertise at the FDA, and ineffective and untimely communication by the FDA in cases of an application rejection.
In November 2012, the FDA released a report, stating that the agency has improved the rate and pace of approvals. According to the report, the FDA approved 80% of the applications for sale in 2012 as against 73% in 2010. The agency also said that one of the major reasons for the slow pace of approval is the poor quality of applications submitted by medical device makers.
The Pew Charitable Trusts requested that the Partnership for Public Service (PPS, a nonprofit organization that encourages the federal workforce to strive to improve government operations) conduct a study on the state of the FDA workforce. The study, released in November 2012, found that the FDA has made significant progress since 2007, at which time another study had found that the FDA’s “scientific workforce does not have sufficient capacity and capability.” The PPS study also pointed out that the FDA’s hiring process is slow and tedious, and needs improvement. The study recommended that the FDA speed up hiring, focus on career training, chalk out clear career paths for employees in different fields, and take the problem of high attrition more seriously.
The GAO weighs in The US Government Accountability Office (GAO), in a report to congressional requesters published June 21, 2011, recommended that the FDA enhance its oversight of medical device recalls. According to information reviewed by the GAO, manufacturers initiated 3,510 device recalls (or an average of over 700 recalls per year) from 2005 to 2009. Of these recalls, as many as 83% were classified as class II, which implies a moderate degree of risk associated with usage of the device. About 40% included cardiovascular, radiological, or orthopedic devices. The GAO report identified numerous gaps in FDA processes and procedures that, if unaddressed, may increase the risk that unsafe medical devices could remain on the market. To aid its oversight of the medical device recall process, according to GAO recommendations, the FDA should routinely assess information on device recalls, develop enhanced procedures and criteria for assessing the effectiveness of recalls, and document its basis for terminating individual recalls.
Following the GAO’s recommendations on improving the FDA’s recall monitoring process, the Senate released a bill in December 2011 that provides the FDA with the authority to require post-market studies as a condition of the 510(k) process. AdvaMed, however, believes that such authority is not important, as the FDA already has the right to ask manufacturers to carry out post-market studies for higher-risk products.
In 2012, the GAO released three reports that recommend the FDA enhance patient safety and improve the agency’s efficiency. In February, the GAO conducted a study to assess whether the FDA has been successful in meeting its performance standards with respect to the 510(k) process and to understand the common issues stakeholders have with the FDA’s review process and how the FDA can deal with these issues. It found that the FDA had successfully met all performance goals for all 510(k) submissions from fiscal 2005 to fiscal 2010. The FDA review time (the time between the submission of an application and the FDA’s final

12 HEALTHCARE: PRODUCTS & SUPPLIES / JANUARY 2013 INDUSTRY SURVEYS
decision, excluding the period for which the FDA might wait for additional information from an applicant) showed a modest decline from fiscal 2003 to fiscal 2010. However, the average time elapsed before the FDA’s final decision increased considerably, from 100 days in fiscal 2005 to 161 days in fiscal 2010. In April, the GAO released a study that determined that timeliness is a parameter that the FDA may use to assess an employee’s performance, though its weight as a standard varies with the duties an employee performs and the employee’s level of responsibility. In August, the GAO released a study recommending that the FDA “expand its consideration of information security” for medical devices, particularly those with wireless capabilities. Such devices are prone to information security risks, intentional threats (such as hacking), and unintentional threats (such as disturbances resulting from electromagnetic interference).
Help arrives from Congress On November 18, 2011, the Consolidated and Further Continuing Appropriations Act, 2012 was signed into law. The law set the spending level for the FDA for fiscal 2012 (ended September 2012) at $2.506 billion (excluding user fees of $1.393 billion), matching the amount the Senate Appropriations Committee set for the agency in August and $334 million more than that set by the House in its appropriations bill passed in June. Further, the amount exceeded the FDA’s fiscal 2011 budget appropriated by Congress by $50 million.
In February 2012, President Obama, as part of his budget proposal for fiscal 2013 (which began October 1, 2012), requested the FDA receive a budget of $4.49 billion, comprising $2.517 billion to be appropriated by Congress and $1.969 billion in expected industry user fees. This represents a 17% increase from his fiscal 2012 budget, which included $2.506 billion to be appropriated by Congress and $1.326 billion in user fees. However, in April 2012, the Senate Appropriations Committee approved the 2013 budget at $3.91 billion, including $2.524 billion appropriated by Congress and user fees of $1.386 billion, of which the latter amount represents a decrease from both the amount requested by the President and the user fees budgeted for fiscal 2012.
MDUFA III AGREEMENT
On July 9, 2012, President Obama signed the Food and Drug Administration Safety and Innovation Act (FDASIA), which reauthorizes user fees from the drug and medical devices industries. With regard to the medical devices industry, the FDASIA included the Medical Device User Fee Act (MDUFA). As this was the third authorization of user fees, it is known as MDUFA III, and provides up to a third of the FDA’s device budget. The CBO estimated the FDA would collect about $609 million in fees from MDUFA during the fiscal 2013–17 period. The bill also included medical device regulatory reforms.
AdvaMed supports the recent reauthorization of MDUFA, which was worked out through negotiations between the FDA and industry representatives. It views the user fee agreement as having the potential to increase the predictability, consistency, and efficiency of the FDA’s decision-making. The industry has long complained that past problems with the FDA are a main reason why the industry often launches new products in Europe before launching them in the US.
The pricing structure for 2013 under MDUFA III nearly doubles the total user fees at $595 million over five years, up from $295 million in 2012. The agreement also includes a discounted fee for companies with less than $100 million in annual revenues. According to the FDA, the higher fees would provide the agency with funds to hire 200 full-time employees over five years.
S&P views the changes to MDUFA as positive for the device industry in that they streamline the overall new device approval structure, adding more certainty, predictability, and transparency to the overall process. Among the reforms are the following: streamlining the clinical trial processes by identifying key criteria required for product approvals; new requirements for FDA reviewers to provide scientific and regulatory rationale for major decisions and to allow expedited repeal of those decisions; and greater efficiency in the review process of de novo, or entirely new, innovative medical devices.
Other enhancements include more training for FDA reviewers; the hiring of additional experts; the requirement that the FDA provide more structure and clarity to the review process during pre-submissions;

INDUSTRY SURVEYS HEALTHCARE: PRODUCTS & SUPPLIES / JANUARY 2013 13
and decision targets be based on fixed deadlines. In addition, the review process would include greater interaction between the FDA and manufacturers, and oversight from a network of experts to help the FDA resolve complex scientific issues, which S&P thinks would ultimately yield more timely reviews.
While S&P believes the medical device makers, such as Boston Scientific, Covidien, Edwards Lifesciences, Medtronic, St. Jude Medical, Stryker, and Zimmer Holdings, are likely to benefit from the aforementioned process changes by the reduced time and cost to bring new products to the US market, the reforms also sought to protect consumers. Indeed, the Consumers Union (CU), a nonprofit consumer products review organization, noted that the FDA can more easily up-classify problematic devices so that subsequent, similar devices will receive more scrutiny in the approval process, and that approval for high-risk devices depends on the completion of post-market studies. However, the CU and other consumer groups complain that the bill does not prohibit the FDA from approving new devices based on predecessor devices that have been found to be faulty and that it does not require national registries of patients with devices that would enable the FDA to quickly identify and track problem devices.
FDA priorities for 2013–17 In October 2012, the FDA released a guidance document that detailed the goals that would help it achieve a quicker pace of approvals, as it promised under the MDUFA III. According to the guidance, the FDA plans to bring down the average waiting period for clearance applications from the current 150 days to 124 days by 2017. This will be achieved in steps, by reducing the period to 135 days in 2013–14 and to 130 days in 2015–16. Under MDUFA III, the FDA aims at reducing the review time for pre-market approvals (PMAs) from 680 days to 320 days, and for 510(k) applications from 138 days to 90 days. The new user fee agreement also makes it mandatory for the FDA to conduct preliminary reviews of applications within 15 days of receipt, after which the agency should decide on the device’s substantial equivalence. The FDA is undertaking a number of measures to improve its review time and operational efficiency.
On December 3, 2012, the FDA announced the formation of the Medical Device Innovation Consortium, a partnership between the FDA and LifeScience Alley, a Minnesota-based trade association for the life sciences. The main objective of the partnership is to reduce the time it takes for new medical device technologies to reach patients.
WILL INDUSTRY CONSOLIDATION CONTINUE ITS MOMENTUM?
According to S&P Capital IQ data, merger and acquisition (M&A) activity—in which healthcare products and supplies companies worldwide were buyers, sellers, and/or targets—grew markedly in 2010. In that year, 615 transactions were announced (including bids and letters of intent), for which the transaction values for 288 (those available publicly) totaled approximately $69.0 billion. Note, though, that the Novartis acquisition of Alcon accounted for $40.7 billion of the total. In any event, the number of transactions was up markedly from 2009, when 513 were announced, of which the transaction values of 232 were provided and had an aggregate value of $17.4 billion.
In 2011, 629 transactions were announced, of which the transaction values of 288 were provided publicly and had an aggregate value of $71.6 billion.
In 2012, 561 transactions were announced for which the transaction values for 230 totaled about $36.5 billion. Although the deal count was below that of 2011, we do not view the difference as indicative of reduced M&A trends. In our view, it is too early to assume that there is a permanent slowdown; it may only reflect timing and the availability of acquisition candidates.
The rise in M&A activity in 2010–11, and the momentum we saw in 2012, despite the 11% decline in the number of announced transactions, reflected a couple of factors, in our view. First, despite the recent credit crunch, we believe that companies were able to build and preserve a lot of cash and retained balance sheet flexibility. Second, we believe the softness they had been experiencing in a number of product lines and markets, as highlighted by pricing pressures and reduced levels of elective and even non-elective procedures, encouraged them to rely on M&A to help grow their bottom lines. According to PricewaterhouseCoopers, an accounting firm, the device industry will consolidate to achieve cost savings and diversify product

14 HEALTHCARE: PRODUCTS & SUPPLIES / JANUARY 2013 INDUSTRY SURVEYS
portfolios, driven by the need to combat the impact of the pending federal excise taxes, continued pricing pressures, and declining procedure volumes in certain high-cost treatment areas.
While credit markets are less constrained, the medical device group is also able to rely more on its own healthy balance sheets, cash flow, and existing lines of credit. In 2010, several significant deals were
announced, including Novartis’s purchase of the remaining shares of Alcon owned by Nestlé and the publicly traded shares owned by the minority shareholders, Covidien plc’s acquisition of ev3 Inc., and Medtronic’s acquisition of Ardian Inc. Those announced in 2011 include Johnson & Johnson’s acquisition of Synthes, Danaher Corp.’s acquisition of Beckman Coulter, and DENTSPLY International’s acquisition of Astra Tech AB, a division of AstraZeneca PLC. There have also been some significant deals announced in 2012, including Hologic Inc.’s acquisition of Gen-Probe, Baxter International’s acquisition of Gambro AB, Agilent Technologies acquisition of Dako, and Boston Scientific Corp.’s acquisition of Cameron Health Inc.
According to a September 2012 Reuters article, following a decline in 2012, M&A activity in 2013 should see a surge in transaction volume. Based on comments from medical device makers and healthcare analysts, Reuters believes that factors such as the medical device excise tax, lower reimbursements, and management changes at some of the bigger device makers, will all lead to heightened deal volume in 2013. St. Jude Medical believes the device tax is likely to put financial pressure on smaller companies, which, in turn, will adversely affect their valuations. This will allow bigger companies, pressured by government demands to lower prices, to consider acquisitions of innovative products. Companies such as Medtronic,
B12: SELECTED MEDICAL PRODUCTS AND SUPPLIES ACQUISITIONS
SELECTED ANNOUNCED MEDICAL PRODUCTS AND SUPPLIES ACQUISITIONS—2011-2012(Ranked by deal size)
DEAL SIZEYEAR PURCHASER TARGET (MIL. $) 2 0 12 Hologic Inc. Gen-Probe 4,204.1
Baxter International Gambro AB 4,013.8Agilent Technologies Dako A/S 3,000.4Asahi Kasei Corp. ZOLL Medical 2,216.2Boston Scientif ic Cameron Health 1,350.0Thermo Fisher Scientif ic One Lambda, Inc. 891.0Smith & Nephew Healthpoint, Ltd. 782.0Medtronic, Inc. China Kanghui Holdings 730.7Corning Inc. Discovery Labw are 730.0Haemonetics Corp. Pall Corp.'s blood collection, f iltration,
and processing product lines551.1
Bausch & Lomb ISTA Pharmaceuticals 491.9Boston Scientif ic Corp. Vessix Vascular, Inc. 425.0Hill-Rom, Inc. Aspen Surgical Products 400.0Royal DSM Kensey Nash Corp. 393.3Wright Medical Group BioMimetic Therapeutics 377.0AngioDynamics Navilyst Medical 374.5Beckman Coulter IRIS International 368.0
2 0 11 Johnson & Johnson Synthes 21,534.6Danaher Corp. Beckman Coulter 7,392.9Apax Partners Worldw ide; Canada Pension Plan Investment Board; Public Sector Pension Investment Board
Kinetic Concepts 6,291.6
Apax Partners Worldw ide Smiths Medical 3,888.6Thermo Fisher Scientif ic Phadia AB 3,512.8Endo Health Solutions American Medical Systems Holdings 2,825.1Terumo Corporation Terumo BCT 2,625.0DENTSPLY International Astra Tech AB 1,948.2TPG Capital Immucor 1,945.1Couckinvest NV Omega Pharma NV 1,387.9FUJIFILM Holdings SonoSite 931.4MAQUET Cardiovascular Atrium Medical 680.0Elekta AB Nucletron B.V. 525.1Biosensors International Shandong JW Medical Products 507.2Kyow a Hakko Kirin Co. ProStrakan Group 499.2Bain Capital Private Equity Physio-Control 468.0Medtronic Salient Surgical Technologies 452.0EQT Partners Atos Medical AB 425.3Covidien BÂRRX Medical 413.0Catalent Pharma Solutions Aptuit's clinical trial supplies business 407.0Alere Inc. Axis-Shield 396.1Boston Scientif ic Atritech 375.0Baxter International Baxa Corporation 367.0Hologic Inc. Interlace Medical 351.8
Source: Capital IQ; Company reports.

INDUSTRY SURVEYS HEALTHCARE: PRODUCTS & SUPPLIES / JANUARY 2013 15
Johnson & Johnson, Stryker, and Covidien have all seen changes in their top management, which could be a likely reason for a slight dip in transactions in 2012. However, with new leadership strategies now in place, the bigger device makers will have takeover plans to boost their bottom line and expand their market. According to the article, the prospective takeover targets in the orthopedics space are Nuvasive Inc., Wright Medical Group Inc., and Tornier Inc., while those in the heart market include Edwards Lifesciences Corp., HeartWare International Inc., Thoratec Corp., and Volcano Corp. Further, device makers may be keen on acquiring foreign companies, as this would offer tax advantages to the acquirers.
We also expect to see more strategic (or “tuck-in”) acquisitions (including a willingness to acquire early-stage companies that lack financing), driven by companies’ demand for next-generation technologies and their desire to enter new product areas and take advantage of cross-selling opportunities through existing sales channels. In the near term, we expect these smaller deals to dominate transaction activity, as opposed to wholesale purchases of new business lines or of competitors.
In addition to consolidation, a number of medical device makers have also been divesting businesses that they view as underperforming. Boston Scientific sold its Neurovascular segment to Stryker in January 2011 for $1.5 billion (announced in 2010); we believe the proceeds of this sale have been used to help fund acquisitions to improve Boston Scientific’s growth prospects. Covidien embarked on a portfolio improvement program, divesting several underperforming units in recent years and replacing them with acquisitions of businesses it views as having promising growth prospects. In December 2011, it announced plans to spin off its pharmaceutical business to its shareholders, but the transaction could take up to 18 months to complete.
PROMISING MEDICAL DEVICE TECHNOLOGIES
The medical device market is characterized by the continuous development and launch of new products that improve the diagnosis and/or treatment of various diseases and conditions. They may be based on evolving or new technologies that have had an impact, some quite significant, on medical practice patterns. Below we highlight some notable medical devices based on new or improved technologies launched in recent years.
� Transcatheter aortic valves. Transcatheter aortic valves (TAVs) are heart valve replacement and repair technologies designed to treat heart valve disease using a catheter-based approach (as opposed to open-heart surgery). Transcatheter valve replacements can be done via minimally invasive surgical techniques, dramatically reducing recovery and rehabilitation times as well as the cost of the procedure. In addition, while mechanical valves require patients to remain on blood thinners for the rest of their lives, TAVs don’t have this requirement, greatly reducing the burden on the patient. TAVs are used predominantly for high-risk patients with severe aortic stenosis, who ordinarily would not be optimal candidates for conventional valve replacement—anywhere from 30%–60% of the heart valve patient population. According to a January 2012 report published by GBI Research, the global transcatheter heart valve market is forecast to grow at a 20% CAGR from 2010 to 2017 to reach $691 million in value by 2017.
In November 2011, the Sapien TAV from Edwards Lifesciences Corp. received the FDA’s approval for US marketing. This is the first commercial approval for a transcatheter device. So far, it has been approved for the treatment of inoperable patients (i.e., those unable to undergo open-heart surgery). Sales in the US were so robust in the second quarter of 2012 that Edwards increased its outlook for US sales for the year. In October 2012, the Sapien TAV received FDA approval for extended indication. The device is now permitted for use on patients who are eligible for aortic valve replacement surgery, but are prone to high surgery-related risks or even death. The approval was based on the results of the PARTNER A trial conducted by the device maker.
In November 2011, the company received permission to conduct clinical trials in the US for its next-generation TAV, the Sapien XT, which is already available in Europe. Further, the company expects to gain marketing approval for Sapien XT in Japan by mid-2013 and insurer reimbursement for the device by the end of 2013. In December 2011, it announced that it had two additional TAVs under development. Meanwhile, it expects the TAVs to generate global revenues of $710 million–$790 million in 2013.

16 HEALTHCARE: PRODUCTS & SUPPLIES / JANUARY 2013 INDUSTRY SURVEYS
Medtronic’s CoreValve TAV, which has been available in Europe, has been enrolling patients for its US pivotal clinical trial. Separately, it has been seeking European approval for a next-generation TAV, the Engager, and plans to launch the device in 2013. Meanwhile, in November 2012, a federal court of appeals upheld an April 2010 federal jury decision that Medtronic’s CoreValve infringed on one of Edwards’ TAV patents. Competition is poised to intensify, as other device makers such as Boston Scientific and St. Jude Medical are also working on transcatheter devices for which they hope to get approval in the US and Europe. St. Jude Medical’s Portico device gained the European Union’s approval in November 2012.
� Renal denervation. Renal denervation is a minimally invasive procedure to cure treatment-resistant hypertension, which occurs when high blood pressure persists despite the use of at least three prescription blood pressure drugs, including a diuretic. The condition, which currently affects around 120 million people globally, subjects its patients to the risk of premature death due to a kidney malfunction or cardiovascular events such as stroke, heart attack, and heart failure. Renal denervation works by disrupting both afferent and efferent nerves going into and out of the kidneys by using radio frequency energy emitted by a catheter device inserted into the renal arteries. According to research presented at the European Society of Cardiology (ESC) Congress 2012, renal denervation can result in a “significant and sustained” reduction in blood pressure for up to 18 months in patients suffering from treatment-resistant hypertension. While the technology is still to be approved in the US, several devices using the technology are available in Europe.
According to a July 2012 report by Millennium Research Group, a medical technology market research firm, the market for renal denervation technologies will reach $2.9 billion by 2021. In October 2012, Medtronic announced the start of the open-label Symplicity HTN-Japan clinical study. The study would involve around 100 patients across 11 centers in Japan. In November 2012, Medtronic said that it hoped to get FDA approval for sale of its Symplicity system in the US by 2015. In December 2012, it posted positive one-year results from Symplicity HTN-2, the first randomized clinical trial, which had 106 subjects. Meanwhile, as of October 2012, it was recruiting participants for Symplicity HTN-3, a large-scale, multi-center, randomized clinical trial.
Separately, in November, St. Jude Medical announced the success of a six-month clinical study of its CE-marked EnligHTN device, its multi-electrode renal denervation technology. Covidien also has a CE mark for its OneShot technology, and ReCor Medical for its Paradise device. In November 2012, Boston Scientific acquired Vessix Vascular for its V2 technology, for which it hopes to receive its CE mark in 2013. In December 2012, Cardiosonic, an Israel-based device maker, announced its plans to invest around $6.1 million for the development of Tivus, its renal denervation technology device. (The “CE” in CE mark is the abbreviation of the French phrase “Conformité Européenne,” which means European Conformity. It designates the product’s compliance with European Union legislation and enables the product to move freely within Europe. It is not a mark of quality, however.)
Renal denervation devices also have been found to be effective in the treatment of diabetes. According to the European Association for the Study of Diabetes, such devices have proved useful in early trials in improving insulin and glucose levels in patients suffering from diabetes. However, for the technology to be used commercially for the treatment of diabetes, there needs to be more detailed analyses of post-market safety data.
� 3-D digital mammography tomosynthesis system. Unlike prior-generation mammography systems that generate two-dimensional images, this new method produces three-dimensional images intended to reveal the inner architecture of the breast, free from the distortion typically caused by tissue shadowing or density. The device functions by driving an x-ray tube in an arc across the breast, producing a series of low-dose images acquired from different angles; the projection images are then reconstructed into 1mm slices. The radiation dose is close to that of 2-D mammography. In February 2011, Hologic Inc. received final approval from the FDA for the system, which has been available commercially in 28 countries outside the US, including countries in Europe, Latin America, and Asia, as well as Canada and Mexico. In August 2012, the FDA decided to review and vote for pre-market approval (PMA) for the extended indication of Hologic’s Selenia Dimensions 3-D system with C-view software module. In October 2012, the FDA approved the new imaging mode on the Selenia Dimensions 3-D system. The new C-view software module is capable of

INDUSTRY SURVEYS HEALTHCARE: PRODUCTS & SUPPLIES / JANUARY 2013 17
producing synthetic 2-D images using the digital breast tomosynthesis (DBT) data. The extended indication would provide an alternate exam option for breast cancer screening. Being more accurate, this 2-D+DBT mammography might help to bring down the recall rates of screening mammography.
In an investor presentation on December 4, 2012, Hologic estimated that the US has an installed base of around 10,000 digital systems, which can be potentially converted to tomosynthesis systems. Hologic said that it is on track to ship 500 units-700 units within the first two years of approval (i.e., by the end of the second quarter of fiscal 2013) and had already achieved 60% of that target at the end of fiscal 2012 (ended September 2012). S&P thinks that the results of a study released in January 2013 indicating that mammograms using a combination of 2-D and 3-D had a 27% better detection rate and a 15% lower false-positive rate than those using 2-D alone would help encourage the sale of the 3D systems and possibly help garner for use of the 3-D system a reimbursement code from the Centers for Medicare and Medicaid Services. Moreover, S&P believes the absence of the reimbursement code limits sales growth. Even so, the 15% reduction in false positives may not be enough to bring down recall rates, in S&P’s view.
INVESTORS LESS WORRIED ABOUT SLUGGISH SURGERY ENVIRONMENT ON MEDICAL DEVICES
For stock analysis purposes, S&P Capital IQ divides the medical devices industry into two sub-industries: healthcare equipment companies and healthcare product suppliers. The former group comprises manufacturers of surgical equipment and high-tech products for orthopedics and interventional cardiology. The latter is a diverse group that manufactures blood collection, diabetes, and low-end hospital capital equipment. These products tend to be less differentiated by patents and complex technologies, and often are low-tech commodities.
We think the outlook for manufacturers of high-tech devices is positive in the long term, driven by the demographics of an aging population, more active lifestyles, and the rise of obesity. However, we believe the current challenging operating environment (including a reduction in elective and certain nonelective surgical procedures, hospital groups’ increased focus on M&A, and the development of electronic medical record systems) has sharply reduced hospitals’ capital equipment purchases. Healthcare reform also may be delaying certain spending plans.
Although we believe many supply categories are historically largely recession-resistant, there are concerns about demand trends in areas typically viewed as non-elective, such as basic hospital supplies, sterilization equipment, beds and stretchers, and blood collection products, which are tied to hospital spending budgets. Slow US economic growth has also put pressure on government reimbursement programs, such as Medicare and Medicaid, and on private payers. Even so, in 2011 and 2012, we saw a pickup in spending for some products, suggesting to us that many hospitals have begun replacing aging supplies.
In 2012, the S&P Health Care Equipment subindex slightly outperformed the sector, rising 16.8%, while the consolidated S&P Health Care sector index gained 15.9%. The sector index was held back by a 10.1% rise in the Pharmaceuticals subindex (which accounted for 46.8% of the weight of the index as of December 31) and a 4.9% rise in the Managed Health Care subindex (7.7%). The S&P Health Care Equipment subindex (15.0%) also outperformed the broader market, as the S&P 1500 Composite Stock index grew 13.7% in 2012. The S&P Health Care Supplies subindex (1.1%) gained 23.7% in 2012, also beating the performance of the overall Health Care sector. In 2011, the S&P Health Care Equipment subindex declined 2.2%, while the S&P Health Care Supplies subindex grew 7.7%, both underperforming the S&P Health Care sector index, which gained 9.6%; the S&P 1500 index declined 0.3%. �

18 HEALTHCARE: PRODUCTS & SUPPLIES / JANUARY 2013 INDUSTRY SURVEYS
INDUSTRY PROFILE
A diversified industry maintains strong growth
The medical products industry is highly diversified and lacks a common definition, making it difficult to generalize about its size, performance, and prospects. With this caveat, we review the latest available estimates from several sources. According to a May 2012 report by Kalorama Information, a medical market research firm, the global medical device market generated $322 billion in sales in 2011, up 5% from the previous year. The research firm believes that the sector growth in 2011 was due to new product launches, and increased research and development funding. However, S&P Capital IQ believes the austerity programs rolled out by Western European governments have hampered growth in that region. The unfavorable policies implemented by governments for the medical device makers, together with the steps taken by hospitals to reduce device pricing, have affected the performance of a few prominent players, such
as Johnson & Johnson, Medtronic, and Siemens Healthcare, whose revenue growth could not match the overall growth of the industry in 2011.
According to Espicom (a UK-based business intelligence provider), which we believe measures the market differently, the global market for medical devices was worth $273.3 billion in 2011. Further, Espicom estimates that the industry has grown at a compound annual growth rate (CAGR) of 5.3% between 2006 and 2010 and forecasts that the industry will reach $348.6 billion by 2016.
Earlier, Johnson & Johnson had estimated the global medical device market at about $350 billion in 2009 (latest available), with a CAGR of about 5% over the
previous five years. It pegged the US as accounting for 47% of the market in 2009, and outside the US for 53%. It also expected the global market to expand at a CAGR of over 5.0% to 2014, at which point the market should be about $445 billion.
Espicom estimated the US market size at $95 billion for 2010 and $105.8 billion for 2011. Within the European Union (EU), the largest markets are Germany, France, Italy, the United Kingdom, and Spain, according to Eucomed, the trade association for European medical device companies. Germany, the UK, and France together accounted for 57% of European sales of approximately $132 billion in 2009 (latest available), according to Eucomed. According to an August 2012 report by TechNavio, a market research firm, the European medical device market is expected to grow at a CAGR of 3.7% between 2011 and 2015. Another report by Espicom released in June 2012 estimated the value of the UK medical device market at
B06: LARGEST GLOBAL MEDICAL DEVICE COMPANIES
LARGEST GLOBAL MEDICAL DEVICE COMPANIES(In millions of dollars, ranked by 2011 medical device sales)
20112011 DEVICE SALES
- - - MEDICAL DEVICE SALES - - - TOTAL AS % OFCOMPANY 2010 2011 % CHG. SALES TOTAL SALESJohnson & Johnson 24,601 25,779 4.8 65,030 39.6GE Healthcare 16,897 18,083 7.0 147,300 12.3Siemens Medical Systems1,2 16,678 17,436 3.3 102,847 17.0Medtronic3 15,508 16,184 9.1 16,184 100.0Philips Medical Systems 11,407 12,308 4.3 31,395 39.2Abbott Labs 9,785 10,410 8.3 38,851 26.8Covidien1 8,438 9,607 (4.7) 11,574 83.0Boston Scientif ic 7,806 7,622 5.5 7,622 100.0Becton Dickinson1 7,372 7,829 8.9 7,829 100.0Stryker 7,320 8,307 10.8 8,307 100.0St. Jude Medical 5,165 5,612 10.3 5,612 100.0Baxter International4 7,370 7,804 4.3 13,893 56.2Zimmer 4,220 4,452 3.1 4,452 100.0Smith & Nephew 3,962 4,270 5.0 4,270 100.0Biomet5 2,732 2,838 1.3 2,732 103.9C.R. Bard 2,720 2,896 7.3 2,896 100.0Varian Medical Systems1 2,357 2,597 6.5 2,597 100.0Edw ards Lifesciences 1,447 1,679 9.5 1,679 100.01Fiscal years ended September. 2External revenues. 3Fiscal years ended April. 4Adjusted2011 revenues. Excludes biosciences, global injectibles, and anesthesia products. 5Fiscalyears ended May. Source: Company reports.

INDUSTRY SURVEYS HEALTHCARE: PRODUCTS & SUPPLIES / JANUARY 2013 19
$8.5 billion for 2011 and projected that the UK market will grow 3.5% per annum to reach $10.1 billion in 2016. According to the report, the UK is the largest medical device market in Europe, followed by France at $8.3 billion in 2011 (expected to grow to $9.8 billion by 2016). However, the large US manufacturers continue to be the dominant players in many parts of the world, and international markets generate a significant share of their revenues.
INDUSTRY TRENDS
While we expect foreign exchange to have a favorable impact for the foreseeable future, we believe the medical products industry will face major challenges over the next several years. Problems are expected to include constrained hospital capital expenditure (capex) budgets, heightened cost-containment efforts, and the impact of healthcare information technology (HCIT), all of which will be partially offset by continuing favorable demographic trends.
Traditionally, the adoption of new technologies and expanded applications of existing ones are key areas of focus and sales drivers in the medical products industry. However, given the recent efforts at federal healthcare reform legislation, regulators, payers, and researchers are increasingly questioning the incremental value of
many of these new technologies in this new era of cost containment. In addition, although we see several new emerging technologies that will spur industry growth (e.g., transcatheter aortic valve replacement and renal denervation technology), we see little in the way of true breakthrough innovations, such as the introduction of implantable cardioverter defibrillators (ICDs) or drug eluting stents (DES), that drove entirely new product categories or dramatically enlarged existing sales.
FOREIGN EXPOSURE MAY PRESSURE NEAR-TERM RESULTS
US medical device manufacturers garner 40%–50% of their revenues in foreign markets (with approximately 30% coming from Europe), where their technological leadership allows for dominant market share positions in most of the leading-edge product areas. Revenues come from direct exports, as well as from sales made by foreign subsidiaries. As a result, the operating environment outside the US, as well as the movement of foreign currencies versus the US dollar, are both critical to the performance of US medical companies. In 2011, the US dollar weakened through the first half of the year, but started strengthening in the second half. It continued to strengthen
throughout most of 2012 and, as a result, US medical device companies were hurt by unfavorable currency movements versus their major trading partners. As of mid-January 2013, Standard & Poor’s Economics (which operates separately from S&P Capital IQ) expected the dollar to strengthen through mid-2014, and
to weaken afterward.
In any event, device companies look to rationalize their cost structures in the face of the US healthcare reform tax and a general slowing in top-line growth, we expect US firms to continue to build manufacturing and marketing infrastructures abroad in order to better
B08: US TRADE SURPLUS FOR SELECTED MEDICAL PRODUCT GROUPS
US TRADE SURPLUS FOR SELECTED MEDICAL PRODUCT GROUPS
FIRST THREE - - QUARTERS - -
PRODUCT GROUP 2008 2009 2010 2011 2011 2012Medical instruments & appliances* 5,988 6,922 7,168 7,148 5,111 5,727Mechano-therapy, psychological testing,
and oxygen therapy apparatus (606) (601) (687) (738) (523) (594)Orthopedic appliances 488 794 137 (341) (79) 373Radiology equipment (246) 283 374 207 142 302*Includes surgical, dental, and veterinary equipment (electrodiagnostic, ultraviolet, or infraredray apparatus, syringes, needles, catheters, etc., and ophthalmic instruments and appliances.) Source: US International Trade Administration.
SURPLUS (DEFICIT) IN MILLIONS OF DOLLARS
B02: FOREIGN SALES OF SELECTED MEDICAL PRODUCTS COMPANIES
FOREIGN SALES OF SELECTED MEDICALPRODUCTS COMPANIES—2011
FOREIGNSALES AS %
OF TOTALSALES
DIVERSIFIEDC.R. Bard Inc. 33Becton Dickinson 57Johnson & Johnson* 56Medtronic** 45CARDIOVASCULARBoston Scientif ic 46St. Jude Medical 53ORTHOPEDICSStryker Inc. 37Zimmer Holdings Inc. 45*Excludes pharmaceutical and consumerproducts. **12 months ended April 27, 2012. Source: Company reports.

20 HEALTHCARE: PRODUCTS & SUPPLIES / JANUARY 2013 INDUSTRY SURVEYS
serve local markets and to improve manufacturing efficiency. Relocation of production and R&D facilities overseas offers many important advantages in terms of lowering production costs and being able to ship and deliver products on a timely basis. US firms have a heavy manufacturing presence in Asia and Latin America, and they plan further expansion in those regions.
A market has also developed for the export of used medical device equipment to emerging markets. According to the Healthcare Technologies Resource Guide: 2012–2013 by the US Commercial Service, the trade promotion arm of the US Department of Commerce’s International Trade Administration, Mexico and Kenya were found to be the most favorable markets for used medical equipment exported from the US.
Interest in developing markets is on the rise While the US market is the world’s largest and most profitable, S&P Capital IQ (S&P) sees significant growth opportunities overseas for medical device companies. This is particularly the case in emerging markets, including China, India, Latin America, and the Middle East, where the middle class is expanding, GDP has been rising, and public and private sectors are increasing their investments in healthcare. For example, market researcher BCC Research, in a report published April 2011, expects the US to remain the world’s largest medical aesthetics device market for at least a few more years, but notes that demand is increasing faster in emerging economies, and highlights China, India, Mexico, and Brazil. According to an October 2011 report by Espicom, a UK-based business intelligence provider, the Asia-Pacific medical device market is expected to grow at a compound annual growth rate (CAGR) of 9.6%, to reach $71 billion by 2015.
The emerging markets, particularly China and India, are also attracting multinational companies, including medical device manufacturers, to set up shop there. In January 2013, Stryker announced its $764 million offer to buy Chinese orthopedics product maker Trauson Holdings to gain a foothold in China. This follows the November 2012 acquisition of Chinese orthopedics product maker China Kanghui Holdings by Medtronic for $816 million. In May 2012, Johnson & Johnson agreed to buy (for an undisclosed sum) Guangzhou Bioseal Biotech Co. Ltd., maker of a sealant used to contain bleeding during surgical procedures. The deal, which marks J&J’s first Chinese medical device acquisition, will allow the company to add the Bioseal brand to its expanding portfolio of hemostasis devices in China. Previously, in June 2011, it opened a product development center in Suzhou.
In August 2012, Medtronic opened its R&D center in Shanghai to collaborate with local physicians to find innovative solutions for Chinese patients. Also in August, Varian Medical Systems announced its plans to set up a South Korean subsidiary. The company expects the subsidiary to support the rollout of its TrueBeam treatment system, and to provide a local base for all of the company’s businesses.
In August 2012, Covidien plc announced its plans to open a R&D center in China, with an investment of $45 million. The center will encompass 100,000 square feet and have 17 laboratories. The company plans to hire more than 300 people over a three-year period. In February 2012, the company opened its first research and development facility in India, part of its strategy to tap into emerging markets. The company, which initially had about 30 people working at the new 40,000-square-foot space, plans to add more than 350 employees in the next couple of years. In March 2011, St. Jude Medical unveiled a product development center in Beijing. In June 2011, Hologic acquired a Beijing-based healthcare distributor.
Earlier, in December 2010, Zimmer Holdings Inc. acquired Beijing Montagne Medical Device Co. Ltd., a maker of hip and knee replacements, and powered surgical instruments suited specifically for the Chinese market. In November 2011, Zimmer announced its plan to establish a new research and development center in Beijing to come out with products better suited for local patients. In October 2011, Advanced Medical Technology Association (AdvaMed), the medical device industry trade association, approved plans to construct two hospitals and 10 clinics in central China as per its agreement with the national nonprofit organization, the China Youth Development Foundation; construction was expected to begin in the next two months. Finally, while we note that Medtronic Inc. has reduced its global workforce by 1,700 positions, it plans to hire 1,000 workers in China and more than 600 in India over the next five years.

INDUSTRY SURVEYS HEALTHCARE: PRODUCTS & SUPPLIES / JANUARY 2013 21
Everyone’s eyes are on China… A number of market research and business consulting firms have provided varying estimates about the size of China’s medical device market and its growth prospects. Infiniti Research, a London-based market intelligence firm, sees the size of China’s medical device market growing by a CAGR of 16.5% over the 2011–15 period. Visiongain, a UK-based independent business information provider, sees an increase to $45.0 billion in 2022, from $13.4 billion in 2011. China contract manufacturing consulting firm NPI thinks the market will increase to $50 billion in 2020, from $14 billion in 2010. Management consulting firm Pacific Bridge Medical (PBM) sees the market growing at 15%–20% over the next five years, from $7.5 billion in 2010.
S&P believes the figures differ based on types of devices included in the surveys, assumptions about economic prospects and currency exchange, and probably a slew of other factors. What they have in common is that China’s medical device market is already sizable and is likely to continue to grow rapidly in the next few years. In any event, the country’s medical device market, in terms of revenues, is ranked second in the Asia-Pacific region (after Japan), and fourth globally. The medical device market ranks high in priority for the policy makers in China. According to PBM, Chinese investors’ interest in medical device research is expected to rise sharply.
Growth of China’s medical device market is also seen in import data: from 2001 to 2009, device imports recorded a 10% CAGR from $1.64 billion to $6.11 billion, according to a June 2009 US Department of Commerce (DOC) report and the China Chamber of Commerce for Import & Export of Medicine and Health Products. Further, according to PBM, the overall Chinese drug-eluting stent (DES) market five years ago was comprised of 90% foreign DES products, while today domestic Chinese companies account for as much as 75% of the Chinese DES market. S&P believes that such growth has been enabled by the Chinese government’s decisions to relax tariffs, set up tax incentives for foreign investors, and improve intellectual property protection (IPP) laws. There are still challenges, including inefficient enforcement of IPP laws and an uncertain regulatory environment characterized by frequent change, according to the Canadian Foreign Affairs and International Trade Center (CFAITC).
China’s medical device market is highly fragmented and competitive. According to the CFAITC, more than 13,000 domestic medical device manufacturers and a large number of foreign suppliers compete in China. It notes that Chinese capacity remains low in high-end products, with 90% of value-added high-tech devices (70% of China’s medical device market) being foreign made. Smaller, less sophisticated domestic producers supply the lower end of the market, but S&P believes that they are making significant market-share gains since they offer their products at a fraction of the price charged by the larger, foreign device makers, and some, such as Mindray Medical International Ltd., are attempting to push into the higher end. The CFAITC sees China’s domestic manufacturers strengthening, while mergers and joint ventures with overseas companies will occur at the lower end of the market. For instance, Medtronic acquired China Kanghui Holdings to leverage its network in second- and third-tier cities, which would add to the company’s reach in hospitals in larger cities.
In any event, while China’s demographics and growing wealth are very attractive to foreign businesses, the market is problematic. The booming economy has created an urban middle class that is eager for better medical care and is driving the government to improve standards. Even though this class represents only a small percentage of the country’s total population, its numbers are large. For the rest of the nation, however, the healthcare infrastructure is extremely weak. According to the US Department of Commerce (DOC), about 700 million of China’s 1.3 billion people did not have any kind of insurance coverage in 2006, and rural residents, which totaled 850 million people, paid for 80% of their medical expenses out of pocket due to the low level of subsidies from the government.
In April 2009, China launched its healthcare reform implementation plan, the New Healthcare Reform, through which the central government will invest $123 billion to improve health services nationwide. The plan includes funds to allow a wide variety and a significant number of healthcare providers—about 20,291 hospitals, 270,000 community health centers, 38,000 central township hospitals, 175,000 clinics, and 633,000 village clinics (as of 2009; figures supplied by the CFAITC)—to afford medical devices. The government was expected to finance the construction of 2,000 county-level hospitals and 5,000 clinics by

22 HEALTHCARE: PRODUCTS & SUPPLIES / JANUARY 2013 INDUSTRY SURVEYS
2012. In June 2012, the healthcare reform office said that it had achieved its mission set for the period 2009–11. Management consultant Pacific Bridge Medical notes that China’s healthcare priorities in 2011 included increased focus on suburban and rural health. This has been verified by trends seen by the publicly traded Chinese medical device maker Mindray Medical International, as voiced in its conference calls with analysts and investors in 2011 and 2012.
In addition, according to China’s 12th five-year plan, passed in March 2011 and covering the years 2011–15, the government is planning to take three initiatives in the medical devices space: bolster the development of China-made medical equipment, implement centralized procurement, and purchase locally manufactured devices. Even so, the proposed price controls in China will be a limiting factor for foreign device makers. In December 2011, the Senate Foreign Affairs Committee warned China against such controls and expressed concerns over the problems they would create for American companies and Chinese patients alike. In July 2012, the State Food and Drug Administration (SFDA) of China tightened its control over the labeling of imported medical devices. The new regulation requires such devices to contain labels in Chinese before entering the country.
…while India and other emerging countries are smaller, yet still fast-growing, markets India, too, is a key market for medical devices. The private healthcare sector in India is expanding rapidly to meet the needs of the country’s growing middle class, a population of about 300 million (according to the DOC), with rising disposable income and increasing medical expectations. India has been working toward establishing a medical device regulatory regime that will distinguish between medical devices and pharmaceuticals; to minimize disparities across regions, greater central government control and involvement in treatment and approvals have been proposed—including the development of price regulations. According to a November 2012 report by Visiongain, India’s medical device market is expected to grow to $11 billion by 2023, from $3 billion in 2011. According to the 12th five-year plan that starts in 2013, the Indian government has labeled pharmaceutical and medical device sectors as priority areas, Pacific Bridge Medical reported.
Demand for high-technology products, such as cancer diagnostic, medical imaging, ultrasonic scanning, plastic surgery equipment, and polymerase chain reaction technologies, is met primarily by imports, which constitute 50% of the medical device market. However, the market is becoming increasingly competitive due to low barriers to entry, the increasing presence of multinational corporations, an increasing number of players, and an expanding consumer base. The medical devices market for exports from India is estimated at about $509 million with a CAGR of 22%. Domestic production consists primarily of low technology products like surgical textiles and other medical supplies. The exports mainly consist of dental instruments, surgical items, and other laboratory equipment. Despite strong growth rates, the market is relatively small, given the very low per capita spending, and the lack of health insurance and healthcare facilities, especially in rural areas, according to the NIPER report.
Meanwhile, in 2010, Frost & Sullivan (F&S), seeing Asia becoming increasingly important as a market and outsourcing hub, forecasted the Asia-Pacific medical device market growing at a CAGR of 10.2%, from $46.5 billion in 2009 to $62.3 billion in 2012. (The region, as defined by F&S, comprises developed and emerging countries: Australia, China, Hong Kong, India, Indonesia, Japan, Malaysia, New Zealand, Philippines, Singapore, South Korea, Taiwan, and Thailand.) In contrast, it sees the total global medical device market expanding at a CAGR of 5.8%, from $203 billion in 2009 to $240.7 billion in 2012. As a result, the Asia-Pacific market will expand from a 23.8% share of the global market in 2009 to a 25.8% share in 2012.
Medical device maker Medtronic has plans to expand its share in the Indian healthcare market and capitalize on the country’s patient pay-based healthcare system. Similar to the strategy that Zimmer is adopting in China, Medtronic wants to employ more local Asian engineers in its R&D process. In response to the rising interest by the foreign device makers, India will have to address issues such as high costs, limited geographical accessibility, and lack of awareness of the latest technologies.
A number of regulatory and other changes are happening in various markets of the Asia Pacific region. Singapore has halved the import fees for some of the devices. It has also reduced regulatory requirements for low-risk medical devices to facilitate their entry. South Korea, on the other hand, has increased the

INDUSTRY SURVEYS HEALTHCARE: PRODUCTS & SUPPLIES / JANUARY 2013 23
disclosure requirements for device manufacturers. The medical device manufacturers now have to release more information regarding such factors as measurement characteristics, how the device operates, expiry date, and storage information. In October 2012, the Association of Southeast Asian Nations (ASEAN), a political and economic organization of 10 countries located in that area, released a draft of its ASEAN Medical Device Directive (AMDD), which aims to enhance and harmonize medical device regulations among its members.
Current prospects mixed in industrialized countries In 2009 (latest available), the US accounted for 41% of the global medical device market, followed by Europe with 32%, and Asia Pacific (including Japan) with 15%, according to market researcher Frost & Sullivan. In Europe and Japan, as in the US, favorable drivers such as aging societies and high standards of living are fueling growth. At the same time, government efforts to clamp down on healthcare spending—in part by reforming reimbursement systems and placing more emphasis on proof of cost effectiveness of new technologies—are constraining the effects of the positive drivers.
According to accounting and consulting giant Ernst & Young’s (E&Y) “Pulse of the Industry: Medical Technology Report 2011,” the medical device markets in the US, Europe, and Japan have witnessed slower growth. However, there are opportunities that exist in unmet clinical needs in these countries.
Many European governments are running severe budget deficits and have embarked on belt-tightening programs. However, their focus has been on cutting the cost of branded and generic pharmaceuticals, so medical devices have been largely exempted so far. One reason, we believe, is that there has been a history of pricing pressure on medical devices, particularly in the orthopedic space, with competition causing prices to decline in the mid- to upper-single digits on an annualized basis. We expect medical devices to undergo additional pricing pressures as new country budget targets are introduced. As a result, some US device makers already note seeing a two-segment market. One is a small, high-end, clinician-driven segment comprising differentiated and innovative products that can command premium prices. The other is an enlarged low-end market comprising older and more-commoditized technologies, where pricing matters. US medical device makers are increasingly focusing on the former.
Various countries are taking measures to regulate the medical device industry due to recent scandals. The European Union (EU) has proposed stricter device rules in the region. The proposed new rules would allow independent regulators to conduct random inspections of device manufacturers and carry out regular product testing. In mid-2012, the UK’s Medicines and Healthcare Products Regulatory Agency (MHRA) conducted raids across the country following reports of fake thermometers being sold.
Japan is a primary example of a market with conflicting influences on demand for medical products. Japan has the world’s second largest medical device market, after the US, with sales of about $25 billion in 2010 (latest available), according to PBM. According to Espicom, the US and Germany are the only countries that import more medical equipment, and Japan is the eighth-highest exporter of medical devices in the world. According to the DOC, as Japan’s elderly population grows and the overall contribution to Japan’s national healthcare system decreases as a result of its shrinking population, the Japanese government will be forced to take additional measures to contain healthcare spending. According to Espicom, Japan has the most expensive medical equipment in the world, due in part to a distribution system that hikes up retail prices with hidden costs. The DOC believes that medical devices used to treat age-related diseases, such as pacemakers, cardiac valve prostheses, and orthopedic implants, will realize a steady growth in demand. Moreover, because there are very few domestic manufacturers in Japan in these areas, the DOC sees market opportunities for US firms making these products to continue for the foreseeable future. The Japanese government is also looking at a proposal to regulate medical devices separately from drugs. The industry players believe that this will accelerate the approval procedure for both new devices and upgrades to existing devices.
Medical device shipments from Japan were interrupted in early March 2011 by the devastating earthquake and its aftermath, including the tsunami and nuclear plant meltdown. Meanwhile, US sales of medical supplies to Japan likely increased as patients affected by the disaster flooded hospitals, according to PBM. However, hospitals that were ruined will not be buying supplies until they are rebuilt.

24 HEALTHCARE: PRODUCTS & SUPPLIES / JANUARY 2013 INDUSTRY SURVEYS
HOSPITAL CAPEX STILL UNDER PRESSURE, BUT SHOWS SIGNS OF A PICK-UP
In addition to the growth of overseas markets and the resulting impact of foreign exchange movements, one of the major factors impacting the medical device industry is the pace and rate of capital expenditures (capex) by acute care hospitals, one of their major customers. Acute care hospitals traditionally have spent a fairly consistent percentage of revenues on capex, but as a result of the recession and the turmoil in the
financial markets, this is changing. Typically, hospitals spend a small percentage of revenues (generally less than 3%) on capex to maintain and operate current facilities. However, hospitals spend a larger portion of their capex budgets to expand and improve facilities and to purchase the latest medical technology, primarily as a means of driving volumes and increasing pricing.
Between 2000 and 2007, capital expenditures for the six leading hospital chains (the five publicly traded hospitals followed by S&P Capital IQ, plus HCA, which went private in 2006 but has publicly traded debt) ranged from about 6.3% of revenues to a high of 7.7% in 2006. Given that less than half of that amount is generally required for maintenance, clearly hospitals were investing for growth.
However, beginning in late 2007 and into 2008, hospitals cut back on non-maintenance capital outlays. Most hospitals’ financial condition began to deteriorate due to increases in uncompensated care, as more people lost their employer-based coverage and could no longer afford to maintain health insurance coverage. Finally, due to the decline in both the equity and fixed-income markets, most hospitals saw a marked decline in the value of their charitable endowments and the amount of non-operating income these charitable endowments generated, which often went to support non-operating budget items.
Reflecting these factors, capex declined to 4.7% of revenues in 2010, from 4.9% in 2009 and 5.9% in 2008, all well below levels seen at the start of the decade. Capital spending rose to 5.2% of revenues in 2011, and consensus estimates of Capital IQ, the business within S&P Capital IQ that provides business and financial information, pegs the ratio at 5.4% in 2012, before turning down again to 5.2% in 2013. The rise in capital spending as a percentage of revenue in 2011 and the further advance seen in 2012 by the healthcare facilities analyst community may be attributed to a number of factors that are not mutually exclusive, in our view. One possible reason is that hospital utilization by the insured population has declined, which can lead to slower growth of hospital revenues, if not actual declines. A second is that the hospital groups have to invest in upgrading their acquisitions. A third is that hospitals have had to focus on the development of an IT system to support electronic health records. We think that the decline in capital spending as a percentage of revenues that the analyst community sees in 2013 reflects not only the completion of most of the IT projects, but also the fact that analysts exclude future acquisitions (and the spending to upgrade the acquired facilities) from their earnings models. Further, S&P Capital IQ estimates for hospital revenues have gone up slightly, which we attribute to firming admissions expectation, though they are likely to remain volatile, and a stable Medicare reimbursement rate outlook for 2013. Finally, a fourth may be that as of 2012, hospitals start reporting net revenue (gross revenue minus bad debt expense, or uncollected revenue); previously, they reported only gross revenue.
In any event, we believe that even amid the decline in capital spending over the last four years and the present recovery, hospitals have become selective in spending for medical devices, focusing first on equipment that could help differentiate services and drive patient volumes. For example, Varian Medical Systems Inc., a leading maker of radiation-oncology equipment, reported strong demand for its new
FacilH01: HOSPITAL CAPITAL EXPENDITURES
0
1
2
3
4
5
6
7
8
9
0
500
1,000
1,500
2,000
2,500
3,000
3,500
4,000
4,500
2001 2002 2003 2004 2005 2006 2007 2008 2009 2010
Capital expenditures (left scale)
Capex as a % of revenues (right scale)
HOSPITAL CAPITAL EXPENDITURES*
*For five publicly held hospital chains and HCA Inc.Source: Company reports.
(Millions of dollars) (%)
INDUSTRY SURVEYS HEALTHCARE: PRODUCTS & SUPPLIES / JANUARY 2013 25
TrueBeam system for image-guided radiotherapy and radiosurgery. Similarly, Intuitive Surgical Inc. reported an increase in sales for its da Vinci robotic surgical systems in the third quarter of 2012. These products help surgeons perform minimally invasive surgery, and are a technologically advanced alternative to conventionally performed surgeries.
Nevertheless, capital spending as a percentage of revenues is below pre-recession levels and we still feel this will be an issue that the device industry will have to contend with through 2013. The healthcare reform law, the Patient Protection and Affordable Care Act (ACA) of 2010, adds a productivity adjustment to the market basket update for certain providers this year, resulting in lower rates than otherwise would have been paid. We project that the most vulnerable areas to the hospital spending budget pullback within our coverage universe will continue to be the more expensive pieces of capital equipment such as robotic surgery systems, radiation therapy equipment, magnetic resonance imaging devices (MRIs) and digital mammography equipment. Within these categories, much of the revenue growth in recent years came through both first time equipment installations and/or multiple installations, either within a single facility or throughout a range of affiliated facilities, partly reflecting hospitals seeking to build their competitive position, we believe. However, product upgrades and rising levels of service/maintenance revenue also generated a substantial portion of the recent growth.
Normally, one would expect reduced new product sales to lead to lower selling prices, which would be reflected in declining gross profit margins. However, we believe many manufacturers have been “saved” by improved production processes and the shift of some manufacturing to low-wage countries, the development of new and next-generation products that also cost less to make, competitive dynamics in the US, and continued rising demand in emerging markets. From our perspective, gross margin performance and management comments regarding their expected direction will remain key indicators regarding the health of the medical equipment group.
Looking beyond the developing trends for the large capital equipment manufacturers, we see evidence that the deterioration in global economic growth has had a materially negative impact on the sale of “pure” medical devices. Based on our observation of the performance of the medical device group during the 2007–09 recession and afterward, we believe implantable cardioverter defibrillators (ICDs), pacemakers, heart valves, cardiac and peripheral stents, and orthopedic joint replacements, are not as well insulated from economic cycles as they had been previously, despite the non-elective nature of the associated procedures. There are also a large number of device categories that are traditionally viewed as elective and, hence, are even more sensitive to economic swings, particularly in the developed markets, such as the US and EU. However, demand for both sets of products has been growing at a healthy pace in the developing, or emerging, markets, which were not affected as much by the recent recession.
Some of the more obvious areas such as cosmetic surgery, orthodontic products, and weight reduction have already shown signs of slower demand and falling unit-selling prices. We also see evidence of slower demand for orthopedic hip and knee replacement surgeries due both to the lack of insurance as unemployment increases (with patients putting off surgeries until pain becomes untenable) and to resistance to high-priced procedures by the insurers. Some medical device manufacturers indicated that they have seen some signs of stabilization and possible recovery, albeit a modest one, in the second and third quarters of 2012. However, we believe it is too soon to view this trend as sustainable. Meanwhile, we also believe demand for certain diagnostic tests, including pap smears, mammograms, and other forms of cancer screening (such as colonoscopies), has fallen, which we believe is at least partially due to the continued economic weakness with patients deferring procedures due to lack of health coverage or their inability to meet co-pays and/or deductibles.
COST CONTAINMENT TO BE MAJOR CHALLENGE OVER NEXT DECADE
As noted above, payers’ focus on healthcare cost containment in the US and overseas presents a key ongoing challenge for the industry. Also of concern is the industry’s ability to maintain R&D productivity, especially given pricing pressures. Cost-containment efforts, even if only moderately successful, affect how the medical products industry markets its products and the nature of the message that the industry communicates to payers, doctors, and patients.

26 HEALTHCARE: PRODUCTS & SUPPLIES / JANUARY 2013 INDUSTRY SURVEYS
Payers are attempting to control spending. Strategies include comparative effectiveness studies and evidence-based medicine, and consumer-driven healthcare (whereby consumers take more responsibility of their own medical costs). Underlying these approaches and often critical to them is the data and analysis provided by healthcare information technology systems (HCIT), that allow all parties involved to obtain the necessary information to research, compare and quantify the cost and quality of treatment for common diagnoses and conditions.
Healthcare information technology and its impact on medical device demand President Obama saw substantial savings from investments in healthcare information technology (HCIT), including electronic health/medical records (EHR/EMR), decision support systems, and computerized physician order entry. These expected savings were the primary impetus behind the up-to-$27 billion investment in HCIT over a 10-year period proposed as part of the American Recovery and Reinvestment Act of 2009 (ARRA). On July 13, 2010, the Centers for Medicare & Medicaid Services (CMS) and the Office of the National Coordinator for Health Information Technology (ONC), a unit of the US Department of Health & Human Services, issued final regulations defining “meaningful use” and setting standard for the electronic health record incentive program.
In essence, an EHR system can make a patient’s health information available when and where it is needed, and clinicians do not have to worry about drugs or treatments prescribed by another provider, so care is coordinated. It can identify safety issues, such as a patient’s drug allergies and inform clinicians whether the drug they would prescribe using the EHR system would interact with another drug the patient is already taking. Linked to the patient’s computer, the system can be used to provide follow-up care for the patient and provide the patient with additional resources. The system can also reduce paperwork time for providers and reduce the duplication of testing.
S&P Capital IQ believes HCIT’s biggest impact on medical device manufacturers will be its utilization to promote evidence-based medicine and to help curtail duplicative testing. In particular, we look for regulators to seek changes to reimbursement systems that promote the sharing and use of existing testing and imaging data where appropriate, as opposed to the current system where incentivizes providers based on the provision of additional tests and procedures.
In addition, we see HCIT as being used in the promotion of evidence-based medicine—allowing researchers to mine databases of patient information to find patterns of best practices. Once these standards are discovered, we look for them to be promulgated around what treatments work best for specific patient diagnoses and what procedures yield the best and most cost-effective outcomes, as well as the communication of these results to patients in the form of quality studies. We also expect patients’ electronic health records to lead to reduced numbers of diagnostic tests. Because EHRs may include results from costly in vitro diagnostic tests and/or copies of diagnostic images from MRI, CT, positron emission tomography (PET), and digital radiography (digital x-ray) scans, practitioners will be prevented from conducting or ordering the same tests or images unless they are dated.
Further, a number of hospitals are looking to invest in new medical device integration (MDI) solutions to achieve higher operational quality. In August 2012, CapSite, a healthcare technology research and advisory firm, released the results of a study in which more than 300 hospitals and vendors across the US were surveyed. According to the study, more than 54% of the hospitals said they plan to purchase a new MDI solution.
The CMS too has used technology to assess beneficiaries’ eligibility for its Medicare program. In response to the Health Insurance Portability and Accountability Act of 1996 (HIPAA), the CMS developed a HIPAA Eligibility Transaction System (HETS) which operates in a 24/7 data processing environment. According to program officials, 244 entities were using HETS in 2012, including about 130 providers, 104 clearinghouses that provide data exchange services to about 400,000 healthcare providers, and 10 Medicare contractors. According to a GAO study released in September 2012, the users of HETS said that the CMS had resolved the issues they were coming across while using the system. For the first six months of 2012, the system has shown an average response time of less than three seconds per transaction.

INDUSTRY SURVEYS HEALTHCARE: PRODUCTS & SUPPLIES / JANUARY 2013 27
COMPARATIVE EFFECTIVENESS RESEARCH: GETTING MORE FOR THE HEALTHCARE DOLLAR
While the primary focus of healthcare reform has been on expanding health insurance coverage, comparative effectiveness research (CER), which seeks to eliminate waste and promote efficiency, is also a major element of health reform and, particularly, as a support for evidence-based practice. President Obama called for support of CER in the American Recovery and Reinvestment Act of 2009 (ARRA), which authorized the expenditure of $1.1 billion by September 2010.
In June 2009, the Institute of Medicine (IOM) issued a priority list of 100 research topics for CER, 24 of which related to medical devices. Previously, medical technology (medtech) products had been largely exempt from the comparative effectiveness research undertaken by the Agency for Healthcare Research and Quality (AHRQ), a US federal agency, and others. We anticipate that it will take several years at least before comprehensive studies can be performed and any conclusions from those studies broadly implemented. While CER findings have the potential to identify savings in the health system and improve patient outcomes, the most effective treatments may not necessarily be the least costly ones.
CER: opportunities and challenges for manufacturers, but not without controversy S&P expects healthcare reform and CER to present both promise and challenges for device and equipment manufacturers. Increased insurance coverage should expand the customer base of cardiology and orthopedic device makers, as well as manufacturers of healthcare capital equipment, but we also expect they will have to consider CER in product development and commercialization, which includes price—all of which could pressure their margins.
While we believe the medical device industry was relieved when IOM recommended to Congress that the new CER studies focus on comparisons of entire treatment regimens rather than narrow comparisons of the particular technologies, we caution that in some cases, CER may call into question the need for expensive technologies for certain indications.
Comparative effectiveness research has stirred controversy. Critics, particularly conservatives, claim that CER findings would lead the government to decide what treatments a patient can or cannot get, while some liberals believe that health insurers can use CER to deny costly but needed treatment to patients. However, proponents say CER will foster more intelligent use of costly medical resources. AdvaMed believes that CER will improve clinical outcomes, but that certain standards should be followed to ensure that CER is conducted in an appropriate way. These include focusing on areas where CER would offer the highest return on investment for the healthcare system; supporting advances in healthcare delivery; transparency; and stakeholder input.
In our view, whether CER yields improved outcomes or adds value in healthcare treatment remains to be seen and may well depend on how it is executed. The Patient-Centered Outcomes Research Institute (PCORI, a nonprofit, non–federal government corporation overseeing CER and created by the ACA) may not mandate coverage, reimbursement, or policy changes. Nevertheless, we would not be surprised if CER findings eventually have an impact on Medicare and Medicaid reimbursement and, likely, private health insurance coverage (perhaps through tiered reimbursements or on pay-for-performance bonus payments). Under such circumstances, we would expect CER to significantly influence future product development and even the sales of certain technologies. While we believe CER could increase the size and costs of clinical trials and, hence, delay the arrival of new treatments on the market, we think it will ultimately lead to devices that are more effective (though not necessarily lower-cost) and fewer “me-too” products.
ECONOMIC, BUDGETARY POLICY ARGUMENTS INFLUENCE COST DETERMINATIONS
In his federal fiscal 2010 budget, President Obama introduced a number of proposals aimed at reining in the spiraling costs of healthcare and the proportion of the budget devoted to healthcare. (Some of the funding in the fiscal 2011 and 2012 budgets had the same goals.) Increasingly, we expect that both the prospect of a ballooning federal budget and the looming bankruptcy of Medicare to be the auspices under which additional controls on healthcare costs would be imposed. Going forward, we expect regulators, relying

28 HEALTHCARE: PRODUCTS & SUPPLIES / JANUARY 2013 INDUSTRY SURVEYS
heavily upon the MedPAC recommendations, to use long-term economic growth and stability, in addition to the traditional arguments of access and affordability, as justifications for cost controls.
A number of these will follow up upon pilot programs instituted under earlier budget acts or Medicare programs. For instance, the Deficit Reduction Act of 2006 (DRA), which Congress passed in February 2006, mandated cuts in Medicare and Medicaid spending of $11 billion over five years and also specified some areas to cut. Diagnostic imaging procedures were hit particularly hard, after critics charged that some providers were performing unnecessary imaging tests. Congress imposed reimbursement cuts that went into effect on January 1, 2007, aimed at saving $2.8 billion through 2012.
The DRA also established a gainsharing pilot program, in which hospitals provide financial incentives to physicians to reduce the cost of caring for Medicare inpatients. Under the current system, hospitals receive a fixed payment for each patient, based on the patient’s illness or diagnosis-related group (DRG). Hospitals use that money to cover the costs of treatment and services. In a gainsharing program, hospitals also establish measures for reducing hospital costs, then give physicians an incentive to participate by paying them a percentage of the savings. Critics charge that gainsharing programs jeopardize patient care and present conflicts of interest for physicians.
Nonetheless, Medicare began a three-year program, known as the Medicare Hospital Gainsharing Demonstration, in 2007, involving six hospitals that aimed to measure improvements in patient care during a patient’s stay and immediately after a patient is discharged from a facility. A separate gainsharing pilot project, the Physician Hospital Collaboration Demonstration, was authorized by Congress in 2003 and also began in 2007. It is much larger, including up to 72 hospitals, and seeks to measure hospital-doctor interactions after discharge to determine the long-term savings potential from greater cooperation and elimination of complications through greater information sharing.
The CMS started a number of bundled payment models under the ACA, which is a departure from the traditional fee-for-service (FFS) payment model. The bundled payment model provides payment for the entire healthcare a patient needs over a defined clinical period, versus payment for each different service used by the patient. A November 2011 article in Health Affairs magazine evaluated the implementation of one such bundled payment pilot model “PROMETHEUS Payment,” a three-year pilot project that was scheduled to end in 2011, and noted that the implementation has faced numerous challenges. (PROMETHEUS was an acronym for Provider Payment Reform for Outcomes, Margins, Evidence, Transparency Hassle-reduction, Excellence, Understandability, and Sustainability.) None of the three pilot sites had made any bundled payments as of May 2011, even though the model had been in place since July 2008 at the first two sites and since August 2009 at the third site. The problems are possibly arising due to the complex nature of the payment model, such as defining what kind of services should be made part of the bundle.
Looking ahead, the ACA seeks to garner savings from the development of “accountable care organizations,” or ACOs, for which the final rules governing them were published by the US Department of Health and Human Services on October 20, 2011. ACOs would be comprised of hospitals, physicians, and other providers, and would be paid by Medicare to cover all Medicare beneficiaries in a given service area. In addition, through team-based practice, ACOs may help alleviate the shortage of primary care physicians by allowing primary care practices to care for larger numbers of patients more efficiently. If the ACO meets quality and cost targets, the hospitals and doctors would share in the savings and possibly receive bonuses. In July 2012, CMS announced that it had entered into agreements with 88 new ACOs (and in January 2013 another 106), thereby increasing the total number of organizations participating in Medicare shared-saving initiatives to 259. According to CMS, as of July 1, 2012, around 2.4 million beneficiaries were receiving care from providers participating in Medicare shared-savings initiatives.
DEMOGRAPHICS CONTINUE TO REMAIN FAVORABLE
Demographics are considered an important factor driving growth in the US medical technology industry. The world’s population is aging, with the birth rate declining and life spans lengthening. According to a study conducted by the United Nations Department of Economic and Social Affairs, Population Division, the share of people aged 60 or above in the world population will double from around 11% in 2012 to

INDUSTRY SURVEYS HEALTHCARE: PRODUCTS & SUPPLIES / JANUARY 2013 29
around 22% in 2050; the number will grow to more than two billion, from nearly 810 million in 2012. Further, this age group will represent 32% of the total population in developed nations by 2050, up from 22% in 2012. However, developing nations’ populations, which constitute around 82% of the total world population and will reach 86% by 2050, are expected to remain relatively young because of high birth rates.
In the US, baby boomers are expected to drive growth in medical goods and services. According to the aforementioned UN report, people aged 60 or above represented around 19% of the US population in 2012, and are expected to reach around 27% by 2050. Most of the increase will occur after 2010 when the first wave of those born during the baby boom generation begins to turn 65. The percentage of people aged 80 or older will constitute 7.9% of the total US population by 2050, up from 3.8% in 2006.
Aging population drives growth for medical equipment manufacturers, as older people are generally more prone to chronic diseases than the younger generation. In the US, around 80% of people aged 65 or above have at least one chronic condition, while 50% have two or more. Further, 19% of this age group has diabetes and 60% has arthritis, which is the leading cause of disability and frequently requires surgical treatment. The elderly also make up a large share of patients who undergo diagnostic imaging procedures, such as magnetic resonance imaging (MRI) and computed tomography (CT).
Increasingly, the industry is eyeing other techniques and solutions aimed at keeping an aging population in good physical and mental shape, as older seniors also seek to maintain active lifestyles. Examples include development of new and simpler medical kits for the home, less invasive treatments, restorative treatments, and approaches to early diagnosis of disease that can lead to early intervention.
However, an aging population places tremendous demands on payers. The Centers for Disease Control and Prevention (CDC), a division of the US Department of Health and Human Services, estimates that the healthcare cost per capita for people aged 65 or older, in the United States and in other developed countries, is three to five times higher than for younger people. Developing countries will face an even greater strain on resources, as their basic public health infrastructures are weaker.
THE EMERGENCE OF CONVERGENCE: UNEVEN AND SOMETIMES CONTROVERSIAL
In some sectors of the medical goods and supplies industry, a transition is occurring from an emphasis on mechanical to biological innovations—or to combinations of the two. This shift, known in industry circles as convergence, incorporates biologically active ingredients into medical devices with the intent to both speed the repair of problems and fully heal them. Convergence is not only leading to new products, it is also stimulating changes in business strategy and industry structure, as engineering-oriented companies scramble to gain expertise in biologics and patents. Device companies are becoming more aggressive about patenting their products, partly because biologics are easier to patent than devices that depend on mechanical innovations.
Therapeutic areas that are ripe for convergence include chronic pain, age-related macular degeneration, heart muscle regeneration, and many diseases that could benefit from site-specific therapies.
One of the most prominent example of convergence in today’s market is in cardiology. Drug-eluting stents (DES) combine a basic metallic stent, which props open a clogged artery, with a drug coating, reducing the rate of inflammation (or restenosis) in the stented artery. Another example, known as orthobiologics, involves the use of biomaterials and other biological products with regenerative capabilities to fuse and stimulate bone growth. This is used in the bone grafts market. There are several companies supplying orthobiologic products, including Baxter International Inc., Johnson & Johnson (through its DePuy division), Medtronic Inc., NuVasivc Inc., and Zimmer Holdings Inc.
Despite the success of DES and rampant discussions about convergence, the field of combination products is still in the emerging stages, with corporate funding still proportionately small. One reason is that combination devices incorporating converging technologies present additional challenges. Two very different businesses—with dissimilar profit structures and financial time frames—need to collaborate, and also need to determine which party possesses the value-defining technology (and therefore is entitled to a bigger cut of returns). In

30 HEALTHCARE: PRODUCTS & SUPPLIES / JANUARY 2013 INDUSTRY SURVEYS
addition, from an investor perspective, convergence technologies combine the risks of drug development with the quite different risks of device development, without decreasing overall risk. If these products involve more market risk than traditional devices, they will need higher prospective returns to attract investors. Indeed, not all product lines involving convergence are successful. In February 2011, Stryker Corp. sold its OP-1 product family for spinal applications, which appears to have fit well within its plan to divest underperforming products and to acquire and/or invest in promising ones. The company kept the rights to seek future use of bone morphogenetic protein, OP-1’s main biologic ingredient, in other product areas, such as osteoarthritis treatment.
MARKET SECTOR NOTES
In this section, we discuss market conditions in four major established categories (cardiology, diagnostic imaging, orthopedics, and in vitro diagnostics, or IVD), and in one emerging product category (vascular diseases and conditions).
Cardiology Heart disease remained the leading cause of death for both men and women in the United States in 2011. Around 596,339 Americans died due to heart disease, according to preliminary data published in the National Vital Statistics Report released by the Centers for Disease Control and Prevention in October 2012. Cardiovascular disease (CVD) is a broad category that includes high blood pressure, heart attack, stroke, congestive heart failure, and other ailments. Although the rate of death attributable to CVD has declined from 1998 to 2011, according to the report, CVD accounted for 23.7% of the total 2,512,873 deaths in the US in 2011.
CVD is a leading cause of death in Europe as well. According to the Annual Report 2011 (published July 2012) of the European Heart Network, an alliance of heart foundations and like-minded non-governmental organizations throughout Europe, cardiovascular disease causes 54% of all deaths in women and 43% of all deaths in men in Europe annually. The report estimates that more than 10 million people in Europe suffer from CVD. It is also becoming more prevalent in emerging markets, where an expanding middle class, urbanization, and the adoption of Western diets are leading to an increase in non-communicable, “lifestyle” diseases, including CVD. Likely as a consequence, Johnson & Johnson estimates that 300 million people worldwide suffer from CVD today and expects the global cardiovascular device market to expand to $41 billion in sales in 2014 from $32 billion in 2009 (latest available).
H03: ESTIMATED COSTS OF CARDIOVASCULAR DISEASE AND STROKE
*Hospital inpatient/emergency
30%
*Outpatient/ office-based visits
12%*Drugs11%
*Home health7%
**Lost productivity/ mortality
40%
COSTS OF CARDIOVASCULAR DISEASE AND STROKE — 2008†
Total: $297.7 billion
†Latest actual data available. *Direct costs. **Indirect costs. Source: American Heart Association.
190.3
34.3 50.6
22.5
297.7
0
50
100
150
200
250
300
350
Heartdisease
Stroke Hyper-tensivedisease
Othercirculatoryconditions
TOTAL
(In billions of dollars)

INDUSTRY SURVEYS HEALTHCARE: PRODUCTS & SUPPLIES / JANUARY 2013 31
According to a June 2012 report published by Infiniti Research Ltd., a market research firm, the global cardiovascular devices market is expected to grow at a CAGR of 5.7% for the period between 2011 and 2015. The main factors responsible for the growth of the market will be the growing number of people suffering from cardiovascular diseases, along with a shift toward minimally invasive forms of surgery from conventionally performed surgeries, which S&P Capital IQ thinks partly reflects the growing use of transcatheter aortic valves used on patients unable to undergo open-heart surgery. (See “Promising medical device technologies” in the “Current Environment” section of this Survey.) However, the market is likely to face pressure from a likely decline in the selling prices of cardiovascular devices. A June 2012 report published by the Millennium Research Group, a medical technology market research firm, also points to the growing demand for transcatheter aortic valve replacement (TAVR). According to the report, the US market for heart valves will grow a staggering 146% from $610 million in 2011 to around $1.5 billion in 2016, primarily driven by the TAVR procedure.
According to another report published by the Millennium Research Group in September 2012, the European heart valve device market is expected to grow 10% per annum through 2016. The report suggested that aging population and higher reimbursements for new technology by some European countries will drive the growth in the transcatheter heart valve device market.
Cardiac rhythm management (CRM) products, which include pacemakers, ICDs, cardiac resynchronization therapy (CRT) devices, and related items, had an estimated $13.3 billion in worldwide sales in 2010, according to Frost & Sullivan, a market research firm. ICDs accounted for slightly under $7.0 billion and pacemakers for some $4.0 billion. From 2000 to 2004, CRM was one of the medical devices industry’s fastest-growing markets, with sales increasing at a CAGR of 16%. However, sales momentum was slowed in 2005 and 2006 due to major product recalls and safety concerns involving the ICD segment of the CRM device market.
Some portions of CRM, such as pacing devices, are mature; this segment is experiencing a slowdown to low-to-flat growth worldwide. CRT has been the fastest-growing cardiology segment, driven by the introduction of new, device-oriented treatments for congestive heart failure. CRTs are available in two forms: CRTs (also known as CRT-Ps) and CRT-Ds. A CRT is a specialized pacemaker, also known as a biventricular pacemaker. Traditional pacemakers have two leads, which regulate the right atrium and right ventricles, two of the heart’s chambers, to maintain a good heart rate and keep the atriums and ventricles working together. A CRT has a third lead to help the left ventricle contract concurrently with the right ventricle. Previously, congestive heart failure was addressed only by drug therapies, although new scientific studies are encouraging for emerging CRM device technologies.
In the cardiovascular devices segment, CRT still appears to be the biggest growth opportunity. About 30% of patients with heart failure could benefit from CRT-defibrillators (CRT-Ds), a relatively new device that combines a specialized pacemaker (to fix abnormal heartbeats) with an ICD (to help prevent sudden cardiac death). The CRT-D is effective in patients who suffer from both congestive heart failure and a condition known as ventricular tachyarrhythmia, a kind of heart arrhythmia previously treatable only with drugs.
According to a study by researchers in the Netherlands (results released in August 2012), ICDs could reduce the number of cardiac arrests caused by ventricular fibrillation. The study found that ICDs prevented 81 cardiac arrests related to ventricular fibrillation between 2005 and 2008 in greater Amsterdam and were responsible for one-third of the decline in cardiac arrests caused by ventricular fibrillation between 1995 and 2008.
Ventricular assist devices, which help weak hearts to pump blood, also are gaining traction for treating heart failure, although the patient base is much more limited. These devices were approved initially for the short term in patients awaiting heart transplant, but now they are used for the long term in patients with severe disease who are ineligible for transplants. Frost & Sullivan estimates that the ventricular assist devices global market was worth $500 million in 2010 and growing at a CAGR of 11%; this would mean a market of more than $1 billion in 2017. Further, the US market accounted for 61% of the global market at $306 million and is expected to grow at a CAGR of 13% to reach $726 million by 2017.

32 HEALTHCARE: PRODUCTS & SUPPLIES / JANUARY 2013 INDUSTRY SURVEYS
According to a November 2011 report released by Transparency Market Research, a market intelligence firm, the global coronary stents market was worth around $6.0 million in 2011 and is forecast to reach $8.3 million in 2016, for a CAGR of 6.6% from 2010 to 2016. The report also states that DES is the market’s leading segment, accounting for 55%–60% of the global market in 2010. The global DES market is expected to reach $5.3 billion in 2016, growing at a CAGR of 9.5% from 2011 to 2016, driven by the expanding elderly population. On geographic terms, the market is growing fastest in the Asia-Pacific region (10%), followed by the US (9%) and Europe (3%).
Beginning with their introduction in Europe in 2002 through 2005, drug-eluting stents have dominated this group of products and provided extraordinary growth. However, growth slowed in 2005 as the US market reached nearly 90% penetration, European penetration got closer to saturation, and competitors began to enter the market for the first time. (See the “Current Environment” section of this Survey for more details on DES.) As a result of safety concerns, US penetration of DES had declined substantially between 2006 and early 2008, but has risen slowly since that time and S&P Capital IQ’s estimates it is now in the mid-70% range.
The global heart valve market includes tissue valves, mechanical valves, and heart valve repair products. Frost & Sullivan (F&S) estimated this market at about $1.9 billion in 2010, of which approximately $400 million in sales came from the newer transcatheter aortic valve (TAV) products available in Europe from Medtronic and Edwards Lifesciences. F&S found the growth out to 2015 hard to predict, since a great deal of its forecast had been dependent on the US commercial launch of the TAV. (For more information on the TAV, see “Promising medical device technologies” in the “Current Environment” section of this Survey.) F&S noted that the traditional valve market is growing with a CAGR in the low-single digits, but adoption of the TAV in Europe has been enthusiastic, with growth to $400 million in three years and it sees equal enthusiasm in the US. More recently, GBI Research, which publishes in-depth strategic intelligence reports in a broad range of business categories, released a report in January 2012 in which it forecasted the global TAV market to grow at a CAGR of 22% from $293.1 million to $1.196 billion in 2017.
Diagnostic imaging Diagnostic imaging can be categorized into nine modalities: X-ray, ultrasound, computed tomography (CT), positron emission tomography (PET), single photon emission computed tomography (SPECT), magnetic resonance imaging (MRI), nuclear medicine (NM), mammography, and fluoroscopy. While x-rays account for the bulk of diagnostic imaging at hospital settings, digital and computed radiography have been rapidly penetrating x-ray markets (including physician and dental offices) because they reduce processing time and produce higher-resolution images at lower radiation. According to research published on May 2011 by healthcare market research firm TriMark Publications, there are about 108 million x-ray exams per year globally. MRI ranks second with 26 million exams per year; and PET, SPECT, CT, and NM rank third with a combined 30 million examinations per year. In a report published in January 2013 by market research company MarketsandMarkets, the global market for diagnostic imaging is expected to grow from $20.7 billion in 2010 to $26.6 billion by 2016, reflecting a CAGR of 4.2%. According to a September 2012 report by Millennium Research Group, the US market for x-ray systems will reach $2.8 million by 2016, growing at a slow rate due to saturation.
� MRI. Although MRI is superior to other imaging modalities for picturing internal organs, total US sales have shrunk in recent years, partly due to market saturation, equipment expense, and the relatively high cost of MRI diagnostic imaging procedures. However, constant innovation and new technologies have ensured moderate growth in the market. An October 2012 report by Transparency Market Research valued the global MRI market at $3.9 billion in 2011and projects the market to grow at a CAGR of 3.5% to reach $4.8 billion by 2017. According to the report, the US will continue to lead the MRI market with a 37.3% share of the global market in 2017.
While device makers have spent time and money to develop cardiac implants that can be safely used for MRI procedures, a new study states that MRI can be safely used for patients with ICDs or pacemakers. According to a study published in the August 27, 2012, issue of the American Journal of Cardiology, the patients on whom the study was conducted survived the MRI procedures with no functional problems reported in their ICDs or pacemakers.

INDUSTRY SURVEYS HEALTHCARE: PRODUCTS & SUPPLIES / JANUARY 2013 33
� CT. As they became becoming increasingly advanced and expanded beyond traditional areas of diagnostic imaging, CT scanners had been a growth product line. According to an October 2012 report released by BCC Research, the global CT market stood at around $3.4 billion in 2011 and would grow to $3.7 billion in 2012. The report estimates that the market will grow at a CAGR of 6.7% to reach $5.1 billion in 2017, with Asia accounting for nearly 43% of the global market.
Frost & Sullivan estimates the total US CT scanners market (excluding hybrid scanners, such as PET/CT and SPECT/CT systems) at $770 million in 2010. It sees the market expanding at a CAGR of 1.9% through 2015, driven by a broadening range of applications. The latest technological developments have not gained traction, due to the absence of clinical evidence to support the extra cost of the newer, more advanced systems; a lack of reimbursement for emerging CT procedures; and the drop in hospital capital spending, says Frost & Sullivan. F&S notes that since 2008, many customers that have stopped making large capital purchases, focusing instead on the equipment upgrades and servicing market; it expects this trend to continue for at least the next few years due to the slow economic recovery and the healthcare industry’s persistent challenges.
� Ultrasound. Meanwhile, given its increasing sophistication, improving image quality, and relatively low cost, ultrasound is being used beyond its traditional applications. In addition, hand-carried ultrasound (HCU) devices are being used increasingly for point-of-patient care globally, though US sales have been limited by reduced hospital spending. According to a March 2012 report by Transparency Market Research, the increase in the number of diseases that can be diagnosed early through sonography means ultrasound will likely get a boost over the next few years: the global ultrasound market, valued at $4.82 billion in 2012, will grow at a CAGR of 5% to reach $6.11 billion by 2017.
� Digital mammography. Another market on the rise is the digital mammography market. According to a January 2012 report released by market research firm GlobalData, the global full-field digital mammography (FFDM) equipment market is forecast to grow at a CAGR of 8% from $801 million in 2010 to reach $1.3 billion by 2017. Further, the report states that the US accounted for around 51% of the market at $407 million in 2010 and is expected to reach $714 million over the next five years. (For information on 3-D digital mammography, see “Promising medical device technologies” in the “Current Environment” section of this Survey.) Note, though, that despite its greater accuracy in detection, the onset of digital mammography appears to have driven breast-screening costs higher, according to a study published in January 2013 in JAMA Internal Medicine. The authors of the study also noted that the higher costs for digital technologies did not appear to lead to lower treatment costs.
A mix of factors in growth outlook for advanced imaging Factors favoring diagnostic imaging growth include advances in technology (including the growing use of hybrid PET/MRI, PET/CT, and SPECT/CT systems), new clinical applications for imaging modalities, the need for replacement systems, and rising demand from developing markets, such as China, India, and Eastern Europe, particularly for HCU devices. According to a July 2011 report published by MarketsandMarkets, a market research firm, the global diagnostic imaging market is expected to grow at a CAGR of 4.2% to reach $26.6 billion by 2016, up from $20.7 billion in 2010, driven by an aging population and development of new techniques. A report released by GBI Research in January 2012 also sees the diagnostic imaging market benefiting from growth in emerging markets and sees the US market suffering from reimbursement cuts, noting it was worth $71.3 billion in 2008 and declined to $61.4 billion in 2010. Even so, in 2010, the US still led the global market, with a 36.6% market share, followed by Europe (27.3%), and Asia (27%), according to the MarketsandMarkets report.
Medicare spending on medical imaging has dropped 13.2% since 2006, according to an analysis of Medicare data done by the Medical Imaging and Technology Alliance (MITA). According to MITA, MedPAC also confirmed that fee-for-service Medicare imaging service utilization declined 2.5% in 2010. Meanwhile, spending for non-imaging Medicare services has grown by 20%, according to MITA. According to researchers at Thomas Jefferson University in Philadelphia, excess radiation exposure and high healthcare costs have forced patients, policymakers, and service providers to shift treatment methodologies. According to the same study, use of nuclear medicine declined at a CAGR of 1.8% between 2007 and 2009, versus growth at a CAGR of 8% between 2000 and 2006. Growth for all three advanced imaging modalities

34 HEALTHCARE: PRODUCTS & SUPPLIES / JANUARY 2013 INDUSTRY SURVEYS
dropped to 1.4% between 2007 and 2009, from 9.9% between 2000 and 2006. Further, at a December 2011 public meeting, MedPAC confirmed the decline in Medicare spending on medical imaging procedures, saying that the drop is consistent with the 2.5% drop in 2010 stated by MITA.
More recently, according to a study from the August 2012 issue of Health Affairs, the growth of advanced diagnostic imaging in Medicare and non-Medicare patients slowed to single-digit rates starting in 2006, a trend that has extended to private payers. Based on claims file data and interviews with healthcare professionals, the researchers found that growth of CT use in the Medicare system fell from an average annual rate of 14.3% in the 2000–2005 period to 1.4% in 2009, while growth of MRI use fell from 14% to 2.6% during the same period. They attributed the deceleration to several factors: required prior authorization for those covered by private insurers, increased cost sharing by insurers and employers, Medicare reimbursement reductions, and fear of radiation exposure. In contrast, however, a study published in the June 13, 2012, issue of the Journal of the American Medical Association, and referenced on AuntMinnie.com, an Internet web site for radiologists and other imaging professionals, imaging use has been growing at HMOs: from 1996 to 2010, the growth rates tripled for CT and quadrupled for MRI. The researchers attributed the increase to expanded clinical applications, patient- and physician-generated demand, and the practice of defensive medicine. A rising concern in the industry however is the heightened health risks associated with exposure to radiation and the rising costs of imaging services to the healthcare system.
In response to the rising concerns around health risks associated with radiation exposure, GE Healthcare has said it would work towards reducing radiation exposure for patients using computed tomography scans by up to 50%. In June 2012, the device maker announced a new program in collaboration with North Shore LIJ Health System to develop a technology that produces high-quality imaging using lower levels of radiation dosage. Under the program, GE Healthcare aims to work with health systems comprising 3,500 hospitals across the US.
At its meeting on April 7, 2011, MedPAC noted the sharp rise in diagnostic imaging volumes. In addition, the top 10% of physicians account for more than 50% of advanced imaging use, and a significant share of this group self-refer. A white paper published by Thomson Reuters reported that 20% to 50% of high-tech scans such as CT and PET should not have been done because their results did not diagnose ailments or treat patients. MedPAC seeks to reduce reimbursement and to require clinicians who order more imaging studies than their peers do to obtain prior authorization for these services. The American Medical Association, a physician trade group, warned that the initiative could reduce payments to primary care physicians and drive imaging services to more expensive hospital settings. In any event, we expect imaging device makers to face pricing pressures from MedPAC and from provisions in the healthcare reform law cutting Medicare reimbursement for imaging procedures, with private health insurers following suit.
More recently, at a meeting on March 8, 2012, MedPAC researchers proposed that Congress should ask the US Department of Health and Human Services (HHS) to start a new Medicare fee-for-service benefit program that would include higher co-payments by patients for advanced diagnostic imaging services. Their thinking was that this would reduce beneficiaries’ exposure to the risk of unexpectedly high out-of-pocket spending by discouraging the use of lower-value services. In other words, this would create “incentives for beneficiaries to make informed decisions about the use of care…and would lower the risk of very high cost-sharing liability.” However, we believe the impact from such pressures to reduce imaging volumes will be outweighed by an expected rise in patient volumes as a result of the healthcare reform law and new imaging applications.
These concerns notwithstanding, the American Association of Physicists in Medicine (AAPM) has cautioned patients not to skip medical imaging tests due to speculation about the risks related to radiation exposure. It also noted that any predictions regarding the effect of low radiation doses should be discouraged, as they scare patients and cause them to avoid necessary tests that could reduce health risks.
Orthopedics According to Johnson & Johnson, a leading player in the orthopedic device market, the global orthopedic market grew 6.4% in 2009 (latest available), to $38.6 billion. Although elective orthopedic surgical procedures have been delayed in the US amid the recession, Johnson & Johnson, projects the global orthopedic device market to reach $53.6 billion in 2014, reflecting a compound annual growth rate (CAGR) of 6.8%.

INDUSTRY SURVEYS HEALTHCARE: PRODUCTS & SUPPLIES / JANUARY 2013 35
The top seven companies in orthopedics hold more than 70% market share. Five of these companies are based in the United States. They are Stryker Corp., Johnson & Johnson’s DePuy division, Zimmer Holdings Inc., Medtronic Inc., and Biomet Inc. Other important global suppliers include Switzerland-based Synthes Inc. (acquired in June 2012 by Johnson & Johnson), and UK-based Smith & Nephew plc.
Among the most common orthopedic surgeries, hip and knee replacement procedures help people suffering primarily from three conditions: osteoarthritis, a common condition affecting more than half of people 65
or older, causing pain in the joints and impairing mobility; rheumatoid arthritis, which destroys cartilage at joint surfaces; and obesity. Sports-related injuries are another catalyst for these surgeries. The younger people who are most prone to sports injuries might not have sought joint replacement surgery in the past. Now, however, new implants specifically designed for them are more durable and improve quality of life. Because older people are more active than in the past, they too are encountering more sports injuries, particularly joint damage and stress fractures.
The Centers for Disease Control and Prevention (CDC) has estimated in its studies that around 43 million Americans are suffering from arthritis and the number of patients will grow to around 67 million (or 25% of the adult population in the US) by 2030. According to a June 2011 report released by GlobalData, a strategic business intelligence provider, the hip replacement implants market is expected to grow to $8.6 billion by 2017, a CAGR of 5% between 2010 and 2017. Within the hip replacement implants market, primary hip replacement is the key segment, estimated at around $4.7 billion in 2010. The segment is expected to reach $6.8 billion in sales by 2017, growing
at a CAGR of 6% between 2010 and 2017. Another report by GlobalData on the knee-replacement implant market estimates its value at around $6.9 billion in 2010 and expects it to grow at a CAGR of 6.8% to $10.9 billion by 2017. Further, industry experts at a conference of the American Academy of Orthopedic Surgeons in February 2012 estimated a low single-digit growth rate for the hip and knee implant market in 2012, with pricing pressures expected to continue in 2012. Owing to weak economic conditions, the market is not likely to rebound strongly.
The spinal products market, which includes cages, rods, and screws used in spinal fusion procedures, has declined. Demographics and new, non-fusion technologies, such as motion preservation technologies, artificial disks, nucleus replacement, and dynamic stabilization devices, are driving demand. Because of its attractive prospects and profitability, the field is attracting start-ups interested in innovating, which could lead to M&A activity down the road, in our view. On December 19, 2012, GBI Research, a market research firm, released a report that forecasts the global spinal surgery devices market will reach $8.7 billion by 2018, from $6.5 billion in 2011, at a CAGR of 4%.
Chart H06: ORTHOPEDIC IMPLANT MARKET SHARES
Medtronic (SDG)33%
J&J13%Synthes
11%Stryker
8%
Nuvasive6%
Globus4%
Zimmer3%
Biomet3%
Others18%
ORTHOPEDIC IMPLANT MARKET SHARES—2011(In percent)
SPINE
Total: $7.4 billion
Totals may not add due to rounding.Source: Stryker Corp.
Zimmer25%
J&J21%Stryker
20%
Biomet12%
Smith & Nephew
12%
Others11%
Total: $13.9 billion
RECONSTRUCTIVE
36 HEALTHCARE: PRODUCTS & SUPPLIES / JANUARY 2013 INDUSTRY SURVEYS
S&P believes that people 65 years of age or older, who are covered by Medicare, account for a greater percentage of the spine market than they do of the large joint–reconstruction market, and because the senior population continues to expand, so, too, should the spine market. The growth in the European market for spinal devices would be aided by demographics, although there will be headwinds in the form of budget cuts and lower reimbursements. According to a June 2012 report released by the Millennium Research Group, the European spine implant market is projected to grow slowly, reaching $755 million by 2016. Meantime, in a report dated September 2012, the Millennium Research Group expects the US spinal implant market to also show modest growth, reaching a value of slightly over $5.5 billion in 2016.
In vitro diagnostics One of the largest medical products segments, in vitro diagnostics (IVD), totaled $44 billion in global sales in 2011, and is expected to grow at a CAGR of 7.8% from 2011 to 2016, according to a January 2012 report published by MarketsandMarkets. According to the report, the US accounted for the largest share of the global IVD market in 2011 (47%), followed by Europe (31%). Further, according to another report by iData Research, a market research and consulting group, the US IVD market is expected to grow at a CAGR of 2.5% by 2017.
IVD refers to testing systems used to analyze blood, urine, tissue, or other body fluids to detect diseases or predisposition for diseases, or to test for health status. The systems consist of reagents or tests (chemicals) and analytical instruments (capital equipment). Companies sell or lease the instruments to hospitals, clinics, physicians’ offices, and independent clinical laboratories; they also can place them in customer sites at no charge, making money on the ongoing revenue stream from reagents. The reagents mix with patient samples, and the instruments perform the analysis and interpretation of results.
While most basic laboratory segments are mature, particular kinds of tests are growing rapidly. The greatest near- to mid-term opportunities are in cardiac testing, human immunodeficiency virus (HIV) testing and monitoring, and new molecular diagnostics.
Molecular diagnostics are based on genetic analysis of patient samples and offer greater accuracy than conventional tests, albeit at much higher prices. This category, which did not exist 10 years ago, had global sales of almost $4.1 billion in 2010, according to Frost & Sullivan, which sees it expanding at a 12% CAGR to $6.2 billion in 2015, S&P Capital IQ believes it is the fastest growing subsector in IVD. Many new molecular tests are in development, making future prospects for the subsector excellent. Roche Diagnostics, Gen-Probe Corp., Siemens Healthcare Diagnostics, and Abbott Laboratories are the four leading suppliers of molecular tests.
A rapidly growing area within the IVD arena is companion diagnostics, which are protein or genetic tests used to identify if patients will benefit from particular treatments. This field is being driven by the growth of “personalized medicine,” which is being encouraged by pharmacy benefit managers and health insurers as a way of finding the most effective and, hence, likely least costly treatment for each individual patient. One area of growth is personal genetic tests, which has stirred some controversy. In March 2011, a Food and Drug Administration (FDA) advisory panel said that genetic tests directly marketed to consumers should be allowed only under a doctor’s supervision. That’s because personal testing, which is mainly available from firms operating outside traditional medical institutions, can produce ambiguous or misleading results without proper analysis. Indeed, in May 2011, the FDA formally warned three small providers of direct-to-consumer DNA tests about medical claims the companies make that the agency has not approved.
Strong drivers of IVD sector growth include tests for whole blood glucose, chlamydia and gonorrhea, HIV-AIDS, cholesterol, diabetes/glucose, HER2 (Human Epidermal growth factor Receptor 2, a protein associated with more aggressive breast cancer), Strep-A, and C-reactive protein (CRP). These also are among the most profitable subsegments. They are expected to exhibit annual growth rates in the low teens over the next few years, particularly buoyed by increasing prevalence of chronic and infectious diseases, and the continuous introduction of new products, including more complex immunochemistry tests and those for point-of-care testing (including consumer self-testing). In addition, we think that more hospitals will embrace IVD for screening patients amid rising concern about hospital-acquired infections.

INDUSTRY SURVEYS HEALTHCARE: PRODUCTS & SUPPLIES / JANUARY 2013 37
The IVD business is fairly concentrated. According to Frost & Sullivan, the top five companies held roughly 59% of the market in 2009 (latest available). Roche Diagnostics Corp. (a subsidiary of Roche Holdings AG) was No. 1 (19.9% market share), followed by Siemens AG (12.3%), Johnson & Johnson (11.2%), Abbott Laboratories (9.0%), and Beckman Coulter Inc. (7.2%). Other players include Bayer Diabetes Care (4.6%), bioMerieux (3.7%), Sysmex (2.9%), Alere (2.6%), Becton Dickinson (1.8%), Instrumentation Laboratory (1.5%), Qiagen (1.2%), Radiometer (1.2%), Gen-Probe Inc. (1.1%), and all others (19.8%).
The industry is thriving, helped by a steady stream of new (in some cases, proprietary) products, better reimbursement, and the increasing practice of personalized medicine. In addition, the emerging countries provide a promising market for IVD. Market researcher Kalorama figures that increased demand for healthcare services led by testing should enable IVD sales to the BRIC countries (Brazil, Russia, India, and China) to grow from $2.9 billion in 2009 to $5 billion in 2014, representing a CAGR of 12%.
In February 2012, the Global Harmonization Task Force (GHTF) proposed several guidelines, explaining to various companies the different factors they should consider in deciding which studies they should conduct while undertaking clinical performance evaluations for their in vitro diagnostic devices. The task force had put out these guidelines inviting comments until June 2, 2012. The GHTF is a partnership formed among the regulatory authorities of the European Union, the US, Canada, Australia, and Japan, and the medical devices industry that seeks greater uniformity among national regulatory systems.
In July 2012, the UK Medicines and Healthcare Products Regulatory Agency (MHRA) issued a new guidance document for notified bodies on how to review the design and label of IVDs to be used by patients for self-testing. In September 2012, the European Commission issued a proposal to revise the IVD regulations to add a risk-based approach to the current regulatory mechanism. The European Parliament and Council is likely to implement the proposal in 2014.
Vascular diseases and conditions The vascular category is considered a promising area by manufacturers in which they can extend their patient treatment capacity to both arterial and venous diseases and aneurysms. The highest profile segments are peripheral vascular disease, abdominal aortic aneurysms, and blood clots.
� Peripheral vascular disease (PVD). Also known as peripheral arterial disease (PAD), this is a condition where atherosclerotic plaque builds up in the arteries outside the heart, which can lead to thickening of blood vessel walls or blood clots, similar to what happens in the coronary arteries. The main factors causing this disease are hypertension and atherosclerosis, which are also the main causes for most cardiovascular diseases. PVD generally affects between 12% and 20% of American population aged 65 and older as per the Society of Interventional Radiology (SIR), a professional medical society. The majority of products on the market for PVD are guidewires, catheters, balloons, and stents; these are used to clear blocked peripheral arteries. Major companies in this segment are Johnson & Johnson (Cordis division), W.L. Gore & Co., Boston Scientific, Edwards Lifesciences Corp., Abbott Laboratories, and Medtronic.
� Abdominal aortic aneurysms (AAAs). This condition is caused by a weakened area in the aorta, the main vessel that supplies blood from the heart to the rest of the body. When blood flows through the aorta, an aortic wall that is abnormally weak bulges like a balloon. If the balloon grows large enough, it can burst. Ruptured aortic aneurysms result in death in 80% to 90% of cases. According to the SIR, AAAs are the seventeenth leading cause of death in the United States, accounting for more than 15,000 deaths each year.
Ruptures can be prevented if AAAs are caught early and treated. The problem is that, in most cases, patients have no disease symptoms. More efforts are underway to identify people at risk of rupture earlier and treat them with new procedures involving the replacement of the diseased portion of the aorta with a synthetic graft. Leading innovators in this market include Abbott Laboratories, Medtronic, and Boston Scientific.
� Blood clots. Another vascular segment of interest to medical device manufacturers is the treatment of blood clots, generally in the venous system in the lower extremities and the lungs. The principal focus is on two conditions: deep vein thrombosis (DVT) and pulmonary thromboembolism (PT). The incidence of DVT runs as high as two million patients a year, according to the American Heart Association, and up to 20% of

38 HEALTHCARE: PRODUCTS & SUPPLIES / JANUARY 2013 INDUSTRY SURVEYS
patients with DVT develop PT at some point. Patients for whom DVT becomes a recurring problem require the insertion of a vena cava filter; producers include Boston Scientific, Johnson & Johnson, and C.R. Bard Inc. In March 2012, Covidien received FDA approval to market its revascularization device, the Solitaire FR. For patients suffering from acute ischemic stroke, the device will be used to remove blood clots from blocked vessels to restore blood flow to the brain. The product received the Conformité Européene (CE) marking in Europe and has been selling internationally since November 2009; it hit the US market in April 2012.
HOW THE INDUSTRY OPERATES
The medical products industry is extremely diversified—it is actually several related industries, supplying hundreds of thousands of products. The Federal Food, Drug, and Cosmetic Act of 1938 defines a medical device as “an instrument, apparatus, implement, machine, contrivance, implant, in vitro reagent or other similar article that is intended for use in the diagnosis of disease or other conditions, or in the cure, mitigation, treatment, or prevention of disease.”
Medical products can be divided into two categories: conventional devices, which have little technological differentiation and a wide variety of uses; and high-technology products, which depend on cutting-edge science to address highly specific therapeutic and diagnostic applications.
Items in the first category, conventional devices, are sold based on price to professional buyers representing institutions. Their margins tend to be narrow, and manufacturers depend on high sales volumes for profits. Intravenous products, anesthesia items, surgical apparel, traditional wound dressings, kits, trays, and a wide range of other products fall into this first category.
Items in the second category consist of more technologically advanced products that can command premium pricing if they demonstrate clinical utility and face limited competition. Manufacturers profit from the attractive margins of these products, at least until competitors catch up—an evolution that is invariable, given the weakness of patents in the medical device field. Implantable cardiovascular and orthopedic devices, advanced wound care management, and some surgical instruments fall into this second category, as do a few in vitro diagnostic tests.
The major segments of medical supplies and products are cardiovascular, orthopedics, wound care, in vitro diagnostics, diagnostic imaging, and surgical instruments. Large corporations with global scale—including Medtronic Inc., Baxter International Inc., Johnson & Johnson, and Becton, Dickinson & Co.—dominate these fields, offering comprehensive lines of conventional hospital supplies and high-tech products. Small and mid-sized companies, however, can find opportunities in selected niches, particularly those that depend on innovation. Medical device manufacturers share common end markets, such as hospitals, physicians, and other healthcare providers, and they are subject to third-party reimbursement.
Nearly all of the world’s leading medical products manufacturers are based in the United States; only a handful of foreign companies have major influences on the industry. Of these, Smith & Nephew plc (headquartered in London) and the diversified conglomerates Royal Philips Electronics NV (Amsterdam) and Siemens AG (Munich) are among the largest.
CONVENTIONAL SUPPLIES VERSUS THE HIGH-TECH SECTOR
Conventional hospital supplies—such as kits, trays, gloves, gowns, syringes, and disposables—typically are highly price sensitive, comparatively easy to manufacture, and sold in large volumes to institutional healthcare providers. New members into this segment of the business face low barriers to entry, intense competition, and subsequent low margins. Success for this business model usually requires obtaining long-term supply contracts with hospital chains, nursing homes, health maintenance organizations, and other large-scale institutional healthcare providers. For major diversified companies, these product lines provide steady cash flow that helps to fund investments in the development and commercialization of high-tech products.

INDUSTRY SURVEYS HEALTHCARE: PRODUCTS & SUPPLIES / JANUARY 2013 39
However, most of the world’s top medical device manufacturers devote considerable resources to developing sophisticated and technologically differentiated therapeutic and diagnostic devices, instruments, and analytical tools. While these products tend to require substantial research and development (R&D) and regulatory review before they go on the market, their inventive technology and ability to address previously unmet medical needs make them less vulnerable to competition and better able to command premium pricing. Recent examples include CRT for patients with certain kinds of heart failure; polymerase chain reaction (PCR), an analytical tool used by laboratories to analyze genetic material efficiently; hip resurfacing prostheses; and longer-lasting knee implants.
CRT-D is a relatively new kind of therapy for heart failure patients who suffer from irregular heartbeats and poor muscle contractions; it combines the capabilities of a pacemaker, which helps coordinate irregular heart muscle contractions, with a defibrillator that can send electrical shock signals to the heart to correct abnormal rhythms. For arthritis patients, hip resurfacing is a less invasive alternative to total hip implants; it involves replacing only the surface of the hip joint, thereby preserving more bone. Strong patents on PCR enabled Roche Diagnostics, a subsidiary of Roche AG, to become the leader in molecular diagnostics and keep out competition for more than a decade; however, patents with this much clout are the exception rather than the rule in the medical products arena.
Small companies often lay the foundation for innovative work in the medical device field. These companies have flexibility and close ties to researchers, and they do not stand to lose much by developing a new product that replaces existing technologies. Because of the time and risk involved in designing successful high-tech products, large, well-funded medical product manufacturers tend to buy the small companies or ink out alliances with them. As a result, the larger companies are often the chief suppliers (either directly or indirectly) of most breakthrough medical devices.
Products in one category of medical supplies sometimes evolve over time into another. For example, classic wound dressings, a mature sector, are slowly being replaced by faster-growth, higher-margin advanced wound care materials that incorporate biologically derived materials to stimulate healing. Another example is bare metal stents (i.e., stents that are not coated by anti-inflammatory drugs). These began as high-value innovative products facing little competition, but subsequently came under intense pricing pressure as patent controversies were resolved, new players entered the market, and more effective next-generation technology caught on. The successor product, drug-eluting stents (DES), grew to a market of $5.4 billion in 2006 from nothing in 2002. The market declined until early 2008, but began to expand afterward, albeit slowly. (For detailed information on the history of the DES market, see the “Current Environment” section of this Survey.)
INNOVATION: A HALLMARK OF INDUSTRY GROWTH
New products drive growth in the medical device industry. Fueled by aggressive spending on R&D, a plethora of sophisticated new medical instruments has come on the market in recent years.
R&D spending varies significantly among medical device makers. In general, companies that make conventional hospital supply items do not invest much in R&D. Those that pursue cutting-edge, high-tech innovation maintain the highest R&D levels; overall, the medical technology equipment group plows an average 9% to 11% of annual revenues back into R&D, versus 3% to 4% for all US manufacturers.
Ideas for new devices come from many sources and develop in many ways. Unlike pharmaceutical companies, device manufacturers working on new products often collaborate closely with their customers, seeking input on applications and design from the earliest stages. Physician-inventors sometimes approach companies with ideas either for completely novel products or for ways to improve existing ones. Studies have shown that up to 80% of important scientific instrument inventions originate from users, not from product manufacturers. Academics are also sources of information, but they may have less incentive to commercialize their ideas. To help design improvements, companies often solicit feedback from practitioners who use their products.
Engineering, electronics, and material sciences are necessary skill sets within medical device companies. Specific sectors of the industry may require additional expertise as well, such as physics for medical imaging

40 HEALTHCARE: PRODUCTS & SUPPLIES / JANUARY 2013 INDUSTRY SURVEYS
equipment, computer science for automated laboratory instruments, and biology and pharmacology for tissue engineering and development of drug-device combination products, such as drug-eluting stents.
Device development is generally faster and less costly than pharmaceutical development. R&D for devices is largely focused on incremental improvements to existing products, rather than the introduction of completely novel technologies. Pacemakers are in their tenth generation; in each succeeding generation, incremental improvements are added. Product life cycles are shorter, and so are payback periods. As a result, devices often appear to be less risky investments—but successful devices rarely garner rewards as huge as those for blockbuster drugs.
REGULATION: THE FDA’S ROLE
The US Food and Drug Administration (FDA) is the principal federal agency responsible for protecting the public from unsafe or ineffective products. The FDA today employs more than 9,000 people who monitor the manufacture, transport, storage, importation, and sale of foods, drugs, medical devices, and cosmetics. Sales of these items total more than $1 trillion annually.
Manufacturers must obtain FDA approval of their products before they can sell them in the United States or export them abroad. (The FDA does not regulate devices that are both made and sold abroad by US companies.) The agency requires medical device manufacturers to provide extensive documentation of their products’ safety and effectiveness before granting approval. The FDA has the authority to encourage (or even force) manufacturers to recall products, restrict approvals of manufacturers’ new products, suspend the sale of items that it believes to be harmful, and levy fines and penalties on companies that violate its regulations within US borders.
The agency’s origins The Federal Food, Drug, and Cosmetic Act of 1938 laid the foundation for federal regulation of medical devices by enabling the FDA to prosecute people who misuse or misbrand devices for commercial purposes. Although this law was important, it did not require manufacturers to get FDA approval before launching new products into the market, as pharmaceutical manufacturers had to do.
This situation changed during the 1970s, when the public became increasingly concerned about the malfunctioning of many new medical products, such as pacemakers, heart valves, intrauterine contraceptive devices, and other items. To address these concerns, Congress passed comprehensive watershed legislation in 1976, establishing a new regulatory system, with the strictness of regulatory controls based on the level of risk associated with a given product.
Medical Device Amendments of 1976 Under this law, the FDA reviews all new medical devices for safety and effectiveness before granting marketing approval. Manufacturers must give the agency data supporting their claims for their devices; the amount of evidence required depends on the degree of risk to the patient using the device. Depending on their potential risks, devices fall into one of three general classifications for new submissions.
� Class I. These devices include commodity products, such as stethoscopes and surgical scalpels, which pose relatively little patient risk. Makers of these products need only register their manufacturing facilities and list their products with the FDA, notify the agency at least 90 days before they start marketing the devices, and conform to good manufacturing practices (GMPs). Established by the FDA, GMPs set standards for ensuring manufacturing quality.
� Class II. This group includes devices that entail a moderate degree of risk to the patient. Examples include x-ray machines, endoscopes (used to view body cavities and internal organs), and surgical lasers. Manufacturers have to provide the FDA with some evidence of safety and efficacy and meet certain performance standards; in addition, they are responsible for postmarket surveillance and maintenance of patient registries.

INDUSTRY SURVEYS HEALTHCARE: PRODUCTS & SUPPLIES / JANUARY 2013 41
� Class III. This group of technologically sophisticated products entails significant risk to patients and must undergo extensive clinical trials before FDA review. Included in this category are many devices, such as implantable cardiac pacemakers, angioplasty catheters, stents, and similar devices that are used to support life or prevent potentially dangerous medical conditions such as heart attacks and cardiac arrhythmias.
The Safe Medical Device Act of 1990 The Safe Medical Device Act of 1990 (SMDA) offered additional protections to the public. It established new FDA rules requiring manufacturers to ensure that new products are safe and effective, especially in the areas of premarket approval and postmarket surveillance. Although manufacturers and importers of medical devices have been required since 1984 to report to the FDA all device-related deaths, serious injuries, and certain malfunctions, investigations have revealed widespread abuse or underreporting.
Under the SMDA, manufacturers and “device user facilities” must report deaths and serious injuries that a device may have caused (or to which it may have contributed); they also must establish and maintain adverse event files. A device user facility is defined as a hospital, ambulatory surgery facility, nursing home, outpatient treatment facility, or outpatient diagnostic facility that is not in a physician’s office.
Once a product is on the market, the ability to detect actual adverse incidents is very low. At the same time, however, the greatly increased number of people using the device may expose safety problems that were undetectable in controlled clinical trials.
The SMDA also created the Humanitarian Device Exemption (HDE). This exempts a device manufacturer from conducting clinical trials on products that have been shown to be reasonably safe and present a probable benefit for a US patient population of fewer than 4,000.
The FDA Modernization Act of 1997 Following years of industry pressure to streamline the FDA’s regulatory system for medical devices, Congress passed legislation in the fall of 1997 designed to make the new device approval process more efficient. The bill exempted low-risk Class I devices from certain filing requirements, allowed outside third-party experts to review certain Class II medium-risk devices, and freed up valuable FDA review time for high-risk but potentially more lucrative Class III devices.
The Medical Device User Fee and Modernization Act of 2002 Signed into law in October 2002, MDUFMA amended the Federal Food, Drug, and Cosmetic Act of 1938, providing the FDA with new responsibilities, resources, and challenges. The law has three particularly significant provisions:
� Fees. The law established user fees for premarket reviews of medical devices to fund the review of device applications. The premarket review process also includes reprocessed single-use medical devices.
The user fees were reauthorized in 2007, under the Medical Device User Fee Amendments of 2007, known as MDUFA II, which was part of the larger Food and Drug Amendments Act of 2007. (The FDA’s authority to collect fees was first authorized by Congress under the Medical Device User Fee and Modernization Act of 2002, or MDUFMA.) MDUFA II allowed the FDA to collect fees in new categories starting in fiscal 2008. It included an annual registration fee for all medical device manufacturers, reprocessors, and sterilizers registered with the agency. In exchange for the new fees, the amounts companies are required to pay for pre-market approvals (PMAs), 510(k) clearances, and biologic applications were reduced (though annual hikes in each category were allowed). In exchange, the FDA was tasked with reducing review times to benchmarks set in the MDUFA II. According to a July 2010 financial report to Congress by Department of Health & Human Services Secretary Kathleen Sebelius, the FDA met MDUFA II goals for 510(k) clearances, but not all PMA goals.
With the MDUFA II expiring in 2012, Congress passed, and the President signed into law, MDUFA III in early July 2012, following extended negotiations between the FDA and the medical device industry. (For further information, see “MDUFA III Agreement” in the “Current Environment” section of this Survey.)

42 HEALTHCARE: PRODUCTS & SUPPLIES / JANUARY 2013 INDUSTRY SURVEYS
� Inspections. Accredited third parties conduct inspections of manufacturing facilities under carefully prescribed conditions.
� Rules for reprocessed devices. The law established new regulatory requirements for reprocessed single-use devices, including a new category of premarket submissions that has become known as the premarket report. These devices are defined as those originally intended for one use, or for a single patient during a single procedure, which have been previously used and subsequently reprocessed.
In 2007, President Bush signed legislation that reauthorized the regulatory requirements for reprocessed single-use devices. It was part of a broader bill, The Food and Drug Administration Amendments Act of 2007, which affects many other FDA programs.
The long road to approval Medical devices—most of which, in contrast to pharmaceuticals, do not have a systemic biological interaction with the body—generally are not required to undergo as stringent a review process as pharmaceuticals before commercialization. To get on the market, manufacturers generally must undertake one of two kinds of filings, either a premarket notification or a premarket application. In addition, those working on the most complex devices need an investigational device exemption (IDE), which is an FDA approval to use those devices in clinical trials.
� Premarket notification. Commonly known as 510(k), this is the more common filing and applies to devices that are substantially similar to approved products already on the market. For some Class I, most Class II, and many Class III devices, 510(k) notifications must be filed at least 90 days prior to the launch of new products into the market. Many Class I products are exempt from the 510(k) review process, although other regulations apply.
In a 510(k) filing, applicants must compare the safety and efficacy of their devices to similar products already on the market and back their claims with evidence. The FDA has established criteria for the nature of the supportive data required, depending on the degree of risk associated with the device. In most cases, descriptive data and a labeling review are enough, but a few devices may require clinical studies to support a 510(k). The FDA reviews 510(k) submissions and gives marketing clearance (rather than formal approvals) to those that it accepts. In January 2011, the FDA released its recommendations for an updated 510(k) approval process to be implemented. (For details, see “A stricter 510(k) product approval process ahead?” in the “Current Environment” section of this Survey.)
� Premarket application (PMA). For Class III medical devices that employ novel methods of treatment and are not similar to currently marketed devices, manufacturers must submit a premarket application to the FDA. A PMA is much more complex and time-consuming to prepare than a 510(k). The submission typically contains a significant quantity of clinical and animal testing, as well as manufacturing and other data—all of which the FDA carefully scrutinizes. Hence, the costs for clinical trials via the PMA process are substantially higher than the 510(k) process (as it existed when this Survey went to press in mid-January 2010): even simple trials can cost anywhere from four to 10 times more, according to industry sources.
After a PMA is submitted, an FDA scientific advisory panel, consisting of physicians, researchers, and other experts in related fields, evaluates the product. They may hold a public meeting, during which the PMA application is reviewed and discussed. After evaluating the device, the panel will recommend whether the product is approvable. Although the FDA is not bound to follow the panel’s recommendations, it tends to give them considerable weight. All told, the PMA process often takes 18 months to two years, while the 510(k) process can take as little as three to six months.
� Investigational device exemption (IDE). Manufacturers must file IDEs to get FDA permission to use their devices in clinical trials that will support a PMA filing. If granted, this exemption lets a manufacturer conduct limited human clinical trials (typically involving fewer than 100 people) using the device.

INDUSTRY SURVEYS HEALTHCARE: PRODUCTS & SUPPLIES / JANUARY 2013 43
OVERSEAS REGULATION
Non-US regulatory requirements for new medical devices vary significantly. Many developing countries—particularly those in Latin America and Asia—have minimal regulatory oversight. Japan, Australia, and most Western European countries, in contrast, have protocols that are broadly similar to those in the US: they establish criteria for approval based on the device’s risk to the patient and the commercial availability of similar devices.
The time required to obtain marketing rights in foreign nations also ranges from months to years. Some nations permit human studies earlier in the product development cycle than the United States; other countries, such as Japan, have standards very similar to those of the FDA.
In the European Union (EU), medical devices and products need a Conformité Européene (CE) marking before they can be sold. The CE marking indicates that a product conforms to EU standards for safety, construction, and performance. Member states select oversight organizations—either government or private—to review supporting data and grant a CE marking. A product with a CE marking can be sold in any EU country and does not require separate approval from individual countries. Although the EC device regulatory process is becoming more stringent, it traditionally has been less demanding than that of the United States; it also differs from the US process technically. Moreover, because it is newer, it tends to be more subject to interpretation.
Three European Commission (EC) directives and their updates outline the criteria for granting CE markings. The first directive (issued in 1990) covers implantable devices; the second (1993) applies in general to medical devices, including those that incorporate human blood or plasma; and the third (1998) is specific to in vitro diagnostics. The directives require greater scrutiny for some devices than others, based on safety risk, the amount of time the product is in contact with the human body, and the device’s degree of invasiveness. Products with the lowest risk need the least safety data, while the riskiest products have to undergo clinical trials and meet other stringent requirements.
Several classifications are or have been controversial. In 2003, for example, the EC moved breast implants from Class IIB, a medium-risk category, to Class III, which requires the greatest premarket scrutiny. In May 2007, the EC also instituted a regulation covering the approval and marketing of advanced therapies engineered from human tissue. This directive took years to wind its way through the political process due to controversy over whether to categorize certain products as devices or drugs.
PROHIBITIVE BARRIERS TO ENTRY
The medical device industry has high barriers to entry compared with other US industries. Economic, regulatory, and legal obstacles stand in the way of potential new competitors. Small and mid-sized manufacturers often have to go up against powerful large device manufacturers when competing for contracts with large hospital supply purchasing collectives, individual clinical sites, and physicians’ offices.
Significant R&D expenditures are required for the device discovery and development process. Would-be rivals usually have a tough time dislodging existing products that are already accepted as safe and effective, unless the new device proves to be significantly better or more affordable. In many industry sectors, physicians tend to have long-standing loyalties to favorite brands or sales people, and they do not readily change to alternative manufacturers selling similar products.
Regulatory barriers include lengthy animal and human clinical tests and voluminous documentation required by the FDA before submission of a new device application. To launch a new device successfully, a company must also have manufacturing site clearance from the FDA and a well-established marketing network to distribute the product to key institutional and physician buyers.
Protective patents Makers of innovative medical devices can protect their products through US and foreign patents. Patent protection can cover highly novel technologies, as well as incremental improvements to existing products

44 HEALTHCARE: PRODUCTS & SUPPLIES / JANUARY 2013 INDUSTRY SURVEYS
and even manufacturing processes. More than 75,000 medical device patents have been filed with the US Patent and Trademark Office over the past 30 years.
Patent specifications are generally less precise for medical devices than for pharmaceuticals, which leads to much litigation throughout the industry. Many medical technology firms are involved in some type of patent infringement action with competitors; in order to resolve challenges and get their products on the market, companies often cross-license the rights to each other’s patents.
Medical product companies are less reliant on patents than are drugmakers; however; their patents are weak and easy to circumvent, and the product life cycles are short. Manufacturers develop new technologies that render older ones obsolete even before patents expire on older technologies. While manufacturers of pioneer pacemakers and angioplasty catheters, for example, received 17-year patents for their original offerings, technological advancements quickly made those products obsolete and the patents of little value in preventing new competition. The rapid evolution of technology, while weakening an individual patent, also creates opportunities for more disputes.
Overseas patent protections vary by country. Some nations do little to enforce patents; as a result, their domestic markets are flooded with copycat products, which discourages innovation. These nations tend to have few domestic companies that invest heavily in R&D, and foreign companies are not willing to supply them with their state-of-the-art patent protected products. Thus, intellectual property protection is a key element of US and international trade negotiations.
The World Trade Organization (WTO), a global forum for international commerce, set the minimum length of member countries’ international patent rights at 20 years from the date of filing of a patent application (effective in mid-1995). Previously, patents in the United States lasted 17 years from the date the patent was granted; elsewhere, patent terms varied by country, and patents did not exist in many developing countries. While most industrial countries comply with WTO guidelines, developing nations that are members of the WTO have several years to meet these criteria. China and India, two of the fastest-growing device markets, came into compliance with WTO guidelines in 2001 and 2005, respectively, but are still in the process of building a framework for patent laws and enforcement. Other developing countries with market potential are moving more slowly and have not yet come into compliance.
Product liability: a major concern Medical device companies have recently faced increased product liability risks for injuries allegedly resulting from the use of their products. Although most companies protect themselves with product liability insurance, their coverage does not absorb the entire risk for their most widely used products. Thus, many firms must assume some risk themselves.
A US Supreme Court ruling in June 1996 dealt a setback to the device industry in product liability issues. The court ruled that device makers could be sued for injuries, even if the FDA had approved the product for safety and efficacy. In a well-publicized case, Dow Corning Corp. declared bankruptcy in May 1995 to protect itself from numerous lawsuits stemming from its past sales of silicone breast implants, which had been discontinued.
The subject of silicone breast implants has remained particularly controversial. In November 2006, the FDA reapproved silicone gel-filled breast implants made by two companies, noting that a decade of studies showed no convincing evidence that the implants are associated with severe side effects, such as connective tissue disease or cancer. As a condition of the approval, the companies, Mentor Corp. and Allergan Inc. (formerly Inamed Corp.), must conduct rigorous postmarket studies, following 40,000 women who receive implants for at least 10 years.
The Biomaterials Access Assurance Act of 1998 gave important legal protections (including a general grant of immunity) to device manufacturers’ raw materials suppliers in liability lawsuits alleging faulty implants. Tort cases can determine supplier liability only if plaintiffs can prove one of three narrow exemptions: that the supplier was the manufacturer of the implant and registered as such; that the supplier was the seller of the implant (i.e., it resold the implant after it had been manufactured); or that the supplier provided
INDUSTRY SURVEYS HEALTHCARE: PRODUCTS & SUPPLIES / JANUARY 2013 45
materials that differed from what the manufacturer agreed to buy or failed to meet certain specifications and such failures caused the injury. These protections should encourage materials and parts suppliers to return to the implantable device market, but do not protect manufacturers from liability.
A VARIED AND COMPLEX CUSTOMER BASE
In the medical products sector, as in other parts of the healthcare industry, decision making for the purchasing process is often complex and varied, and the people making buying decisions may or may not be the end users or the payers. Hospitals, physician offices, clinics, clinical laboratories, nursing homes, and standalone imaging centers may have dedicated administrators who select suppliers for most items; the users of the products selected are physicians, nurses, or patients, and the payers may be the offices involved or insurance companies.
Purchases of commodity supplies often are dictated by long-term contracts. In some cases, the buyers negotiate the contracts directly with manufacturers. Often, however, hospitals and integrated delivery networks (IDNs; groups of hospitals that are either jointly owned or independent but aligned for purchasing purposes) belong to group purchasing organizations (GPOs), which negotiate contracts with suppliers. GPOs can often use the combined leverage of all of their members to obtain substantial price discounts on products in exchange for guarantees of a minimum number of orders. The contracts can be on a product-by-product basis or cut across broad groups of products. Hospital members do not have to accept GPO contracts, but the GPOs often offer the best deals. GPOs can try to achieve further discounts by cutting the number of suppliers on their contracts for particular product categories, sometimes to one (an exclusive contract) or two choices.
With high-tech, cutting-edge products, exclusive or semi-exclusive GPO contracts often do not work. Hospitals have had great difficulty countering physicians’ individual preferences for certain brands regardless of cost; surgeons, in particular, have enormous clout in purchasing decisions. GPO contracts in these situations may be used but on a nonexclusive basis, which results in terms that are not always as good as they might have been with exclusive contracts. Manufacturers are well aware that continual introduction of new technologies keeps surgeons loyal to particular brands and makes them less likely to consider cost a priority when advocating for specific products. We believe this trend may change as hospitals increasingly buy up physicians’ practices amid the advent of new rules of healthcare reform.
REIMBURSEMENT ISSUES
Hospitals, outpatient centers, and physicians’ offices represent the primary end markets for medical devices. Because these providers rely on third-party insurers for payment, however, reimbursement is a critical issue. Manufacturers almost always have to obtain attractive reimbursement coverage for their devices and for physicians if their products are to succeed. Reimbursement rates affect not only a product’s overall success, but also its rate of adoption by clinicians.
Indirectly, the US government’s Centers for Medicare & Medicaid Services—which partly reimburses at least two-thirds of US hospital admissions—is a major customer for medical devices. Under the federal diagnosis-related group (DRG) system, CMS pays hospitals a set amount for each Medicare patient, based on the patient’s diagnosis and other specifics of the disease.
The current fixed-fee schedule does not take into account the hospital’s actual costs of treating the patient. Standards established for Medicare and Medicaid usually have a strong influence on overall reimbursement decisions by health maintenance organizations and other cost-conscious managed care insurers. (See the “Industry Trends” section of this Survey for a discussion of the impact that recent changes to Medicare reimbursement have had on hospitals.)

46 HEALTHCARE: PRODUCTS & SUPPLIES / JANUARY 2013 INDUSTRY SURVEYS
KEY INDUSTRY RATIOS AND STATISTICS
� National healthcare expenditures. The Centers for Medicare & Medicaid Services (CMS) publishes a wide range of data on US healthcare expenditures, including historical data and governmental projections. The bulk of these data are available on the CMS Web site (www.cms.gov). The data are structured by kind of expenditure, such as hospital care, physician care, or drugs and other medical nondurables.
According to CMS projections released in June 2012, US healthcare spending is expected to almost double by 2021, reaching nearly $4.8 trillion and accounting for 19.6% of GDP (up from 17.9% in 2010). The CMS projections assumed spending growth to be 3.9% in 2011, matching the 3.9% seen in 2010 (latest actual) and then grow at a slightly higher 4.2% in 2012, before decelerating to 3.8% in 2013. The slowdown in 2013 reflects a combination of consumer cost sensitivity related to low income growth, employer efforts to control costs, several prescription drug patent expirations, the scheduled 30.9% physician payment rate reduction mandated under the Sustainable Growth Rate formula and an additional 2% payment reduction across all providers from the sequester under the Budget Control Act of 2011. As this Survey went to press, the American Taxpayer Relief Act of 2012, which was passed by Congress on January 1, 2013, and signed by President Obama on January 2, suspended the physician payment rate reduction, delaying it by one year, and delayed the budget sequestration by two months. In any event, the CMS sees US healthcare spending growth accelerating to 7.4% in 2014, mainly reflecting the major coverage expansions from the Patient Protection and Affordable Care Act. Overall, US health spending per capita was projected to approximate $14,103 in 2021, up from $8,402 in 2010. �
� Public spending. Changes to spending levels and reimbursement rates for Medicare and, to a lesser extent, the much smaller federal Medicaid program can have a significant impact on the healthcare products and supplies industry. The changes are especially important for makers of expensive, high-tech products, because Medicare sets reimbursement codes for device categories, and these codes affect pricing for large segments of their markets. The CMS estimates that spending by federal, state and local governments represented 44.9% of total healthcare expenditures in 2010 (latest actual) and is projected to reach 49.2% of total spending by 2020 (latest projected).
According to the CMS, federal Medicare expenditures in 2011 rose 5.0% to $549 billion. According to actuarial estimates in the 2012 Annual Report of the Boards of Trustees of the Federal Hospital Insurance Trust Fund and the Federal Supplementary Medical Insurance Trust Fund, Medicare spending is expected to rise at a compound annual growth rate (CAGR) of 6.2% from 2012, reaching $1.005 trillion by 2021. The CMS projects combined federal and state Medicaid spending to more than double from $401.4 billion in 2010 to $957.4 billion in 2021 (a CAGR of 8.2%), accounting for slightly more than 20.0% of US healthcare spending by that time.
� Consumer price index (CPI). The CPI is compiled by the Bureau of Labor Statistics (BLS), a fact-finding agency within the US Department of Labor. This index tracks price inflation in key segments of the economy, including medical care. The medical care component is further subdivided according to various products and services.
Table B05: PROJECTED NATIONAL HEALTH EXPENDITURES AND SELECTED ECONOMIC INDICATORS
PROJECTED NATIONAL HEALTH EXPENDITURES AND SELECTED ECONOMIC INDICATORSITEM 2012 2013 2014 2015 2016 2017 2018 2019 2020 2021National health expenditures (bil.$) 2,809 2,916 3,130 3,308 3,514 3,723 3,952 4,207 4,487 4,781
Private health insuranceexpenditures, total (bil.$) 776 800 864 920 982 1,039 1,096 1,166 1,239 1,314
Gross Domestic Product (bil.$) 15,697 16,387 17,223 18,205 19,224 20,243 21,296 22,318 23,345 24,395Health expenditures as % of GDP 17.9 17.8 18.2 18.2 18.3 18.4 18.6 18.9 19.2 19.6Health expenditures per capita ($) 8,953 9,214 9,808 10,272 10,818 11,360 11,955 12,618 13,346 14,103U.S. population (mil.) 314 316 319 322 325 328 331 333 336 339
Under 65 272 273 274 276 277 279 280 281 282 28365 and older 42 44 45 46 48 49 51 52 54 56
Source: Centers for Medicare & Medicaid Services.

INDUSTRY SURVEYS HEALTHCARE: PRODUCTS & SUPPLIES / JANUARY 2013 47
According to the BLS, the overall medical care CPI-U (CPI for all urban consumers) advanced 3.2% in 2012 and the medical equipment and supplies CPI-U grew 1.2%, versus a 1.7% increase in overall CPI. In 2011, the medical care CPI grew 3.5% and the medical equipment and supplies CPI grew 0.3%, versus a 3.5% increase in overall CPI. As of January 2013, Standard & Poor’s Economics (which operates separately from S&P Capital IQ) was projecting the overall US CPI to rise by 1.5% in 2013.
� Research and development (R&D) as a percentage of sales. With new devices representing the lifeblood of the medical technology industry, changes in R&D spending can have an important impact on future trends in sales and earnings. These statistics are available from individual company reports. The companies followed by S&P Capital IQ’s equity analysts devote around 9% to 11% of sales to R&D, on average, although the range is wide—from 5% to 15%. Although 10% is about double the percentage of the average industrial company, it is below the historical average of approximately 15% of sales spent by the pharmaceutical industry. �
� Foreign currency exchange rates. The leading medical device makers derive about half of their total sales from foreign customers, although the percentage varies significantly among the players. Manufacturers carefully monitor fluctuations in the value of the dollar relative to foreign currencies, because such changes can have a substantial impact on their sales and earnings.
A rise in the value of the dollar against other major world currencies lowers sales and earnings, because it means that foreign sales translate into fewer dollars, assuming that all other variables remain constant. A stronger dollar also makes US goods more expensive abroad and foreign-manufactured products more competitive in the United States. In 2011, the US dollar weakened through the first half of the year, but started strengthening in the second half. It continued to strengthen throughout most of 2012 and, as a result, US medical device companies were hurt by unfavorable currency movements. As of mid-January 2013, Standard & Poor’s Economics expected the dollar to strengthen through mid-2014 and to weaken afterward.
� Interest rates. Major medical device makers, like most other large corporations, closely monitor changes in interest rates, as those rates affect the cost of capital expansion projects, acquisitions, stock repurchases, and dividends. In September 2012, the Federal Reserve Open Market Committee maintained a Fed funds rate of 0%–0.25%, the level it has held since December 2008. Standard & Poor’s Economics sees little likelihood of any changes in the Fed funds rate before the economy shows clearer, firmer signs of recovery.
HOW TO ANALYZE A MEDICAL DEVICE COMPANY
The commercial success of a new medical device does not come easily. A manufacturer must invest heavily in R&D, obtain product approval from the US FDA, get clearance for reimbursement by Medicare and private-sector managed care payers, and achieve acceptance of the product in key hospital and physician markets. Leading companies also need global marketing capabilities and must compete effectively with foreign device manufacturers.
RESEARCHING THE BUSINESS
In analyzing a medical device company, first look at the business. Following are some important questions to ask.
� What are the company’s principal products? Most leading companies offer both commodity medical products and proprietary items. Proprietary items, especially high-tech devices, have high margins when they are introduced, since competition is relatively thin or, in some instances, nonexistent.
Margins are typically lower on commodity-type products that have been on the market for a long time, though cash flow from these products helps to support R&D. Indeed, investors and analysts generally do not assign as much value to this important revenue stream as they should, since cash flow from these

48 HEALTHCARE: PRODUCTS & SUPPLIES / JANUARY 2013 INDUSTRY SURVEYS
product lines, while important to the aims of the organization, is not seen as a growth area. However, these revenue streams tend to have a high level of consistency and help to fund working capital requirements.
� What are the growth dynamics of core business lines? For companies participating in the medical device industry, sales growth is influenced by several factors, including pricing, foreign currency fluctuations, the establishment of insurance reimbursement, and marketing prowess. With relatively short life cycles and volatile market share swings evident in many categories, it is important to determine whether a company has the ability to sustain growth within given product areas, including its core competencies, and whether it is likely to achieve attractive returns on new areas of investment.
� How does the company rank within its principal markets? While size is important to all businesses, its significance is heightened in the medical product areas. Large firms usually have the financial resources to support the R&D expenditures needed to move experimental devices through the discovery, testing, and regulatory filing stages. These companies also have the funds to maintain the large sales forces needed to market products in key domestic and foreign areas. Large suppliers are increasingly attractive to consolidating hospital and physician clinics, because they can provide a full range of products, often on a volume-discounted basis.
� How efficient is manufacturing? Being the low-cost producer in a competitive segment of the medical device industry often makes the difference between success and failure. This is especially true as governments worldwide are seeking to rein in healthcare costs by limiting reimbursement, and, in some countries, controlling the pricing of medical products. Many Western medical products companies are outsourcing manufacturing to countries with low production costs, mostly in Latin America and the Far East. Tax credits provide an incentive to manufacture in regions—such as Ireland and Puerto Rico, for example—which previously had been ignored by major foreign manufacturers.
� Have R&D efforts been productive? Most leading technology-oriented medical device makers spend between 8% and 12% of their sales dollars on R&D programs. However, their success in creating lucrative new medical products differs markedly. For example, Medtronic Inc. has maintained dominance in cardiac pacemakers by investing heavily in new technologies that have spawned a steady stream of state-of-the-art products. These successes notwithstanding, the company is also channeling significant R&D toward emerging technologies in spinal repair, diabetes management, and electronic patient management systems.
Generally, the larger, well-funded firms have a decided advantage in developing new medical technologies. They can typically afford to hire top scientists and conduct more of the costly clinical trials necessary to obtain FDA approval of their products.
In a market dominated by managed care and the US government (via Medicare), a key determinant of success is a manufacturer’s ability to develop new devices that are both therapeutic breakthroughs and cost effective. New products that provide essentially identical results to existing therapies are not as likely to achieve commercial success.
� To what extent has the firm diversified abroad? The United States remains the most important market for US medical device makers, as well as for many foreign-based firms. Even so, the US industry generates about half of unit shipments from foreign markets. Without representation in key markets such as Germany and Japan, as well as in developing nations, a company faces the risk of relying on an increasingly price-competitive US market. However, for firms with international business, foreign exchange fluctuations have an impact on revenues and gross margins. Although generally transitory in nature, these fluctuations must be considered in near-term revenue and earnings projections.
� How effective is the company in working with the FDA? All medical devices sold in the United States must first be cleared by the FDA. Therefore, firms must be able to work with the agency and understand its criteria. Here again, size and experience can help. While most large, well-established medical products manufacturers are adept at working with the FDA, smaller and newer firms are less proficient and often encounter major snags in seeking approval for their products.

INDUSTRY SURVEYS HEALTHCARE: PRODUCTS & SUPPLIES / JANUARY 2013 49
� Is management astute at making strategic acquisitions? Many companies seek to grow through acquisitions as part of a broader effort to fill out product lines and reposition themselves as “one-stop shops” for hospital-supply buying collectives and other large purchasers of medical products. In a relatively mature industry, mergers and acquisitions are viewed as an important method of sustaining both revenue growth and margin expansion.
� Have alliances been fruitful? Analysis of a major producer’s strategic alliances with smaller start-ups and development-stage device makers also can provide clues to future growth prospects. Leading companies, such as Johnson & Johnson, Medtronic, and Boston Scientific Corp., have benefited from acquisitions and alliances with development-stage companies. The smaller firms are typically eager to align themselves with big producers, which can provide them with funds to finance needed clinical trials and eventually to commercialize their products. Many companies also maintain relationships with scientists at leading medical colleges or other organizations, such as the federal government’s National Institutes of Health. These connections can be helpful in developing new products.
ANALYZING FINANCIAL STATEMENTS
When comparing the financial statements of medical device companies, some key financial figures and ratios to examine are sales, operating margins, pretax and net returns, return on equity (ROE) and return on assets (ROA), and cash flow. The balance sheet also provides some useful measures.
� What are sales trends? Was growth generated through volume, pricing, acquisitions, or through some combination of the three? To what extent are foreign currency translations built into forward revenue expectations? The analyst should look for growth that is sustainable and should evaluate the company’s ability to fuel growth over future years. In both cases, it is critical for the company to have proprietary cost-saving technologies. Patent protection also can be key.
� How healthy are operating margins? Medical products companies typically have high operating margins, reflecting their value-added products and the industry’s generally high barriers to entry. (Operating margins comprise earnings before interest, taxes, and nonrecurring expenses, expressed as a percentage of sales.) Therapeutic and diagnostic products tend to command the highest margins, as shown by the performance of market leaders such as Medtronic, St. Jude Medical Inc., Boston Scientific, Zimmer Holdings Inc., and Stryker Corp., which have historically generated operating margins in the range of 25% to 30%.
The industry’s high margins also reflect relatively low raw material and selling, general, and administrative (SG&A) costs. R&D costs are often quite high, and substantial expenses are incurred in developing a device. Once those costs are covered, however, the bulk of revenues flow to the bottom line.
A company’s SG&A and R&D expenses must be compared with industry averages. Margins of established firms should at least match industry norms. Companies in the development stage, however, typically invest heavily to build R&D, production, and marketing infrastructures, and thus are likely to have lower-than-average operating margins.
� What are pretax and net returns? Medical products companies have above-average pretax and net income returns. Reasons for these lofty margins include successful product innovation; favorable unit pricing; high R&D productivity; the benefits of expanded manufacturing capabilities in lower taxed locations such as Ireland, Puerto Rico, and, to a lesser extent, Costa Rica; and general operating cost disciplines enacted by most of the major industry participants.
� What are the company’s ROE, ROA, retention rate, and reinvestment rate? Return on equity (ROE), or net earnings as a percentage of average stockholders’ equity, is a key measure of managerial effectiveness in the medical device industry. Generally, the more sophisticated and value-added a company’s product mix is, the higher its ROE.
Those medical device manufacturers that operate in the higher-technology markets, such as Abbott Laboratories, St. Jude Medical, Stryker, and Medtronic, generated ROEs that averaged about 19.5%–

50 HEALTHCARE: PRODUCTS & SUPPLIES / JANUARY 2013 INDUSTRY SURVEYS
22.0% a year between 2006 and 2011. For companies with a more commodity-oriented sales mix, ROE often can fall into the low double-digit or even high single-digit area.
Sometimes, ROE ratios can be misleading, as in the case of a firm that had its equity depleted by a sustained period of losses. Thus, analysts also look at a company’s return on assets (ROA), a ratio that measures earnings against total assets, which do not fluctuate in value as much as stockholders’ equity does.
Another important financial measure is the retention rate (net earnings minus dividends, divided by net earnings), which reveals the percentage of earnings available for reinvestment in the business. Companies that finance growth through reinvested earnings tend to be among the most profitable. The reinvestment rate (ROE times the retention rate) is another tool for evaluating a company’s growth potential.
� How healthy is cash flow? Analysts and corporate finance directors often refer to “free cash flow” as a measure of the company’s operational strength, and one that can help remove some of the manipulations built into per-share earnings calculations. Essentially, free cash flow reveals how much cash is available after deducting all operating costs and capital expenditures from revenues. This free (or discretionary) cash flow figure tells investors the level of excess cash that an organization is generating. This cash can be used in various ways, including common share buybacks, special dividends, acquisitions, debt paydowns, and the like. Ultimately, analysts seek to project free cash flows in future years and discount these flows at an appropriate rate to determine the current value of these future cash streams.
� Looking at the balance sheet. An analysis of current assets and liabilities gives an indication of the firm’s short-term financial health. This is usually less of a concern for an established firm than for a smaller start-up. For example, if the start-up’s experimental product takes longer than expected to develop, the firm might run low on cash and need external financing to continue operating. A useful tool in testing liquidity is the current ratio, which is calculated by dividing current assets by current liabilities. When this ratio dips below 1.0, it can be a danger signal.
Given the rapidity with which many high-tech medical devices and diagnostic instruments become obsolete, it is also important to check inventory levels. When inventory levels rise at a faster pace than sales, it may signal that the company being analyzed is building inventory for future sales. Alternatively, it may indicate that older products simply are not moving. The inventory turnover ratio (cost of goods sold divided by average inventory) measures the speed at which inventories are sold.
EQUITY VALUATION
The process of assigning a value to the stocks of medical device companies is similar to that applied to stocks in other industries. Many analysts utilize comparative price-to-earnings (P/E) ratios and price-to-earnings growth (known as PEG) ratios. One may set an average target P/E or PEG ratio for the group, based on the membership and/or earnings growth prospects one sees, and set the individual company target P/E or PEG ratios above or below the average set for the group, based on where one expects the performance and/or risk level of the company to be versus what they would be for the group as a whole. The analyst may sometimes base valuations on P/E and PEG comparisons with those of the S&P 500 or S&P 1500 SuperComposite indices. Another useful method is Discounted Cash Flow, which arrives at a stock price by deriving the net present value of future cash flows. The problem we see here is that the net present value is really the stock’s current intrinsic value, not a value one would see 12 months hence.
Another comparative technique involves using the ratio of enterprise value (market cap, or the number of shares times the share price, plus debt, minority interest, and preferred shares, minus total cash and cash equivalents) to the company’s EBITDA (earnings before interest, taxes, and depreciation and amortization). Finally, one could use a variety of methods and derive an average target price.
The difficulty in making valuation comparisons of medical device companies is that they are not all alike. Some medical device companies specialize in either orthopedic or cardiology devices, some in diagnostic imaging devices, some in dental products, while most mid- and large-cap companies under our analytical research have diversified product lines, with the diversification varying by company. �

INDUSTRY SURVEYS HEALTHCARE: PRODUCTS & SUPPLIES / JANUARY 2013 51
GLOSSARY
Angioplasty—A surgical procedure that employs a balloon catheter threaded into a constricted blood vessel to widen it and improve blood flow.
Atrial fibrillation (AF)—A condition in which the heart beats irregularly and rapidly. It is not life threatening, but can lead to other heart disorders and increases the risk of stroke. More than two million people in the US have experienced AF, according to the Heart Rhythm Society.
Blood gas monitors—Instruments that determine the levels of oxygen and carbon dioxide in a patient’s blood. These levels must be monitored during the administration of anesthesia and in other operating room procedures.
Breakthrough device—A medical instrument that employs novel technology to treat or diagnose medical conditions. Typically, such devices target medical problems for which no other therapy is available.
Cardiac catheterization—A technique used to assess heart vessels by threading a catheter (a thin tube) through a patient’s blood vessels into the heart.
Cardiac pacemaker—A device that supplies electrical impulses to the heart to keep it beating at a regular rate. It consists of a small electronic device and a power source connected to the heart by electrical wire.
Cardiac resynchronization therapy (CRT)—Implantable device used to correct certain kinds of abnormal heart rhythms (in which the heart’s left and right ventricles are unable to contract in the proper sequence) that are associated with congestive heart failure.
Cardiac rhythm management (CRM)—A field of cardiovascular medicine that deals with the diagnosis and treatment of abnormal heart rhythms. It includes but is not limited to rhythm abnormalities, such as tachycardia, atrial and ventricular fibrillation, and ventricular dyssynchrony.
Clinical trials—Studies that must be performed before a new medical device or drug can be approved by the US Food and Drug Administration (FDA). The new product is administered to humans in a controlled setting in order to determine its safety and efficacy.
Computed tomography (CT)—A diagnostic technique that employs x-rays and a computer to produce cross-sectional images of body tissue; also known as computed axial tomography, or CAT scanning.
Coronary bypass—A surgical procedure in which an artery or vein taken from another part of the patient’s body is used to create an alternative passage around narrowed or blocked heart arteries.
Defibrillator—An electronic instrument that delivers a brief electric shock to restore normal rhythm to a malfunctioning heart. Implantable cardioverter defibrillators are implanted in the patient and programmed to deliver the shock automatically if the heart rhythm malfunctions, while external defibrillators are administered manually.
Evidence-based medicine—The systematic use of the best current clinical expertise linked to the best available scientific research to make medical decisions. Its increasing use in the development of medical guidelines for treating various diseases means it affects the use of many medical devices.
Gain-sharing—An arrangement in which hospitals give physicians who help to reduce costs of patient care a percentage of the savings, as incentive for helping hospitals to achieve their budgetary goals. By law, the cost-saving efforts cannot have a negative effect on patient care.
In vitro diagnostics (IVD)—Tests performed on samples taken from the body (blood, urine, tissue, saliva, or other substances) in order to identify abnormalities that indicate disease. (In vitro translates literally as “in glass.”)

52 HEALTHCARE: PRODUCTS & SUPPLIES / JANUARY 2013 INDUSTRY SURVEYS
In vivo diagnostics—Tests, performed in or on a body, that do not involve extracting samples from the patient. These often use imaging techniques (such as an MRI scan or x-ray), but other technologies (such as infrared sensors or external biosensors) also work in specialized circumstances.
Magnetic resonance imaging (MRI)—A diagnostic technique that provides high-quality cross-sectional anatomical images of organs and structures in the body using short bursts of a powerful magnetic field, rather than x-rays or other radiation.
Medicaid—A joint US federal/state program that pays for medical treatment for low-income patients, as well as nursing home services for the indigent elderly. Overseen by the Centers for Medicare & Medicaid Services (CMS).
Medicare—A federally funded US national health insurance program for persons aged 65 and older, as well as for all disabled persons. Overseen by the CMS, Medicare is the single largest health insurer in the United States.
Minimally invasive surgery (MIS)—Surgery that requires the least amount of incision in the body. In certain situations, it is as effective as conventional surgery, but also faster, cheaper, and has less recovery time for the patient. MIS techniques are used in surgeries of the heart, colon, and gastric and vascular systems, as well as in orthopedics and urology.
Percutaneous coronary intervention (PCI)—A procedure in which a thin tube or catheter is threaded from the femoral artery through blood vessels to the heart muscle in order to relieve blockages or obstructions in those vessels. It can be done alone or in conjunction with stenting, relieving pain caused by the blockages (angina), and preventing or minimizing heart attacks.
Positron emission tomography (PET)—A specialized imaging technique that uses short-lived radioactive substances to produce three-dimensional images of metabolic activities in the body for diagnostic purposes.
Premarket approval (PMA)—The formal filing submitted to the FDA by device makers seeking approval to market an innovative (Class III) product—one that is not similar to anything already on the market. The document must contain clinical evidence of the device’s safety and efficacy.
Premarket notification/510(k) filing—A submission made to the FDA by a manufacturer of a new product that is substantially equivalent to products already on the market.
Stent—Tiny tubes made of wire mesh that are implanted into an artery, providing the necessary scaffolding to hold the artery open and ensure proper blood flow. Used primarily in coronary arteries, stents are increasingly being used in peripheral (noncoronary arteries) as well. The stent procedure has become common, and is sometimes used as an alternative to coronary artery bypass surgery. Stents can be made of plain metals (bare-metal stents) or metals coated with a thin layer of an anti-inflammatory drug (drug-eluting stents). �

INDUSTRY SURVEYS HEALTHCARE: PRODUCTS & SUPPLIES / JANUARY 2013 53
INDUSTRY REFERENCES
PERIODICALS
AdvaMed Smart Brief http://www.advamed.org Free, daily e-newsletter highlighting the day’s important news stories about the medical devices and diagnostics industries. Includes access to a useful archive and links to articles printed in a variety of publications.
Health Affairs http://www.healthaffairs.org Bi-monthly journal covering public policy issues related to healthcare.
IN VIVO Magazine: The Business and Medicine Report http://www.elsevierbi.com/publications/in-vivo Monthly trade publication analyzing strategies, technologies, and deal-making activities in the biopharma, medtech, and diagnostics industries.
JAMA: The Journal of the American Medical Association http://jama.jamanetwork.com/journal.aspx Weekly; publishes medical research papers on a wide range of topics, as well as commentary from industry experts and physicians.
MDDI: Medical Device & Diagnostic Industry http://www.mddionline.com A monthly publication that covers medical product design, manufacturing, marketing, and regulatory affairs.
MassDevice http://www.massdevice.com An online journal of the medical devices industry, with daily and sometimes more than once-a-day news coverage.
Medical Device Daily http://www.medicaldevicedaily.com Daily; covers current events within the medical technology industry.
New England Journal of Medicine http://www.nejm.org Weekly professional medical journal; contains detailed scientific articles on medical treatments and health issues.
MARKET RESEARCH COMPANIES
Frost & Sullivan http://www.frost.com Market research firm with a division devoted to the analysis of global and regional healthcare industries, including medical technologies, life sciences, and devices.
IHS Global Insight http://www.ihs.com Economic research and forecasting company with a division devoted to analysis of global healthcare economies and trends. Primarily focused on the pharmaceutical industry, but provides insight into global and regional healthcare infrastructures, economics, and regulations.
BOOKS
The American Medical Association Home Medical Encyclopedia New York: Random House/ The Reader’s Digest Association, 1989 Illustrated encyclopedia of technical medical terms.
Harrison’s Principles of Internal Medicine, 17th Edition New York: McGraw-Hill Medical Publishing Division, 2008 Comprehensive reference guide concerning a broad range of disease states and associated treatment protocols.
Health Devices Sourcebook Plymouth Meeting, PA: ECRI http://www.ecri.org Annual guide to medical devices, manufacturers, and distributors.
TRADE AND PROFESSIONAL ASSOCIATIONS
Advanced Medical Technology Association (AdvaMed) http://www.advamed.org Represents manufacturers of medical devices and similar items in legislative, regulatory, and related matters.
American Heart Association (AHA) http://www.heart.org Nonprofit volunteer health organization with a mission to reduce disability and death from cardiovascular disease and stroke. Publishes a wide range of statistics on these diseases and their treatments.

54 HEALTHCARE: PRODUCTS & SUPPLIES / JANUARY 2013 INDUSTRY SURVEYS
American Hospital Association (AHA) http://www.aha.org Represents hospitals and healthcare networks in national health policy development, legislative and regulatory debates, and judicial matters.
American Medical Association (AMA) http://www.ama-assn.org The largest physician organization in the United States, the AMA represents its members in legislative, economic, and scientific matters.
Medical Device Manufacturers Association (MDMA) http://www.medicaldevices.org Represents independent makers of medical devices and related products.
National Electrical Manufacturers Association (NEMA) http://www.nema.org Represents electrical products firms, including makers of medical products; publishes industry shipment data for goods such as diagnostic imaging and therapeutic equipment. Many professional medical societies publish information on their respective specialties and subspecialties. Some of the largest include the following: The American Academy of Orthopaedic Surgeons (AAOS)
http://www.aaos.org The American Association for Clinical Chemistry (AACC)
http://www.aacc.org The American College of Cardiology (ACC)
http://www.cardiosource.org The American College of Surgeons (ACS)
http://www.facs.org The Radiological Society of North America (RSNA)
http://www.rsna.org The Society of Nuclear Medicine (SNM)
http://www.snm.org
GOVERNMENT AGENCIES
Agency for Healthcare Research and Quality (AHRQ) http://www.ahrq.gov Part of the Department of Health and Human Services, the AHRQ’s mission is to improve the quality, safety, efficiency, and effectiveness of healthcare for all Americans.
Centers for Medicare & Medicaid Services (CMS) http://www.cms.gov The CMS supervises the Medicare program, the federal portion of Medicaid, and several related programs; formerly called the Health Care Financing Administration (HCFA).
Food and Drug Administration’s (FDA) Center for Devices and Radiological Health (CDRH) http://www.fda.gov/MedicalDevices/default.htm The FDA, a division of the Department of Health and Human Services, is the chief US government agency in charge of supervising the food and pharmaceutical industries. Its CDRH unit regulates medical device manufacturers.
National Center for Health Statistics (NCHS) http://www.cdc.gov/nchs The federal government’s principal agency that collects vital and health statistics; it is a division of the Centers for Disease Control and Prevention (which is under the umbrella of the Department of Health and Human Services).
National Institutes of Health (NIH) http://www.nih.gov Government-funded medical research agency, consisting of nearly 20 specialized institutes. It undertakes basic and clinical research on medical conditions and funds external research at academic medical centers. With a large budget (more than $30 billion in fiscal 2009), it has a huge impact on the direction of medical research in the US, though it does not directly support corporate R&D programs.

INDUSTRY SURVEYS HEALTHCARE: PRODUCTS & SUPPLIES / JANUARY 2013 55
COMPARATIVE COMPANY ANALYSIS
Operating Revenues
Million $ CAGR (%) Index Basis (2001 = 100)Ticker Company Yr. End 2011 2010 2009 2008 2007 2006 2001 10-Yr. 5-Yr. 1-Yr. 2011 2010 2009 2008 2007HEALTH CARE EQUIPMENT‡ABAX § ABAXIS INC # MAR 156.6 143.7 124.6 105.6 100.6 86.2 30.6 17.7 12.7 9.0 511 469 407 345 328ABT [] ABBOTT LABORATORIES DEC 38,851.3 35,166.7 A 30,764.7 29,527.6 D 25,914.2 22,476.3 16,285.2 A 9.1 11.6 10.5 239 216 189 181 159ABMD § ABIOMED INC # MAR 126.4 101.2 85.7 73.2 58.9 50.6 27.0 C 16.7 20.1 24.9 469 375 318 272 219ALOG § ANALOGIC CORP JUL 473.6 D 423.6 396.1 413.5 A 340.9 351.4 D 352.1 3.0 6.1 11.8 134 120 112 117 97BCR [] BARD (C.R.) INC DEC 2,896.4 2,720.2 2,534.9 2,452.1 A 2,202.0 D 1,985.5 1,181.3 9.4 7.8 6.5 245 230 215 208 186
BAX [] BAXTER INTERNATIONAL INC DEC 13,893.0 13,056.0 12,562.0 12,348.0 11,263.0 10,378.0 7,663.0 A 6.1 6.0 6.4 181 170 164 161 147BDX [] BECTON DICKINSON & CO SEP 7,828.9 7,372.3 D 7,160.9 D 7,155.9 6,359.7 D 5,840.2 3,754.3 C 7.6 6.0 6.2 209 196 191 191 169BSX [] BOSTON SCIENTIFIC CORP DEC 7,622.0 7,806.0 8,188.0 8,050.0 8,357.0 7,821.0 A 2,673.0 A 11.0 (0.5) (2.4) 285 292 306 301 313CMN § CANTEL MEDICAL CORP JUL 321.7 274.0 260.0 249.4 219.0 192.2 A,C 49.0 20.7 10.9 17.4 656 559 531 509 447CFN [] CAREFUSION CORP JUN 3,528.0 D 3,929.0 D 4,501.0 4,518.4 3,477.8 A NA NA NA NA (10.2) ** ** ** ** NA
CNMD § CONMED CORP DEC 725.1 713.7 694.7 742.2 A 694.3 646.8 428.7 5.4 2.3 1.6 169 166 162 173 162COV [] COVIDIEN PLC SEP 11,574.0 D 10,429.0 A,C 10,677.0 A 9,910.0 D 10,170.0 9,647.0 D NA NA 3.7 11.0 ** ** ** ** NACRY § CRYOLIFE INC DEC 119.6 A 116.6 111.7 105.1 94.8 81.3 87.7 3.2 8.0 2.6 136 133 127 120 108CYBX § CYBERONICS INC # APR 218.5 190.5 167.8 143.6 121.2 131.0 70.1 12.0 10.8 14.7 312 272 239 205 173EW [] EDWARDS LIFESCIENCES CORP DEC 1,678.6 1,447.0 1,321.4 1,237.7 1,091.1 A 1,037.0 692.0 9.3 10.1 16.0 243 209 191 179 158
GB § GREATBATCH INC DEC 568.8 A 533.4 521.8 546.6 A 318.7 A 271.1 135.6 A 15.4 16.0 6.6 420 393 385 403 235HRC † HILL-ROM HOLDINGS INC SEP 1,591.7 1,469.6 1,386.9 1,507.7 D 2,023.7 1,962.9 2,131.0 (2.9) (4.1) 8.3 75 69 65 71 95HOLX † HOLOGIC INC SEP 1,789.3 A 1,679.6 1,637.1 1,674.5 738.4 462.7 A 176.3 26.1 31.1 6.5 1,015 952 928 950 419IDXX † IDEXX LABS INC DEC 1,218.7 1,103.4 1,031.6 1,024.0 922.6 739.1 386.1 12.2 10.5 10.4 316 286 267 265 239IART § INTEGRA LIFESCIENCES HLDGS DEC 780.1 A 732.1 682.5 654.6 A 550.5 A 419.3 A 93.4 A 23.6 13.2 6.6 835 783 730 701 589
ISRG [] INTUITIVE SURGICAL INC DEC 1,757.3 1,413.0 1,052.2 874.9 600.8 372.7 51.7 42.3 36.4 24.4 3,401 2,735 2,036 1,693 1,163IVC § INVACARE CORP DEC 1,801.1 A 1,722.1 1,693.1 1,755.7 A 1,602.2 1,498.0 1,053.6 5.5 3.8 4.6 171 163 161 167 152MASI † MASIMO CORP DEC 439.0 405.4 349.1 307.1 256.3 224.3 NA NA 14.4 8.3 ** ** ** ** NAMDT [] MEDTRONIC INC # APR 16,184.0 D 15,933.0 15,835.0 14,599.0 13,515.0 A 12,299.0 6,410.8 A 9.7 5.6 1.6 252 249 247 228 211BABY § NATUS MEDICAL INC DEC 232.7 A 218.7 A 166.5 A 161.8 A 118.4 A 89.9 A 27.4 23.8 20.9 6.4 849 798 608 591 432
NUVA § NUVASIVE INC DEC 540.5 A 478.2 370.3 A 250.1 154.3 98.1 C NA NA 40.7 13.0 ** ** ** ** NAPMTI § PALOMAR MED TECHNOLOGIES INC DEC 73.6 63.7 60.6 86.7 122.9 126.5 16.7 16.0 (10.3) 15.6 442 383 364 520 738RMD † RESMED INC JUN 1,243.1 1,092.4 920.7 835.4 716.3 A 607.0 A 155.2 A 23.1 15.4 13.8 801 704 593 538 462STJ [] ST JUDE MEDICAL INC DEC 5,611.7 5,164.8 4,681.3 4,363.3 3,779.3 3,302.4 1,347.4 15.3 11.2 8.7 416 383 347 324 280STE † STERIS CORP # MAR 1,391.5 1,309.8 1,257.7 1,298.5 1,265.1 1,197.4 866.7 4.8 3.1 6.2 161 151 145 150 146
SYK [] STRYKER CORP DEC 8,307.0 7,320.0 6,723.1 6,718.2 6,000.5 D 5,405.6 2,602.3 12.3 9.0 13.5 319 281 258 258 231SRDX § SURMODICS INC SEP 67.8 69.9 120.2 97.1 73.2 A 69.9 22.7 11.6 (0.6) (3.0) 299 308 530 428 322SMA § SYMMETRY MEDICAL INC DEC 359.0 A 360.8 365.9 423.4 290.9 253.6 A NA NA 7.2 (0.5) ** ** ** ** NATFX † TELEFLEX INC DEC 1,528.9 D 1,801.7 D 1,890.1 D 2,420.9 1,934.3 A,C 2,646.8 A,C 1,905.0 A (2.2) (10.4) (15.1) 80 95 99 127 102THOR † THORATEC CORP DEC 422.7 A 383.0 D 373.9 313.6 234.8 214.1 113.4 A 14.1 14.6 10.4 373 338 330 277 207
VAR [] VARIAN MEDICAL SYSTEMS INC SEP 2,596.7 2,356.6 2,214.1 2,069.7 A,C 1,776.6 1,597.8 773.6 C 12.9 10.2 10.2 336 305 286 268 230ZMH [] ZIMMER HOLDINGS INC DEC 4,451.8 4,220.2 4,095.4 4,121.1 3,897.5 3,495.4 1,178.6 14.2 5.0 5.5 378 358 347 350 331

56 HEALTHCARE: PRODUCTS & SUPPLIES / JANUARY 2013 INDUSTRY SURVEYS
Operating Revenues
Million $ CAGR (%) Index Basis (2001 = 100)Ticker Company Yr. End 2011 2010 2009 2008 2007 2006 2001 10-Yr. 5-Yr. 1-Yr. 2011 2010 2009 2008 2007 HEALTH CARE SUPPLIES‡ALGN § ALIGN TECHNOLOGY INC DEC 479.7 A 372.8 312.3 304.0 284.3 206.4 46.4 26.3 18.4 28.7 1,034 804 673 655 613COO † COOPER COMPANIES INC OCT 1,330.8 1,158.5 1,080.4 1,063.2 950.6 A 859.0 A 234.6 A 19.0 9.2 14.9 567 494 461 453 405XRAY [] DENTSPLY INTERNATL INC DEC 2,537.7 A 2,221.0 A 2,159.9 A 2,193.7 A,C 2,009.8 A 1,810.5 A 1,129.1 A 8.4 7.0 14.3 225 197 191 194 178HAE § HAEMONETICS CORP # MAR 727.8 676.7 A 645.4 A 597.9 A 516.4 A 449.6 A,C 320.0 8.6 10.1 7.6 227 211 202 187 161ICUI § ICU MEDICAL INC DEC 302.2 284.6 231.5 204.7 188.1 201.6 69.1 15.9 8.4 6.2 438 412 335 296 272
VIVO § MERIDIAN BIOSCIENCE INC SEP 159.7 143.0 A 148.3 139.6 123.0 108.4 56.5 10.9 8.1 11.7 283 253 262 247 218MMSI § MERIT MEDICAL SYSTEMS INC DEC 359.4 296.8 A 257.5 A 227.1 207.8 190.7 104.0 13.2 13.5 21.1 346 285 247 218 200NEOG § NEOGEN CORP # MAY 184.4 173.0 140.7 A 118.8 A 102.4 A 86.1 41.1 A 16.2 16.4 6.6 449 421 342 289 249WST § WEST PHARMACEUTICAL SVSC INC DEC 1,192.3 1,104.7 A 1,055.7 1,051.1 1,020.1 913.3 396.9 D 11.6 5.5 7.9 300 278 266 265 257
OTHER COMPANIES WITH SIGNIFICANT HEALTHCARE PRODUCTS & SUPPLIES OPERATIONSBMY [] BRISTOL-MYERS SQUIBB CO DEC 21,244.0 19,484.0 18,808.0 D 20,597.0 D 19,348.0 D 17,914.0 18,213.0 A,C 1.6 3.5 9.0 117 107 103 113 106JNJ [] JOHNSON & JOHNSON DEC 65,030.0 61,587.0 61,897.0 63,747.0 61,035.0 53,194.0 33,004.0 A 7.0 4.1 5.6 197 187 188 193 185
Note: Data as originally reported. CAGR-Compound annual grow th rate. ‡S&P 1500 index group. []Company included in the S&P 500. †Company included in the S&P MidCap 400. §Company included in the S&P SmallCap 600. #Of the follow ing calendar year. **Not calculated; data for base year or end year not available. A - This year's data reflect an acquisition or merger. B - This year's data reflect a major merger resulting in the formation of a new company. C - This year's data reflect an accounting change. D - Data exclude discontinued operations. E - Includes excise taxes. F - Includes other (nonoperating) income. G - Includes sale of leased depts. H - Some or all data are not available, due to a f iscal year change.

INDUSTRY SURVEYS HEALTHCARE: PRODUCTS & SUPPLIES / JANUARY 2013 57
Net IncomeMillion $ CAGR (%) Index Basis (2001 = 100)
Ticker Company Yr. End 2011 2010 2009 2008 2007 2006 2001 10-Yr. 5-Yr. 1-Yr. 2011 2010 2009 2008 2007HEALTH CARE EQUIPMENT‡ABAX § ABAXIS INC # MAR 13.1 14.5 13.0 12.0 12.5 10.1 1.3 25.9 5.4 (9.9) 1,004 1,115 999 921 959ABT [] ABBOTT LABORATORIES DEC 4,728.4 4,626.2 5,745.8 4,734.2 3,606.3 1,716.8 1,550.4 11.8 22.5 2.2 305 298 371 305 233ABMD § ABIOMED INC # MAR 1.5 (11.8) (19.0) (31.6) (40.9) (27.9) (21.2) NM NM NM NM NM NM NM NMALOG § ANALOGIC CORP JUL 16.6 15.6 3.7 23.5 15.4 4.6 13.6 2.0 29.3 6.8 122 114 27 173 113BCR [] BARD (C.R.) INC DEC 328.0 509.2 460.1 416.5 406.4 272.1 143.2 8.6 3.8 (35.6) 229 356 321 291 284
BAX [] BAXTER INTERNATIONAL INC DEC 2,224.0 1,420.0 2,205.0 2,014.0 1,707.0 1,398.0 664.0 12.8 9.7 56.6 335 214 332 303 257BDX [] BECTON DICKINSON & CO SEP 1,264.9 1,176.3 1,213.1 1,127.9 856.2 755.6 438.4 11.2 10.9 7.5 289 268 277 257 195BSX [] BOSTON SCIENTIFIC CORP DEC 441.0 (1,065.0) (1,025.0) (2,036.0) (495.0) (3,577.0) (54.0) NM NM NM NM NM NM NM NMCMN § CANTEL MEDICAL CORP JUL 20.4 19.9 15.6 8.7 8.1 6.7 4.2 17.3 25.1 2.4 491 480 375 209 195CFN [] CAREFUSION CORP JUN 291.0 171.0 568.0 662.7 502.4 NA NA NA NA 70.2 ** ** ** ** NA
CNMD § CONMED CORP DEC 0.8 30.3 12.1 44.6 41.5 (12.5) 24.4 (29.4) NM (97.5) 3 124 50 183 170COV [] COVIDIEN PLC SEP 1,883.0 1,563.0 902.0 1,443.0 (337.0) 1,470.0 NA NA 5.1 20.5 ** ** ** ** NACRY § CRYOLIFE INC DEC 7.4 3.9 8.7 32.9 7.2 0.4 9.2 (2.2) 82.4 86.9 80 43 95 359 79CYBX § CYBERONICS INC # APR 36.1 46.7 78.4 26.7 (10.3) (51.2) (26.1) NM NM (22.8) NM NM NM NM NMEW [] EDWARDS LIFESCIENCES CORP DEC 236.7 218.0 229.1 128.9 113.0 130.5 (10.0) NM 12.6 8.6 NM NM NM NM NM
GB § GREATBATCH INC DEC 33.1 33.1 (9.0) 18.6 15.1 16.1 11.6 11.1 15.5 (0.0) 286 286 (78) 160 130HRC † HILL-ROM HOLDINGS INC SEP 133.3 125.3 (405.0) 67.1 190.6 221.5 170.0 (2.4) (9.7) 6.4 78 74 (238) 39 112HOLX † HOLOGIC INC SEP 157.1 (62.8) (2,176.2) (385.6) 94.6 27.4 (20.9) NM 41.8 NM NM NM NM NM NMIDXX † IDEXX LABS INC DEC 161.8 141.3 122.2 116.2 94.0 93.7 37.6 15.7 11.5 14.5 430 376 325 309 250IART § INTEGRA LIFESCIENCES HLDGS DEC 28.0 65.7 51.0 34.9 33.5 29.4 26.4 0.6 (1.0) (57.4) 106 249 193 132 127
ISRG [] INTUITIVE SURGICAL INC DEC 495.1 381.8 232.6 204.3 144.5 72.0 (16.7) NM 47.0 29.7 NM NM NM NM NMIVC § INVACARE CORP DEC (4.1) 25.3 41.2 38.6 1.2 (317.8) 35.2 NM NM NM (12) 72 117 110 3MASI † MASIMO CORP DEC 63.7 73.5 53.2 31.9 42.3 181.8 NA NA (18.9) (13.4) ** ** ** ** NAMDT [] MEDTRONIC INC # APR 3,415.0 3,096.0 3,099.0 2,169.0 2,231.0 2,802.0 984.0 13.3 4.0 10.3 347 315 315 220 227BABY § NATUS MEDICAL INC DEC (11.7) 11.9 11.1 17.5 9.8 (0.9) (3.9) NM NM NM NM NM NM NM NM
NUVA § NUVASIVE INC DEC (69.8) 78.3 5.8 (27.5) (11.3) (47.9) NA NA NM NM ** ** ** ** NAPMTI § PALOMAR MED TECHNOLOGIES INC DEC 7.4 (8.8) (10.5) (0.1) 20.5 53.0 (5.5) NM (32.5) NM NM NM NM NM NMRMD † RESMED INC JUN 227.0 190.1 146.4 110.3 66.3 88.2 11.6 34.6 20.8 19.4 1,952 1,634 1,259 948 570STJ [] ST JUDE MEDICAL INC DEC 825.8 907.4 777.2 384.3 559.0 548.3 172.6 16.9 8.5 (9.0) 478 526 450 223 324STE † STERIS CORP # MAR 136.1 51.3 128.5 110.7 77.1 81.1 46.2 11.4 10.9 165.5 295 111 278 240 167
SYK [] STRYKER CORP DEC 1,345.0 1,273.4 1,107.4 1,147.8 986.7 777.7 271.8 17.3 11.6 5.6 495 469 407 422 363SRDX § SURMODICS INC SEP (12.8) (21.1) 37.5 14.7 3.3 20.3 6.8 NM NM NM (188) (309) 551 216 49SMA § SYMMETRY MEDICAL INC DEC 2.9 14.0 21.8 24.0 (0.1) 24.1 NA NA (34.6) (79.3) ** ** ** ** NATFX † TELEFLEX INC DEC 120.7 124.5 141.8 134.0 (42.4) 139.9 112.3 0.7 (2.9) (3.1) 107 111 126 119 (38)THOR † THORATEC CORP DEC 72.6 59.0 28.6 22.5 3.2 4.0 (87.9) NM 78.8 23.0 NM NM NM NM NM
VAR [] VARIAN MEDICAL SYSTEMS INC SEP 408.6 367.5 331.5 295.3 239.5 243.6 68.0 19.6 10.9 11.2 601 541 488 434 352ZMH [] ZIMMER HOLDINGS INC DEC 760.8 596.9 717.4 848.6 773.2 834.5 149.8 17.6 (1.8) 27.5 508 398 479 566 516

58 HEALTHCARE: PRODUCTS & SUPPLIES / JANUARY 2013 INDUSTRY SURVEYS
Net IncomeMillion $ CAGR (%) Index Basis (2001 = 100)
Ticker Company Yr. End 2011 2010 2009 2008 2007 2006 2001 10-Yr. 5-Yr. 1-Yr. 2011 2010 2009 2008 2007 HEALTH CARE SUPPLIES‡ALGN § ALIGN TECHNOLOGY INC DEC 66.7 74.3 (31.3) 80.0 35.7 (35.0) (97.5) NM NM (10.2) NM NM NM NM NMCOO † COOPER COMPANIES INC OCT 175.4 112.8 100.5 65.5 (11.2) 66.2 37.1 16.8 21.5 55.5 472 304 271 176 (30)XRAY [] DENTSPLY INTERNATL INC DEC 244.5 265.7 274.3 283.9 259.7 223.7 121.5 7.2 1.8 (8.0) 201 219 226 234 214HAE § HAEMONETICS CORP # MAR 66.9 80.0 58.4 59.3 52.0 49.1 27.7 9.2 6.4 (16.4) 241 288 211 214 187ICUI § ICU MEDICAL INC DEC 44.7 30.9 26.6 24.3 23.1 25.7 15.4 11.2 11.7 44.4 290 201 173 158 150
VIVO § MERIDIAN BIOSCIENCE INC SEP 26.8 26.6 32.8 30.2 26.7 18.3 (10.3) NM 7.9 0.7 NM NM NM NM NMMMSI § MERIT MEDICAL SYSTEMS INC DEC 23.0 12.5 22.5 20.7 15.6 12.3 6.7 13.1 13.4 84.9 342 185 334 308 231NEOG § NEOGEN CORP # MAY 22.5 22.8 17.5 13.9 12.1 9.1 3.9 19.0 19.8 (1.4) 571 579 444 352 307WST § WEST PHARMACEUTICAL SVSC INC DEC 75.5 65.3 72.6 86.0 71.2 61.5 19.6 14.4 4.2 15.6 385 333 370 439 363
OTHER COMPANIES WITH SIGNIFICANT HEALTHCARE PRODUCTS & SUPPLIES OPERATIONSBMY [] BRISTOL-MYERS SQUIBB CO DEC 3,709.0 3,102.0 3,239.0 3,155.0 1,968.0 1,585.0 2,043.0 6.1 18.5 19.6 182 152 159 154 96JNJ [] JOHNSON & JOHNSON DEC 9,672.0 13,334.0 12,266.0 12,949.0 10,576.0 11,053.0 5,668.0 5.5 (2.6) (27.5) 171 235 216 228 187
Note: Data as originally reported. CAGR-Compound annual grow th rate. ‡S&P 1500 index group. []Company included in the S&P 500. †Company included in the S&P MidCap 400. §Company included in the S&P SmallCap 600. #Of the follow ing calendar year. **Not calculated; data for base year or end year not available.

INDUSTRY SURVEYS HEALTHCARE: PRODUCTS & SUPPLIES / JANUARY 2013 59
Return on Revenues (%) Return on Assets (%) Return on Equity (%)Ticker Company Yr. End 2011 2010 2009 2008 2007 2011 2010 2009 2008 2007 2011 2010 2009 2008 2007
HEALTH CARE EQUIPMENT‡ABAX § ABAXIS INC # MAR 8.4 10.1 10.5 11.4 12.4 7.1 8.2 8.4 9.2 11.2 8.0 9.2 9.5 10.4 13.0ABT [] ABBOTT LABORATORIES DEC 12.2 13.2 18.7 16.0 13.9 7.9 8.3 12.1 11.5 9.5 20.2 20.4 28.5 26.9 22.7ABMD § ABIOMED INC # MAR 1.2 NM NM NM NM 1.0 NM NM NM NM 1.3 NM NM NM NMALOG § ANALOGIC CORP JUL 3.5 3.7 0.9 5.7 4.5 3.3 3.3 0.8 4.8 3.2 4.0 3.9 0.9 5.7 3.7BCR [] BARD (C.R.) INC DEC 11.3 18.7 18.2 17.0 18.5 9.2 16.8 16.5 16.2 17.1 19.2 26.6 22.1 21.8 22.9
BAX [] BAXTER INTERNATIONAL INC DEC 16.0 10.9 17.6 16.3 15.2 12.2 8.2 13.5 13.1 11.4 33.8 20.6 32.9 30.6 25.9BDX [] BECTON DICKINSON & CO SEP 16.2 16.0 16.9 15.8 13.5 12.6 12.4 14.1 14.8 12.1 24.6 22.2 24.1 24.3 20.9BSX [] BOSTON SCIENTIFIC CORP DEC 5.8 NM NM NM NM 2.0 NM NM NM NM 3.9 NM NM NM NMCMN § CANTEL MEDICAL CORP JUL 6.4 7.3 6.0 3.5 3.7 6.8 7.1 5.6 3.2 3.2 9.2 10.1 8.8 5.4 5.5CFN [] CAREFUSION CORP JUN 8.2 4.4 12.6 14.7 14.4 3.6 2.1 6.8 8.2 NA 5.9 3.4 10.8 13.3 NA
CNMD § CONMED CORP DEC 0.1 4.3 1.7 6.0 6.0 0.1 3.1 1.3 4.9 4.7 0.1 5.2 2.2 8.6 8.8COV [] COVIDIEN PLC SEP 16.3 15.0 8.4 14.6 NM 9.2 8.3 5.4 8.4 NM 20.0 18.4 11.5 19.9 NMCRY § CRYOLIFE INC DEC 6.2 3.4 7.8 31.3 7.6 5.2 2.9 6.7 30.1 8.1 6.3 3.5 8.3 40.6 12.1CYBX § CYBERONICS INC # APR 16.5 24.5 46.8 18.6 NM 17.0 25.4 58.6 21.5 NM 20.1 32.6 116.0 581.6 NA EW [] EDWARDS LIFESCIENCES CORP DEC 14.1 15.1 17.3 10.4 10.4 12.6 12.9 15.2 9.4 8.7 17.9 17.7 22.5 15.0 14.3
GB § GREATBATCH INC DEC 5.8 6.2 NM 3.4 4.7 4.0 4.1 NM 2.5 2.5 7.4 8.2 NM 5.5 4.8HRC † HILL-ROM HOLDINGS INC SEP 8.4 8.5 NM 4.5 9.4 10.5 10.1 NM 3.5 9.4 18.4 19.0 NM 5.7 15.8HOLX † HOLOGIC INC SEP 8.8 NM NM NM 12.8 2.7 NM NM NM 9.8 5.6 NM NM NM 13.4IDXX † IDEXX LABS INC DEC 13.3 12.8 11.8 11.3 10.2 16.8 16.6 15.5 15.8 14.9 29.1 26.0 25.7 26.5 22.2IART § INTEGRA LIFESCIENCES HLDGS DEC 3.6 9.0 7.5 5.3 6.1 2.6 6.7 5.2 3.8 4.7 5.6 13.9 12.8 11.4 12.0
ISRG [] INTUITIVE SURGICAL INC DEC 28.2 27.0 22.1 23.4 24.1 18.2 18.2 14.2 16.3 16.9 21.1 21.4 16.6 19.0 19.6IVC § INVACARE CORP DEC NM 1.5 2.4 2.2 0.1 NM 1.9 3.1 2.7 0.1 NM 3.7 7.0 7.5 0.2MASI † MASIMO CORP DEC 14.5 18.1 15.2 10.4 16.5 18.8 22.1 16.4 12.1 21.4 25.3 28.5 21.0 17.3 71.2MDT [] MEDTRONIC INC # APR 21.1 19.4 19.6 14.9 16.5 10.8 10.6 12.0 9.5 10.7 20.6 20.2 22.6 17.8 19.8BABY § NATUS MEDICAL INC DEC NM 5.5 6.7 10.8 8.3 NM 3.8 4.0 7.8 6.2 NM 4.7 4.7 10.2 9.0
NUVA § NUVASIVE INC DEC NM 16.4 1.6 NM NM NM 10.8 1.0 NM NM NM 21.4 2.4 NM NMPMTI § PALOMAR MED TECHNOLOGIES INC DEC 10.1 NM NM NM 16.7 4.4 NM NM NM 13.3 5.1 NM NM NM 15.7RMD † RESMED INC JUN 18.3 17.4 15.9 13.2 9.3 12.3 12.1 10.1 8.3 5.9 15.0 15.8 13.3 11.0 7.9STJ [] ST JUDE MEDICAL INC DEC 14.7 17.6 16.6 8.8 14.8 9.4 12.1 12.8 7.0 11.0 18.7 23.6 23.7 12.5 19.0STE † STERIS CORP # MAR 9.8 3.9 10.2 8.5 6.1 9.6 3.8 10.5 9.0 6.3 16.9 6.7 17.5 15.5 10.4
SYK [] STRYKER CORP DEC 16.2 17.4 16.5 17.1 16.4 11.5 12.8 13.3 15.3 14.9 18.1 18.5 18.5 21.3 20.6SRDX § SURMODICS INC SEP NM NM 31.2 15.2 4.6 NM NM 19.9 8.1 2.0 NM NM 23.9 10.8 2.4SMA § SYMMETRY MEDICAL INC DEC 0.8 3.9 6.0 5.7 NM 0.5 3.1 4.9 5.6 NM 1.0 4.8 8.1 9.8 NMTFX † TELEFLEX INC DEC 7.9 6.9 7.5 5.5 NM 3.2 3.3 3.7 3.3 NM 6.4 7.4 10.0 10.4 NMTHOR † THORATEC CORP DEC 17.2 15.4 7.6 7.2 1.4 9.6 7.4 4.0 3.5 0.5 12.0 10.3 5.8 5.3 0.8
VAR [] VARIAN MEDICAL SYSTEMS INC SEP 15.7 15.6 15.0 14.3 13.5 16.9 15.9 15.5 16.1 15.0 32.4 28.4 28.3 31.9 29.6ZMH [] ZIMMER HOLDINGS INC DEC 17.1 14.1 17.5 20.6 19.8 9.2 7.6 9.5 12.2 12.3 13.5 10.5 12.7 15.3 14.9

60 HEALTHCARE: PRODUCTS & SUPPLIES / JANUARY 2013 INDUSTRY SURVEYS
Return on Revenues (%) Return on Assets (%) Return on Equity (%)Ticker Company Yr. End 2011 2010 2009 2008 2007 2011 2010 2009 2008 2007 2011 2010 2009 2008 2007 HEALTH CARE SUPPLIES‡ALGN § ALIGN TECHNOLOGY INC DEC 13.9 19.9 NM 26.3 12.6 11.8 17.8 NM 31.9 19.1 15.4 22.8 NM 42.1 29.2COO † COOPER COMPANIES INC OCT 13.2 9.7 9.3 6.2 NM 6.8 4.4 3.9 2.5 NM 9.7 7.0 6.8 4.6 NMXRAY [] DENTSPLY INTERNATL INC DEC 9.6 12.0 12.7 12.9 12.9 6.1 8.4 9.3 10.3 10.7 13.3 14.5 16.0 18.3 18.6HAE § HAEMONETICS CORP # MAR 9.2 11.8 9.0 9.9 10.1 7.7 10.0 8.3 9.4 8.8 9.4 12.5 10.3 11.5 10.7ICUI § ICU MEDICAL INC DEC 14.8 10.9 11.5 11.9 12.3 13.3 10.0 9.0 9.2 9.5 15.0 11.5 10.3 10.4 10.5
VIVO § MERIDIAN BIOSCIENCE INC SEP 16.8 18.6 22.1 21.6 21.7 17.3 17.1 21.7 21.6 21.1 19.5 19.4 24.6 25.0 25.7MMSI § MERIT MEDICAL SYSTEMS INC DEC 6.4 4.2 8.8 9.1 7.5 5.6 3.9 9.0 9.6 8.1 7.8 5.5 10.9 11.6 9.9NEOG § NEOGEN CORP # MAY 12.2 13.2 12.5 11.7 11.8 9.6 11.4 10.9 10.3 10.4 11.0 13.4 12.5 11.6 11.9WST § WEST PHARMACEUTICAL SVSC INC DEC 6.3 5.9 6.9 8.2 7.0 5.6 5.1 6.0 7.3 6.8 11.8 10.8 13.6 17.7 15.8
OTHER COMPANIES WITH SIGNIFICANT HEALTHCARE PRODUCTS & SUPPLIES OPERATIONSBMY [] BRISTOL-MYERS SQUIBB CO DEC 17.5 15.9 17.2 15.3 10.2 11.6 10.0 10.7 11.3 7.6 23.4 20.3 23.9 27.7 19.2JNJ [] JOHNSON & JOHNSON DEC 14.9 21.7 19.8 20.3 17.3 8.9 13.5 13.7 15.6 14.0 17.0 24.9 26.4 30.2 25.6
Note: Data as originally reported. ‡S&P 1500 index group. []Company included in the S&P 500. †Company included in the S&P MidCap 400. §Company included in the S&P SmallCap 600. #Of the follow ing calendar year.
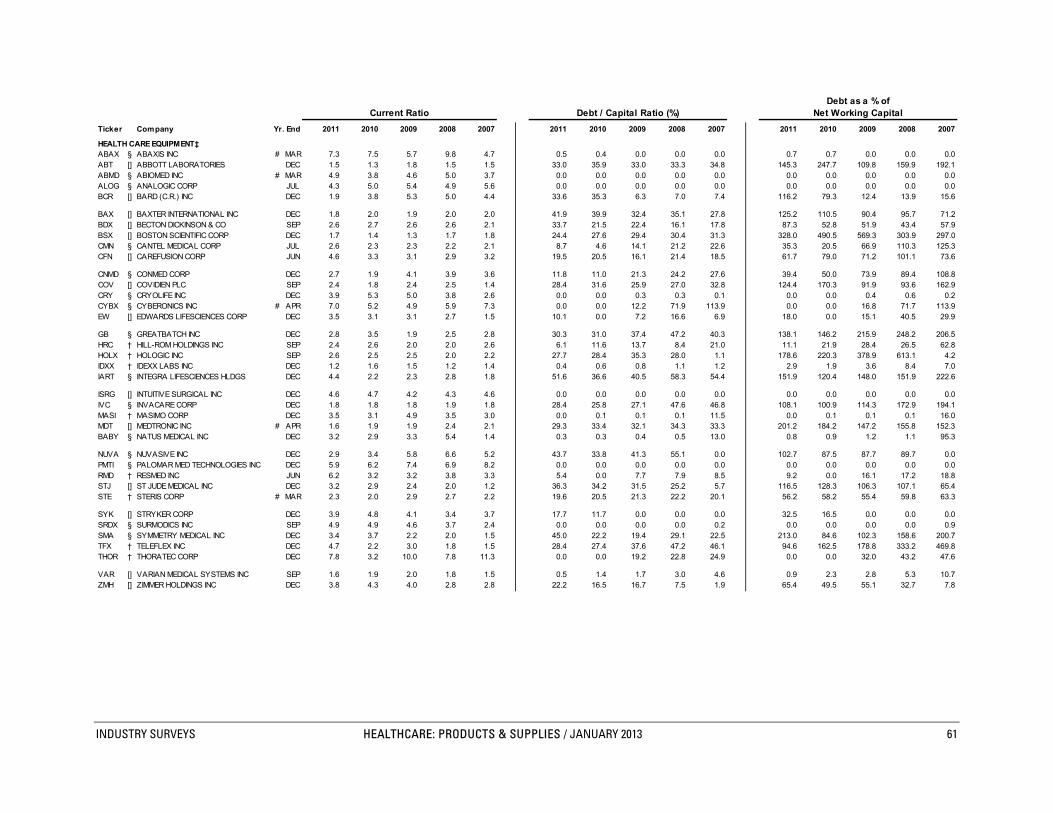
INDUSTRY SURVEYS HEALTHCARE: PRODUCTS & SUPPLIES / JANUARY 2013 61
Debt as a % ofCurrent Ratio Debt / Capital Ratio (%) Net Working Capital
Ticker Company Yr. End 2011 2010 2009 2008 2007 2011 2010 2009 2008 2007 2011 2010 2009 2008 2007
HEALTH CARE EQUIPMENT‡ABAX § ABAXIS INC # MAR 7.3 7.5 5.7 9.8 4.7 0.5 0.4 0.0 0.0 0.0 0.7 0.7 0.0 0.0 0.0ABT [] ABBOTT LABORATORIES DEC 1.5 1.3 1.8 1.5 1.5 33.0 35.9 33.0 33.3 34.8 145.3 247.7 109.8 159.9 192.1ABMD § ABIOMED INC # MAR 4.9 3.8 4.6 5.0 3.7 0.0 0.0 0.0 0.0 0.0 0.0 0.0 0.0 0.0 0.0ALOG § ANALOGIC CORP JUL 4.3 5.0 5.4 4.9 5.6 0.0 0.0 0.0 0.0 0.0 0.0 0.0 0.0 0.0 0.0BCR [] BARD (C.R.) INC DEC 1.9 3.8 5.3 5.0 4.4 33.6 35.3 6.3 7.0 7.4 116.2 79.3 12.4 13.9 15.6
BAX [] BAXTER INTERNATIONAL INC DEC 1.8 2.0 1.9 2.0 2.0 41.9 39.9 32.4 35.1 27.8 125.2 110.5 90.4 95.7 71.2BDX [] BECTON DICKINSON & CO SEP 2.6 2.7 2.6 2.6 2.1 33.7 21.5 22.4 16.1 17.8 87.3 52.8 51.9 43.4 57.9BSX [] BOSTON SCIENTIFIC CORP DEC 1.7 1.4 1.3 1.7 1.8 24.4 27.6 29.4 30.4 31.3 328.0 490.5 569.3 303.9 297.0CMN § CANTEL MEDICAL CORP JUL 2.6 2.3 2.3 2.2 2.1 8.7 4.6 14.1 21.2 22.6 35.3 20.5 66.9 110.3 125.3CFN [] CAREFUSION CORP JUN 4.6 3.3 3.1 2.9 3.2 19.5 20.5 16.1 21.4 18.5 61.7 79.0 71.2 101.1 73.6
CNMD § CONMED CORP DEC 2.7 1.9 4.1 3.9 3.6 11.8 11.0 21.3 24.2 27.6 39.4 50.0 73.9 89.4 108.8COV [] COVIDIEN PLC SEP 2.4 1.8 2.4 2.5 1.4 28.4 31.6 25.9 27.0 32.8 124.4 170.3 91.9 93.6 162.9CRY § CRYOLIFE INC DEC 3.9 5.3 5.0 3.8 2.6 0.0 0.0 0.3 0.3 0.1 0.0 0.0 0.4 0.6 0.2CYBX § CYBERONICS INC # APR 7.0 5.2 4.9 5.9 7.3 0.0 0.0 12.2 71.9 113.9 0.0 0.0 16.8 71.7 113.9EW [] EDWARDS LIFESCIENCES CORP DEC 3.5 3.1 3.1 2.7 1.5 10.1 0.0 7.2 16.6 6.9 18.0 0.0 15.1 40.5 29.9
GB § GREATBATCH INC DEC 2.8 3.5 1.9 2.5 2.8 30.3 31.0 37.4 47.2 40.3 138.1 146.2 215.9 248.2 206.5HRC † HILL-ROM HOLDINGS INC SEP 2.4 2.6 2.0 2.0 2.6 6.1 11.6 13.7 8.4 21.0 11.1 21.9 28.4 26.5 62.8HOLX † HOLOGIC INC SEP 2.6 2.5 2.5 2.0 2.2 27.7 28.4 35.3 28.0 1.1 178.6 220.3 378.9 613.1 4.2IDXX † IDEXX LABS INC DEC 1.2 1.6 1.5 1.2 1.4 0.4 0.6 0.8 1.1 1.2 2.9 1.9 3.6 8.4 7.0IART § INTEGRA LIFESCIENCES HLDGS DEC 4.4 2.2 2.3 2.8 1.8 51.6 36.6 40.5 58.3 54.4 151.9 120.4 148.0 151.9 222.6
ISRG [] INTUITIVE SURGICAL INC DEC 4.6 4.7 4.2 4.3 4.6 0.0 0.0 0.0 0.0 0.0 0.0 0.0 0.0 0.0 0.0IVC § INVACARE CORP DEC 1.8 1.8 1.8 1.9 1.8 28.4 25.8 27.1 47.6 46.8 108.1 100.9 114.3 172.9 194.1MASI † MASIMO CORP DEC 3.5 3.1 4.9 3.5 3.0 0.0 0.1 0.1 0.1 11.5 0.0 0.1 0.1 0.1 16.0MDT [] MEDTRONIC INC # APR 1.6 1.9 1.9 2.4 2.1 29.3 33.4 32.1 34.3 33.3 201.2 184.2 147.2 155.8 152.3BABY § NATUS MEDICAL INC DEC 3.2 2.9 3.3 5.4 1.4 0.3 0.3 0.4 0.5 13.0 0.8 0.9 1.2 1.1 95.3
NUVA § NUVASIVE INC DEC 2.9 3.4 5.8 6.6 5.2 43.7 33.8 41.3 55.1 0.0 102.7 87.5 87.7 89.7 0.0PMTI § PALOMAR MED TECHNOLOGIES INC DEC 5.9 6.2 7.4 6.9 8.2 0.0 0.0 0.0 0.0 0.0 0.0 0.0 0.0 0.0 0.0RMD † RESMED INC JUN 6.2 3.2 3.2 3.8 3.3 5.4 0.0 7.7 7.9 8.5 9.2 0.0 16.1 17.2 18.8STJ [] ST JUDE MEDICAL INC DEC 3.2 2.9 2.4 2.0 1.2 36.3 34.2 31.5 25.2 5.7 116.5 128.3 106.3 107.1 65.4STE † STERIS CORP # MAR 2.3 2.0 2.9 2.7 2.2 19.6 20.5 21.3 22.2 20.1 56.2 58.2 55.4 59.8 63.3
SYK [] STRYKER CORP DEC 3.9 4.8 4.1 3.4 3.7 17.7 11.7 0.0 0.0 0.0 32.5 16.5 0.0 0.0 0.0SRDX § SURMODICS INC SEP 4.9 4.9 4.6 3.7 2.4 0.0 0.0 0.0 0.0 0.2 0.0 0.0 0.0 0.0 0.9SMA § SYMMETRY MEDICAL INC DEC 3.4 3.7 2.2 2.0 1.5 45.0 22.2 19.4 29.1 22.5 213.0 84.6 102.3 158.6 200.7TFX † TELEFLEX INC DEC 4.7 2.2 3.0 1.8 1.5 28.4 27.4 37.6 47.2 46.1 94.6 162.5 178.8 333.2 469.8THOR † THORATEC CORP DEC 7.8 3.2 10.0 7.8 11.3 0.0 0.0 19.2 22.8 24.9 0.0 0.0 32.0 43.2 47.6
VAR [] VARIAN MEDICAL SYSTEMS INC SEP 1.6 1.9 2.0 1.8 1.5 0.5 1.4 1.7 3.0 4.6 0.9 2.3 2.8 5.3 10.7ZMH [] ZIMMER HOLDINGS INC DEC 3.8 4.3 4.0 2.8 2.8 22.2 16.5 16.7 7.5 1.9 65.4 49.5 55.1 32.7 7.8

62 HEALTHCARE: PRODUCTS & SUPPLIES / JANUARY 2013 INDUSTRY SURVEYS
Debt as a % ofCurrent Ratio Debt / Capital Ratio (%) Net Working Capital
Ticker Company Yr. End 2011 2010 2009 2008 2007 2011 2010 2009 2008 2007 2011 2010 2009 2008 2007 HEALTH CARE SUPPLIES‡ALGN § ALIGN TECHNOLOGY INC DEC 2.6 4.2 3.2 2.9 3.0 0.0 0.0 0.0 0.0 0.0 0.0 0.0 0.0 0.0 0.0COO † COOPER COMPANIES INC OCT 2.0 2.5 2.9 2.1 1.8 14.3 26.0 33.1 37.6 36.7 119.9 202.9 234.9 318.4 359.3XRAY [] DENTSPLY INTERNATL INC DEC 1.4 3.7 2.7 2.6 3.1 41.5 24.0 16.9 19.7 23.4 515.9 63.3 50.1 71.8 72.0HAE § HAEMONETICS CORP # MAR 4.0 4.1 2.8 4.1 3.7 0.4 0.6 0.8 1.0 1.2 0.7 1.2 1.8 1.8 2.3ICUI § ICU MEDICAL INC DEC 8.9 8.1 6.2 8.2 7.1 0.0 0.0 0.0 0.0 0.0 0.0 0.0 0.0 0.0 0.0
VIVO § MERIDIAN BIOSCIENCE INC SEP 5.9 6.6 7.0 6.2 5.5 0.0 0.0 0.0 0.0 0.0 0.0 0.0 0.0 0.0 0.0MMSI § MERIT MEDICAL SYSTEMS INC DEC 3.1 2.8 2.8 5.0 3.8 7.9 25.6 0.0 0.0 0.0 34.2 113.1 0.0 0.0 0.0NEOG § NEOGEN CORP # MAY 7.2 6.9 5.1 7.8 5.9 0.0 0.0 0.0 0.0 0.0 0.0 0.0 0.0 0.0 0.0WST § WEST PHARMACEUTICAL SVSC INC DEC 1.9 2.6 2.3 2.3 2.3 30.7 35.7 38.6 43.0 42.3 130.8 134.2 167.7 184.5 172.0
OTHER COMPANIES WITH SIGNIFICANT HEALTHCARE PRODUCTS & SUPPLIES OPERATIONSBMY [] BRISTOL-MYERS SQUIBB CO DEC 2.0 2.0 2.2 2.2 1.2 25.1 25.3 29.2 34.9 29.2 71.3 81.5 80.2 81.8 257.1JNJ [] JOHNSON & JOHNSON DEC 2.4 2.1 1.8 1.6 1.5 18.1 13.6 13.7 15.6 13.6 41.2 37.8 46.2 60.0 70.0
Note: Data as originally reported. ‡S&P 1500 index group. []Company included in the S&P 500. †Company included in the S&P MidCap 400. §Company included in the S&P SmallCap 600. #Of the follow ing calendar year.

INDUSTRY SURVEYS HEALTHCARE: PRODUCTS & SUPPLIES / JANUARY 2013 63
Price / Earnings Ratio (High-Low) Dividend Payout Ratio (%) Dividend Yield (High-Low, %)Ticker Company Yr. End 2011 2010 2009 2008 2007 2011 2010 2009 2008 2007
HEALTH CARE EQUIPMENT‡ABAX § ABAXIS INC # MAR 54 - 33 44 - 27 51 - 22 69 - 18 69 - 29 0 0 0 0 0 0.0 - 0.0 0.0 - 0.0 0.0 - 0.0 0.0 - 0.0 0.0 - 0.0ABT [] ABBOTT LABORATORIES DEC 19 - 15 19 - 15 15 - 11 20 - 15 25 - 21 62 58 42 46 54 4.2 - 3.3 3.9 - 3.0 3.8 - 2.7 3.1 - 2.3 2.6 - 2.1ABMD § ABIOMED INC # MAR NM- NM NM- NM NM- NM NM- NM NM- NM 0 NM NM NM NM 0.0 - 0.0 0.0 - 0.0 0.0 - 0.0 0.0 - 0.0 0.0 - 0.0ALOG § ANALOGIC CORP JUL 44 - 32 41 - 30 NM- 84 43 - 15 71 - 45 30 32 138 22 36 0.9 - 0.7 1.1 - 0.8 1.6 - 1.0 1.5 - 0.5 0.8 - 0.5BCR [] BARD (C.R.) INC DEC 30 - 22 18 - 14 19 - 15 24 - 17 24 - 19 20 13 14 15 15 0.9 - 0.7 0.9 - 0.7 1.0 - 0.7 0.9 - 0.6 0.8 - 0.6
BAX [] BAXTER INTERNATIONAL INC DEC 16 - 12 26 - 17 17 - 13 22 - 15 23 - 17 32 49 29 28 27 2.7 - 2.0 2.9 - 1.9 2.4 - 1.8 1.9 - 1.3 1.6 - 1.2BDX [] BECTON DICKINSON & CO SEP 16 - 12 17 - 13 16 - 12 20 - 13 25 - 20 29 29 26 25 28 2.4 - 1.8 2.2 - 1.7 2.2 - 1.7 2.0 - 1.2 1.4 - 1.1BSX [] BOSTON SCIENTIFIC CORP DEC 27 - 17 NM- NM NM- NM NM- NM NM- NM 0 NM NM NM NM 0.0 - 0.0 0.0 - 0.0 0.0 - 0.0 0.0 - 0.0 0.0 - 0.0CMN § CANTEL MEDICAL CORP JUL 24 - 16 20 - 11 22 - 12 28 - 13 40 - 25 10 8 0 0 0 0.6 - 0.4 0.7 - 0.4 0.0 - 0.0 0.0 - 0.0 0.0 - 0.0CFN [] CAREFUSION CORP JUN 23 - 17 39 - 27 11 - 7 NA - NA NA - NA 0 0 0 NA NA 0.0 - 0.0 0.0 - 0.0 0.0 - 0.0 NA - NA NA - NA
CNMD § CONMED CORP DEC NM- NM 26 - 16 58 - 28 23 - 13 22 - 15 0 0 0 0 0 0.0 - 0.0 0.0 - 0.0 0.0 - 0.0 0.0 - 0.0 0.0 - 0.0COV [] COVIDIEN PLC SEP 15 - 11 17 - 11 27 - 15 20 - 11 NM- NM 16 29 36 22 NM 1.5 - 1.0 2.6 - 1.8 2.3 - 1.3 2.0 - 1.1 0.0 - 0.0CRY § CRYOLIFE INC DEC 24 - 15 53 - 34 32 - 13 14 - 6 58 - 24 0 0 0 0 0 0.0 - 0.0 0.0 - 0.0 0.0 - 0.0 0.0 - 0.0 0.0 - 0.0CYBX § CYBERONICS INC # APR 28 - 18 21 - 10 8 - 4 29 - 10 NM- NM 0 0 0 0 NM 0.0 - 0.0 0.0 - 0.0 0.0 - 0.0 0.0 - 0.0 0.0 - 0.0EW [] EDWARDS LIFESCIENCES CORP DEC 44 - 30 45 - 22 22 - 13 29 - 18 27 - 23 0 0 0 0 0 0.0 - 0.0 0.0 - 0.0 0.0 - 0.0 0.0 - 0.0 0.0 - 0.0
GB § GREATBATCH INC DEC 20 - 13 17 - 13 NM- NM 33 - 19 51 - 27 0 0 NM 0 0 0.0 - 0.0 0.0 - 0.0 0.0 - 0.0 0.0 - 0.0 0.0 - 0.0HRC † HILL-ROM HOLDINGS INC SEP 23 - 13 22 - 12 NM- NM 53 - 14 23 - 17 20 21 NM 72 37 1.6 - 0.9 1.8 - 0.9 4.8 - 1.7 5.1 - 1.4 2.2 - 1.6HOLX † HOLOGIC INC SEP 39 - 23 NM- NM NM- NM NM- NM 40 - 26 0 NM NM NM 0 0.0 - 0.0 0.0 - 0.0 0.0 - 0.0 0.0 - 0.0 0.0 - 0.0IDXX † IDEXX LABS INC DEC 31 - 22 30 - 20 27 - 13 33 - 12 42 - 25 0 0 0 0 0 0.0 - 0.0 0.0 - 0.0 0.0 - 0.0 0.0 - 0.0 0.0 - 0.0IART § INTEGRA LIFESCIENCES HLDGS DEC 55 - 29 23 - 15 21 - 11 40 - 21 44 - 33 0 0 0 0 0 0.0 - 0.0 0.0 - 0.0 0.0 - 0.0 0.0 - 0.0 0.0 - 0.0
ISRG [] INTUITIVE SURGICAL INC DEC 37 - 21 40 - 25 51 - 14 68 - 21 94 - 23 0 0 0 0 0 0.0 - 0.0 0.0 - 0.0 0.0 - 0.0 0.0 - 0.0 0.0 - 0.0IVC § INVACARE CORP DEC NM- NM 40 - 25 20 - 11 22 - 11 NM- NM NM 5 4 4 125 0.4 - 0.2 0.2 - 0.1 0.4 - 0.2 0.4 - 0.2 0.3 - 0.2MASI † MASIMO CORP DEC 33 - 16 26 - 17 34 - 23 74 - 38 52 - 23 0 220 0 0 0 0.0 - 0.0 13.1 - 8.4 0.0 - 0.0 0.0 - 0.0 0.0 - 0.0MDT [] MEDTRONIC INC # APR 13 - 9 16 - 11 16 - 9 29 - 15 29 - 23 30 31 29 39 25 3.2 - 2.2 2.9 - 1.9 3.4 - 1.8 2.6 - 1.3 1.1 - 0.9BABY § NATUS MEDICAL INC DEC NM- NM 43 - 28 44 - 16 38 - 13 44 - 31 NM 0 0 0 0 0.0 - 0.0 0.0 - 0.0 0.0 - 0.0 0.0 - 0.0 0.0 - 0.0
NUVA § NUVASIVE INC DEC NM- NM 24 - 11 NM- NM NM- NM NM- NM NM 0 0 NM NM 0.0 - 0.0 0.0 - 0.0 0.0 - 0.0 0.0 - 0.0 0.0 - 0.0PMTI § PALOMAR MED TECHNOLOGIES INC DEC 41 - 17 NM- NM NM- NM NM- NM 49 - 14 0 NM NM NM 0 0.0 - 0.0 0.0 - 0.0 0.0 - 0.0 0.0 - 0.0 0.0 - 0.0RMD † RESMED INC JUN 24 - 16 28 - 20 28 - 16 37 - 20 65 - 45 0 0 0 0 0 0.0 - 0.0 0.0 - 0.0 0.0 - 0.0 0.0 - 0.0 0.0 - 0.0STJ [] ST JUDE MEDICAL INC DEC 21 - 13 16 - 12 18 - 13 43 - 22 30 - 21 33 0 0 0 0 2.6 - 1.6 0.0 - 0.0 0.0 - 0.0 0.0 - 0.0 0.0 - 0.0STE † STERIS CORP # MAR 16 - 12 44 - 30 16 - 9 21 - 11 26 - 20 28 65 112 16 19 2.4 - 1.8 2.2 - 1.5 12.7 - 6.9 1.4 - 0.8 0.9 - 0.7
SYK [] STRYKER CORP DEC 19 - 13 19 - 13 19 - 11 27 - 13 32 - 23 22 20 9 14 14 1.7 - 1.2 1.5 - 1.1 0.8 - 0.5 1.1 - 0.5 0.6 - 0.4SRDX § SURMODICS INC SEP NM- NM NM- NM 14 - 7 68 - 23 NM- NM NM NM 0 0 0 0.0 - 0.0 0.0 - 0.0 0.0 - 0.0 0.0 - 0.0 0.0 - 0.0SMA § SYMMETRY MEDICAL INC DEC NM- 86 31 - 21 19 - 6 32 - 10 NM- NM 0 0 0 0 NM 0.0 - 0.0 0.0 - 0.0 0.0 - 0.0 0.0 - 0.0 0.0 - 0.0TFX † TELEFLEX INC DEC 22 - 17 21 - 15 15 - 10 20 - 12 NM- NM 46 44 38 40 NM 2.8 - 2.1 2.8 - 2.1 3.7 - 2.5 3.4 - 2.0 2.2 - 1.4THOR † THORATEC CORP DEC 31 - 18 47 - 24 67 - 40 80 - 32 NM- NM 0 0 0 0 0 0.0 - 0.0 0.0 - 0.0 0.0 - 0.0 0.0 - 0.0 0.0 - 0.0
VAR [] VARIAN MEDICAL SYSTEMS INC SEP 21 - 14 24 - 12 18 - 10 28 - 14 28 - 20 0 0 0 0 0 0.0 - 0.0 0.0 - 0.0 0.0 - 0.0 0.0 - 0.0 0.0 - 0.0ZMH [] ZIMMER HOLDINGS INC DEC 17 - 12 22 - 16 18 - 9 22 - 9 29 - 19 0 0 0 0 0 0.0 - 0.0 0.0 - 0.0 0.0 - 0.0 0.0 - 0.0 0.0 - 0.0
20072011 2010 2009 2008

64 HEALTHCARE: PRODUCTS & SUPPLIES / JANUARY 2013 INDUSTRY SURVEYS
Price / Earnings Ratio (High-Low) Dividend Payout Ratio (%) Dividend Yield (High-Low, %)Ticker Company Yr. End 2011 2010 2009 2008 2007 2011 2010 2009 2008 200720072011 2010 2009 2008 HEALTH CARE SUPPLIES‡ALGN § ALIGN TECHNOLOGY INC DEC 30 - 17 22 - 13 NM- NM 14 - 4 56 - 25 0 0 NM 0 0 0.0 - 0.0 0.0 - 0.0 0.0 - 0.0 0.0 - 0.0 0.0 - 0.0COO † COOPER COMPANIES INC OCT 23 - 14 24 - 14 17 - 7 29 - 7 NM- NM 2 2 3 4 NM 0.1 - 0.1 0.2 - 0.1 0.4 - 0.2 0.6 - 0.1 0.2 - 0.1XRAY [] DENTSPLY INTERNATL INC DEC 23 - 16 21 - 15 20 - 12 25 - 12 28 - 17 12 11 11 10 10 0.7 - 0.5 0.7 - 0.5 0.9 - 0.5 0.8 - 0.4 0.6 - 0.3HAE § HAEMONETICS CORP # MAR 27 - 21 20 - 16 29 - 20 29 - 21 32 - 21 0 0 0 0 0 0.0 - 0.0 0.0 - 0.0 0.0 - 0.0 0.0 - 0.0 0.0 - 0.0ICUI § ICU MEDICAL INC DEC 14 - 11 17 - 13 24 - 15 22 - 13 28 - 20 0 0 0 0 0 0.0 - 0.0 0.0 - 0.0 0.0 - 0.0 0.0 - 0.0 0.0 - 0.0
VIVO § MERIDIAN BIOSCIENCE INC SEP 41 - 22 37 - 24 33 - 18 49 - 26 51 - 24 115 112 80 71 60 5.1 - 2.8 4.6 - 3.0 4.4 - 2.5 2.7 - 1.4 2.5 - 1.2MMSI § MERIT MEDICAL SYSTEMS INC DEC 34 - 19 45 - 31 25 - 12 28 - 16 29 - 19 0 0 0 0 0 0.0 - 0.0 0.0 - 0.0 0.0 - 0.0 0.0 - 0.0 0.0 - 0.0NEOG § NEOGEN CORP # MAY 50 - 27 43 - 21 32 - 14 34 - 20 33 - 16 0 0 0 0 0 0.0 - 0.0 0.0 - 0.0 0.0 - 0.0 0.0 - 0.0 0.0 - 0.0WST § WEST PHARMACEUTICAL SVSC INC DEC 21 - 16 23 - 17 19 - 13 20 - 11 25 - 16 31 33 28 22 24 1.9 - 1.4 2.0 - 1.4 2.2 - 1.5 1.9 - 1.1 1.5 - 1.0
OTHER COMPANIES WITH SIGNIFICANT HEALTHCARE PRODUCTS & SUPPLIES OPERATIONSBMY [] BRISTOL-MYERS SQUIBB CO DEC 16 - 11 16 - 12 16 - 11 17 - 10 32 - 26 61 53 77 97 112 5.3 - 3.7 4.3 - 3.4 7.3 - 4.7 9.7 - 5.7 4.4 - 3.5JNJ [] JOHNSON & JOHNSON DEC 19 - 16 14 - 12 15 - 10 16 - 11 19 - 16 64 44 43 39 44 3.9 - 3.3 3.7 - 3.2 4.2 - 3.0 3.4 - 2.5 2.7 - 2.4
Note: Data as originally reported. ‡S&P 1500 index group. []Company included in the S&P 500. †Company included in the S&P MidCap 400. §Company included in the S&P SmallCap 600. #Of the follow ing calendar year.
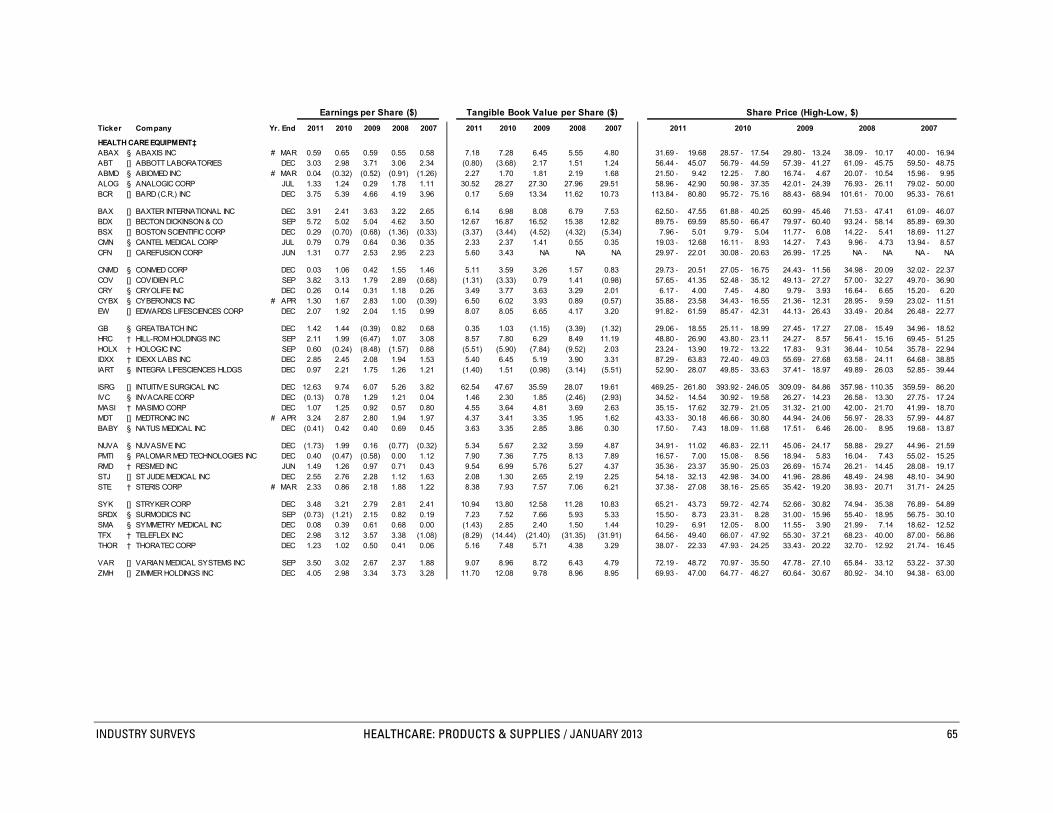
INDUSTRY SURVEYS HEALTHCARE: PRODUCTS & SUPPLIES / JANUARY 2013 65
Earnings per Share ($) Tangible Book Value per Share ($) Share Price (High-Low, $)Ticker Company Yr. End 2011 2010 2009 2008 2007 2011 2010 2009 2008 2007 2011 2010 2009 2008 2007
HEALTH CARE EQUIPMENT‡ABAX § ABAXIS INC # MAR 0.59 0.65 0.59 0.55 0.58 7.18 7.28 6.45 5.55 4.80 31.69 - 19.68 28.57 - 17.54 29.80 - 13.24 38.09 - 10.17 40.00 - 16.94ABT [] ABBOTT LABORATORIES DEC 3.03 2.98 3.71 3.06 2.34 (0.80) (3.68) 2.17 1.51 1.24 56.44 - 45.07 56.79 - 44.59 57.39 - 41.27 61.09 - 45.75 59.50 - 48.75ABMD § ABIOMED INC # MAR 0.04 (0.32) (0.52) (0.91) (1.26) 2.27 1.70 1.81 2.19 1.68 21.50 - 9.42 12.25 - 7.80 16.74 - 4.67 20.07 - 10.54 15.96 - 9.95ALOG § ANALOGIC CORP JUL 1.33 1.24 0.29 1.78 1.11 30.52 28.27 27.30 27.96 29.51 58.96 - 42.90 50.98 - 37.35 42.01 - 24.39 76.93 - 26.11 79.02 - 50.00BCR [] BARD (C.R.) INC DEC 3.75 5.39 4.66 4.19 3.96 0.17 5.69 13.34 11.62 10.73 113.84 - 80.80 95.72 - 75.16 88.43 - 68.94 101.61 - 70.00 95.33 - 76.61
BAX [] BAXTER INTERNATIONAL INC DEC 3.91 2.41 3.63 3.22 2.65 6.14 6.98 8.08 6.79 7.53 62.50 - 47.55 61.88 - 40.25 60.99 - 45.46 71.53 - 47.41 61.09 - 46.07BDX [] BECTON DICKINSON & CO SEP 5.72 5.02 5.04 4.62 3.50 12.67 16.87 16.52 15.38 12.82 89.75 - 69.59 85.50 - 66.47 79.97 - 60.40 93.24 - 58.14 85.89 - 69.30BSX [] BOSTON SCIENTIFIC CORP DEC 0.29 (0.70) (0.68) (1.36) (0.33) (3.37) (3.44) (4.52) (4.32) (5.34) 7.96 - 5.01 9.79 - 5.04 11.77 - 6.08 14.22 - 5.41 18.69 - 11.27CMN § CANTEL MEDICAL CORP JUL 0.79 0.79 0.64 0.36 0.35 2.33 2.37 1.41 0.55 0.35 19.03 - 12.68 16.11 - 8.93 14.27 - 7.43 9.96 - 4.73 13.94 - 8.57CFN [] CAREFUSION CORP JUN 1.31 0.77 2.53 2.95 2.23 5.60 3.43 NA NA NA 29.97 - 22.01 30.08 - 20.63 26.99 - 17.25 NA - NA NA - NA
CNMD § CONMED CORP DEC 0.03 1.06 0.42 1.55 1.46 5.11 3.59 3.26 1.57 0.83 29.73 - 20.51 27.05 - 16.75 24.43 - 11.56 34.98 - 20.09 32.02 - 22.37COV [] COVIDIEN PLC SEP 3.82 3.13 1.79 2.89 (0.68) (1.31) (3.33) 0.79 1.41 (0.98) 57.65 - 41.35 52.48 - 35.12 49.13 - 27.27 57.00 - 32.27 49.70 - 36.90CRY § CRYOLIFE INC DEC 0.26 0.14 0.31 1.18 0.26 3.49 3.77 3.63 3.29 2.01 6.17 - 4.00 7.45 - 4.80 9.79 - 3.93 16.64 - 6.65 15.20 - 6.20CYBX § CYBERONICS INC # APR 1.30 1.67 2.83 1.00 (0.39) 6.50 6.02 3.93 0.89 (0.57) 35.88 - 23.58 34.43 - 16.55 21.36 - 12.31 28.95 - 9.59 23.02 - 11.51EW [] EDWARDS LIFESCIENCES CORP DEC 2.07 1.92 2.04 1.15 0.99 8.07 8.05 6.65 4.17 3.20 91.82 - 61.59 85.47 - 42.31 44.13 - 26.43 33.49 - 20.84 26.48 - 22.77
GB § GREATBATCH INC DEC 1.42 1.44 (0.39) 0.82 0.68 0.35 1.03 (1.15) (3.39) (1.32) 29.06 - 18.55 25.11 - 18.99 27.45 - 17.27 27.08 - 15.49 34.96 - 18.52HRC † HILL-ROM HOLDINGS INC SEP 2.11 1.99 (6.47) 1.07 3.08 8.57 7.80 6.29 8.49 11.19 48.80 - 26.90 43.80 - 23.11 24.27 - 8.57 56.41 - 15.16 69.45 - 51.25HOLX † HOLOGIC INC SEP 0.60 (0.24) (8.48) (1.57) 0.88 (5.51) (5.90) (7.84) (9.52) 2.03 23.24 - 13.90 19.72 - 13.22 17.83 - 9.31 36.44 - 10.54 35.78 - 22.94IDXX † IDEXX LABS INC DEC 2.85 2.45 2.08 1.94 1.53 5.40 6.45 5.19 3.90 3.31 87.29 - 63.83 72.40 - 49.03 55.69 - 27.68 63.58 - 24.11 64.68 - 38.85IART § INTEGRA LIFESCIENCES HLDGS DEC 0.97 2.21 1.75 1.26 1.21 (1.40) 1.51 (0.98) (3.14) (5.51) 52.90 - 28.07 49.85 - 33.63 37.41 - 18.97 49.89 - 26.03 52.85 - 39.44
ISRG [] INTUITIVE SURGICAL INC DEC 12.63 9.74 6.07 5.26 3.82 62.54 47.67 35.59 28.07 19.61 469.25 - 261.80 393.92 - 246.05 309.09 - 84.86 357.98 - 110.35 359.59 - 86.20IVC § INVACARE CORP DEC (0.13) 0.78 1.29 1.21 0.04 1.46 2.30 1.85 (2.46) (2.93) 34.52 - 14.54 30.92 - 19.58 26.27 - 14.23 26.58 - 13.30 27.75 - 17.24MASI † MASIMO CORP DEC 1.07 1.25 0.92 0.57 0.80 4.55 3.64 4.81 3.69 2.63 35.15 - 17.62 32.79 - 21.05 31.32 - 21.00 42.00 - 21.70 41.99 - 18.70MDT [] MEDTRONIC INC # APR 3.24 2.87 2.80 1.94 1.97 4.37 3.41 3.35 1.95 1.62 43.33 - 30.18 46.66 - 30.80 44.94 - 24.06 56.97 - 28.33 57.99 - 44.87BABY § NATUS MEDICAL INC DEC (0.41) 0.42 0.40 0.69 0.45 3.63 3.35 2.85 3.86 0.30 17.50 - 7.43 18.09 - 11.68 17.51 - 6.46 26.00 - 8.95 19.68 - 13.87
NUVA § NUVASIVE INC DEC (1.73) 1.99 0.16 (0.77) (0.32) 5.34 5.67 2.32 3.59 4.87 34.91 - 11.02 46.83 - 22.11 45.06 - 24.17 58.88 - 29.27 44.96 - 21.59PMTI § PALOMAR MED TECHNOLOGIES INC DEC 0.40 (0.47) (0.58) 0.00 1.12 7.90 7.36 7.75 8.13 7.89 16.57 - 7.00 15.08 - 8.56 18.94 - 5.83 16.04 - 7.43 55.02 - 15.25RMD † RESMED INC JUN 1.49 1.26 0.97 0.71 0.43 9.54 6.99 5.76 5.27 4.37 35.36 - 23.37 35.90 - 25.03 26.69 - 15.74 26.21 - 14.45 28.08 - 19.17STJ [] ST JUDE MEDICAL INC DEC 2.55 2.76 2.28 1.12 1.63 2.08 1.30 2.65 2.19 2.25 54.18 - 32.13 42.98 - 34.00 41.96 - 28.86 48.49 - 24.98 48.10 - 34.90STE † STERIS CORP # MAR 2.33 0.86 2.18 1.88 1.22 8.38 7.93 7.57 7.06 6.21 37.38 - 27.08 38.16 - 25.65 35.42 - 19.20 38.93 - 20.71 31.71 - 24.25
SYK [] STRYKER CORP DEC 3.48 3.21 2.79 2.81 2.41 10.94 13.80 12.58 11.28 10.83 65.21 - 43.73 59.72 - 42.74 52.66 - 30.82 74.94 - 35.38 76.89 - 54.89SRDX § SURMODICS INC SEP (0.73) (1.21) 2.15 0.82 0.19 7.23 7.52 7.66 5.93 5.33 15.50 - 8.73 23.31 - 8.28 31.00 - 15.96 55.40 - 18.95 56.75 - 30.10SMA § SYMMETRY MEDICAL INC DEC 0.08 0.39 0.61 0.68 0.00 (1.43) 2.85 2.40 1.50 1.44 10.29 - 6.91 12.05 - 8.00 11.55 - 3.90 21.99 - 7.14 18.62 - 12.52TFX † TELEFLEX INC DEC 2.98 3.12 3.57 3.38 (1.08) (8.29) (14.44) (21.40) (31.35) (31.91) 64.56 - 49.40 66.07 - 47.92 55.30 - 37.21 68.23 - 40.00 87.00 - 56.86THOR † THORATEC CORP DEC 1.23 1.02 0.50 0.41 0.06 5.16 7.48 5.71 4.38 3.29 38.07 - 22.33 47.93 - 24.25 33.43 - 20.22 32.70 - 12.92 21.74 - 16.45
VAR [] VARIAN MEDICAL SYSTEMS INC SEP 3.50 3.02 2.67 2.37 1.88 9.07 8.96 8.72 6.43 4.79 72.19 - 48.72 70.97 - 35.50 47.78 - 27.10 65.84 - 33.12 53.22 - 37.30ZMH [] ZIMMER HOLDINGS INC DEC 4.05 2.98 3.34 3.73 3.28 11.70 12.08 9.78 8.96 8.95 69.93 - 47.00 64.77 - 46.27 60.64 - 30.67 80.92 - 34.10 94.38 - 63.00

66 HEALTHCARE: PRODUCTS & SUPPLIES / JANUARY 2013 INDUSTRY SURVEYS
Earnings per Share ($) Tangible Book Value per Share ($) Share Price (High-Low, $)Ticker Company Yr. End 2011 2010 2009 2008 2007 2011 2010 2009 2008 2007 2011 2010 2009 2008 2007 HEALTH CARE SUPPLIES‡ALGN § ALIGN TECHNOLOGY INC DEC 0.86 0.98 (0.45) 1.20 0.53 3.88 4.91 3.59 3.20 2.19 25.94 - 14.25 21.40 - 13.18 18.85 - 6.10 17.22 - 4.88 29.71 - 13.07COO † COOPER COMPANIES INC OCT 3.74 2.48 2.23 1.46 (0.25) 11.13 6.34 3.73 0.77 0.54 84.20 - 52.60 59.11 - 34.28 38.99 - 16.50 41.66 - 10.17 57.60 - 36.68XRAY [] DENTSPLY INTERNATL INC DEC 1.73 1.85 1.85 1.90 1.71 (8.00) 3.23 2.93 1.39 2.07 40.37 - 28.35 38.15 - 27.76 36.80 - 21.80 47.06 - 22.85 47.84 - 29.44HAE § HAEMONETICS CORP # MAR 2.64 3.19 2.29 2.34 2.01 20.59 18.28 15.19 16.32 14.62 70.40 - 54.99 64.83 - 50.50 65.34 - 46.78 67.49 - 48.79 64.29 - 42.64ICUI § ICU MEDICAL INC DEC 3.23 2.27 1.80 1.72 1.62 22.18 18.89 17.33 16.44 14.76 45.99 - 35.38 39.20 - 30.55 44.06 - 26.18 38.08 - 22.14 45.02 - 31.96
VIVO § MERIDIAN BIOSCIENCE INC SEP 0.66 0.66 0.81 0.75 0.67 2.53 2.47 2.98 2.72 2.35 27.37 - 14.81 24.44 - 16.03 26.41 - 14.79 37.00 - 19.43 34.24 - 16.25MMSI § MERIT MEDICAL SYSTEMS INC DEC 0.59 0.35 0.64 0.60 0.46 5.70 3.37 4.51 4.96 4.34 19.94 - 11.38 15.88 - 11.02 15.92 - 7.66 17.09 - 9.88 13.20 - 8.71NEOG § NEOGEN CORP # MAY 0.96 0.99 0.78 0.63 0.56 6.11 4.92 3.50 3.44 3.13 47.92 - 25.59 42.47 - 20.51 24.70 - 11.00 21.30 - 12.73 18.62 - 9.21WST § WEST PHARMACEUTICAL SVSC INC DEC 2.24 1.96 2.21 2.65 2.18 14.58 13.76 12.40 10.15 9.94 47.96 - 35.50 44.84 - 32.74 41.77 - 27.85 52.00 - 29.52 54.83 - 35.20
OTHER COMPANIES WITH SIGNIFICANT HEALTHCARE PRODUCTS & SUPPLIES OPERATIONSBMY [] BRISTOL-MYERS SQUIBB CO DEC 2.18 1.80 1.63 1.60 1.00 4.29 4.17 3.94 3.16 2.14 35.44 - 24.97 28.00 - 22.24 26.62 - 17.23 27.37 - 16.00 32.35 - 25.73JNJ [] JOHNSON & JOHNSON DEC 3.54 4.85 4.45 4.62 3.67 8.37 8.97 7.04 5.35 5.12 68.05 - 57.50 66.20 - 56.86 65.41 - 46.25 72.76 - 52.06 68.75 - 59.72
Note: Data as originally reported. ‡S&P 1500 index group. []Company included in the S&P 500. †Company included in the S&P MidCap 400. §Company included in the S&P SmallCap 600. #Of the follow ing calendar year. J-This amount includes intangibles that cannot be identif ied.
The analysis and opinion set forth in this publication are provided by Standard & Poor’s Equity Research Services and are prepared separately from any other analytic activity of Standard & Poor’s.In this regard, Standard & Poor’s Equity Research Services has no access to nonpublic information received by other units of Standard & Poor’s.
The accuracy and completeness of information obtained from third-party sources, and the opinions based on such information, are not guaranteed.