healthcare premises cost guides (hpcgs) · engineering space: space to house mechanical and...
TRANSCRIPT

Healthcare Premises Cost Guides (HPCGs)
Second edition

DH INFORMATION READER BOX
Policy EstatesHR / Workforce Commissioning
Management IM & T
Planning / Performance Finance
Clinical Social Care / Partnership Working
Document Purpose
Gateway ReferenceTitle
Author
Publication DateTarget Audience
Circulation List
Description
Cross Ref
Superseded Docs
Action Required
TimingContact Details
14457
Best Practice Guidance
For Recipient's Use
Healthcare premises cost guides (HPCGs)
Quarry House
Leeds
Jonathan MillmanDepartment of Health
Gateway Reviews, Estates and Facilities DivisionRoom 3N10
LS2 7UE
DH Gateway Reviews, Estates and Facilities Division
N/A
0How to cost a hospital (NHS Estates, 2005)AAA
August 2010
PCT CEs, NHS Trust CEs, Foundation Trust CEs , Directors of Finance, Medical Directors, Directors of Nursing, PCT PEC Chairs, NHS Trust Board Chairs, Special HA CEs, Care Trust CEs
#VALUE!
The Healthcare Premises Cost Guides (HPCGs) are to be used to carry out cost estimates of healthcare buildings at SOC and OBC stages. They provide a cost per square metre for building and engineering services costs for different hospital departments.
0N/A
0
N/A

Healthcare Premises Cost Guides (HPCGs)

© Crown copyright 2010
This document/publication is not covered by the HMSO Click-Use Licences for core or added-value material.
If you wish to re-use this material, please send your application to:
Copyright applications The Copyright Unit Office of Public Sector Information Information Policy Team Kew Richmond Surrey TW9 4DU e-mail: [email protected]
First published 2010 Revised edition August 2010
ISBN 978-1-907275-08-1
Healthcare Premises Cost Guides

iii
Building Cost Information Service (BCIS)
Capita Symonds
Cyril Sweett
Davis Langdon
DSSR
Holbrow Brookes
Inventures
Northcroft
Turner & Townsend
Department of Health, Social Services and Public Safety Northern Ireland (DHSSPSNI)
NHS National Services Scotland
Welsh Health Estates
West Midlands SHA
Acknowledgements

Healthcare Premises Cost Guides
iv
Circulation space: Corridors, stairs, internal walls, partitions and integrated panelling systems within the confines of a department.
Communication space: Main hospital streets, corridors between departments, lifts and main/shared stairs.
Elemental cost models: Detailed cost plans drawn up for the example schedules of accommodation and on which the HPCGs are based. Format of the cost plans reflects that used by the BCIS.
Example schedules of accommodation: Schedules of accommodation published by the Department of Health to accompany the Health Building Note series.
Engineering space: Space to house mechanical and electrical services including plant rooms, IT hub rooms, switch rooms, service risers and lift machine rooms.
Gross internal area (GIA): Departmental floor area including allowances for circulation space, communication space and engineering space.
Healthcare Premises Cost Guides (HPCGs): Cost per square metre to cover building and engineering services costs of healthcare premises.
HPCG rate: Four rates of HPCGs have been identified: low, medium, high and super. These have been applied to the example schedules of accommodation that have not been costed in detail.
Net internal area (NIA): Departmental floor area excluding allowances for circulation space, communication space and engineering space.
Glossary of terms

v
ADB = Activity DataBase
BCIS = Building Cost Information Service
BIS = Department for Business Innovation and Skills
BREEAM = BRE environmental assessment method
CHP = combined heat and power
CT = computed tomography
DH = Department of Health
GIA = gross internal area
HV/LV = high voltage/low voltage
ICT = information and communications technology
IPS = isolated power supply
MIPS = median index of public sector
MRI = magnetic resonance imaging
NIA = net internal area
OBC = outline business case
SOC = strategic outline case
UPS = uninterruptible power supply
Acronyms

Healthcare Premises Cost Guides
vivi
Changes since the previous edition of this guidance
The following changes have been made to the HPCG guidance since it was first issued in July 2010:
• The guidance no longer provides details of the circulation, communication and engineering space allowances for primary and community care buildings but refers to Health Building Note 11-01 instead.
• The worked example in Appendix 4 has been replaced with a new worked example.
• The elemental cost models have been inserted at Appendix 6.

vii
Contents
AcknowledgementsGlossary of termsAcronymsChapter 1 Introduction 1
OverviewScope of this documentBenefits of the HPCGs Exclusions from the HPCGs Applying the HPCGs
Chapter 2 Changes to DH example schedules of accommodation 3OverviewDifferentiating between public, clinical and staff spacesEngineering space, circulation space and communication space allowances
Chapter 3 Engineering space allowance 4OverviewEngineering space allowances for different engineering servicesInclusions and exclusions to the engineering space allowancesAdjusting the published engineering space allowancesMethodology used to calculate the engineering space allowances
Chapter 4 Understanding the HPCGs 8OverviewQuantifying building elements for the example schedulesCosting the example schedules of accommodation
Chapter 5 Engineering service costs 11OverviewAdjustment to engineering service costs relating to central equipmentEngineering service cost assumptions Mechanical services (including services serving group 1 and 2 equipment)Electrical services (including services serving group 1 and 2 equipment)EquipmentExclusionsEmergency preparedness and resilience
Chapter 6 Cost adjustments 14OverviewCommunication space allowanceBREEAMRefurbishment/extensionsSpecification changes Costs for centralised engineering infrastructuresStorey adjustmentEconomies of scale
Chapter 7 Completing the OBC cost forms 16OverviewSite-specific costs
vii
Healthcare Premises Cost Guides
viii
External worksAdjusting costs to reflect location differences
Worked exampleProfessional fees Non-works costsEquipment costsPlanning contingency Optimism bias Managing risk Risk related allowancesInflation and the use of indices Cash-flow
Appendix 1 HPCGs for example schedules of accommodation 22Appendix 2 Costing a multi-department unit at SOC/OBC stage 25Appendix 3 Costing a multi-department unit on a room by room basis 31Appendix 4 Costing a whole hospital 33Appendix 5 Circulation space, communication space and engineering space allowances 35Appendix 6 Elemental cost plans 38Appendix 7 Outline specification and design notes 82References 94
1
1 Introduction
Overview1.1 The Healthcare Premises Cost Guides (HPCGs)
are to be used to carry out cost estimates of healthcare buildings at SOC and OBC stages.
1.2 As schemes develop beyond OBC stage the HPCGs should be replaced by more detailed cost estimates.
1.3 The HPCGs provide a cost per square metre for building and engineering services costs for different hospital departments. They are based on Health Building Notes and associated example schedules of accommodation published by the Department of Health (DH).
1.4 The HPCGs have been calculated by costing a cross-section of the example schedules of accommodation in detail. From this information, four HPCG rates have been produced (low, medium, high and super) and have been allocated to the remaining example schedules of accommodation. See Appendix 1 for a full list of the HPCGs.
1.5 For each example schedule of accommodation that has been costed in detail, an elemental cost model has been produced. See Chapter 4 for details.
1.6 Cost estimates should be based on the most up to date and detailed information available. Should it become apparent from project specific drawings or specifications that the areas or percentage allowances on which the HPCGs are based are not reflective of a particular project then reasonable adjustments should be made to the HPCGs or the underlying elemental cost models.
1.7 The HPCGS are based on departments located in a new build 2-storey building and constructed as part of a general acute (multi-purpose) hospital with no abnormal works or planning conditions.
1.8 Please note that there are some exceptions to this assumption. For instance, the HPCGs for the example schedules of accommodation associated with Health Building Note 11-01 – ‘Facilities for primary and community care services’ are based on
standalone buildings. It is therefore advisable that all Health Building Notes are consulted to understand the cost basis before any changes are made to the HPCGs or elemental cost models.
1.9 The HPCGs will need to be amended for refurbishments.
1.10 The HPCGs replace the Departmental Cost Allowance Guides (DCAGs) with effect from April 2010.
Scope of this document1.11 The purpose of this document is to explain:
• how the HPCGs have been calculated;
• how they can be used for costing healthcare buildings at SOC and OBC stages;
• how costing information should be inserted into the appropriate SOC and OBC cost forms.
Benefits of the HPCGs 1.12 The HPCGs meet the following criteria:
• they have been validated using real schemes;
• the elemental cost models from which the HPCGs have been derived are presented in accordance with the Building Cost Information Services (BCIS) elemental cost plans (see Chapter 4 for details);
• they are easy to use and understand;
• they enable a robust initial cost budget to be established at SOC stage;
• they enable more detailed cost estimates to be established at OBC stage;
• they reduce the reliance of adding a large percentage allowance for on-costs.
1.13 The cost rates reflect:
• modern forms of construction;

Healthcare Premises Cost Guides
2
• BREEAM and other energy, environment and sustainability issues (see Chapter 4 for further details);
• the guidance in current Health Technical Memoranda;
• control of infection and decontamination risks;
• clinical risks around service resilience requirements;
• current technology and statutory requirements.
Exclusions from the HPCGs 1.14 The HPCGs do not cover the following costs:
• supply of group 2 equipment;
• group 3 and 4 equipment;
• commercial operational costs for example bespoke shop fittings;
• site-specific costs, for example asbestos removal and demolition;
• external works;
• non-works costs, for example land purchase costs, statutory and local authority charges, building regulations and planning fees, decanting costs, commissioning and decommissioning;
• professional fees;
• VAT.
1.15 Site-specific costs will be largely determined by site location/characteristics (such as an inner-city
location or poor ground conditions) and by the condition/type of any building to be refurbished.
1.16 Individual elements within the elemental cost models can be adjusted to suit refurbishment projects and site-specific costs added accordingly.
1.17 Project teams should assess all likely site, building and engineering specific costs (including external works) at the earliest opportunity and ensure that appropriate allowances are included for these.
Applying the HPCGs1.18 The HPCGs can be used to:
• cost a department(s) based on its overall gross internal area (GIA);
• cost a department(s) based on each room within that department, categorised according to whether they are public, clinical or staff spaces;
• cost a whole hospital on a multi-department basis.
1.19 Three worked examples have been provided to illustrate these applications:
• Appendix 2: Costing a multi-department unit based on departmental GIAs;
• Appendix 3: Costing a multi-department unit on a room by room basis;
• Appendix 4: Costing a whole hospital on a multi-department basis.

3
Overview2.1 The example schedules of accommodation
published by DH from 2010 onwards differ from previous schedules of accommodation in a couple of ways:
2.2 The old allowances (3% engineering zone, 5% planning allowance plus variable circulation space allowance) have been replaced with separate allowances for engineering space, communication space and circulation space.
2.3 The new example schedules differentiate between public, clinical and staff spaces.
Differentiating between public, clinical and staff spaces2.4 Each space within the new example schedules of
accommodation is categorised according to its location (or zone) in the department. The three space types correspond to three zones, which are defined as follows:
• Public zone: The zone within the department that contains the reception and waiting area and is accessible to the public.
• Clinical zone: The zone from which the delivery of the departmental function occurs. Most patient/client contact spaces will be located here as will any clinical and staff support spaces required in the immediate vicinity.
• Staff zone: This zone contains staff support spaces that do not need to be in the immediate vicinity of the patient/public spaces.
Engineering space, circulation space and communication space allowances2.5 The new example schedules of accommodation
include allowances for engineering space, circulation space and communication space.
2.6 Each allowance is expressed as a percentage of the net internal area (NIA) and when added to the NIA produces the GIA.
2.7 The allowances are based on the following definitions:
• Engineering space: This includes all mechanical and electrical spaces such as plant rooms, ICT hub rooms, switch rooms, service risers, lift machine rooms etc. For further details see Chapter 3.
• Circulation space: This includes all corridors, stairs, internal walls, partitions and integrated panelling systems within the confines of a department.
• Communication space: This includes main hospital streets, corridors between departments, lifts and main/shared stairs. A figure of 10% has been used in the example schedules of accommodation. However, this should be adjusted to suit project layouts as more detailed information becomes available.
2.8 Appendix 5 provides a list of the allowances for engineering space, circulation space and communication space that should be applied to example schedules of accommodation presented in the old format.
2 Changes to DH example schedules of accommodation

Healthcare Premises Cost Guides
4
Overview3.1 This chapter describes the method used to estimate
the engineering space allowances in the new example schedules of accommodation. It also explains how to adjust these allowances for real project schedules of accommodation.
3.2 The engineering space allowances cover the space required to house mechanical and electrical engineering equipment for individual clinical departments. They are expressed as a percentage of the NIA of the department.
3.3 The allowances should be sufficient to enable current DH engineering guidance and best practice standards to be met. They take into account present technology and the most likely functional and physical location for the department in question.
3.4 It has generally been assumed that each department (example schedule of accommodation) is located in a general acute (multi-purpose) hospital with an NIA of approximately 15,000 m2 and a range of departments.
3.5 For information on the engineering space allowances for primary and community care buildings, see Health Building Note 11-01.
3.6 The engineering space allowances are meant to be used as a guide before plan drawings are available.
Engineering space allowances for different engineering services3.7 Table 3.1 shows the engineering space allowances
for different engineering services. This data was
3 Engineering space allowance
Table 3.1 Engineering space allowances for different engineering services
Engineering service Engineering space allowance (% of NIA) Space includes
Heat source 1.5% – 2.9% Boilers, pumps, heat exchangers, utility service equipmentCHP plant 0.6% – 1.7% Electrical generator, waste heat boiler, control equipmentDomestic hot water plant
0.8% – 5.5% Heat exchanger, pumps, storage
Cold water storage 1.2% – 2.4% Storage tank, booster setVentilation plant 4.4% – 23.8% Mechanical supply and extract air handling equipment,
pipework and ductwork connectionsAir cooling plant 0.2% – 1.0% Air-cooled chiller units, condensing units, not cooling towerPiped medical gases 0.0% – 0.6% Gas manifolds, vacuum-insulated evaporator (VIE) units,
medical air and vacuum compressorsElectrical switchrooms 1.0% – 1.5% Utility supply equipment, metering, main HV/LV switchgearSecondary power source plant
1.2% – 5.5% Emergency generators, UPS, IPS units
Fuel storage 0.1% – 0.3% Emergency generator fuel storage and boiler fuel-oil standby Local electrical switch cupboards
0.3% – 0.5% Local distribution boards, nurse call/miscellaneous power supplies, communication junction boxes
Communication/ICT equipment
0.5% – 0.9% ICT hub room, telephone main distribution frame room
Lift motor rooms 0.0% – 0.7% Electric or hydraulic liftsService risers 0.2% – 0.9% Vertical route for ventilation ductwork, pipework and cable
risersTotal 12% 48%

3 Engineering space allowance
5
collated as part of the process of producing the engineering space allowances for the new example schedules of accommodation.
Inclusions and exclusions to the engineering space allowances3.8 The engineering space allowances in the new
example schedules of accommodation include space to access equipment within plant rooms for maintenance purposes.
3.9 Space within walls and ceiling voids used to distribute engineering services throughout the department are excluded (except for service risers) as this is covered by the circulation space allowance.
3.10 No allowance has been made for additional space for the future expansion of engineering services.
3.11 In the case of the example schedules of accommodation for individual clinical departments, the overall engineering space allowances include space for dedicated engineering equipment that provides services exclusively for the department in question. They also include space requirements for central plant, apportioned to reflect the engineering demand or NIA, as appropriate, of the department in question.
3.12 The following engineering services and equipment have been included and assumed to be provided centrally to serve the department in question and other departments:
• heat source (for example boiler plant);
• CHP facilities;
• mains HV/LV electrical distribution;
• emergency standby generators together with associated fuel storage;
• piped medical gas distribution (for example gas manifolds, VIE units, medical air and vacuum compressors);
• cold water storage;
• domestic hot water services;
• lift machine rooms.
3.13 The following engineering services and equipment have been included and assumed to be dedicated to the department in question:
• ventilation;
• air cooling;
• department ICT hub/communication distribution equipment;
• UPS and IPS secondary power sources;
• local electrical switch cupboards;
• service risers.
Adjusting the published engineering space allowances3.14 The engineering space requirements of healthcare
departments are affected by the following factors:
• the degree of technical complexity of engineering service requirements;
• the proportion of clinical, public and staff spaces;
• the ability to provide engineering services from central plant;
• the potential for engineering service equipment to share plant rooms.
• the NIA of the department;
• the NIA of the building complex in which the department sits and its relationship to other departments;
• the number of floors of the department/building complex.
3.15 As scheme specific information becomes available during the procurement process, the published engineering space allowances should be continually reviewed and adjusted to correlate more closely with actual project needs.
3.16 It is important that each factor leading to an adjustment of the engineering space allowance is considered separately for some may necessitate an increase in engineering space requirements, others a decrease.
3.17 Table 3.1 may be used to assess the amount by which the published engineering space allowance figure might require adjustment.
3.18 Figure 3.1 may be used to provide a reasonable adjustment of the engineering space allowances to allow for variations in individual departmental NIA; for example, if a real scheme departmental NIA is 40% higher than the published example schedule of accommodation value, then from the chart the overall engineering space allowance should be able to be reduced by 4 percentage points.

Healthcare Premises Cost Guides
6
3.19 Figure 3.2 may be used to provide a reasonable adjustment of the engineering space allowances to allow for variations in the NIA of the overall building complex for example if a real scheme building NIA is 35,000 m2 (that is, 20,000 m2 larger than the total building value of 15,000 m2
used to calculate the published engineering space allowances), then from the chart the overall engineering space allowance for the building complex should be able to be reduced by 3 percentage points.
Figure 3.1 Adjusting overall engineering space allowance to reflect increases in departmental NIA
Figure 3.2 Adjusting overall engineering space allowance to reflect variations in building complex NIA (against base of 15,000 m2)
–9%
–8%
–7%
–6%
–5%
–4%
–3%
–2%
–1%
0%
0 0.1 0.2 0.3 0.4 0.5 0.6 0.7 0.8 0.9 1
Percentage increase in departmental NIA
Perc
enta
ge p
oint
red
ucti
on in
eng
inee
ring
spa
ce a
llow
ance
–8%
–7%
–6%
–5%
–4%
–3%
–2%
–1%
0
1%
2%
3%
4%
5%
6%
0 5000 10,000 15,000 20,000 25,000 30,000 35,000 40,000 45,000 50,000 55,000 60,000 65,000
Building complex NIA (m2)
Perc
enta
ge p
oint
cha
nge
in e
ngin
eeri
ng s
pace
allo
wan
ce

3 Engineering space allowance
7
Methodology used to calculate the engineering space allowances3.20 This section describes the method used to ascertain
the engineering space allowances shown in the new example schedules of accommodation.
3.21 The contribution for services provided by central plant were calculated by first determining the area required for the central plant, inclusive of associated equipment (for example pumps, tanks, distribution pipework/cable connections) and then apportioning this according to the engineering capacity demands or NIA of the department, whichever was appropriate.
3.22 Using representative energy consumption data and industry norms the space requirements for central plant were derived by summating the estimated loads and service demands of each department to establish the total capacity and equipment numbers necessary to meet Health Technical Memorandum requirements for the base building complex used (that is, 15,000 m2 NIA). The relevant areas were then established from real schemes and manufacturers’ product information.
3.23 The space allowance for dedicated engineering equipment serving the entire department was calculated in same way as for central plant but was apportioned only between public, clinical and staff spaces within the department.
3.24 Capacity and space requirements for services governed by departmental travel distances and NIAs (for example service risers, switch cupboards, ICT hub rooms, lifts) were determined by applying general rules of thumb and typical ratios obtained from real schemes.
3.25 In the case of central plant (for example lift machine rooms), the resultant engineering space was apportioned in relation to the department NIA. For dedicated plant serving the entire department (for example switchcupboards), the relevant engineering space was apportioned only between public, clinical and staff spaces .
3.26 It has been assumed that lifts have an associated machine room for which a space allowance was made based on British Standards. Where machine-room-less lifts are installed, the engineering space allowance will require adjustment.

Healthcare Premises Cost Guides
8
Overview4.1 This chapter outlines the method used to cost the
example schedules of accommodation from which the HPCGs have been derived.
4.2 For each example schedule of accommodation that has been costed in detail, four elemental cost models have been produced (showing overall costs as well as the breakdown of costs for public, clinical and staff space). The elemental cost models are provided in Appendix 6.
4.3 The format of the elemental cost model reflects the industry standard produced by the Building Cost Information Service (BCIS) of the Royal Institution of Chartered Surveyors (RICS).
4.4 Average cost data from completed schemes was used to complete the elemental cost models. The building and engineering elements were both priced using a MIPS index level of 480. See Appendix 7 (BCIS specification) for details.
4.5 Each elemental cost model provides a cost per square metre for each building element.
4.6 Each overall elemental cost model provides the overall cost per square metre for the department.
4.7 The example schedules of accommodation provide the departmental NIA. Allowances were added for engineering space, circulation space and communication space, to arrive at the GIA. See Appendix 5 for details of the allowances.
Quantifying building elements for the example schedules4.8 The quantity factors (QFs) in Table 4.1 were used
to quantify six of the building elements. The QFs were multiplied by the GIA of the example schedules of accommodation to produce the elemental quantity areas.
4.9 The QFs are based on earlier studies of the area relationships between GIA and these elements in hospital buildings.
Costing the example schedules of accommodation4.10 The following steps explain how costs were built up
for each element of the example schedules of accommodation costed using the new methodology. See Chapter 5 for further information on engineering services costs.
1. Substructure: A cost per square metre was applied to the elemental quantity area to allow for standard strip foundations (no more than 1.5 m deep to top of footing) and 750 mm wide by 350 mm thick concrete. The cost rate allows for ground floor slab and construction up to damp-proof membrane (DPM) level.
2A. Frame: A cost per square metre was applied to the elemental quantity area to allow for frame and structural works.
2B. Upper floors: A cost per square metre was applied to the elemental quantity area to allow for structural floors and openings.
2C. Roof: A cost per square metre was applied to the elemental quantity area to allow for roof structure, coverings, rainwater goods and mansafe system. The cost rate allows for 10% glazing/roof lights.
2D. Stairs: An allowance of one staircase per department was included. For multi-department schedules of accommodation, the cost allowance provided a contribution towards main staircases and fire escape stairs.
2E. External walls: A cost per square metre was applied to the elemental quantity area to allow for 70% solid and 30% glazed external walls.
2F. Windows and external doors: A cost per square metre was applied to the elemental quantity area to allow for opening lights, main entrance doors, fire escape doors and external plant room doors.
2G. Internal walls and partitions: The area of internal walls was calculated using the linear dimensions of each room contained within the example schedule. The area of corridor walls was
4 Understanding the HPCGs

4 Understanding the HPCGs
9
calculated based on 1.8 m wide corridors and 3.0 m wide hospital streets. Structural internal walls were calculated around core areas. The cost rate applied varied according to the location and type of wall.
2H. Internal doors: The number of internal doors was calculated using the Activity DataBase (ADB) sheets for each room listed in the example schedules of accommodation. The cost rate applied was based on the type of door construction noted on the ADB sheets.
3A. Wall finishes: The internal wall area plus the internal face of solid external walls were calculated. Wall finishes were costed using a variety of costs depending on the specification deemed necessary. The cost rates allow for wall protection to corridors.
3B. Floor finishes: The floor area of the rooms listed in the example schedules of accommodation were calculated with additions for circulation space and communication space. Floor finishes were costed using a variety of costs depending on the specification deemed necessary.
3C. Ceiling finishes: The ceiling areas of the rooms listed in the schedules of accommodation were calculated with additions for circulation space and communication space. Ceiling finishes were costed using a variety of costs depending on the specification deemed necessary.
4. Fittings and furnishings: Costed using the ADB sheets for each room listed in the example schedules of accommodation. No contingencies, costs for lifting heavy equipment into place or equipment specialist fees were added.
5A. Sanitary appliances: Costed using the ADB sheets for each room listed in the example schedules. No contingencies were added.
5C. Disposal installations: Costed by applying a cost per square metre to the GIA of the example schedule.
5N. Builders’ work in connection (BWIC): Costed at 5% of the costs for mechanical and electrical services, sanitary appliances and disposal installations.
5O. Profit and attendance: Costed at 7% of the costs for sanitary appliances, disposal installations and BWIC. (Costs for mechanical and electrical services allow for profit and attendance on services.)
5B. Services equipment: Costed using equipment manufacturers’ cost data and applying a cost per square metre to the GIA of the example schedule of accommodation.
5D. Water installations: Costed by applying a cost per square metre to the GIA of the example schedule of accommodation with specific costs added for specialist dedicated equipment, such as reverse osmosis water treatment for dialysis equipment, as appropriate.
5E. Heat source (inc. in 5F): Costed using the cost of the centralised boiler and control installation apportioned in accordance with the estimated specific heat load demands of the example schedule of accommodation.
5F. Space heating/air treatment: Costed by applying a cost per square metre to the GIA of the example schedule of accommodation to allow for general distribution systems with specific costs added for specialist dedicated equipment, such as local air-cooler units or under-floor heating, as appropriate.
5G. Ventilation system: Costed by applying a cost per square metre to the GIA of the example schedule of accommodation to allow for general ventilation distribution systems with specific costs added for
Element Quantity factor of GIA Notes
Substructure 49% Based on a 2-storey construction Frame 100%Upper floors 48% Based on a 2-storey construction Roof 60% Allows for a 5-degree roof pitchExternal walls 52% Based on a 2-storey constructionWindows and external doors 10% Based on a 2-storey construction and all external
doors being at ground floor level
Table 4.1 Quantity factors for building elements

Healthcare Premises Cost Guides
10
specialist dedicated equipment, such as ultra-clean theatre ventilation plant, CT suites, as appropriate. (Any abnormal ventilation requirements due to site-specific issues will need to be included as a site-specific cost.)
5H. Electrical installations: Costed by applying a cost per square metre to the GIA of the example schedule of accommodation to allow for general electrical power and lighting distribution systems with specific costs added for centralised items such as utility services, main switchboards, generators and CHP equipment apportioned in accordance with the estimated total electrical load of the example schedule of accommodation. Costs were added for specialist dedicated equipment such as theatre operating lights, UPS units, IPS units and docking stations, as appropriate.
5I. Gas installations: Costed using the total cost of the fuel oil and gas installation for centralised equipment apportioned in accordance with the estimated specific heat load demands of the example schedule of accommodation.
5J. Lifts and conveyors: Costed using total cost for lifts and conveyors apportioned in accordance with the GIA of the example schedule of accommodation.
5K. Protective installations: Costed by applying a cost per square metre to the GIA of the example schedule of accommodation with specific costs added for specialist equipment, such as local smoke extract systems, as appropriate.
5L. Communications installations: Costed by applying a cost per square metre to the GIA of the example schedule of accommodation for distribution systems with specific costs added for specialist equipment, such as bedhead services equipment, as appropriate. The costs allow for data cabling to bedhead services but exclude any patient entertainment systems.
5M. Special installations: Costed by applying a cost per square metre to the GIA of the example
schedule of accommodation to allow for common distribution systems with specific costs for specialist dedicated equipment/systems, as appropriate. The following were included as special installations: pre-installation work for imaging equipment, piped medical gas manifolds, pneumatic tube systems and building management systems.
6A. Site works: Not costed. (Costs relating to external works vary significantly from project to project due to site size, site topography and the availability of utility services. Project teams therefore need to adjust the external works cost allowances to suit.)
6B. Drainage: Not costed.
6C. External services: Not costed.
7. Preliminaries: Costed at 15% of building and engineering costs.
8A. Design risk: Costed at 5% of building and engineering costs.
8B. Employers variation risk: Not costed.
8C. BREEAM allowance: Included to achieve a BREEAM rating of excellent. This allows for implementing requirements arising from the Simplified Building Energy Model (SBEM) calculations necessary to satisfy the Energy Performance of Buildings Directive (EPBD) and Building Regulations. Allowance does not include for sustainable power and energy generation due to the varying methods and costs incurred for site-specific costs. Allowance included at 3% of building and engineering costs.
Costs for specialist services such as carrying out SBEM calculations, thermal modelling and surveys are not included in the building and engineering costs. Costs for these should be included in the professional fees section.

11
Overview5.1 The HPCGs include an allowance for engineering
service costs to allow for the supply, installation, testing and commissioning of relevant engineering services. See Appendix 7 for full details.
5.2 Base engineering costs have been established using values derived from existing schemes and industry reference guides. These have been adjusted, in accordance with the criteria described below, to reflect the specific engineering requirements of the accommodation listed in the published example schedules of accommodation.
5.3 The following general rules have been applied to the establishment of engineering services costs:
1. For centralised engineering services delivered fairly uniformly across the building, such as water, heating and electrical distribution systems, an average cost/m2 relevant to each engineering system has been applied based on the size of the department. This cost covers primary engineering equipment and associated distribution systems.
2. Specific cost allowances have then been allocated to the relevant public, clinical or staff spaces to cover the cost of supplying and installing dedicated engineering equipment or services to particular rooms or areas (for example uninterruptible power supply (UPS) units and isolated power supply (IPS) units for operating theatres, ultra-clean theatre ventilation equipment, pre-installation requirements for imaging equipment etc).
Adjustment to engineering service costs relating to central equipment5.4 In circumstances where items of centralised
engineering plant is not required or existing equipment is available of sufficient capacity to serve the new department, it will be necessary for users to make suitable adjustments to the relevant engineering service costs.
5.5 This may be achieved by omitting or reducing the relevant service cost from the elemental cost model taking into consideration project specific requirements and any costs to provide modifications to local sub-distribution equipment.
Engineering service cost assumptions 5.6 The engineering service costs were calculated based
on the following general assumptions:
• Engineering services meet relevant statutory requirements, guidance in Health Building Notes and Health Technical Memoranda, and best practice industry standards.
• Engineering services are contained within ceiling voids, equipment rooms, wall cavities, floors, trunking or boxed-in assemblies or buried below ground level.
• Central boiler plant is a minimum of two high efficiency units rated at 100% of demand capacity and gas fired with duel fuel oil standby facilities in accordance with Health Technical Memoranda.
• Best practice energy conservation techniques and equipment is installed, inclusive of gas fuelled CHP equipment complete with waste heat boiler.
• Emergency standby generators meet N+1 resilience requirements and are of the diesel fuelled turbo-charged type. Synchronising control units are fitted.
• Primary electrical supplies are taken at HV or LV according to estimated maximum demands and distributed in accordance with the most appropriate Health Technical Memorandum 06-01 distribution strategy. Suitable surge suppression, metering and power factor correction equipment are provided.
• Engineering services terminal outlets are surface fixed in equipment rooms and electrical switch cupboards but generally flush fixed elsewhere,
5 Engineering service costs

Healthcare Premises Cost Guides
12
including outlets fitted within surface mounted specialised trunking (for example bedhead services).
• Engineering services are distributed using galvanised steel conduit, cable ladder racks and cable trays, trunking, pipework and ventilation ducting to enhance durability, strength, electromagnetic compatibility (EMC) and fire resistance.
• Electrical cables and wiring are of the zero halogen and low smoke (OHLS) type with suitable fire rated cables for fire alarm systems.
• ICT and voice over internet protocol (VOIP) telephone networks use structured wiring systems based on shielded twisted pair/unshielded twisted pair (Stp/Utp), coaxial and/or fibre optic cable.
• Engineering services required for the pre-installation of specialised equipment such as imaging, ICT and dental services are installed in accordance with the specialist equipment manufacturer’s requirements.
• Primary utility and sub mains distribution services are metered in support of sustainability and Display Energy Certificate (DEC) requirements.
• Electricity, water and gas services to commercial tenanted areas are sub-metered.
• External connections to water and electricity are provided where docking stations are required.
• Operating theatres are served from individual dedicated ventilation and air conditioning equipment. Additional ventilation systems for ultra-clean theatres are included where specified in the example schedules of accommodation.
• Engineering services associated with multifunctional rooms have the capacity to cope with the maximum engineering demand requirements of each room.
• Engineering services are designed and installed to comply with control of infection requirements for example air filtration requirements.
Mechanical services (including services serving group 1 and 2 equipment)5.7 The following mechanical services are included,
where relevant, in the engineering services costs:
• heating systems;
• mechanical ventilation systems;
• chilled water and cooling systems;
• building management control systems;
• hot and cold water supply, storage, distribution and treatment systems;
• fuel storage and distribution systems (for example oil, gas);
• piped medical gas equipment and distribution systems, including pendants, bed head trunking, compressors and vacuum equipment;
• pneumatic air tube transport systems.
Electrical services (including services serving group 1 and 2 equipment)5.8 The following electrical services are included, where
relevant, in the engineering services costs:
• mains electricity supply and distribution systems, including secondary power sources such as generators and/or UPS systems where required for resilience purposes;
• departmental distribution board and final wiring systems;
• IPS systems;
• general and emergency lighting systems;
• external lighting control systems;
• call and attack alarm systems;
• small power installation systems;
• fire detection and alarm systems;
• security alarm and monitoring systems, including CCTV and controlled drug cupboard alarms;
• piped medical gas alarm systems;
• TV/radio aerial and distribution systems;
• structured cable distribution systems for telephones and data, inclusive of containment system, wiring and termination;
• door access control, intercom and visual systems;
• fixed induction loop systems;
• building management electrical systems;
• electrical services to lifts;
5 Engineering service costs
13
• lightning protection systems.
Equipment5.9 The following equipment is included, where
relevant, in the engineering services costs:
• group 1 primary engineering equipment and equipment such as generators, switchboards, ventilation equipment etc;
• group 1 equipment associated with general engineering services, based upon scheduled ADB requirements, including operating theatre and medical examination lights;
• engineering service accessories for example electrical socket outlets, light switches, data outlets, heat emitters etc.
Exclusions5.10 The following items are specifically excluded from
engineering services costs:
• building works associated with engineering services (these are included under building costs);
• specialist group 1 equipment that has been designated to be included within the building costs (for example microscopes, controlled drugs cabinets, sanitary fittings);
• group 2 equipment (except for installation);
• groups 3 and 4 equipment;
• mobile clinical and emergency units;
• telecommunications and ICT equipment including telephone exchangers, telephones, routers, patch panels, PCs and ICT hub units;
• fire fighting equipment other than sprinkler systems and dry risers;
• dental chairs and associated examination lights (except pre-installation work);
• imaging equipment including radio-diagnostic, MRI, CT and ultrasound equipment (except pre-installation work);
• north lights and natural ventilation grilles (these are included under building costs);
• fixed and portable medical devices;
• picture archiving and communications system (PACS) equipment.
5.11 Other exclusions may apply dependent upon each project.
Emergency preparedness and resilience5.12 For the purpose of calculating engineering services
costs it is assumed that clinical risks due to activity within the premises will not exceed the relevant categories as defined in Health Technical Memorandum 06-01 and ADB sheets for the rooms advocated on the schedules of accommodation.
5.13 The provision of units such as standby emergency generators, UPS, IPS systems, duplicate supplies, water storage etc to enhance service resilience have been included in accordance with relevant Health Technical Memoranda.
Healthcare Premises Cost Guides
14
6 Cost adjustments
Overview6.1 The HPCGs are intended to be used for early cost
estimates at SOC and OBC stages of project developments. Estimates should be based upon the most up to date and detailed information available to the project team at the time of completion of the cost forms. This should involve adjusting the HPCGs or elemental cost models and finally moving away from HPCGs to a more detailed cost estimate as the project progresses so as to ensure a greater level of accuracy.
6.2 It is also expected that as a scheme is developed from SOC through to OBC and FBC that the level of planning contingencies will substantially reduce as further detail eliminates the need for contingency sum cost allowances.
6.3 This chapter of the document is to be used as a guide as to what type of adjustments can be made to the HPCGs. This is not meant to be an exhaustive list or as mandatory practice but merely a guide to assist in adjusting costs to project specifics.
6.4 Where a specific HPCG appears to be inappropriate or not at the correct cost basis for a particular project then adjustments to reflect the level of project cost should always be applied.
Communication space allowance6.5 The HPCGs are based on a space allowance of 10%
for communication spaces such as main hospital streets, corridors, lifts and stairs. It is important that this addition is amended as the scheme progresses to reflect specific project requirements for example when a project does not necessitate additional main hospital streets or lifts.
BREEAM6.6 The HPCGs include a cost allowance to achieve an
excellent BREEAM rating. It is likely that for some projects this allowance may not be adequate. The allowance should be adjusted to suit the particular project as the full implications of BREEAM are
developed. Allowance included at 3% of building and engineering costs.
Refurbishment/extensions6.7 The HPCGs are based on a 2-storey new build on
an acute hospital site. Therefore when the project involves works of a refurbishment nature or small extensions to an existing building some adjustment should be made to the HPCG. The elemental costs models provide suitable cost information for adjustments to be made to reflect this type of work.
Specification changes 6.8 The elemental costs models provide suitable cost
information for adjustments to be made to reflect differing types of building, mechanical and electrical specifications.
Costs for centralised engineering infrastructures6.9 The HPCGs include a cost allowance for
centralised engineering infrastructure element such as boiler plant and CHP. If a project does not require any additional centralised engineering infrastructure then it may be necessary to adjust ∆the HPCGs.
Storey adjustment6.10 The HPCGs are generally based on a two-storey
building; there are several exceptions to this so it is advisable to check each particular example schedule of accommodation. Any variation from two storeys will require a reasonable adjustment to the HPCGs. BCIS produces an index called the building height index, which will allow a reasonable adjustment to be made to the HPCGs.
6.11 The BCIS index is not mandatory and other ways of adjusting the HPCGs can always be used but it is advisable in these instances to record the back-up calculations and assumptions made to substantiate the level of adjustment.

6 Cost adjustments
15
Economies of scale6.12 The BCIS produces an index table that allows for
any potential economies of scale as the value of the contract sum increase and gives potential benefit to the contract sum.
Healthcare Premises Cost Guides
16
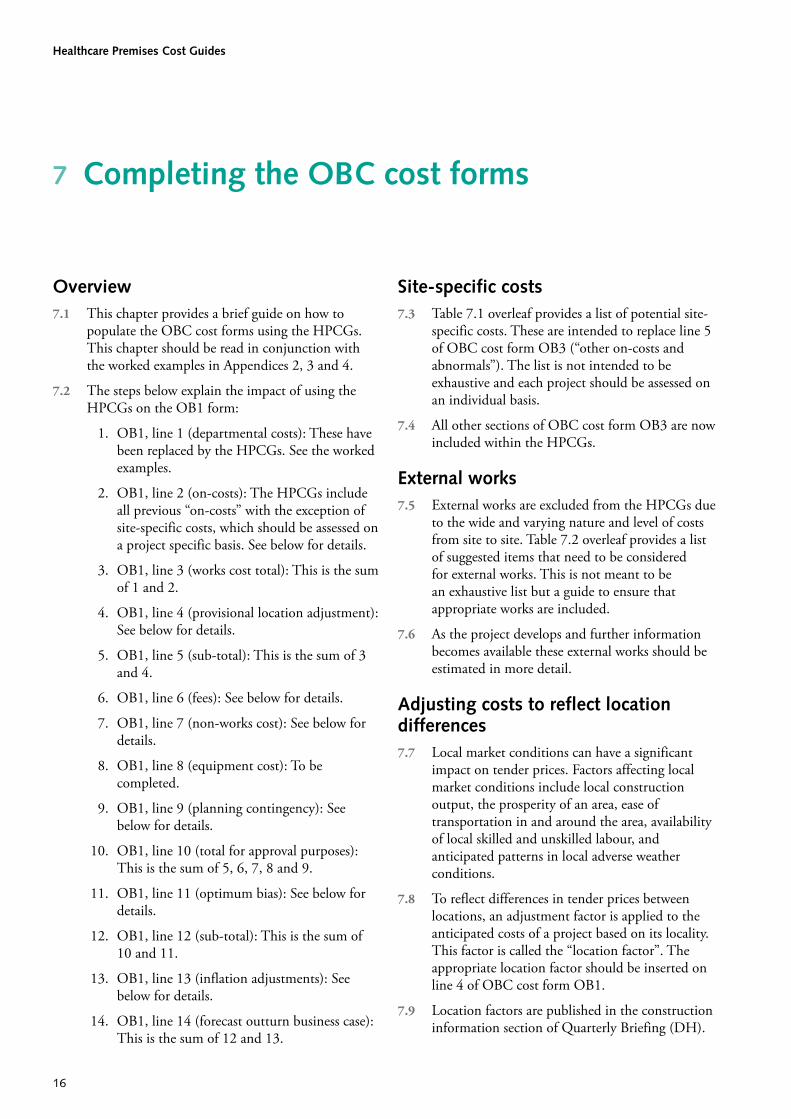
Overview7.1 This chapter provides a brief guide on how to
populate the OBC cost forms using the HPCGs. This chapter should be read in conjunction with the worked examples in Appendices 2, 3 and 4.
7.2 The steps below explain the impact of using the HPCGs on the OB1 form:
1. OB1, line 1 (departmental costs): These have been replaced by the HPCGs. See the worked examples.
2. OB1, line 2 (on-costs): The HPCGs include all previous “on-costs” with the exception of site-specific costs, which should be assessed on a project specific basis. See below for details.
3. OB1, line 3 (works cost total): This is the sum of 1 and 2.
4. OB1, line 4 (provisional location adjustment): See below for details.
5. OB1, line 5 (sub-total): This is the sum of 3 and 4.
6. OB1, line 6 (fees): See below for details.
7. OB1, line 7 (non-works cost): See below for details.
8. OB1, line 8 (equipment cost): To be completed.
9. OB1, line 9 (planning contingency): See below for details.
10. OB1, line 10 (total for approval purposes): This is the sum of 5, 6, 7, 8 and 9.
11. OB1, line 11 (optimum bias): See below for details.
12. OB1, line 12 (sub-total): This is the sum of 10 and 11.
13. OB1, line 13 (inflation adjustments): See below for details.
14. OB1, line 14 (forecast outturn business case): This is the sum of 12 and 13.
Site-specific costs7.3 Table 7.1 overleaf provides a list of potential site-
specific costs. These are intended to replace line 5 of OBC cost form OB3 (“other on-costs and abnormals”). The list is not intended to be exhaustive and each project should be assessed on an individual basis.
7.4 All other sections of OBC cost form OB3 are now included within the HPCGs.
External works7.5 External works are excluded from the HPCGs due
to the wide and varying nature and level of costs from site to site. Table 7.2 overleaf provides a list of suggested items that need to be considered for external works. This is not meant to be an exhaustive list but a guide to ensure that appropriate works are included.
7.6 As the project develops and further information becomes available these external works should be estimated in more detail.
Adjusting costs to reflect location differences 7.7 Local market conditions can have a significant
impact on tender prices. Factors affecting local market conditions include local construction output, the prosperity of an area, ease of transportation in and around the area, availability of local skilled and unskilled labour, and anticipated patterns in local adverse weather conditions.
7.8 To reflect differences in tender prices between locations, an adjustment factor is applied to the anticipated costs of a project based on its locality. This factor is called the “location factor”. The appropriate location factor should be inserted on line 4 of OBC cost form OB1.
7.9 Location factors are published in the construction information section of Quarterly Briefing (DH).
7 Completing the OBC cost forms

7 Completing the OBC cost forms
17
These are based on geographical boundaries and not on the NHS boundaries used from 2002. Quarterly Briefing does not include location factors for Northern Ireland or Scotland.
7.10 The use of the location factors in Quarterly Briefing is not mandatory. Alternative sources of location indices can be used such as the BCIS location factors, which are more specific as they are based on smaller regions and town specific information.
Worked example
7.11 A project with an estimated contract value of £3,000,000 due to be constructed in Yorkshire can be adjusted to account for location differences as follows:
Contract value = £3,000,000
Location factor for Yorkshire = 0.94 (as quoted in Volume 18 Number 1 of Quarterly Briefing)
The location factor of 0.94 shows that costs in Yorkshire are 6% below the national average. (The national average is set at 1.00.)
£3,000,000 × 6% = £180,000
Locally adjusted cost = £3,000,000 – £180,000 = £2,820,000
The same figure can be arrived at by simply multiplying the contract value by the location factor, that is, 0.94 × £3,000,000.
Professional fees 7.12 Professional fees are fees paid to both internal and
external professional services for ensuring the smooth and correct progression of a project, including its planning, design, structural suitability and cost control.
7.13 Professional fees should be added to the works costs when compiling an SOC or OBC. The fees should include services provided by the following professionals:
• architects;
• structural engineers;
• mechanical engineers;
• electrical engineers;
• quantity surveyors;
• project management;
• project sponsorship;
• legal fees;
• site supervisions;
– others:
– planning officers;
– healthcare planners;
– building control officers;
– project directors;
– construction, design and management (CDM) co-ordinators;
– BREEAM assessors;
– environmental impact assessors;
– traffic impact assessors;
– equipment scheduling and associated consultants fees;
– thermal modelling surveys and assessments.
7.14 Fees are generally calculated as a percentage of works costs; the percentage varies depending on the nature of professional services provided.
7.15 Line 1 of OBC cost form OB4 lists most of the commonly-used professionals and includes space for inserting other professionals not listed. This form should be used to build up the overall professional fees, which are then carried over to line 6 of OBC cost form OB1.
Non-works costs7.16 Non-works costs should be inserted into line 7 of
the OBC cost form OB1.
7.17 The size of non-works costs should not be underestimated. In many projects they can become a substantial part of the overall costs and therefore full consideration should be given to them.
7.18 Non-works costs tend to be either specific quotes or stand-alone costs and are not covered by the HPCGs. It is important that these costs are attached to a known baseline for the purpose of updating them for inflation at a future date.
7.19 Examples of non-works costs include:
• land purchase costs and associated legal fees;
• sectional agreements;
• statutory and local authority charges;

Healthcare Premises Cost Guides
18
Site-specific costs excluded from the HPCGsAbnormal building control requirementsAbnormal contractual requirementsAbnormal drainage works and capacity enhancementAbnormal ground conditionsAbnormal incoming utilities costsAbnormal party wall requirementsAbnormal planning requirementsAbnormal security requirementsAlternative designs to improve capital costsArboriculture surveys and costsAsbestos removalBasements Bridges and other structuresCompliance with British Waterways and NRA flood defence/river worksConservation area requirementsDemolition costsDisturbance paymentsDock levellers and sectional overhead doorsDrainage diversions: off-site drainage worksEnhanced elevation treatmentsEnvironmental assessmentEscalators and conveyorsFlood protection worksFlood risk assessmentJapanese knotweed survey/removalLinkage to metro stations Listed building requirementsMinistry of Defence requirementsNetwork Rail requirementsOff-site highways worksOff-site utilities reinforcementPhased constructionPiled foundations Raised access floorRemoval/treatment/testing of contaminated materialRestrictive site conditions (preliminaries)Road and drain adoption requirementsSection 278 Agreement Works and costsSection 38 Agreements and costsTenant/purchaser fit outTimber frame and new modern methods of constructionTraffic impact analysisUnderpinning existing structuresUtilities diversionsWater pressure adequacy for sprinklers and general use on high rise
List of items to include as external works Site preparation:Site clearanceDisposal of topsoilImpermeable surfaces:Access roads including footpath, drainage, lightingPedestrian paving and hard landscaping Car parking including drainage and lighting columnsSteps Soft landscaping including trees and shrubsPerimeter and boundary treatments:Retaining wallsRailingsWallsFencingGates Features, furniture and signage:Litter bins Street signs and signpostsExternal balustrades External plantersTree protection (grilles and guards)FlagpolesBanners Furniture: street/garden/park furnitureExternal clocks BollardsMeter cabinetsGazebosWalkwaysFire escape plinthsColumns for CCTV camerasSecurity barriers and car park barriersCar park pay machinesAuxiliary buildings:Bin storesSmoking sheltersSubstations Coal storage Medical gas storageOverhead gantriesChimneysEnergy centresMeter housingsOther miscellaneous engineering structuresDrainage:Foul water drainageSurface water drainageConnections to mainsEXTERNAL SERVICES Feature lighting External lightingFire hydrantsICT network supplyTelecommunication supplyCCTV cameras and security barrier power supplyUtility electricity supplyUtility water supplyUtility gas supplyBuilders work in connection with external servicesPower supply and provision for ICT to car park payment machines
Table 7.1 Table 7.2

7 Completing the OBC cost forms
19
• building regulations and planning fees;
• decanting costs;
• commissioning costs;
• decommissioning costs.
7.20 Decanting costs should be checked to ensure that both building and engineering elements are included. Costs for using an external removal company, together with any associated management fees, should be covered by this cost.
7.21 Costs for decommissioning engineering services such as medical gases may be significant particularly if the decommissioning is only a temporary position.
Equipment costs7.22 Equipment costs need to be added to the SOC/
OBC forms so as to provide an overall project estimate. These costs should allow for the supply of group 2 equipment and for all the costs associated with group 3 and 4 equipment.
7.23 Please note that Equipment Cost Allowance Guides (ECAGs) are no longer extant and should not be used.
7.24 Analysis of past schemes indicates that at SOC stage an approximate percentage allowance of 15% should be included for equipment. However as the project progresses to OBC this allowance should replaced with a more detailed cost estimate relating to actual equipment requirements.
7.25 MIPS indices are not appropriate for the updating of equipment costs as the project progresses through SOC to OBC and FBC.
7.26 Allowance for re-use of equipment in departments should also be considered and annotated where adjusted.
Planning contingency 7.27 A cost allowance for planning contingency should
be inserted into line 9 of the OBC cost form OB1.
7.28 The planning contingency aims to cover the most likely risks associated with the project, such as cost overruns in the building contract, claims for disruption and loss, and expenses and claims for additional professional fees.
7.29 The cost allowances applied will generally show only a modest fall between SOC and OBC stages
and a significant fall between OBC and FBC stages.
Optimism bias 7.30 HMT Green Book states that an adjustment should
be made to the capital cost of all NHS capital schemes to cover optimism bias.
7.31 A cost allowance for optimism bias should be inserted into line 11 of the OBC cost form OB1.
7.32 Optimism bias is the upward adjustment to estimated costs to counteract the known tendency for project costs to be underestimated, particularly at SOC and OBC stages.
7.33 Optimism bias relates mainly to changes to the scope of the project, as defined in the output specification.
7.34 Complete mitigation of optimism bias is not possible at SOC and OBC stages. However, as a business case develops, the level of optimism bias should diminish as the scope for change is gradually reduced and by the FBC stage the level of optimism bias should be very low.
Managing risk 7.35 Optimism bias, project contingencies and planning
contingency are all types of risk analysis. They should differ in the type of risk they cover and the extent to what is included against these at SOC and OBC stages.
7.36 It is important that in the development of the various risk allowances some overview is maintained to ensure that risks are not double or treble counted or missed completely.
7.37 The inclusion of cost allowances for risk does not remove the need for justification; it is important that a record be maintained that explains the specific reasons for the cost allowance included and any reasons as to why increases in costs are applied from SOC to OBC and FBC stages.
Risk related allowances7.38 All risk related costs and allowances should be
based, wherever possible, on a detailed risk assessment and should have supporting information to the level of costing. As the amount of information and level of detail increases through progression of the project the risks should be seen to reduce in line with the level of detail available.

Healthcare Premises Cost Guides
20
7.39 The inclusion of cost allowances for risk does not remove the need for justification; it is important that a record be maintained that explains the specific reasons for the cost allowance included and any reasons as to why increases in costs are applied from SOC to OBC and FBC stages.
Inflation and the use of indices 7.40 Project cost estimates must be capable of being
adjusted to take account of future forecasted inflation and/or deflation, especially since many projects will take several years to complete
7.41 Inflation indices are used to update project estimates.
7.42 Inflation indices reflect the rate of inflation in a numerical format. Most inflation indices are measured against a base value 100.
Current dates predict an index of 105 to the project
which means 105 – 100/100
which equals a 5% increase in costs.
One further example –
Current dates predict an index of 95 to the project
which means 95 – 100/100
which equals a 5% decrease to cost.
For example if a project was estimated to be £3,000,000 at a current indexation of 105 and the project was due out to tender with a forecasted 190 index, the forecasted project costs at tender due date is:
= £3,000,000/105 * 190
= a forecasted project cost of £5,428,571.
7.43 There are various indices published within the construction industry and sound professional advice and judgement is required to ensure that the most appropriate index is used and that any changes to costs by forecasts/provisional indices are as robust as possible.
7.44 Quarterly Briefing includes the following indices:
Median index of public sector (MIPS) building tender prices
The MIPS indices highlight the effects of inflation on “tender process” of capital works projects within the public sector.
MIPS is DH’s acronym for the public sector un-weighted index series produced by BIS (the Department for Business Innovation and Skills). It is derived from an analysis of public sector building
Undertake a risk assessment of the design andconstruction risks associated with the project
Transfer financial implicationsto Line 9 of cost form OB1
Identify risks
Allocate risks to best party able to manage them
Quantify financial and time implications on project
Prepare strategy for managing risks
PROCESSFigure 7.1 Process for assigning a cost allowance for planning contingency

7 Completing the OBC cost forms
21
schemes including healthcare schemes and should not be confused with the indices produced by BCIS for private sector schemes.
MIPS is published quarterly and calculated from rates for measured work contained in bills of quantities for accepted tenders. The index is smoothed to reduce any erratic changes in the index level from one quarter to the next thus giving a better indication of the underlying trend. As a result, the indices will remain “provisional” for two quarters to enable this smoothing to take effect.
The MIPS indices are further sub-divided into tenders let on a firm price (FP), for projects with a contract period not exceeding two years, and variation of price (VOP) tenders, for projects where increased costs are reimbursed separately, usually by means of a formula applied to a breakdown of the original tender. The VOP index is generally used for projects with a contract period of over two years.
An “all tenders” index series is a combination of all FP and VOP projects. However as there are few, if any, VOP projects then this index tends to be the same index as the FP series.
Forecasting
The forecasting of provisional indices and the subsequent firming up of these to a firm index is also based upon information supplied by BIS. This information is based on a sample of healthcare schemes and is then firmed up when a larger sample of schemes is received. The forecast index is not based on scheme analysis but on trends and therefore it is not an exact science. Changes in the prices of raw materials, such as oil, which are totally unpredictable, have a high impact on forecasting the movement of the MIPS future indices.
Cost allowances for healthcare buildings
The cost allowances index for healthcare buildings are split into two indices, one at firm price and one at variation of price, both of which are related to the MIPS series. These indices are used when completing the relevant business case forms to ensure that all project costs are brought to a similar cost level.
DH is responsible for promulgating any changes or uplifts to the cost allowance index and these are published in Quarterly Briefing.
Building Cost Index – NOCOS (previously APSAB/FORVOP indices)
These indices give a measure of the notional trend of costs to a contractor of increases in the cost of labour, materials and plant by application of the Price Adjustment Formulae for Building and Specialist Engineering Works to a Public Sector Average Building.
These indices are calculated from nationally agreed wage rates and manufactures’ recommended prices for materials.
FORVOP (projected formula variation of price) is the forward projection of how the NOCOS index is forecasted to move over the next eight years.
Cash-flow7.45 Cost form OB1 includes a cash expenditure table
in which the estimated cash-flow of the project should be scheduled out. It is suggested that all figures entered into this table should be net of VAT. This will allow for easier transition of the figures to economic appraisal.

Healthcare Premises Cost Guides
22
This appendix provides the HPCGs for all the example schedules of accommodation published by DH. This includes an overall HPCG as well as an HPCG for public, clinical and staff space.
The tables below shows the HPCGs for the example schedules of accommodation that have been costed using the detailed method outlined in Chapter 4.
The HPCGs for Health Building Note 11-01 are based on standalone buildings. The HPCGs for the other schedules of accommodation costed in detail are based on departments located in acute hospitals.
Appendix 1 – HPCGs for example schedules of accommodation
Example schedules of accommodation for delivery of acute care
HPCG (based on a MIPS index of 480)
Public space Staff space Clinical space Overall space
Health Building Note 04-01 – ‘Adult in-patient facilities’ £2,230 £2,040 £2,290 £2,280 Health Building Note 6 Volume 1 – ‘Facilities for diagnostic imaging and interventional radiology’ £2,050 £1,810 £2,320 £2,200
Health Building Note 07-01 – ‘Satellite dialysis unit’ £ 1,610 £2,230 £3,020 £2,600 Health Building Note 09-02 – ‘Maternity care facilities’ £2,370 £2,110 £2,520 £2,470 Health Building Note 10-02 – ‘Day surgery facilities’ £1,870 £1,710 £2,790 £2,670 Health Building Note 12 – ‘Out-patients department’ £1,690 £2,110 £2,200 £2,040Health Building Note 22 – ‘Accident and emergency facilities for adults and children’ £1,780 £1,750 £2,410 £2,140
Health Building Note 26 Volume 1 – ‘Facilities for surgical procedures’ N/A £1,630 £3,180 £2,840
Example schedules of accommodation for delivery of primary and community care
HPCG (based on a MIPS index of 480)
Public space Staff space Clinical space Overall space
HBN 11-01 – ‘Facilities for primary and community care’ (primary care centre) £2,060 £1,820 £2,160 £2,040
HBN 11-01 – ‘Facilities for primary and community care’ (extended primary care centre) £1,870 £1,650 £2,210 £1,990
HBN 11-01 – ‘Facilities for primary and community care’ (community hospital) £1,840 £1,620 £2,440 £2,200

Appendix 1 – HPCGs for example schedules of accommodation
23
All other example schedules of accommodation have been categorised according to their level of engineering
complexity and building specification and may be subject to change as more detailed costings are undertaken.
HPCG categorisation for example schedules of accommodation for delivery of acute care
Low cost Medium cost High cost Super cost
Health Building Note 8 – ‘Facilities for rehabilitation services’
Health Building Note 12-01 Supplement A – ‘Sexual and reproductive health clinics’
Health Building Note 12 Supplement 4 – ‘Ophthalmology’
Health Building Note 37 – ‘In-patient facilities for older people’
Health Building Note 6 Volume 2 – ‘PACS and specialist imaging’
Health Building Note 23 – ‘Hospital accommodation for children and young people’
Health Building Note 07-02 – ‘Main renal unit’
Health Building Note 12 Supplement 2 – ‘Oral surgery, orthodontics, restorative dentistry’
Health Building Note 14-01 – ‘Pharmacy and radiopharmacy facilities’
Health Building Note 15 – ‘Facilities for pathology services’
Health Building Note 20 – ‘Facilities for mortuary and post-mortem room services’
Health Building Note 28 – ‘Facilities for cardiac services’
Health Building Note 52 Volume 2 – ‘Endoscopy unit’
Health Building Note 52 Volume 3 – ‘Medical investigation and treatment unit’
Health Building Note 54 – ‘Facilities for cancer services’
Health Building Note 12 Supplement 3 – ‘ENT and audiology clinics, hearing aid centre’
Health Building Note 6 Volume 3 – ‘Extremity and open MRI, magnetic shielding and construction for radiation protection’
Health Building Note 13 – ‘Sterile services department’
Health Building Note 57 – ‘Facilities for critical care’
Health Building Note 13 Supplement 1 – ‘Ethylene oxide sterilization section’
Health Building Note 35 Part 1 – ‘Accommodation for people with mental illness: The acute unit’
KEY Low cost (£) Medium cost (£) High cost (£) Super cost (£)PUBLIC range average
<1,700 1,650
1,700–1,900 1,830
1,900–2,100 2,050
>2,100 2,300
STAFF range average
<1,700 1,650
1,700–1,900 1,830
1,900–2,100 2,050
>2,100 2,300
CLINICAL range average
<2,500 2,300
2,500–2,800 2,650
2,800–3,100 3,020
>3,100 3,180
OVERALL range average
<2,300 2,050
2,300–2,500 2,340
2,500–2,700 2,680
>2,700 2,840

Healthcare Premises Cost Guides
24
HPCG categorisation for example schedules of accommodation for delivery of care from independent locations
Low cost Medium cost High cost Super cost
Health Building Note 35 Part 2 – ‘Accommodation for people with mental illness: Treatment and care in the community’
Health Building Note 44 – ‘Accommodation for Ambulance services’
KEY Low cost (£) Medium cost (£) High cost (£) Super cost (£)OVERALL range average
<2,300 2,050
2,300–2,500 2,440
2,500–2,700 2,680
>2,700 2,840

25
To begin the process of costing a multi-department unit at SOC/OBC stage, a schedule of departments must be established.
The GIA of each department should be calculated.
The published example schedules of accommodation will provide an estimate of the NIA of each department. Appendix 2 provides an estimate of the overall allowances for circulation space, communication space and engineering space that should be applied to each departmental NIA to arrive at a departmental GIA.
The relevant overall HPCG should then be applied to each departmental GIA to arrive at a cost for each department and then for the unit as a whole.
The table below shows how costs may be calculated using this method. The HPCGs are based on the figures in Appendix 1. Where an HPCG category of low cost, medium cost etc is given, this means the HPCG is an estimate only.
All figures in this table are for demonstration purposes only and should not be applied to real schemes. All costs are exclusive of VAT and are based on a MIPS index of 480.
Appendix 2 – Costing a multi-department unit at SOC/OBC stage
KEY to table super cost 2,840
high cost 2,680
medium cost 2,340
low cost 2,050
HPCG
category
HPCG
(£/m2)
Departmental cost
(£)
HBN 04-01 - 'Adult in-patient facilities'
Department 1: 2 no. 24-bed wards (83% single-bed rooms)
including associated facilities
2,789 HPCG 2,280 6,358,920
HBN 26 Volume 1 - 'Facilities for surgical procedures'Department 2: 8 theatres (4 general and 4 ultra clean)
including associated facilities3,974 HPCG 2,840 11,286,160
HBN 10-02 - 'Day surgery facilities'
Department 3: Dedicated DSU within an acute hospital
(serving a population of 3,000) including associated facilities
2,653 HPCG 2,670 7,083,510
HBN 23 – ‘Hospital accommodation for children and
young people’
Department 4: 2 no. 24-bed wards (83% single-bed rooms)
including associated facilities
2,500 medium cost 2,340 5,850,000
HBN 22 - 'Accident and emergency facilities for adults
and children'Department 5: 5000 attendances, 8 assessment and 8
treatment rooms1,903 HPCG 2,140 4,072,420
HBN 8 – ‘Facilities for rehabilitation services’ 1,800 low cost 2,050 3,690,000
Department 6: Rehab department
HBN 15 – ‘Facilities for pathology services’ 2,000 high cost 2,680 5,360,000
Department 7: Path lab
17,619 43,701,010 £/m2 2,480.33
Standardised HPCG categories for acute care
(£/m2)
Total for unit
Costs for multi-department unit based on example schedules of accommodation
Example schedules of accommodation Departmental GIA (m2)
Healthcare Premises Cost Guides
26
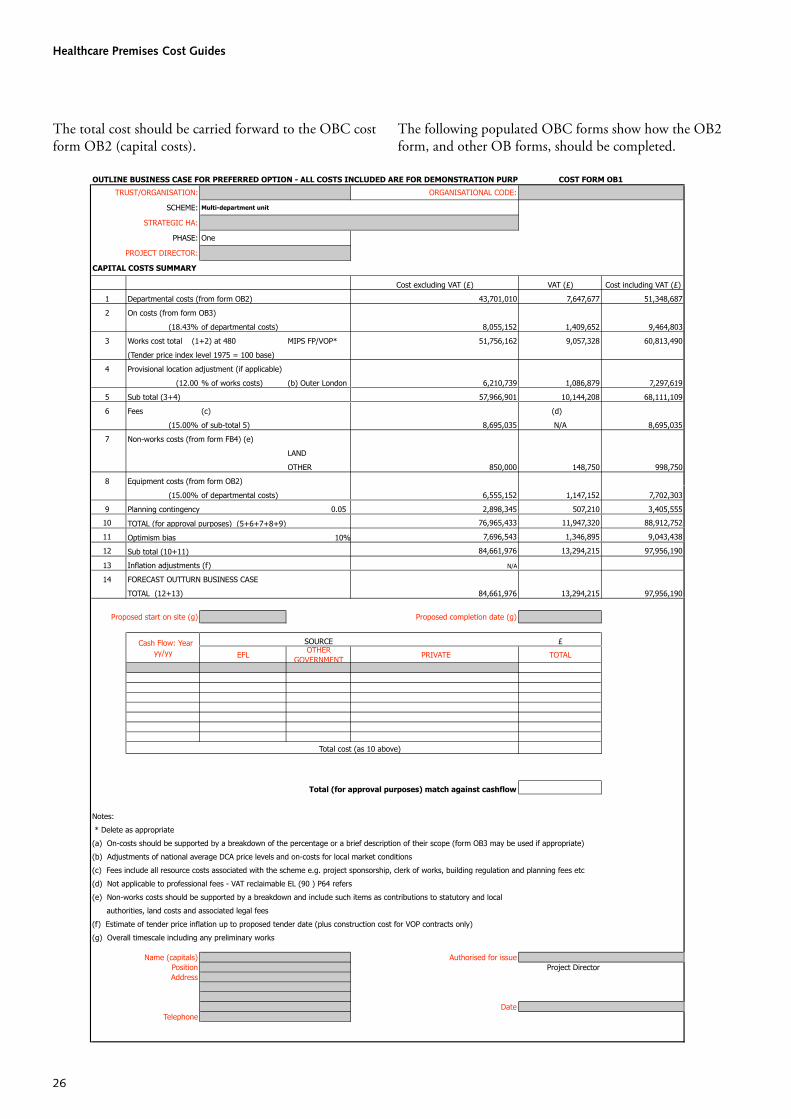
The total cost should be carried forward to the OBC cost form OB2 (capital costs).
The following populated OBC forms show how the OB2 form, and other OB forms, should be completed.
OUTLINE BUSINESS CASE FOR PREFERRED OPTION - ALL COSTS INCLUDED ARE FOR DEMONSTRATION PURP COST FORM OB1
TRUST/ORGANISATION: ORGANISATIONAL CODE:
SCHEME:
STRATEGIC HA:
PHASE:
PROJECT DIRECTOR:
CAPITAL COSTS SUMMARY
Cost excluding VAT (£) VAT (£) Cost including VAT (£)
1 Departmental costs (from form OB2) 43,701,010 7,647,677 51,348,687
2 On costs (from form OB3)
(18.43% of departmental costs) 8,055,152 1,409,652 9,464,803
3 Works cost total (1+2) at 480 MIPS FP/VOP* 51,756,162 9,057,328 60,813,490
(Tender price index level 1975 = 100 base)
4 Provisional location adjustment (if applicable)
(12.00 % of works costs) (b) Outer London 6,210,739 1,086,879 7,297,619
5 Sub total (3+4) 57,966,901 10,144,208 68,111,109
6 Fees (c) (d)
(15.00% of sub-total 5) 8,695,035 N/A 8,695,035
7 Non-works costs (from form FB4) (e)
LAND
OTHER 850,000 148,750 998,750
8 Equipment costs (from form OB2)
(15.00% of departmental costs) 6,555,152 1,147,152 7,702,303
9 Planning contingency 0.05 2,898,345 507,210 3,405,555
10 76,965,433 11,947,320 88,912,752
11 7,696,543 1,346,895 9,043,438
12 84,661,976 13,294,215 97,956,190
13 Inflation adjustments (f) N/A
14 FORECAST OUTTURN BUSINESS CASE
TOTAL (12+13) 84,661,976 13,294,215 97,956,190
Proposed start on site (g) Proposed completion date (g)
SOURCE £
Total cost (as 10 above)
Total (for approval purposes) match against cashflow
Notes:
* Delete as appropriate
(a) On-costs should be supported by a breakdown of the percentage or a brief description of their scope (form OB3 may be used if appropriate)
(b) Adjustments of national average DCA price levels and on-costs for local market conditions
(c) Fees include all resource costs associated with the scheme e.g. project sponsorship, clerk of works, building regulation and planning fees etc
(d) Not applicable to professional fees - VAT reclaimable EL (90 ) P64 refers
(e) Non-works costs should be supported by a breakdown and include such items as contributions to statutory and local
authorities, land costs and associated legal fees
(f) Estimate of tender price inflation up to proposed tender date (plus construction cost for VOP contracts only)
(g) Overall timescale including any preliminary works
Name (capitals) Authorised for issue
Position Project Director
Address
Date
Telephone
One
Multi-department unit
TOTAL
Cash Flow: Year
yy/yy EFLOTHER
GOVERNMENT PRIVATE
TOTAL (for approval purposes) (5+6+7+8+9)
Optimism bias 10%
Sub total (10+11)

Appendix 2 – Costing a multi-department unit at SOC/OBC stage
27
OUTLINE BUSINESS CASE FOR PREFERRED OPTION
COST FORM OB2
ALL COSTS INCLUDED ARE FOR DEMONSTRATION PURPOSES ONLY
TRUST/ORGANISATION:
SCHEME: Multi-department unit
PHASE:
PROJECT DIRECTOR:
CAPITAL COSTS: DEPARTMENTAL COSTS AND EQUIPMENT COSTS
HBN 04-01 - 'Adult in-patient facilities'
Department 1: 2 no. 24-bed wards (83%
single-bed rooms) including associated
facilities
2,789 m2
6,358,920 953,838
HBN 26 Volume 1 - 'Facilities for surgical procedures'
Department 2: 8 theatres (4 general and 4
ultra clean) including associated facilities
3,974 m2
11,286,160 1,692,924
HBN 10-02 - 'Day surgery facilities'
Department 3: Dedicated DSU within an
acute hospital (serving a population of 3,000)
including associated facilities
2,653 m2
7,083,510 1,062,527
HBN 23 – ‘Hospital accommodation for
children and young people’
Department 4: 2 no. 24-bed wards (83%
single-bed rooms) including associated
facilities
2,500 m2
5,850,000 877,500
HBN 22 - 'Accident and emergency
facilities for adults and children'
1,903 m2
4,072,420 610,863
Department 5: 5000 attendances, 8
assessment and 8 treatment rooms
HBN 8 – ‘Facilities for rehabilitation
services’
1,800 m2
3,690,000 553,500
HBN 15 – ‘Facilities for pathology
services’
2,000 m2
5,360,000 804,000
Departmental costs and equipment costs to summary £ 43,701,010 6,555,152
N/A/C (2)Cost allowance version Equipment cost
version Functional contentFunctional units/space
requirements (1)
Healthcare Premises Cost Guides
28
COST FORM OB2 (CONT)
Cost allowances should be based on departmental cost allowances where appropriate and include
allowances for essential complementary accommodation and optional accommodation and services
where details not available.
Identify separately any proposed adjustment (over or under cost allowances) justifiable in value for
money terms (details to be provided).
* Delete as appropriate
1. State area and rate if departmental cost allowance not available.
2. Insert:
N for new build.
A for adaptions for alternative use or
C for upgrading existing building retaining current use.
3. Insert relevant version number of HCI listing of departmental cost allowances and
Equipment cost allowances.
4. Provide details where appropriate.
Completed by
Name (capitals)
Position Project director
Address
Date
Telephone
Authorised for issue

Appendix 2 – Costing a multi-department unit at SOC/OBC stage
29
OUTLINE BUSINESS CASE FOR PREFERRED OPTION COST FORM OFB3
ALL COSTS INCLUDED ARE FOR DEMONSTRATION PURPOSES ONLY
TRUST/ORGANISATION:
SCHEME: Multi-department unit
PHASE:
CAPITAL COSTS: ON COSTS
Estimated Percentage of
cost departmental
(exc. VAT) cost
1Communications £ £ %
a. Space Incl
b. Lifts Incl
2'External'' building works (1)
a. Drainage Incl
b. Roads, paths, parking Incl
c. Site layout, walls, fencing, gates Incl
d. Builders work for engineering Incl
services outside buildings Incl
£6,555,151.50 15.00
3'External'' engineering works (1)
a. Steam, condensate, heating, hot Incl
water and gas supply mains Incl
b. Cold water mains and storage Incl
c. Electricity mains, sub-stations, Incl
stand-by generating plant Incl
d. Calorifiers and associated plant Incl
e. Miscellaneous services Incl
4Auxiliary buildings 750,000.00 1.72
5Other on-costs and abnormals (2)
a. Building £500,000.00 1.14
b. Engineering £250,000.00 0.57
Total On-Costs to Summary FB1£ 8,055,152 18.43
Notes:Must be based on scheme specific assessments/measurements; attach details to define scope of works as appropriate.
Identify separately any proposed additional capital expenditure justifiable in value for money terms (details to be provided).
*Delete as appropriate.
(1)'External'' to departments
(2)Identify any enabling or preliminary works to prepare the site in advance e.g. demolitions; service diversions; decanting
costs; site investigation and other exploratory works.
Completed by
Name (capitals) Authorised for issue
Position Project director
Address
Date
Telephone

Healthcare Premises Cost Guides
30
OUTLINE BUSINESS CASE FOR PREFERRED OPTION COST FORM OB4
ALL COSTS INCLUDED ARE FOR DEMONSTRATION PURPOSES ONLY
TRUST/ORGANISATION:
SCHEME: Multi-department unit
PHASE: One
CAPITAL COSTS: FEES AND NON-WORKS COSTS
£ Percentage of
works costs %
1 Fees (including "in-house" resource costs)
a. Architects 2,318,676 4.00
b. Structural engineers 869,504 1.50
c. Mechanical engineers 1,159,338 2.00
d. Electrical engineers Included above
e. Quantity surveyors 1,159,338 2.00
f. Project management 579,669 1.00
g. Project sponsorship 579,669 1.00
h. Legal fees -
i. Site supervision 869,504 1.50
j. Building Regulations and Planning Fees 579,669 1.00
k. Other
CDM co-ordinator 289,835 0.50
Party wall surveyor 289,835 0.50
Total fees to summary (OB1) £ 8,695,035 15.00
£
2 Non-works costs
a. Land purchase costs and associated legal fees
b. Statutory and Local Authority charges 750,000
c. Other (specify)
decanting costs 100,000
Non-works costs to summary (OB1) £ 850,000
Notes:
* Delete as appropriate.
Completed by
Name (capitals) Authorised for issue
Position Project director
Address
Date
Telephone

31
To begin the process of costing a multi-department unit on a room by room basis, a schedule of accommodation for each department must be established and sorted into public, clinical and staff spaces in accordance with Chapter 2 of this guidance.
Appendix 2 provides an estimate of the allowances for circulation space, communication space and engineering space that should be applied to each room (the latter not only varies across departments but also across room
types). However, if any design information is available these percentages should be adjusted accordingly.
The relevant HPCG should then be applied to each room (on the basis of room type and department) to arrive at a cost for each room, for each department and then for the unit as a whole.
The table below shows how costs may be calculated using this method. The HPCGs are based on the figures in Appendix 1.
Appendix 3 – Costing a multi-department unit on a room by room basis

Healthcare Premises Cost Guides
32
All figures in this table are for demonstration purposes only and should not be applied to real schemes. All costs are exclusive of VAT and are based on a MIPS index of 480.
The total cost should be carried forward to the OBC cost form OB2 (capital costs).
HPCG
category
HPCG
(£/m2) Room cost (£)
Adult in-patient facilities
Public space
Reception: 2 staff 2 11.00 22.00 8.14 5.28 35.42 HPCG 2,230 78,987 Waiting area (size based on number of places) 12 1.70 20.40 7.55 7.55 35.50 HPCG 2,230 79,165 WC: semi-ambulant 2 2.50 5.00 1.85 1.85 8.70 HPCG 2,230 19,401 Clinical spaceSingle-bed room: adult 40 19.00 760.00 281.20 174.80 1,216.00 HPCG 2,290 2,784,640 Shower room: en-suite: chamfered 40 4.50 180.00 66.60 41.40 288.00 HPCG 2,290 659,520 Multi bed room: adult: 4 beds 2 64.00 128.00 47.36 29.44 204.80 HPCG 2,290 468,992 WC: semi-ambulant: in-patient 2 2.00 4.00 1.48 0.92 6.40 HPCG 2,290 14,656 Shower room: assisted: in patient 2 6.50 13.00 4.81 2.99 20.80 HPCG 2,290 47,632
Bathroom: assisted 2 15.00 30.00 11.10 6.90 48.00 HPCG 2,290 109,920 Staff space - - - Touchdown base 12 2.00 24.00 8.88 5.52 38.40 HPCG 2,040 78,336 Office/meeting room: 10 places (incl. 2 workstations) 2 16.00 32.00 11.84 7.36 51.20 HPCG 2,040 104,448 Pantry: ward 2 12.00 24.00 8.88 5.52 38.40 HPCG 2,040 78,336 Clean supply room 16 1.00 16.00 5.92 3.68 25.60 HPCG 2,040 52,224 Parking bay: mobile hoist 2 2.00 4.00 1.48 0.92 6.40 HPCG 2,040 13,056 Store: clinical equipment 24 1.00 24.00 8.88 5.52 38.40 HPCG 2,040 78,336 Medical store/preparation room 2 8.00 16.00 5.92 3.68 25.60 HPCG 2,040 52,224 Dirty utility room: bedpan processing 4 12.00 48.00 17.76 11.04 76.80 HPCG 2,040 156,672 Parking bay: resuscitation equipment 2 2.00 4.00 1.48 0.92 6.40 HPCG 2,040 13,056 Parking bay: food trolley 2 2.00 4.00 1.48 0.92 6.40 HPCG 2,040 13,056 Store: linen 2 6.00 12.00 4.44 2.76 19.20 HPCG 2,040 39,168 Cleaners' room 2 8.00 16.00 5.92 3.68 25.60 HPCG 2,040 52,224
Total for adult in-patient facilities 1,386.40 512.97 322.65 2,222.02 4,994,049
Surgical procedures facilities
Public spaceNoneClinical spaceConsulting, examination & changing room 16.5 2.00 33.00 11.55 15.84 60.39 HPCG 3,180 192,040 Operating theatre: general 4 55.00 220.00 77.00 105.60 402.60 HPCG 3,180 1,280,268 Operating theatre: ultra clean 4 55.00 220.00 77.00 105.60 402.60 HPCG 3,180 1,280,268 Anaesthetic room: bed space 4 19.00 76.00 26.60 36.48 139.08 HPCG 3,180 442,274 Recovery bay: post anaesthetic, 1 place 12 13.50 162.00 56.70 77.76 296.46 HPCG 3,180 942,743 Recovery room: post anaesthetic, 1 place 4 26.00 104.00 36.40 49.92 190.32 HPCG 3,180 605,218 Staff & communication base, enclosed: 3 staff 1 15.00 15.00 5.25 7.20 27.45 HPCG 3,180 87,291 Clean utility 1 14.00 14.00 4.90 6.72 25.62 HPCG 3,180 81,472 Dirty utility: bedpan disposal & urine test 1 12.00 12.00 4.20 5.76 21.96 HPCG 3,180 69,833 Office: medical reporting, 1 staff 1 10.50 10.50 3.68 5.04 19.22 HPCG 3,180 61,120 Blood bank refrigerator bay 1 3.00 3.00 1.05 1.44 5.49 HPCG 3,180 17,458 Near patient testing/status laboratory 1 8.50 8.50 2.98 4.08 15.56 HPCG 3,180 49,481 Utility: cleaning & store room, flexible endoscope 1 14.00 14.00 4.90 6.72 25.62 HPCG 3,180 81,472 Service room: equipment 1 21.00 21.00 7.35 10.08 38.43 HPCG 3,180 122,207 Parking bay: mobile x-ray & ultrasound unit 1 5.00 5.00 1.75 2.40 9.15 HPCG 3,180 29,097 Shower: ambulant (non patient) 6 2.50 15.00 5.25 7.20 27.45 HPCG 3,180 87,291 Staff changing room including boot change: 30 places 1 25.00 25.00 8.75 12.00 45.75 HPCG 3,180 145,485 Staff changing room including boot change: 30 places 2 25.00 50.00 17.50 24.00 91.50 HPCG 3,180 290,970 Utility: footwear washing 1 4.00 4.00 1.40 1.92 7.32 HPCG 3,180 23,278 Scrub-up & gowning room: 3 places 8 11.00 88.00 30.80 42.24 161.04 HPCG 3,180 512,107 Preparation room 8 12.00 96.00 33.60 46.08 175.68 HPCG 3,180 558,662 Exit/parking bay: theatre, 1 bed/trolley 8 12.00 96.00 33.60 46.08 175.68 HPCG 3,180 558,662 Staff spaceOffice: 2 staff 1 13.00 13.00 4.55 2.34 19.89 HPCG 1,630 32,421 Office: 3 staff 1 18.00 18.00 6.30 3.24 27.54 HPCG 1,630 44,890 Office: 1 staff 1 10.50 10.50 3.68 1.89 16.07 HPCG 1,630 26,194 Interview & counselling room: 5 persons (non-patient) 1 9.00 9.00 3.15 1.62 13.77 HPCG 1,630 22,445 Interview/meeting room: 6 persons 1 14.00 14.00 4.90 2.52 21.42 HPCG 1,630 34,915 Rest room with beverage & snack preparation bay: 20 staff 1 28.00 28.00 9.80 5.04 42.84 HPCG 1,630 69,829 WC & wash: ambulant 4 2.00 8.00 2.80 1.44 12.24 HPCG 1,630 19,951 Shower: ambulant (non patient) 2 2.50 5.00 1.75 0.90 7.65 HPCG 1,630 12,470 WC & handwash: accessible, wheelchair assisted 1 4.50 4.50 1.58 0.81 6.89 HPCG 1,630 11,231 Staff changing room including boot change: 10 places 1 8.00 8.00 2.80 1.44 12.24 HPCG 1,630 19,951
Total for surgical procedures facilities 1,410.00 493.52 641.40 2,544.92 7,812,994
Out-patients facilities
Public spaceReception 2 staff 2 10.00 20.00 8.40 2.60 31.00 HPCG 1,690 52,390 Enquiry/information desk: 2 staff 1 6.00 6.00 2.52 0.78 9.30 HPCG 1,690 15,717 Waiting play area: 5 children 1 13.00 13.00 5.46 1.69 20.15 HPCG 1,690 34,054 Public telephone: single booth 1 1.50 1.50 0.63 0.20 2.33 HPCG 1,690 3,938 Public telephone: single booth, accessible 1 2.00 2.00 0.84 0.26 3.10 HPCG 1,690 5,239 Nappy change room with handwash 1 4.00 4.00 1.68 0.52 6.20 HPCG 1,690 10,478 Refreshment: vending machine 1 3.00 3.00 1.26 0.39 4.65 HPCG 1,690 7,859 Infant feeding room 1 5.50 5.50 2.31 0.72 8.53 HPCG 1,690 14,416 Clinical spaceConsulting & examination room: both sides couch access 12 16.50 198.00 83.16 55.44 336.60 HPCG 2,200 740,520 Physical measurement bay 2 3.50 7.00 2.94 1.96 11.90 HPCG 2,200 26,180 Interview & counselling room: 5 persons 1 9.00 9.00 3.78 2.52 15.30 HPCG 2,200 33,660 Venepuncture room: 2 places 1 16.00 16.00 6.72 4.48 27.20 HPCG 2,200 59,840 Treatment room: 1 patient 2 12.00 24.00 10.08 6.72 40.80 HPCG 2,200 89,760 Treatment room: chiropody/podiatry, 1 patient 1 15.00 15.00 6.30 4.20 25.50 HPCG 2,200 56,100 Store: general, sterilie supplies & linen 1 9.00 9.00 3.78 2.52 15.30 HPCG 2,200 33,660 Store: equipment 1 12.00 12.00 5.04 3.36 20.40 HPCG 2,200 44,880 Store: clinic sundries 1 9.00 9.00 3.78 2.52 15.30 HPCG 2,200 33,660 Store: surgical appliances 1 3.00 3.00 1.26 0.84 5.10 HPCG 2,200 11,220 Store: stationery 1 3.00 3.00 1.26 0.84 5.10 HPCG 2,200 11,220 Staff spaceRest room with beverage & snack preparation bay: 10 staff 1 18.00 18.00 7.56 5.76 31.32 HPCG 2,110 66,085 Office: 1 staff 1 10.50 10.50 4.41 3.36 18.27 HPCG 2,110 38,550 Office: 1 staff 1 10.50 10.50 4.41 3.36 18.27 HPCG 2,110 38,550 Office: 1 staff 1 10.50 10.50 4.41 3.36 18.27 HPCG 2,110 38,550 Office: 1 staff 1 9.00 9.00 3.78 2.88 15.66 HPCG 2,110 33,043 Staff changing room with cubicle & handwash, 5 places 1 8.50 8.50 3.57 2.72 14.79 HPCG 2,110 31,207 Staff changing room with cubicle & handwash, 10 places 1 14.00 14.00 5.88 4.48 24.36 HPCG 2,110 51,400 Shower: ambulant (non patient) 2 2.50 5.00 2.10 1.60 8.70 HPCG 2,110 18,357 WC & wash: ambulant 2 2.00 4.00 1.68 1.28 6.96 HPCG 2,110 14,686 Cleaners (Housekeeping) room 1 7.00 7.00 2.94 2.24 12.18 HPCG 2,110 25,700 Hold: disposal 1 6.00 6.00 2.52 1.92 10.44 HPCG 2,110 22,028
Total for out-patient facilities 463.00 194.46 125.52 782.98 1,662,947
Total for unit 3,259 1,201 1,090 5,550 2,607 14,469,990
£/m2 £2,607.21
Rooms
Costs for multi-department unit based on real schedules of accommodation
QuantityRoom area
(m2)Room NIA (m2)
Circulation space
and
communication
space (m2)
Engineering space
(m2)Room GIA (m2)

33
To begin the process of costing a whole hospital, a schedule of departments/groups of rooms must be established.
The GIA of each department/group of rooms should be calculated.
The published example schedules of accommodation should be used, where relevant, to provide an estimate of the NIA of each department/group of rooms.
Appendix 2 provides an estimate of the overall allowances for circulation space, communication space and engineering space that should be applied to the NIAs to arrive at the GIAs. However, if any design information is available these percentages should be adjusted accordingly.
The relevant overall HPCG should then be applied to each GIA to arrive at a cost for each department/group of rooms and then for the hospital as a whole.
It may be necessary, as part of a whole hospital, to include areas such as main entrances, commercial spaces, central kitchens or loading bay areas etc. If any of these areas are required, they should be assessed on a project specific basis and an appropriate £/m2 applied to an estimated area (m2) to arrive at a capital cost.
The table below shows how costs may be calculated using this method. The HPCGs are based on the figures in Appendix 1. Where an HPCG category of low cost, medium cost etc is given, this means the HPCG is an estimate only.
Appendix 4 – Costing a whole hospital
* project specific costing
level
super cost 2,840
high cost 2,680
medium cost 2,340
low cost 2,050
HPCG
category HPCG (£/m2)
Department/room cost
(£)
In-patient servicesGeneral wards, 83% single-bed rooms 224 beds 8,143 3,012.91 1,872.89 13,028.80 HPCG 2,280 29,705,664 Children
Department 1 dept 158 58.46 36.34 252.80 medium cost 2,340 591,552 In-patient ward 20 beds 727 254.45 167.21 1,148.66 medium cost 2,340 2,687,864 Day care unit 8 beds 329 115.15 75.67 519.82 medium cost 2,340 1,216,379
Elderly
Nursing section type A 96 beds 3,508 1,227.80 806.84 5,542.64 low cost 2,050 11,362,412 Day hospital 40 places 721 252.35 165.83 1,139.18 low cost 2,050 2,335,319 Administrative centre 200,000 population 135 47.25 31.05 213.30 low cost 2,050 437,265
Maternity
LDRP standard 18 702 280.80 224.64 1,207.44 HPCG 2,470 2,982,377 LDRP disabled 1 45 18.00 14.40 77.40 HPCG 2,470 191,178 4-bed room 2 110 44.00 35.20 189.20 HPCG 2,470 467,324 Single-bed room 11 176 70.40 56.32 302.72 HPCG 2,470 747,718 In-patient accommodation Option 1 2,445 978.00 782.40 4,205.40 HPCG 2,470 10,387,338
Neonatal 10 cots 424 169.60 135.68 729.28 high cost 2,680 1,954,470 Intensive therapy 6 beds 733 293.20 234.56 1,260.76 super cost 2,840 3,580,558 Cardiology 1 dept 733 293.20 234.56 1,260.76 super cost 2,840 3,580,558
Main operating facilitiesOperating suites
Theatres 6 theatres 2,268 907.20 793.80 3,969.00 HPCG 2,840 11,271,960
Diagnostic and treatment facilitiesRadiodiagnostics
RD rooms 9 rooms 1,420 482.80 525.40 2,428.20 HPCG 2,200 5,342,040 Ultrasound 5 suites 265 90.10 98.05 453.15 HPCG 2,200 996,930 Computed tomography 1 suite 168 57.12 62.16 287.28 high cost 2,200 632,016 Nuclear medicine 1 suite 165 56.10 61.05 282.15 super cost 2,840 801,306
MRI 1 dept 244 82.96 90.28 417.24 super cost 2,840 1,184,962 Pathology
Haematology 1 dept 375 127.50 138.75 641.25 high cost 2,680 1,718,550 Chemical pathology 1 dept 335 113.90 123.95 572.85 high cost 2,680 1,535,238 Histopathology 1 dept 315 107.10 116.55 538.65 high cost 2,680 1,443,582 Microbiology 1 dept 445 151.30 164.65 760.95 high cost 2,680 2,039,346
Shared accommodation 1 dept 585 198.90 216.45 1,000.35 high cost 2,680 2,680,938 Pharmacy
Assembly 1 dept 218 76.30 76.30 370.60 high cost 2,680 993,208 Quality control 1 dept 220 77.00 77.00 374.00 high cost 2,680 1,002,320 Purchase and distribution 1 dept 627 219.45 219.45 1,065.90 high cost 2,680 2,856,612 Out-patients Remote 65 22.75 22.75 110.50 high cost 2,680 296,140 Radiopharmaceuticals 1 dept 80 28.00 28.00 136.00 high cost 2,680 364,480 Medium size hospital 1 dept 494 172.90 172.90 839.80 high cost 2,680 2,250,664
Aseptic suite 1 dept 80 28.00 28.00 136.00 high cost 2,680 364,480 Mortuary and post mortem
Body viewing 1 suite 40 14.00 11.20 65.20 high cost 2,680 174,736 Body store 30 125 43.75 35.00 203.75 high cost 2,680 546,050 Deep freeze 5 stores 12 4.20 3.36 19.56 high cost 2,680 52,421
PM suite 1 155 54.25 43.40 252.65 high cost 2,680 677,102
Medical photography 1 dept 130 45.50 36.40 211.90 * 2,340 495,846
Anaesthetics 1 dept 160 56.00 44.80 260.80 * 2,840 740,672
Satellite dialysis unit 8 stations 436 152.60 122.08 710.68 HPCG 2,700 1,918,836 Rehabilitation
Departmental accommodation 1 large unit 2,549 943.13 586.27 4,078.40 low cost 2,050 8,360,720 Physiotherapy 60 patients 2,549 943.13 586.27 4,078.40 low cost 2,050 8,360,720 Occupational therapy 33 patients
Speech therapy 18 patientsDay surgery 3 theatres 1,507 557.59 346.61 2,411.20 HPCG 2,670 6,437,904 Endoscopy 2 rooms 792 293.04 182.16 1,267.20 high cost 2,680 3,396,096
Out-patient servicesOut-patients
C/E rooms 42 2,300 966.00 598.00 3,864.00 HPCG 2,040 7,882,560 Plaster 1 room 59 24.78 15.34 99.12 HPCG 2,040 202,205 Colposcopy C/E 1 room 31 13.02 8.06 52.08 HPCG 2,040 106,243
Primary analysis facility 3 work stations 20 8.40 5.20 33.60 HPCG 2,040 68,544 Oral surgery 4 dental chairs 560 235.20 145.60 940.80 high cost 2,680 2,521,344 Ophthalmic clinic 10 rooms/bays 581 244.02 151.06 976.08 low cost 2,050 2,000,964 Dermatology 1 dept 55 23.10 14.30 92.40 low cost 2,050 189,420 ENT 3 consultants 373 156.66 96.98 626.64 super cost 2,840 1,779,658 Audiology 1 booth 234 98.28 60.84 393.12 super cost 2,840 1,116,461 Maternity clinic 1 clinic
Entrance 1 71 28.40 22.72 122.12 HPCG 2,470 301,636 Ante/post natal clinic 8 C/E rooms 480 192.00 153.60 825.60 HPCG 2,470 2,039,232 Scanning rooms 2 198 79.20 63.36 340.56 HPCG 2,470 841,183 Day assessment unit 1 C/E rooms 246 98.40 78.72 423.12 HPCG 2,470 1,045,106 Early pregnancy unit 1 day unit 301 120.40 96.32 517.72 HPCG 2,470 1,278,768
Children's resource centre 1 322 128.80 103.04 553.84 HPCG 2,470 1,367,985 A&E 50,000 attendances 1,134 487.62 283.50 1,905.12 HPCG 2,140 4,076,957 Obs ward 10 places 450 193.50 112.50 756.00 HPCG 2,470 1,867,320
Administration ServicesAdministration
Offices 225 work stations 3,076 1,076.60 769.00 4,921.60 * 2,050 10,089,280
Health records 15 work stations 235 82.25 58.75 376.00 * 2,050 770,800
Health records library 750,000 case notes 895 313.25 223.75 1,432.00 * 2,050 2,935,600
Main entrance 1 353 123.55 88.25 564.80 * 2,050 1,157,840
Snack bar 1 90 31.50 22.50 144.00 * 2,050 295,200
Departmental entrances 4 500 175.00 125.00 800.00 * 2,050 1,640,000
Staff facilities
Catering/dining rooms 300 meals 335 117.25 83.75 536.00 * 2,340 1,254,240
Servery 300 meals 120 42.00 30.00 192.00 * 2,340 449,280
Occupational health centre 1 centre 160 56.00 40.00 256.00 * 2,050 524,800
Staff changing - semi auto 1000 places 767 268.45 191.75 1,227.20 * 2,050 2,515,760
On call accommodation 7 rooms 147 51.45 36.75 235.20 * 2,050 482,160
Service facilitiesCSSD 2 sterilizers 1,320 462.00 330.00 2,112.00 super cost 2,840 5,998,080 Telephone service
Operators suites 3 cabinets 80 28.00 20.00 128.00 * 2,050 262,400
Catering
CFPU 1 dept 1,600 560.00 400.00 2,560.00 * 2,340 5,990,400
End kitchen 600 meals 685 239.75 171.25 1,096.00 * 2,340 2,564,640
Hospital engineering and works servicesBoiler house 8800 KW included aboveEstates department 400 beds included belowExternal storage 400 beds included belowEMI workshop 2 workspaces included below
53,691 19,947 14,487 88,124 206,779,918 2,346.45 £/m2
HPCGs cost - OB1 line 1 206,779,918 2,346.45
External works - OB3 15% 31,016,988 351.97
Equipment - OB1 line 8 15% 31,016,988
Quantity
Info to right should appear
as a key to this table
Department/room
GIA (m2)
Engineering
space (m2)
Standardised HPCG categories for acute care (£/m2)
Total for hospital
Costs for whole hospital based on example schedules of accommodation and real data
Department/ro
om NIA (m2)
Circulation space
and
communication
space (m2)
Departments/rooms
Key to table on page 35

All figures in this table are for demonstration purposes only and should not be applied to real schemes. All costs are exclusive of VAT and are based on a MIPS index of 480.
The total cost should be carried forward to the OBC cost form OB2 (capital costs). APPENDIX 4 - Re-worked example
* Project specific costing
All figures contained in this example are for demonstration purposes super 2,840 only and should not be applied to any real scheme high 2,680
medium 2,340 low 2,050
Department/room Total (GIA) HPCGcategory HPCG £/m² Departmental cost (£)
In-patient servicesGeneral wards, 83% single rooms 192 beds 11,156 HPCG 2,280 25,435,680Children
Department 1 dept 158 medium cost 2,340 369,720 In-patient ward 20 beds 993 medium cost 2,340 2,323,620 Day care unit 8 beds 329 medium cost 2,340 769,860
ElderlyNursing section type A 96 beds 3,508 low cost 2,050 7,191,400 Day hospital 40 places 721 low cost 2,050 1,478,050 Administrative centre 200,000 population 135 low cost 2,050 276,750
MaternityLDRP standard 18 nr 702 HPCG 2,470 1,733,940 LDRP disabled 1 nr 45 HPCG 2,470 111,150 4 bed multi room 2 nr 110 HPCG 2,470 271,700 Single rooms 11 nr 176 HPCG 2,470 434,720 In-patient accommodation Option 1 2,445 HPCG 2,470 6,039,150 Neonatal 10 cots 424 high cost 2,680 1,136,320
Intensive therapy 6 beds 733 super cost 2,840 2,081,720 Cardiology 1 dept 733 super cost 2,840 2,081,720
Main operating facilitiesOperating suites
Theatres 8 theatres 3,974 HPCG 2,840 11,286,160
Diagnostic and treatment facilitiesRadiology 1 dept 4,384 HPCG 2,200 9,644,800
PathologyHaematology 1 dept 375 high cost 2,680 1,005,000 Chemical pathology 1 dept 335 high cost 2,680 897,800 Histopathology 1 dept 315 high cost 2,680 844,200 Microbiology 1 dept 445 high cost 2,680 1,192,600 Shared accommodation 1 dept 585 high cost 2,680 1,567,800
PharmacyAssembly 1 dept 218 high cost 2,680 584,240 Quality control 1 dept 220 high cost 2,680 589,600 Purchase & distribution 1 dept 627 high cost 2,680 1,680,360 Out-patients Remote 65 high cost 2,680 174,200 Radiopharmaceuticals 1 dept 80 high cost 2,680 214,400 Medium sized hospital 1 dept 494 high cost 2,680 1,323,920 Aseptic suite 1 dept 80 high cost 2,680 214,400
Mortuary & post mortemBody viewing 1 suite 40 high cost 2,680 107,200 Body store 30 nr 160 high cost 2,680 428,800 Deep freeze 5 stores 12 high cost 2,680 32,160 PM suite 1 nr 155 high cost 2,680 415,400
Medical photography 1 dept 130 * 2,340 304,200 Anaesthetics 1 dept 160 * 2,840 454,400 Satellite dialysis unit 19 stations 1,035 HPCG 2,700 2,794,500 Rehabilitation
Departmental accommodation 1 large unit 2,549 low cost 2,050 5,225,450 Physiotherapy 60 patients 2,549 low cost 2,050 5,225,450
Day surgery 4 theatres 2,653 HPCG 2,670 7,083,510 Endoscopy 2 rooms 792 high cost 2,680 2,122,560
Out-patient servicesOut-patients
C/E rooms 36 nr 2,204 HPCG 2,040 4,496,160 Plaster 1 room 59 HPCG 2,040 120,360 Colposcopy C/E 1 room 31 HPCG 2,040 63,240 Primary analysis facility 3 workstations 20 HPCG 2,040 40,800
Oral surgery 4 dental chairs 560 high cost 2,680 1,500,800 Ophthalmic clinic 10 rooms/bays 581 low cost 2,050 1,191,050 Dermatology 1 dept 55 low cost 2,050 112,750 ENT 3 consultants 373 super cost 2,840 1,059,320 Audiology 1 booth 234 super cost 2,840 664,560 Maternity clinic 1 clinic
Entrance 1 nr 71 HPCG 2,470 175,370 Ante/post natal clinic 8 C/E rooms 480 HPCG 2,470 1,185,600 Scanning rooms 2 nr 198 HPCG 2,470 489,060 Day assessment unit 1 C/E rooms 246 HPCG 2,470 607,620 Early pregnancy unit 1 day unit 301 HPCG 2,470 743,470
Children's resource centre 1 nr 322 HPCG 2,470 795,340 A&E 50,000 attendances 1,903 HPCG 2,140 4,072,420 Obs ward 10 places 450 HPCG 2,470 1,111,500
Administration servicesAdministration
Offices 225 workstations 3,076 * 2,050 6,305,800 Health records 15 workstations 235 * 2,050 481,750 Health records library 750,000 case notes 895 * 2,050 1,834,750
Main entrance 1 nr 353 * 2,050 723,650 Snack bar 1 nr 90 * 2,050 184,500 Departmental entrances 4 nr 500 * 2,050 1,025,000
Staff facilitiesCatering/dining rooms 300 meals 335 * 2,340 783,900 Servery 300 meals 120 * 2,340 280,800 Occupational health centre 1 centre 160 * 2,050 328,000 Staff changing - semi auto 1,000 places 767 * 2,050 1,572,350 On call accommodation 7 rooms 147 * 2,050 301,350
Service facilitiesCSSD 2 sterilisers 1,320 super cost 2,840 3,748,800 Telephone service -
Operators suites 3 cabinets 80 * 2,050 164,000 -
CateringCFPU 1 dept 1,600 * 2,340 3,744,000 End kitchen 600 meals 685 * 2,340 1,602,900
Hospital engineering and works services - Boiler house 8,800 KW InclEstates department 400 beds ExclExternal storage 400 beds ExclEMI workshop 2 workspaces Excl
-
TOTAL 63,251 148,659,580
Areas used for illustration purposes and should not be used to cost live schemes; project specific areas should be referred to HPCG cost OB1 line 1 148,659,580
External works - OB3 15% 22,298,937Equipment - OB1 line 8 15% 22,298,937
193,257,454£
£/m2 3055.41
Costs for whole hospital based on example schedules of accommodation and real data
Healthcare Premises Cost Guides

35
This appendix provides an estimate of the circulation space, communication space and engineering space allowances that should be applied to the example schedules of accommodation published by DH. Note: example schedules of accommodation published from 2010 onwards will include these allowances.
The circulation space allowances are based on current published figures.
The communication space allowance has been standardised at 10% of NIA. However, this percentage may fluctuate depending on building size, number of storeys etc. The percentage included for communication space must be adjusted accordingly when compiling real schedules of accommodation.
The engineering space allowances for those schedules of accommodation highlighted in red have been calculated using the detailed method outlined in section 3 of this guidance.
As an interim measure, the overall engineering space allowances for all other example schedules of accommodation are based on the nearest match in terms of the properly calculated figures, adjusted to take account of differences in the size of the department and level of engineering complexity. The breakdown for public, clinical and staff space are based on the averages of the properly calculated figures, adjusted to take account of the estimated overall engineering space allowance.
Note: The engineering space allowances in black are estimates only and should be used with caution, particularly those for public, clinical and staff space. In future, as example schedules of accommodation are updated the engineering space allowances for the different types of spaces will be calculated using the detailed method outlined in Chapter 3 of this guidance.
All engineering space allowances should be assessed in the context of specific requirements and adjusted accordingly.
Appendix 5 – Circulation space, communication space and engineering space allowances
Example schedules of accommodation for delivery of acute care Public space Staff space Clinical space Overall space
Cir
cula
tion
+
com
mun
icat
ion
spac
e al
low
ance
Engi
neer
ing
spac
e al
low
ance
Cir
cula
tion
+
com
mun
icat
ion
spac
e al
low
ance
Engi
neer
ing
spac
e al
low
ance
Cir
cula
tion
+
com
mun
icat
ion
spac
e al
low
ance
Engi
neer
ing
spac
e al
low
ance
Cir
cula
tion
+
com
mun
icat
ion
spac
e al
low
ance
Engi
neer
ing
spac
e al
low
ance
Health Building Note 04-01 – ‘Adult in-patient facilities’ (48 beds, 83% single rooms) 37% 24% 37% 14% 37% 23% 37% 23%
Health Building Note 6 Volume 1 – ‘Facilities for diagnostic imaging and interventional radiology’ (example 2)
42% 37% 42% 25% 42% 36% 42% 34%
Health Building Note 6 Volume 2 – ‘PACS and specialist imaging’ 42% 30% 42% 24% 42% 41% 42% 37%
Health Building Note 6 Volume 3 – ‘Extremity and open MRI, magnetic shielding and construction for radiation protection’
42% 28% 42% 22% 42% 37% 42% 34%
Health Building Note 07-01 – ‘Satellite dialysis unit’ (18 stations) 35% 15% 35% 27% 35% 34% 35% 30.5%
Health Building Note 07-02 – ‘Main renal unit’ 35% 26% 35% 21% 35% 35% 35% 32%

Example schedules of accommodation for delivery of acute care Public space Staff space Clinical space Overall space
Cir
cula
tion
+
com
mun
icat
ion
spac
e al
low
ance
Engi
neer
ing
spac
e al
low
ance
Cir
cula
tion
+
com
mun
icat
ion
spac
e al
low
ance
Engi
neer
ing
spac
e al
low
ance
Cir
cula
tion
+
com
mun
icat
ion
spac
e al
low
ance
Engi
neer
ing
spac
e al
low
ance
Cir
cula
tion
+
com
mun
icat
ion
spac
e al
low
ance
Engi
neer
ing
spac
e al
low
ance
Health Building Note 8 – ‘Facilities for rehabilitation services’ 35% 17% 35% 14% 35% 23% 35% 21%
Health Building Note 09-02 – ‘Maternity care facilities’ (midwife-led unit: 500 births per annum) 40% 26% 40% 19% 40% 34% 40% 32%
Health Building Note 10-02 – ‘Day surgery facilities’ (4 operating theatres) 37% 25% 37% 13% 37% 37% 37% 35%
Health Building Note 12 – ‘Out-patients department’ (6, 8 and 12 consulting/examination rooms)
42% 13% 42% 28% 42% 32% 42% 26%
Health Building Note 12-01 Supplement B – ‘Oral surgery, orthodontics, restorative dentistry’ (5,000 attendances per annum)
42% 34% 42% 38% 42% 40% 42% 39%
Health Building Note 12 Supplement 3 – ‘ENT and audiology clinics, hearing aid centre’ 42% 22% 42% 17% 42% 30% 42% 27%
Health Building Note 12 Supplement 4 – ‘Ophthalmology’ 42% 21% 42% 17% 42% 29% 42% 26%
Health Building Note 12-01 Supplement A – ‘Sexual and reproductive health clinics’ (30,000 attendances per annum)
42% 17% 42% 41% 42% 34% 28% 25%
Health Building Note 13 – ‘Sterile services department’ 35% 0% 35% 21% 35% 36% 35% 33%
Health Building Note 14-01 – ‘Pharmacy and radiopharmacy facilities’ 35% 28% 35% 23% 35% 38% 35% 35%
Health Building Note 20 – ‘Facilities for mortuary and post-mortem room services’ 35% 23% 35% 18% 35% 31% 35% 28%
Health Building Note 22 – ‘Accident and emergency facilities for adults and children’ (example 2) 42% 18% 42% 20% 42% 29% 42% 25%
Health Building Note 23 – ‘Hospital accommodation for children and young people’ 35% 19% 35% 15% 35% 25% 35% 23%
Health Building Note 26 Volume 1 – ‘Facilities for surgical procedures’ (example 1, 8 operating theatres) N/A N/A 35% 18% 35% 48% 35% 40%
Health Building Note 28 – ‘Facilities for cardiac services’ 35% 24% 35% 19% 35% 33% 35% 30%
Health Building Note 35 Part 1 – ‘Accommodation for people with mental illness: The acute unit’ 35% 19% 35% 15% 35% 25% 35% 23%
Health Building Note 37 – ‘In-patient facilities for older people’ 35% 19% 35% 15% 35% 25% 35% 23%
Health Building Note 52 Volume 2 – ‘Endoscopy unit’ 35% 23% 35% 21% 35% 35% 35% 32%
Health Building Note 52 Volume 3 – ‘Medical investigation and treatment unit’ 35% 18% 35% 17% 35% 29% 35% 26%
Health Building Note 54 – ‘Facilities for cancer services’ 35% 25% 35% 23% 35% 38% 35% 35%
Health Building Note 57 – ‘Facilities for critical care’ 35% 23% 35% 21% 35% 35% 35% 32%
Healthcare Premises Cost Guides
36

Appendix 5 – Circulation space, communication space and engineering space allowances
37
The table below shows the average engineering space allowances for the example schedules of accommodation highlighted in red:
Example schedules of accommodation highlighted in red
Public space
Clinical space
Staff space
Overall space
Average engineering space allowance 21% 28.3% 16.7% 25.8%
The engineering space allowances for the different types of space can be expressed as a percentage of the overall engineering space allowance. For public spaces this would be: 21/25.8 ×100 = 81.2%.
This calculation provides the following figures:
Public space Clinical space Staff space
81.2% 109.7% 64.5%
These figures have been used to estimate the engineering space allowances for the different types of space where the current published example schedule of accommodation does not show the split between public, clinical and staff space and only an estimation of the overall engineering space allowance is possible.
If an overall engineering space allowance of 30 had been estimated, the engineering space allowance for public space would be calculated as follows: 81.2/100 × 30. This would produce the following figures for the three types of space:
Spaces Engineering space allowance
Public space 24.3%Clinical space 32.9%
Staff space 19.3%Overall space 30%
Example schedules of accommodation for delivery of care from independent locations Public space Staff space Clinical space Overall space
Cir
cula
tion
+
com
mun
icat
ion
spac
e al
low
ance
Engi
neer
ing
spac
e al
low
ance
Cir
cula
tion
+
com
mun
icat
ion
spac
e al
low
ance
Engi
neer
ing
spac
e al
low
ance
Cir
cula
tion
+
com
mun
icat
ion
spac
e al
low
ance
Engi
neer
ing
spac
e al
low
ance
Cir
cula
tion
+
com
mun
icat
ion
spac
e al
low
ance
Engi
neer
ing
spac
e al
low
ance
Health Building Note 35 Part 2 – ‘Accommodation for people with mental illness: Treatment and care in the community’
35% 21% 35% 17% 35% 29% 35% 26%
Health Building Note 44 – ‘Accommodation for ambulance services’ 35% 18% 35% 16% 35% 27% 35% 25%
NoteFor information on the allowances for primary and community care buildings, see Health Building Note 11-01.

Healthcare Premises Cost Guides
38
Appendix 6 – Elemental cost plans

Appendix 6 – Elemental cost plans
39
HBN 04-01 – ‘Adult in-patient facilities’ (public space)
HBN 04-01 - 'Adult in-patient facilities' (48 beds, 83% single rooms) Jul-10
Index level : 480 MIPS(FP) Gross internal area : 83 m2
COST OF RATE ELEMENTAL DATA QUANTITY ELEMENTAL ELEMENT ELEMENT Quantity Rate FACTOR PERCENTAGE
£ £/m2 £ %
1 SUBSTRUCTURE 7,200 86.46 41 175.74 0.490 4.77
2A Frame 9,500 114.08 83 115.00 1.000 6.302B Upper floors 2,600 31.22 40 65.00 0.480 1.722C Roof 8,500 102.07 50 170.00 0.600 5.632D Stairs 800 10.00 - - - 0.532E External walls 11,800 141.70 43 275.00 0.520 7.822F Windows and external doors 4,400 52.84 8 550.00 0.100 2.922G Internal walls and partitions 12,900 154.91 237 54.30 - 8.552H Internal doors 4,200 50.43 7 651.87 2.78
2 SUPERSTRUCTURE 54,700 657.25 36.25
3A Wall finishes 8,600 103.27 347 24.73 5.703B Floor finishes 4,600 55.24 80 57.06 3.053C Ceiling finishes 2,900 34.82 80 36.24 1.92
3 INTERNAL FINISHES 16,100 193.33 10.67
4 FITTINGS & FURNISHINGS 7,700 92.46 5.10
5A Sanitary appliances 10,200 122.48 - - - 6.765C Disposal installations 1,200 15.00 - - - 0.805N BWIC 3,000 36.02 - - - 1.995O Profit and attendances 1,500 18.01 - - - 0.99
BUILDING SERVICES 15,900 191.51 10.54
5B Services equipment - - 0.005D Water installations 7,400 89.12 4.905E Heat source 500 5.42 0.335F Space heating/air treatment 3,700 43.88 2.455G Ventilation system 7,500 89.96 4.975H Electrical installations 14,400 172.41 9.545I Gas installations 700 8.90 0.465J Lifts and conveyors 3,300 40.08 2.195K Protective installations 2,100 24.82 1.395L Communication installations 5,300 64.20 3.515M Special installations 4,400 52.31 2.92
M&E SERVICES 49,300 591.10 32.66
BUILDING & ENGINEERING 150,900 1,812.11 100.00
7 Preliminaries 22,600 271.39 15.008A Design risk 7,600 91.26 5.008B Employers variation risk - - 0.008C BREEAM allowance 4,500 54.04 3.00
TOTAL 34,700 416.68
TOTAL COST £ 185,600 £ 2,228.72 /m2
Building £ 124,900 £ 1,499.82 /m2
Engineering £ 60,700 £ 728.90 /m2

Healthcare Premises Cost Guides
40
HBN 04-01 – ‘Adult in-patient facilities’ (clinical space)
HBN 04-01 - 'Adult in-patient facilities' (48 beds, 83% single rooms) Jul-10
Index level : 480 MIPS(FP) Gross internal area : 2571 m2
COST OF RATE ELEMENTAL DATA QUANTITY ELEMENTAL ELEMENT ELEMENT Quantity Rate FACTOR PERCENTAGE
£ £/m2 £ %
1 SUBSTRUCTURE 221,400 86.12 1260 175.74 0.490 4.63
2A Frame 295,700 115.02 2,571 115.00 1.000 6.182B Upper floors 80,200 31.19 1,234 65.00 0.480 1.682C Roof 262,300 102.02 1,543 170.00 0.600 5.482D Stairs 25,700 10.00 - - - 0.542E External walls 367,700 143.02 1,337 275.00 0.520 7.682F Windows and external doors 141,400 55.00 257 550.00 0.100 2.952G Internal walls and partitions 215,600 83.86 3,414 63.13 - 4.502H Internal doors 141,900 55.19 206 687.22 2.96
2 SUPERSTRUCTURE 1,530,500 595.30 31.97
3A Wall finishes 250,000 97.24 5,889 42.44 5.223B Floor finishes 135,100 52.55 2,474 54.61 2.823C Ceiling finishes 89,700 34.89 2,474 36.24 1.87
3 INTERNAL FINISHES 474,800 184.68 9.91
4 FITTINGS & FURNISHINGS 161,300 62.74 3.37
5A Sanitary appliances 421,600 163.99 - - - 8.815C Disposal installations 38,600 15.00 - - - 0.815N BWIC 111,500 43.37 - - - 2.335O Profit and attendances 55,800 21.70 - - - 1.17
BUILDING SERVICES 627,500 244.06 13.12
5B Services equipment - - 0.005D Water installations 229,600 89.29 4.805E Heat source 16,700 6.49 0.355F Space heating/air treatment 116,100 45.17 2.435G Ventilation system 210,100 81.72 4.395H Electrical installations 494,200 192.22 10.335I Gas installations 24,100 9.38 0.505J Lifts and conveyors 103,000 40.08 2.155K Protective installations 63,800 24.82 1.335L Communication installations 319,500 124.26 6.685M Special installations 193,600 75.31 4.04
M&E SERVICES 1,770,700 688.73 37.00
BUILDING & ENGINEERING 4,786,200 1,861.63 100.00
7 Preliminaries 717,900 279.24 15.008A Design risk 239,300 93.08 5.008B Employers variation risk - - 0.008C BREEAM allowance 143,600 55.86 3.00
TOTAL 1,100,800 428.17
TOTAL COST £ 5,887,000 £ 2,289.82 /m2
Building £ 3,709,100 £ 1,442.70 /m2
Engineering £ 2,177,900 £ 847.12 /m2

Appendix 6 – Elemental cost plans
41
HBN 04-01 – ‘Adult in-patient facilities’ (staff space)
HBN 04-01 - 'Adult in-patient facilities' (48 beds, 83% single rooms) Jul-10
Index level : 480 MIPS(FP) Gross internal area: 135 m2
COST OF RATE ELEMENTAL DATA QUANTITY ELEMENTAL ELEMENT ELEMENT Quantity Rate FACTOR PERCENTAGE
£ £/m2 £ %
1 SUBSTRUCTURE 11,600 85.88 66 175.74 0.490 5.18
2A Frame 15,500 114.76 135 115.00 1.000 6.922B Upper floors 4,200 31.10 65 65.00 0.480 1.872C Roof 13,800 102.17 81 170.00 0.600 6.162D Stairs 1,400 10.00 - - - 0.622E External walls 19,300 142.89 70 275.00 0.520 8.612F Windows and external doors 7,700 57.01 14 550.00 0.100 3.442G Internal walls and partitions 8,100 59.97 149 54.26 - 3.612H Internal doors 6,600 48.86 10 631.10 2.95
2 SUPERSTRUCTURE 76,600 566.76 34.18
3A Wall finishes 5,700 42.20 291 19.72 2.543B Floor finishes 6,800 50.35 130 51.99 3.033C Ceiling finishes 4,700 34.80 130 36.24 2.10
3 INTERNAL FINISHES 17,200 127.35 7.67
4 FITTINGS & FURNISHINGS 16,400 121.42 7.32
5A Sanitary appliances 27,900 206.56 - - - 12.455C Disposal installations 2,000 15.00 - - - 0.895N BWIC 4,800 35.54 - - - 2.145O Profit and attendances 2,400 17.77 - - - 1.07
BUILDING SERVICES 37,100 274.87 16.55
5B Services equipment - - 0.005D Water installations 6,700 49.42 2.995E Heat source 500 3.81 0.225F Space heating/air treatment 3,400 24.84 1.525G Ventilation system 5,600 41.41 2.505H Electrical installations 23,300 172.41 10.405I Gas installations 1,100 8.18 0.495J Lifts and conveyors 5,400 40.08 2.415K Protective installations 3,400 24.82 1.525L Communication installations 8,700 64.20 3.885M Special installations 7,100 52.31 3.17
M&E SERVICES 65,200 481.47 29.10
BUILDING & ENGINEERING 224,100 1,657.75 100.00
7 Preliminaries 33,600 248.76 15.008A Design risk 11,200 82.92 5.008B Employers variation risk - - 0.008C BREEAM allowance 6,800 50.35 3.00
TOTAL 275,700 2,041.19
TOTAL COST £ 275,700 £ 2,041.20 /m2
Building £ 195,400 £ 1,446.68 /m2
Engineering £ 80,300 £ 594.52 /m2

Healthcare Premises Cost Guides
42
HBN 04-01 – ‘Adult in-patient facilities’ (overall space)
HBN 04-01 - 'Adult in-patient facilities' (48 beds, 83% single rooms) Jul-10
Index level : 480 MIPS(FP) Gross internal area : 2789 m2
COST OF RATE ELEMENTAL DATA QUANTITY ELEMENTAL ELEMENT ELEMENT Quantity Rate FACTOR PERCENTAGE
£ £/m2 £ %
1 SUBSTRUCTURE 240,200 86.12 1367 175.74 0.490 4.66
2A Frame 320,700 114.98 2,789 115.00 1.000 6.222B Upper floors 87,000 31.19 1,339 65.00 0.480 1.692C Roof 284,600 102.03 1,674 170.00 0.600 5.522D Stairs 27,900 10.00 - - - 0.542E External walls 398,800 142.98 1,450 275.00 0.520 7.732F Windows and external doors 153,500 55.03 279 550.00 0.100 2.982G Internal walls and partitions 236,500 84.79 3,799 62.27 - 4.582H Internal doors 152,700 54.75 223 683.56 2.96
2 SUPERSTRUCTURE 1,661,700 595.75 32.22
3A Wall finishes 264,400 94.79 6,528 40.50 5.123B Floor finishes 146,500 52.52 2,685 54.56 2.843C Ceiling finishes 97,300 34.88 2,685 36.24 1.89
3 INTERNAL FINISHES 508,200 182.19 9.85
4 FITTINGS & FURNISHINGS 185,400 66.47 3.59
5A Sanitary appliances 459,700 164.81 - - 8.915C Disposal installations 41,800 15.00 - - 0.815N BWIC 119,300 42.77 - - 2.315O Profit and attendances 59,700 21.40 - - 1.16
Building Services 680,500 243.98 13.19
5B Services equipment - - 0.005D Water installations 243,400 87.25 4.725E Heat source 17,600 6.32 0.345F Space heating/air treatment 123,000 44.09 2.385G Ventilation system 222,900 79.90 4.325H Electrical installations 531,700 190.62 10.315I Gas installations 25,900 9.30 0.505J Lifts and conveyors 111,800 40.08 2.175K Protective installations 69,200 24.82 1.345L Communication installations 333,100 119.41 6.465M Special installations 204,900 73.45 3.97
5 M&E SERVICES 1,883,500 675.23 36.51
BUILDING & ENGINEERING 5,159,500 1,849.74 100.00
7 Preliminaries 773,900 277.45 15.008A Design risk 258,000 92.50 5.008B Employers variation risk - - 0.008C BREEAM allowance 154,800 55.50 3.00
TOTAL 1,186,700 425.45
TOTAL COST £ 6,346,200 £ 2,275.21 /m2
Building £ 4,029,500 £ 1,444.64 /m2
Engineering £ 2,316,700 £ 830.57 /m2
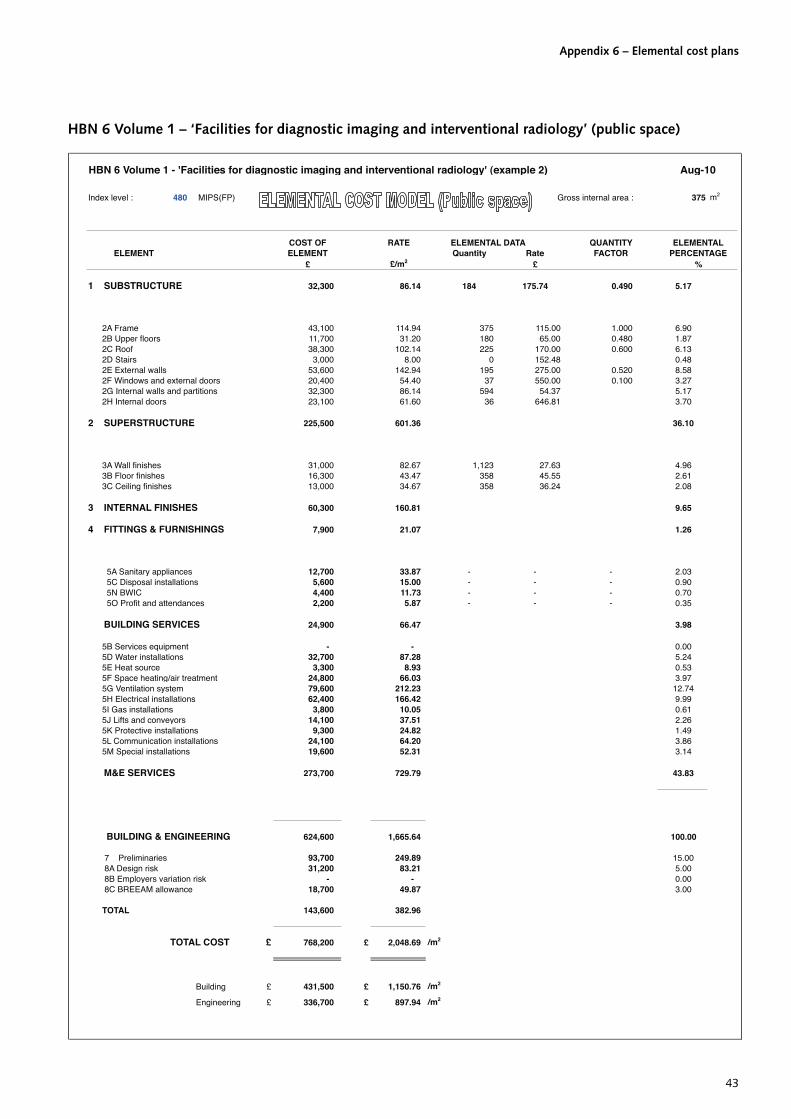
Appendix 6 – Elemental cost plans
43
HBN 6 Volume 1 – ‘Facilities for diagnostic imaging and interventional radiology’ (public space)
HBN 6 Volume 1 - 'Facilities for diagnostic imaging and interventional radiology' (example 2) Aug-10
Index level : 480 MIPS(FP) Gross internal area : 375 m2
COST OF RATE ELEMENTAL DATA QUANTITY ELEMENTAL ELEMENT ELEMENT Quantity Rate FACTOR PERCENTAGE
£ £/m2 £ %
1 SUBSTRUCTURE 32,300 86.14 184 175.74 0.490 5.17
2A Frame 43,100 114.94 375 115.00 1.000 6.902B Upper floors 11,700 31.20 180 65.00 0.480 1.872C Roof 38,300 102.14 225 170.00 0.600 6.132D Stairs 3,000 8.00 0 152.48 0.482E External walls 53,600 142.94 195 275.00 0.520 8.582F Windows and external doors 20,400 54.40 37 550.00 0.100 3.272G Internal walls and partitions 32,300 86.14 594 54.37 5.172H Internal doors 23,100 61.60 36 646.81 3.70
2 SUPERSTRUCTURE 225,500 601.36 36.10
3A Wall finishes 31,000 82.67 1,123 27.63 4.963B Floor finishes 16,300 43.47 358 45.55 2.613C Ceiling finishes 13,000 34.67 358 36.24 2.08
3 INTERNAL FINISHES 60,300 160.81 9.65
4 FITTINGS & FURNISHINGS 7,900 21.07 1.26
5A Sanitary appliances 12,700 33.87 - - - 2.035C Disposal installations 5,600 15.00 - - - 0.905N BWIC 4,400 11.73 - - - 0.705O Profit and attendances 2,200 5.87 - - - 0.35
BUILDING SERVICES 24,900 66.47 3.98
5B Services equipment - - 0.005D Water installations 32,700 87.28 5.245E Heat source 3,300 8.93 0.535F Space heating/air treatment 24,800 66.03 3.975G Ventilation system 79,600 212.23 12.745H Electrical installations 62,400 166.42 9.995I Gas installations 3,800 10.05 0.615J Lifts and conveyors 14,100 37.51 2.265K Protective installations 9,300 24.82 1.495L Communication installations 24,100 64.20 3.865M Special installations 19,600 52.31 3.14
M&E SERVICES 273,700 729.79 43.83
BUILDING & ENGINEERING 624,600 1,665.64 100.00
7 Preliminaries 93,700 249.89 15.008A Design risk 31,200 83.21 5.008B Employers variation risk - - 0.008C BREEAM allowance 18,700 49.87 3.00
TOTAL 143,600 382.96
TOTAL COST £ 768,200 £ 2,048.69 /m2
Building £ 431,500 £ 1,150.76 /m2
Engineering £ 336,700 £ 897.94 /m2

Healthcare Premises Cost Guides
44
HBN 6 Volume 1 – ‘Facilities for diagnostic imaging and interventional radiology’ (clinical space)
HBN 6 Volume 1 - 'Facilities for diagnostic imaging and interventional radiology' (example 2) Aug-10
Index level : 480 MIPS(FP) Gross internal area : 3293 m2
COST OF RATE ELEMENTAL DATA QUANTITY ELEMENTAL ELEMENT ELEMENT Quantity Rate FACTOR PERCENTAGE
£ £/m2 £ %
1 SUBSTRUCTURE 283,600 86.12 1614 175.74 0.490 4.57
2A Frame 378,700 115.00 3,293 115.00 1.000 6.102B Upper floors 102,800 31.22 1,581 65.00 0.480 1.662C Roof 335,900 102.00 1,976 170.00 0.600 5.412D Stairs 26,300 8.00 0 152.48 0.422E External walls 470,800 142.96 1,712 275.00 0.520 7.582F Windows and external doors 181,000 54.96 329 550.00 0.100 2.922G Internal walls and partitions 220,800 67.05 3,948 55.92 3.562H Internal doors 132,800 40.33 202 658.84 2.14
2 SUPERSTRUCTURE 1,849,100 561.52 29.79
3A Wall finishes 130,100 39.51 3,607 36.07 2.103B Floor finishes 180,500 54.81 3,148 57.34 2.913C Ceiling finishes 114,100 34.65 3,148 36.24 1.84
3 INTERNAL FINISHES 424,700 128.97 6.85
4 FITTINGS & FURNISHINGS 157,900 47.95 2.54
5A Sanitary appliances 7,200 2.19 - - - 0.125C Disposal installations 49,400 15.00 - - - 0.805N BWIC 51,200 15.55 - - - 0.825O Profit and attendances 25,600 7.77 - - - 0.41
BUILDING SERVICES 133,400 40.51 2.15
5B Services equipment - - 0.005D Water installations 113,700 34.53 1.835E Heat source 25,400 7.72 0.415F Space heating/air treatment 210,600 63.94 3.395G Ventilation system 745,600 226.43 12.015H Electrical installations 865,700 262.87 13.945I Gas installations 31,300 9.51 0.505J Lifts and conveyors 123,500 37.51 1.995K Protective installations 81,700 24.82 1.325L Communication installations 211,400 64.20 3.415M Special installations 950,800 288.74 15.31
M&E SERVICES 3,359,700 1,020.25 54.11
BUILDING & ENGINEERING 6,208,400 1,885.32 100.00
7 Preliminaries 931,300 282.80 15.008A Design risk 310,400 94.26 5.008B Employers variation risk - - 0.008C BREEAM allowance 186,300 56.57 3.00
TOTAL 1,428,000 433.63
TOTAL COST £ 7,636,400 £ 2,318.90 /m2
Building £ 3,503,900 £ 1,064.01 /m2
Engineering £ 4,132,500 £ 1,254.89 /m2

Appendix 6 – Elemental cost plans
45
HBN 6 Volume 1 – ‘Facilities for diagnostic imaging and interventional radiology’ (staff space)
HBN 6 Volume 1 - 'Facilities for diagnostic imaging and interventional radiology' (example 2) Aug-10
Index level : 480 MIPS(FP) Gross internal area : 845 m2
COST OF RATE ELEMENTAL DATA QUANTITY ELEMENTAL ELEMENT ELEMENT Quantity Rate FACTOR PERCENTAGE
£ £/m2 £ %
1 SUBSTRUCTURE 72,800 86.18 414 175.74 0.490 5.87
2A Frame 97,200 115.06 845 115.00 1.000 7.832B Upper floors 26,300 31.13 405 65.00 0.480 2.122C Roof 86,200 102.04 507 170.00 0.600 6.942D Stairs 6,800 8.00 0 152.48 0.552E External walls 120,700 142.88 439 275.00 0.520 9.722F Windows and external doors 46,200 54.69 84 550.00 0.100 3.722G Internal walls and partitions 64,500 76.35 1,186 54.33 5.202H Internal doors 36,100 42.73 55 650.97 2.91
2 SUPERSTRUCTURE 484,000 572.88 38.99
3A Wall finishes 67,100 79.43 2,487 26.98 5.413B Floor finishes 35,600 42.14 811 43.94 2.873C Ceiling finishes 29,400 34.80 811 36.24 2.37
3 INTERNAL FINISHES 132,100 156.37 10.65
4 FITTINGS & FURNISHINGS 32,400 38.35 2.61
5A Sanitary appliances - - - - - 0.005C Disposal installations 12,700 15.00 - - - 1.025N BWIC 7,600 9.00 - - - 0.615O Profit and attendances 3,800 4.50 - - - 0.31
BUILDING SERVICES 24,100 28.50 1.94
5B Services equipment - - 0.005D Water installations 42,700 50.60 3.445E Heat source 5,400 6.39 0.445F Space heating/air treatment 39,700 46.97 3.205G Ventilation system 108,800 128.76 8.775H Electrical installations 140,600 166.42 11.335I Gas installations 7,500 8.91 0.605J Lifts and conveyors 31,700 37.51 2.555K Protective installations 21,000 24.82 1.695L Communication installations 54,200 64.20 4.375M Special installations 44,200 52.31 3.56
M&E SERVICES 495,800 586.90 39.95
BUILDING & ENGINEERING 1,241,200 1,469.18 100.00
7 Preliminaries 186,200 220.42 15.008A Design risk 62,100 73.51 5.008B Employers variation risk - - 0.00
8C BREEAM allowance 37,300 44.15 3.00
TOTAL 285,600 338.08
TOTAL COST £ 1,526,800 £ 1,807.38 /m2
Building £ 916,900 £ 1,085.40 /m2
Engineering £ 609,900 £ 721.98 /m2

Healthcare Premises Cost Guides
46
HBN 6 Volume 1 – ‘Facilities for diagnostic imaging and interventional radiology’ (overall space)
HBN 6 Volume 1 - 'Facilities for diagnostic imaging and interventional radiology' (example 2) Aug-10
Index level : 480 MIPS(FP) Gross internal area : 4519 m2
COST OF RATE ELEMENTAL DATA QUANTITY ELEMENTAL ELEMENT ELEMENT Quantity Rate FACTOR PERCENTAGE
£ £/m2 £ %
1 SUBSTRUCTURE 389,100 86.11 2214 175.74 0.490 4.82
2A Frame 519,700 115.01 4,519 115.00 1.000 6.442B Upper floors 141,000 31.20 2,169 65.00 0.480 1.752C Roof 460,900 102.00 2,711 170.00 0.600 5.712D Stairs 36,200 8.00 0 152.48 0.452E External walls 646,300 143.02 2,350 275.00 0.520 8.012F Windows and external doors 248,600 55.01 452 550.00 0.100 3.082G Internal walls and partitions 319,000 70.59 5,755 55.44 3.952H Internal doors 193,300 42.78 295 655.75 2.40
2 SUPERSTRUCTURE 2,565,000 567.61 31.79
3A Wall finishes 230,200 50.94 7,254 31.74 2.853B Floor finishes 232,400 51.43 4,324 53.75 2.883C Ceiling finishes 156,700 34.68 4,324 36.24 1.94
3 INTERNAL FINISHES 619,300 137.05 7.67
4 FITTINGS & FURNISHINGS 198,400 43.91 2.46
5A Sanitary appliances 19,800 4.38 - - - 0.255C Disposal installations 67,800 15.00 - - - 0.845N BWIC 63,100 13.96 - - - 0.785O Profit and attendances 31,600 6.99 - - - 0.39
BUILDING SERVICES 182,300 40.33 2.26
5B Services equipment - - 0.005D Water installations 189,800 42.01 2.355E Heat source 34,100 7.55 0.425F Space heating/air treatment 274,600 60.76 3.405G Ventilation system 930,900 206.00 11.535H Electrical installations 1,066,200 235.95 13.215I Gas installations 42,600 9.44 0.535J Lifts and conveyors 169,500 37.51 2.105K Protective installations 112,100 24.82 1.395L Communication installations 290,100 64.20 3.595M Special installations 1,006,600 222.76 12.47
M&E SERVICES 4,116,500 911.01 50.99
BUILDING & ENGINEERING 8,070,600 1,786.02 100.00
7 Preliminaries 1,210,600 267.90 15.008A Design risk 403,500 89.29 5.008B Employers variation risk - - 0.008C BREEAM allowance 242,100 53.58 3.00
TOTAL 1,856,200 410.77
TOTAL COST £ 9,926,800 £ 2,196.78 /m2
Building £ 4,863,500 £ 1,076.28 /m2
Engineering £ 5,063,300 £ 1,120.50 /m2

Appendix 6 – Elemental cost plans
47
HBN 07-01 – ‘Satellite dialysis unit’ (public space)
HBN 07-01 - 'Satellite dialysis unit' (18 stations) Jul-10
Index level : 480 MIPS(FP) Gross internal area : 139 m2
COST OF RATE ELEMENTAL DATA QUANTITY ELEMENTAL ELEMENT ELEMENT Quantity Rate FACTOR PERCENTAGE
£ £/m2 £ %
1 SUBSTRUCTURE 12,000 86.56 68 175.74 0.490 6.6
2A Frame 16,000 115.41 139 115.00 1.000 8.80 2B Upper floors 4,400 31.74 67 65.00 0.480 2.42 2C Roof 14,100 101.71 83 170.00 0.600 7.75
### 2D Stairs 2,800 20.00 - - - 1.54 2E External walls 19,800 142.82 72 275.00 0.520 10.89 2F Windows and external doors 7,700 55.54 14 550.00 0.100 4.23 2G Internal walls and partitions 8,700 62.75 145 60.27 - 4.78 2H Internal doors 5,500 39.67 9 633.59 3.02
2 SUPERSTRUCTURE 79,000 569.64 43.43
3A Wall finishes 7,500 54.10 281 26.77 4.12 3B Floor finishes 4,800 34.62 126 38.25 2.64 3C Ceiling finishes 4,600 33.18 126 36.24 2.53
3 INTERNAL FINISHES 16,900 121.90 9.29
4 FITTINGS & FURNISHINGS 2,500 18.03 1.37
5A Sanitary appliances - - - - - 0.00 5C Disposal installations 2,100 15.00 - - - 1.15 5N BWIC 3,300 23.80 - - - 1.81 5O Profit and attendances 1,700 12.26 - - - 0.93
BUILDING SERVICES 7,100 51.06 3.89
5B Services equipment - - 0.00 5D Water installations 2,000 14.50 1.10 5E Heat source 500 3.50 0.27 5F Space heating/air treatment 4,300 30.72 2.36 5G Ventilation system 7,600 55.07 4.18 5H Electrical installations 23,900 172.07 13.14 5I Gas Installations 1,100 7.82 0.60 5J Lifts and conveyors 5,400 38.76 2.97 5K Protective installations 3,400 24.82 1.87 5L Communication installations 8,900 64.20 4.89 5M Special installations 7,300 52.31 4.01
M&E SERVICES 64,400 463.76 35.39
BUILDING & ENGINEERING 181,900 1,310.95 100.00
7 Preliminaries 27,300 196.92 15.00 8A Design risk 9,100 65.64 5.00 8B Employers variation risk - - 0.00 8C BREEAM allowance 5,400 38.95 3.00
TOTAL 41,800 301.51
TOTAL COST £ 223,700 £ 1,613.60 /m2
Building £ 144,500 £ 1,042.31 /m2
Engineering £ 79,200 £ 571.29 /m2
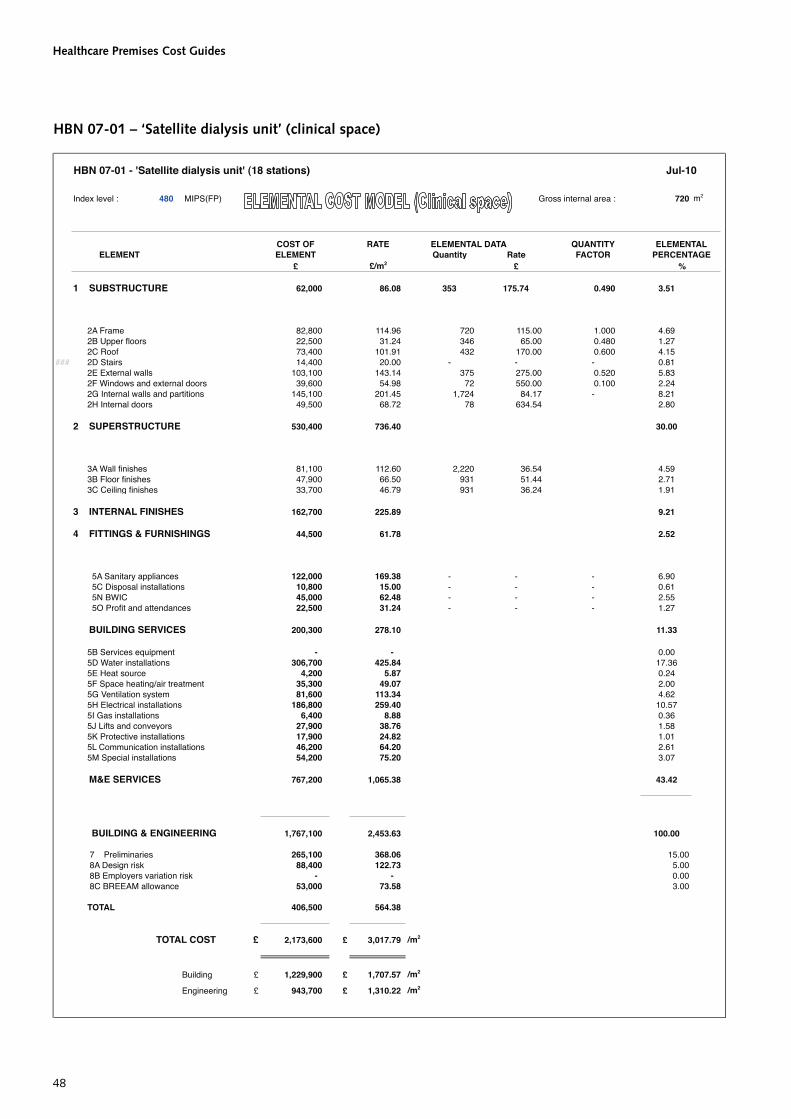
Healthcare Premises Cost Guides
48
HBN 07-01 – ‘Satellite dialysis unit’ (clinical space)
HBN 07-01 - 'Satellite dialysis unit' (18 stations) Jul-10
Index level : 480 MIPS(FP) Gross internal area : 720 m2
COST OF RATE ELEMENTAL DATA QUANTITY ELEMENTAL ELEMENT ELEMENT Quantity Rate FACTOR PERCENTAGE
£ £/m2 £ %
1 SUBSTRUCTURE 62,000 86.08 353 175.74 0.490 3.51
2A Frame 82,800 114.96 720 115.00 1.000 4.69 2B Upper floors 22,500 31.24 346 65.00 0.480 1.27 2C Roof 73,400 101.91 432 170.00 0.600 4.15
### 2D Stairs 14,400 20.00 - - - 0.81 2E External walls 103,100 143.14 375 275.00 0.520 5.83 2F Windows and external doors 39,600 54.98 72 550.00 0.100 2.24 2G Internal walls and partitions 145,100 201.45 1,724 84.17 - 8.21 2H Internal doors 49,500 68.72 78 634.54 2.80
2 SUPERSTRUCTURE 530,400 736.40 30.00
3A Wall finishes 81,100 112.60 2,220 36.54 4.59 3B Floor finishes 47,900 66.50 931 51.44 2.71 3C Ceiling finishes 33,700 46.79 931 36.24 1.91
3 INTERNAL FINISHES 162,700 225.89 9.21
4 FITTINGS & FURNISHINGS 44,500 61.78 2.52
5A Sanitary appliances 122,000 169.38 - - - 6.90 5C Disposal installations 10,800 15.00 - - - 0.61 5N BWIC 45,000 62.48 - - - 2.55 5O Profit and attendances 22,500 31.24 - - - 1.27
BUILDING SERVICES 200,300 278.10 11.33
5B Services equipment - - 0.00 5D Water installations 306,700 425.84 17.36 5E Heat source 4,200 5.87 0.24 5F Space heating/air treatment 35,300 49.07 2.00 5G Ventilation system 81,600 113.34 4.62 5H Electrical installations 186,800 259.40 10.57 5I Gas installations 6,400 8.88 0.36 5J Lifts and conveyors 27,900 38.76 1.58 5K Protective installations 17,900 24.82 1.01 5L Communication installations 46,200 64.20 2.61 5M Special installations 54,200 75.20 3.07
M&E SERVICES 767,200 1,065.38 43.42
BUILDING & ENGINEERING 1,767,100 2,453.63 100.00
7 Preliminaries 265,100 368.06 15.00 8A Design risk 88,400 122.73 5.00 8B Employers variation risk - - 0.00 8C BREEAM allowance 53,000 73.58 3.00
TOTAL 406,500 564.38
TOTAL COST £ 2,173,600 £ 3,017.79 /m2
Building £ 1,229,900 £ 1,707.57 /m2
Engineering £ 943,700 £ 1,310.22 /m2

Appendix 6 – Elemental cost plans
49
HBN 07-01 – ‘Satellite dialysis unit’ (staff space)
HBN 07-01 - 'Satellite dialysis unit' (18 stations) Jul-10
Index level : 480 MIPS(FP) Gross internal area : 176 m2
COST OF RATE ELEMENTAL DATA QUANTITY ELEMENTAL ELEMENT ELEMENT Quantity Rate FACTOR PERCENTAGE
£ £/m2 £ %
1 SUBSTRUCTURE 15,100 85.76 86 175.74 0.490 4.72
2A Frame 20,200 114.72 176 115.00 1.000 6.31 2B Upper floors 5,500 31.24 85 65.00 0.480 1.72 2C Roof 18,000 102.23 106 170.00 0.600 5.63
### 2D Stairs 3,500 20.00 - - - 1.09 2E External walls 25,300 143.68 92 275.00 0.520 7.91 2F Windows and external doors 9,900 56.22 18 550.00 0.100 3.09 2G Internal walls and partitions 15,300 86.89 281 54.31 - 4.78 2H Internal doors 9,700 55.09 15 644.73 3.03
2 SUPERSTRUCTURE 107,400 610.07 33.56
3A Wall finishes 9,100 51.68 477 19.10 2.84 3B Floor finishes 8,000 45.43 172 46.50 2.50 3C Ceiling finishes 6,200 35.21 172 36.24 1.94
3 INTERNAL FINISHES 23,300 132.32 7.28
4 FITTINGS & FURNISHINGS 11,200 63.61 3.50
5A Sanitary appliances 35,000 198.77 - - - 10.94 5C Disposal installations 2,600 15.00 - - - 0.81 5N BWIC 7,600 43.16 - - - 2.38 5O Profit and attendances 3,800 21.58 - - - 1.19
BUILDING SERVICES 49,000 278.51 15.32
5B Services equipment - - 0.00 5D Water installations 29,500 167.29 9.22 5E Heat source 1,000 5.72 0.31 5F Space heating/air treatment 8,000 45.54 2.50 5G Ventilation system 11,800 67.01 3.69 5H Electrical installations 30,300 172.07 9.47 5I Gas installations 1,600 8.82 0.50 5J Lifts and conveyors 6,800 38.76 2.13 5K Protective installations 4,400 24.82 1.38 5L Communication installations 11,300 64.20 3.53 5M Special installations 9,200 52.31 2.88
M&E SERVICES 113,900 646.53 35.61
BUILDING & ENGINEERING 319,900 1,816.80 100.00
7 Preliminaries 48,000 272.60 15.00 8A Design risk 16,000 90.87 5.00 8B Employers variation risk - - 0.00 8C BREEAM allowance 9,600 54.52 3.00
TOTAL 73,600 417.99
TOTAL COST £ 393,500 £ 2,234.75 /m2
Building £ 253,400 £ 1,439.10 /m2
Engineering £ 140,100 £ 795.65 /m2

Healthcare Premises Cost Guides
50
HBN 07-01 – ‘Satellite dialysis unit’ (overall space)
HBN 07-01 - 'Satellite dialysis unit' (18 stations) Jul-10
Index level : 480 MIPS(FP) Gross internal area : 1035 m2
COST OF RATE ELEMENTAL DATA QUANTITY ELEMENTAL ELEMENT ELEMENT Quantity Rate FACTOR PERCENTAGE
£ £/m2 £ %
1 SUBSTRUCTURE 89,100 86.09 507 175.74 0.490 4.15
2A Frame 119,000 114.98 1,035 115.00 1.000 5.542B Upper floors 32,300 31.21 497 65.00 0.480 1.502C Roof 105,600 102.03 621 170.00 0.600 4.922D Stairs 20,700 20.00 - - - 0.962E External walls 148,000 143.00 538 275.00 0.520 6.892F Windows and external doors 56,700 54.78 103 550.00 0.100 2.642G Internal walls and partitions 135,900 131.31 1,603 84.80 - 6.332H Internal doors 51,100 49.37 80 640.06 2.38
2 SUPERSTRUCTURE 669,300 646.68 31.16
3A Wall finishes 89,400 86.38 2,430 36.77 4.163B Floor finishes 53,100 51.31 1,031 51.49 2.473C Ceiling finishes 37,400 36.14 1,031 36.24 1.74
3 INTERNAL FINISHES 179,900 173.83 8.37
4 FITTINGS & FURNISHINGS 44,500 43.00 2.07
5A Sanitary appliances 122,000 117.88 - - - 5.685C Disposal installations 15,500 15.00 - - - 0.725N BWIC 54,100 52.27 - - - 2.525O Profit and attendances 27,100 26.18 - - - 1.26
BUILDING SERVICES 218,700 211.33 10.18
5B Services equipment - - 0.005D Water installations 338,200 326.76 15.755E Heat source 5,700 5.53 0.275F Space heating/air treatment 47,600 46.01 2.225G Ventilation system 101,100 97.65 4.715H Electrical installations 241,000 232.84 11.235I Gas installations 9,000 8.73 0.425J Lifts and conveyors 40,100 38.76 1.875K Protective installations 25,700 24.82 1.205L Communication installations 66,400 64.20 3.095M Special installations 70,600 68.24 3.29
M&E SERVICES 945,400 913.53 44.05
BUILDING & ENGINEERING 2,146,900 2,074.46 100.00
7 Preliminaries 322,000 311.12 15.008A Design risk 107,400 103.77 5.008B Employers variation risk - - 0.008C BREEAM allowance 64,400 62.22 3.00
TOTAL 493,800 477.11
TOTAL COST £ 2,640,700 £ 2,551.46 /m2
Building £ 1,477,800 £ 1,427.86 /m2
Engineering £ 1,162,900 £ 1,123.60 /m2

Appendix 6 – Elemental cost plans
51
HBN 09-02 – ‘Maternity care facilities’ (public space)
HBN 09-02 - 'Maternity care facilities' (midwife-led unit, 500 births) Jul-10
Index level : 480 MIPS(FP) Gross internal area : 75 m2
COST OF RATE ELEMENTAL DATA QUANTITY ELEMENTAL ELEMENT ELEMENT Quantity Rate FACTOR PERCENTAGE
£ £/m2 £ %
1 SUBSTRUCTURE 6,500 86.94 37 175.74 0.490 4.5
2A Frame 8,600 115.03 75 115.00 1.000 5.96 2B Upper floors 2,300 30.76 36 65.00 0.480 1.59 2C Roof 7,700 102.99 45 170.00 0.600 5.33
### 2D Stairs 2,200 30.00 - - - 1.52 2E External walls 10,700 143.12 39 275.00 0.520 7.41 2F Windows and external doors 3,900 52.17 7 550.00 0.100 2.70 2G Internal walls and partitions 9,200 123.06 157 58.44 - 6.37 2H Internal doors 5,900 78.92 9 625.78 4.09
2 SUPERSTRUCTURE 50,500 676.05 34.97
3A Wall finishes 6,000 80.25 232 25.88 4.16 3B Floor finishes 3,700 49.49 72 51.14 2.56 3C Ceiling finishes 2,600 34.78 72 36.24 1.80
3 INTERNAL FINISHES 12,300 164.52 8.52
4 FITTINGS & FURNISHINGS 4,700 62.87 3.25
5A Sanitary appliances 19,500 260.83 - - - 13.50 5C Disposal installations 1,100 15.00 - - - 0.76 5N BWIC 3,300 44.14 - - - 2.29 5O Profit and attendances 1,700 22.74 - - - 1.18
BUILDING SERVICES 25,600 342.71 17.73
5B Services equipment - - 0.00 5D Water installations 8,200 109.05 5.68 5E Heat source 300 4.33 0.21 5F Space heating/air treatment 2,100 28.25 1.45 5G Ventilation system 7,400 98.40 5.12 5H Electrical installations 12,800 171.72 8.86 5I Gas installations 600 7.95 0.42 5J Lifts and conveyors 2,800 37.26 1.94 5K Protective installations 1,900 24.82 1.32 5L Communication installations 4,800 64.20 3.32 5M Special installations 3,900 52.31 2.70
M&E SERVICES 44,800 598.29 31.02
BUILDING & ENGINEERING 144,400 1,931.38 100.00
7 Preliminaries 21,600 288.92 15.00 8A Design risk 7,200 96.31 5.00 8B Employers variation risk - - 0.00 8C BREEAM allowance 4,300 57.52 3.00
TOTAL 33,100 442.74
TOTAL COST £ 177,500 £ 2,374.19 /m2
Building £ 122,500 £ 1,638.53 /m2
Engineering £ 55,000 £ 735.67 /m2

Healthcare Premises Cost Guides
52
HBN 09-02 – ‘Maternity care facilities’ (clinical space)
HBN 09-02 - 'Maternity care facilities' (midwife-led unit, 500 births) Jul-10
Index level : 480 MIPS(FP) Gross internal area : 502 m2
COST OF RATE ELEMENTAL DATA QUANTITY ELEMENTAL ELEMENT ELEMENT Quantity Rate FACTOR PERCENTAGE
£ £/m2 £ %
1 SUBSTRUCTURE 43,200 86.04 246 175.74 0.490 4.2
2A Frame 57,700 114.92 502 115.00 1.000 5.622B Upper floors 15,700 31.27 241 65.00 0.480 1.532C Roof 51,200 101.98 301 170.00 0.600 4.982D Stairs 15,100 30.00 - - - 1.472E External walls 71,800 143.00 261 275.00 0.520 6.992F Windows and external doors 27,500 54.77 50 550.00 0.100 2.682G Internal walls and partitions 35,300 70.31 649 54.36 - 3.442H Internal doors 19,600 39.04 30 642.57 1.91
2 SUPERSTRUCTURE 293,900 585.29 28.62
3A Wall finishes 48,500 96.60 1,189 40.81 4.723B Floor finishes 27,400 54.57 481 57.06 2.673C Ceiling finishes 17,400 34.66 481 36.24 1.69
3 INTERNAL FINISHES 93,300 185.83 9.08
4 FITTINGS & FURNISHINGS 26,400 52.58 2.57
5A Sanitary appliances 119,200 237.41 - - - 11.605C Disposal installations 7,500 15.00 - - - 0.735N BWIC 26,500 52.78 - - - 2.585O Profit and attendances 13,300 26.49 - - - 1.29
BUILDING SERVICES 166,500 331.68 16.20
5B Services equipment - - 0.005D Water installations 64,100 127.65 6.245E Heat source 3,100 6.20 0.305F Space heating/air treatment 20,900 41.56 2.035G Ventilation system 79,700 158.75 7.765H Electrical installations 111,900 222.81 10.895I Gas installations 4,400 8.79 0.435J Lifts and conveyors 18,700 37.26 1.825K Protective installations 12,500 24.82 1.225L Communication installations 32,200 64.20 3.135M Special installations 56,600 112.65 5.51
M&E SERVICES 404,100 804.68 39.33
BUILDING & ENGINEERING 1,027,400 2,046.10 100.00
7 Preliminaries 154,100 306.92 15.008A Design risk 51,400 102.37 5.008B Employers variation risk - - 0.008C BREEAM allowance 30,800 61.34 3.00
TOTAL 236,300 470.64
TOTAL COST £ 1,263,700 £ 2,516.91 /m2
Building £ 766,700 £ 1,527.04 /m2
Engineering £ 497,000 £ 989.87 /m2

Appendix 6 – Elemental cost plans
53
HBN 09-02 – ‘Maternity care facilities’ (staff space)
HBN 09-02 - 'Maternity care facilities' (midwife-led unit, 500 births) Jul-10
Index level : 480 MIPS(FP) Gross internal area : 52 m2
COST OF RATE ELEMENTAL DATA QUANTITY ELEMENTAL ELEMENT ELEMENT Quantity Rate FACTOR PERCENTAGE
£ £/m2 £ %
1 SUBSTRUCTURE 4,600 88.26 26 175.74 0.490 5.15
2A Frame 6,000 115.12 52 115.00 1.000 6.71 2B Upper floors 1,600 30.70 25 65.00 0.480 1.79 2C Roof 5,300 101.69 31 170.00 0.600 5.93
### 2D Stairs 1,600 30.00 - - - 1.79 2E External walls 7,400 141.98 27 275.00 0.520 8.28 2F Windows and external doors 2,800 53.72 5 550.00 0.100 3.13 2G Internal walls and partitions 4,300 82.50 78 54.30 - 4.81 2H Internal doors 2,700 51.80 4 631.57 3.02
2 SUPERSTRUCTURE 31,700 607.51 35.46
3A Wall finishes 2,600 49.88 136 19.04 2.91 3B Floor finishes 2,600 49.88 50 52.01 2.91 3C Ceiling finishes 1,800 34.54 50 36.24 2.01
3 INTERNAL FINISHES 7,000 134.30 7.83
4 FITTINGS & FURNISHINGS 4,400 84.42 4.92
5A Sanitary appliances 11,400 218.72 - - - 12.75 5C Disposal installations 800 15.00 - - - 0.89 5N BWIC 1,900 36.45 - - - 2.13 5O Profit and attendances 1,000 19.19 - - - 1.12
BUILDING SERVICES 15,100 289.36 16.89
5B Services equipment - - 0.00 5D Water installations 2,600 49.95 2.91 5E Heat source 200 3.68 0.22 5F Space heating/air treatment 1,300 24.03 1.45 5G Ventilation system 3,900 74.25 4.36 5H Electrical installations 9,000 171.72 10.07 5I Gas installations 400 7.66 0.45 5J Lifts and conveyors 1,900 37.26 2.13 5K Protective installations 1,300 24.82 1.45 5L Communication installations 3,300 64.20 3.69 5M Special installations 2,700 52.31 3.02
M&E SERVICES 26,600 509.88 29.75
BUILDING & ENGINEERING 89,400 1,713.73 100.00
7 Preliminaries 13,400 257.10 15.00 8A Design risk 4,400 84.42 5.00 8B Employers variation risk - - 0.00 8C BREEAM allowance 2,700 51.80 3.00
TOTAL 20,500 393.32
TOTAL COST £ 109,900 £ 2,108.57 /m2
Building £ 77,200 £ 1,481.18 /m2
Engineering £ 32,700 £ 627.39 /m2

Healthcare Premises Cost Guides
54
HBN 09-02 – ‘Maternity care facilities’ (overall space)
HBN 09-02 - 'Maternity care facilities' (midwife-led unit, 500 births) Jul-10
Index level : 480 MIPS(FP) Gross internal area : 629 m2
COST OF RATE ELEMENTAL DATA QUANTITY ELEMENTAL ELEMENT ELEMENT Quantity Rate FACTOR PERCENTAGE
£ £/m2 £ %
1 SUBSTRUCTURE 54,100 86.01 308 175.74 0.490 4.3
2A Frame 72,300 114.95 629 115.00 1.000 5.742B Upper floors 19,600 31.16 302 65.00 0.480 1.562C Roof 64,100 101.91 377 170.00 0.600 5.092D Stairs 18,900 30.00 - - - 1.502E External walls 89,900 142.93 327 275.00 0.520 7.142F Windows and external doors 34,700 55.17 63 550.00 0.100 2.762G Internal walls and partitions 48,800 77.59 887 55.04 - 3.882H Internal doors 28,200 44.84 44 637.90 2.24
2 SUPERSTRUCTURE 376,500 598.55 29.91
3A Wall finishes 57,100 90.78 1,556 36.71 4.533B Floor finishes 33,700 53.58 603 55.88 2.683C Ceiling finishes 21,800 34.66 603 36.24 1.73
3 INTERNAL FINISHES 112,600 179.02 8.94
4 FITTINGS & FURNISHINGS 35,500 56.44 2.82
5A Sanitary appliances 150,100 238.65 - - - 11.925C Disposal installations 9,400 15.00 - - - 0.755N BWIC 31,700 50.40 - - - 2.525O Profit and attendances 15,900 25.28 - - - 1.26
BUILDING SERVICES 207,100 329.33 16.45
5B Services equipment 74,500 118.40 5.925D Water installations 3,600 5.74 0.295E Heat source 24,100 38.35 1.915F Space heating/air treatment 90,400 143.75 7.185G Ventilation system 133,300 211.94 10.595H Electrical installations 5,400 8.58 0.435I Gas installations 23,400 37.26 1.865J Lifts and conveyors 15,600 24.82 1.245K Protective installations 40,400 64.20 3.215L Communication installations 62,800 99.82 4.995M Special installations - - 0.00
M&E SERVICES 473,500 752.86 37.62
BUILDING & ENGINEERING 1,259,300 2,002.21 100.00
7 Preliminaries 188,900 300.33 15.008A Design risk 63,000 100.16 5.008B Employers variation risk - - 0.008C BREEAM allowance 37,800 60.10 3.00
TOTAL 289,700 460.60
TOTAL COST £ 1,549,000 £ 2,462.77 /m2
Building £ 966,600 £ 1,536.81 /m2
Engineering £ 582,400 £ 925.96 /m2
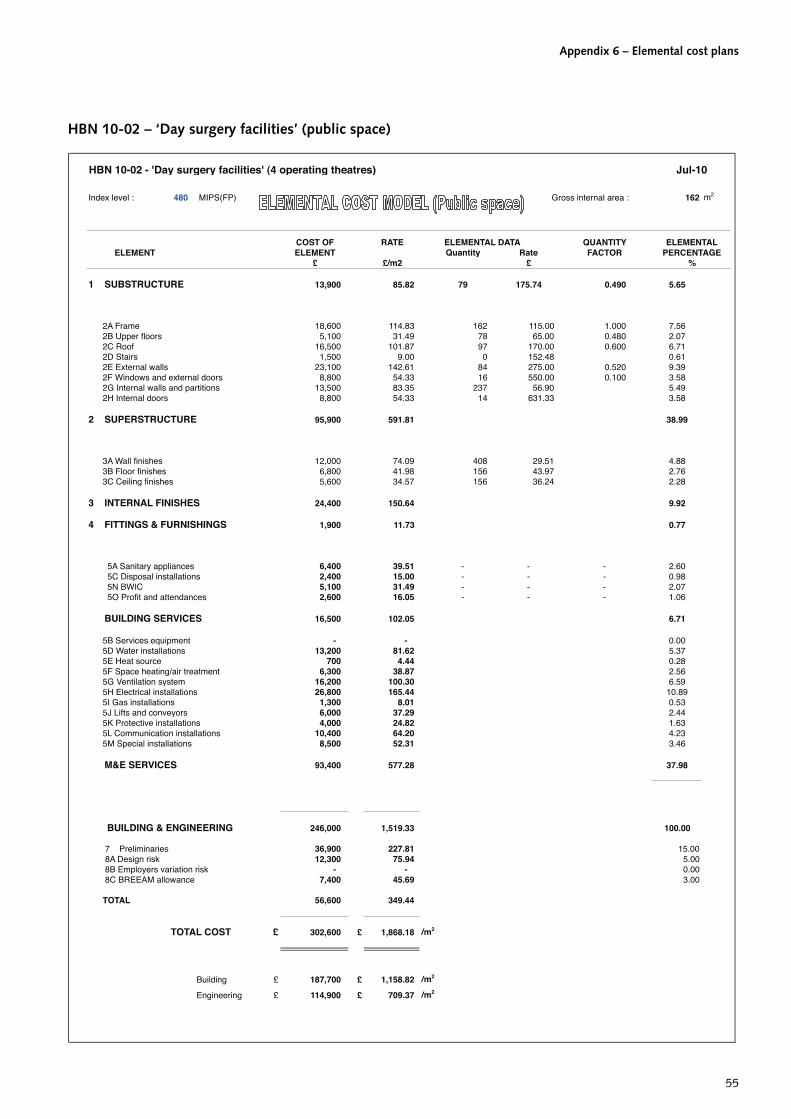
Appendix 6 – Elemental cost plans
55
HBN 10-02 – ‘Day surgery facilities’ (public space)
HBN 10-02 - 'Day surgery facilities' (4 operating theatres) Jul-10
Index level : 480 MIPS(FP) Gross internal area : 162 m2
COST OF RATE ELEMENTAL DATA QUANTITY ELEMENTAL ELEMENT ELEMENT Quantity Rate FACTOR PERCENTAGE
£ £/m2 £ %
1 SUBSTRUCTURE 13,900 85.82 79 175.74 0.490 5.65
2A Frame 18,600 114.83 162 115.00 1.000 7.562B Upper floors 5,100 31.49 78 65.00 0.480 2.072C Roof 16,500 101.87 97 170.00 0.600 6.712D Stairs 1,500 9.00 0 152.48 0.612E External walls 23,100 142.61 84 275.00 0.520 9.392F Windows and external doors 8,800 54.33 16 550.00 0.100 3.582G Internal walls and partitions 13,500 83.35 237 56.90 5.492H Internal doors 8,800 54.33 14 631.33 3.58
2 SUPERSTRUCTURE 95,900 591.81 38.99
3A Wall finishes 12,000 74.09 408 29.51 4.883B Floor finishes 6,800 41.98 156 43.97 2.763C Ceiling finishes 5,600 34.57 156 36.24 2.28
3 INTERNAL FINISHES 24,400 150.64 9.92
4 FITTINGS & FURNISHINGS 1,900 11.73 0.77
5A Sanitary appliances 6,400 39.51 - - - 2.605C Disposal installations 2,400 15.00 - - - 0.985N BWIC 5,100 31.49 - - - 2.075O Profit and attendances 2,600 16.05 - - - 1.06
BUILDING SERVICES 16,500 102.05 6.71
5B Services equipment - - 0.005D Water installations 13,200 81.62 5.375E Heat source 700 4.44 0.285F Space heating/air treatment 6,300 38.87 2.565G Ventilation system 16,200 100.30 6.595H Electrical installations 26,800 165.44 10.895I Gas installations 1,300 8.01 0.535J Lifts and conveyors 6,000 37.29 2.445K Protective installations 4,000 24.82 1.635L Communication installations 10,400 64.20 4.235M Special installations 8,500 52.31 3.46
M&E SERVICES 93,400 577.28 37.98
BUILDING & ENGINEERING 246,000 1,519.33 100.00
7 Preliminaries 36,900 227.81 15.008A Design risk 12,300 75.94 5.008B Employers variation risk - - 0.008C BREEAM allowance 7,400 45.69 3.00
TOTAL 56,600 349.44
TOTAL COST £ 302,600 £ 1,868.18 /m2
Building £ 187,700 £ 1,158.82 /m2
Engineering £ 114,900 £ 709.37 /m2

Healthcare Premises Cost Guides
56
HBN 10-02 – ‘Day surgery facilities’ (clinical space)
HBN 10-02 - 'Day surgery facilities' (4 operating theatres) Jul-10
Index level : 480 MIPS(FP) Gross internal area : 2330 m2
COST OF RATE ELEMENTAL DATA QUANTITY ELEMENTAL ELEMENT ELEMENT Quantity Rate FACTOR PERCENTAGE
£ £/m2 £ %
1 SUBSTRUCTURE 200,700 86.14 1142 175.74 0.490 3.79
2A Frame 268,000 115.02 2,330 115.00 1.000 5.062B Upper floors 72,700 31.20 1,118 65.00 0.480 1.372C Roof 237,700 102.02 1,398 170.00 0.600 4.492D Stairs 21,000 9.00 0 152.48 0.402E External walls 333,300 143.05 1,212 275.00 0.520 6.302F Windows and external doors 128,200 55.02 233 550.00 0.100 2.422G Internal walls and partitions 151,800 65.15 2,793 54.36 2.872H Internal doors 85,000 36.48 132 644.69 1.61
2 SUPERSTRUCTURE 1,297,700 556.94 24.52
3A Wall finishes 241,800 103.78 5,337 45.31 4.573B Floor finishes 124,000 53.22 2,182 56.82 2.343C Ceiling finishes 89,300 38.33 2,182 40.93 1.69
3 INTERNAL FINISHES 455,100 195.33 8.60
4 FITTINGS & FURNISHINGS 94,700 40.64 1.79
5A Sanitary appliances 43,100 18.50 - - - 0.815C Disposal installations 34,900 15.00 - - - 0.665N BWIC 150,900 64.76 - - - 2.855O Profit and attendances 75,500 32.40 - - - 1.43
BUILDING SERVICES 304,400 130.66 5.75
5B Services equipment - - 0.005D Water installations 127,700 54.83 2.415E Heat source 15,500 6.64 0.295F Space heating/air treatment 125,900 54.04 2.385G Ventilation system 1,231,100 528.36 23.265H Electrical installations 751,700 322.62 14.205I Gas installations 20,900 8.99 0.395J Lifts and conveyors 86,900 37.29 1.645K Protective installations 57,800 24.82 1.095L Communication installations 149,600 64.20 2.835M Special installations 372,800 160.01 7.04
M&E SERVICES 2,939,900 1,261.79 55.53
BUILDING & ENGINEERING 5,292,500 2,271.50 100.00
7 Preliminaries 793,900 340.73 15.008A Design risk 264,600 113.56 5.008B Employers variation risk - - 0.008C BREEAM allowance 158,800 68.15 3.00
TOTAL 1,217,300 522.45
TOTAL COST £ 6,509,800 £ 2,793.91 /m2
Building £ 2,893,700 £ 1,241.93 /m2
Engineering £ 3,616,100 £ 1,551.98 /m2

Appendix 6 – Elemental cost plans
57
HBN 10-02 – ‘Day surgery facilities’ (staff space)
HBN 10-02 - 'Day surgery facilities' (4 operating theatres) Jul-10
Index level : 480 MIPS(FP) Gross internal area : 161 m2
COST OF RATE ELEMENTAL DATA QUANTITY ELEMENTAL ELEMENT ELEMENT Quantity Rate FACTOR PERCENTAGE
£ £/m2 £ %
1 SUBSTRUCTURE 13,900 86.54 79 175.74 0.490 6.22
2A Frame 18,500 115.18 161 115.00 1.000 8.282B Upper floors 5,000 31.13 77 65.00 0.480 2.242C Roof 16,300 101.48 96 170.00 0.600 7.302D Stairs 1,400 9.00 0 152.48 0.632E External walls 23,100 143.82 84 275.00 0.520 10.342F Windows and external doors 8,800 54.79 16 550.00 0.100 3.942G Internal walls and partitions 17,300 107.71 319 54.25 7.752H Internal doors 8,700 54.17 14 628.92 3.90
2 SUPERSTRUCTURE 99,100 617.28 44.38
3A Wall finishes 7,600 47.32 520 14.58 3.403B Floor finishes 9,200 57.28 204 45.24 4.123C Ceiling finishes 7,400 46.07 204 36.24 3.31
3 INTERNAL FINISHES 24,200 150.67 10.83
4 FITTINGS & FURNISHINGS 4,400 27.39 1.97
5A Sanitary appliances 3,300 20.55 - - - 1.485C Disposal installations 2,400 15.00 - - - 1.075N BWIC 3,800 23.66 - - - 1.705O Profit and attendances 1,900 11.83 - - - 0.85
BUILDING SERVICES 11,400 71.04 5.10
5B Services equipment - - 0.005D Water installations 1,000 6.52 0.455E Heat source 500 2.89 0.225F Space heating/air treatment 3,900 24.50 1.755G Ventilation system 8,400 52.54 3.765H Electrical installations 26,600 165.44 11.915I Gas installations 1,200 7.32 0.545J Lifts and conveyors 6,000 37.29 2.695K Protective installations 4,000 24.82 1.795L Communication installations 10,300 64.20 4.615M Special installations 8,400 52.31 3.76
M&E SERVICES 70,300 437.82 31.48
BUILDING & ENGINEERING 223,300 1,390.74 100.00
7 Preliminaries 33,500 208.57 15.008A Design risk 11,200 69.73 5.008B Employers variation risk - - 0.008C BREEAM allowance 6,700 41.71 3.00
TOTAL 51,400 320.01
TOTAL COST £ 274,700 £ 1,710.27 /m2
Building £ 188,300 £ 1,172.35 /m2
Engineering £ 86,400 £ 537.92 /m2

Healthcare Premises Cost Guides
58
HBN 10-02 – ‘Day surgery facilities’ (overall space)
HBN 10-02 - 'Day surgery facilities' (4 operating theatres) Jul-10
Index level : 480 MIPS(FP) Gross internal area : 2653 m2
COST OF RATE ELEMENTAL DATA QUANTITY ELEMENTAL ELEMENT ELEMENT Quantity Rate FACTOR PERCENTAGE
£ £/m2 £ %
1 SUBSTRUCTURE 228,500 86.14 1300 175.74 0.490 3.98
2A Frame 305,100 115.02 2,653 115.00 1.000 5.32 2B Upper floors 82,700 31.18 1,273 65.00 0.480 1.44 2C Roof 270,600 102.01 1,592 170.00 0.600 4.72
### 2D Stairs 23,900 9.00 0 152.48 0.42 2E External walls 379,200 142.95 1,379 275.00 0.520 6.61 2F Windows and external doors 145,800 54.97 265 550.00 0.100 2.54 2G Internal walls and partitions 183,800 69.29 3,371 54.53 3.21 2H Internal doors 102,600 38.68 160 642.15 1.79
2 SUPERSTRUCTURE 1,493,700 563.10 26.05
3A Wall finishes 261,600 98.62 6,265 41.76 2.362 4.56 3B Floor finishes 139,300 52.51 2,542 54.81 0.958 2.43 3C Ceiling finishes 102,000 38.45 2,542 40.15 0.958 1.78
3 INTERNAL FINISHES 502,900 189.58 8.77
4 FITTINGS & FURNISHINGS 101,000 38.08 1.76
5A Sanitary appliances 52,800 19.91 - - - 0.92 5C Disposal installations 39,800 15.00 - - - 0.69 5N BWIC 158,500 59.75 - - - 2.76 5O Profit and attendances 79,300 29.90 - - - 1.38
BUILDING SERVICES 330,400 124.56 5.75
5B Services equipment - - 0.00 5D Water installations 141,200 53.21 2.46 5E Heat source 16,500 6.24 0.29 5F Space heating/air treatment 135,300 51.01 2.36 5G Ventilation system 1,240,500 467.66 21.63 5H Electrical installations 799,900 301.54 13.95 5I Gas installations 23,400 8.81 0.41 5J Lifts and conveyors 98,900 37.29 1.72 5K Protective installations 65,800 24.82 1.15 5L Communication installations 170,300 64.20 2.97 5M Special installations 386,100 145.57 6.73
M&E SERVICES 3,077,900 1,160.35 53.67
BUILDING & ENGINEERING 5,734,400 2,161.81 100.00
7 Preliminaries 860,200 324.29 15.00 8A Design risk 286,700 108.08 5.00 8B Employers variation risk - - 0.00 8C BREEAM allowance 172,000 64.84 3.00
TOTAL 1,318,900 497.21
TOTAL COST £ 7,053,300 £ 2,659.03 /m2
Building £ 3,267,500 £ 1,231.82 /m2
Engineering £ 3,785,800 £ 1,427.21 /m2

Appendix 6 – Elemental cost plans
59
HBN 12 – ‘Out-patients department’ (public space)
HBN 12 - 'Out-patients department' (6, 8 and 12 consulting/examination rooms) Jul-10
Index level : 480 MIPS(FP) Gross internal area : 318 m2
COST OF RATE ELEMENTAL DATA QUANTITY ELEMENTAL ELEMENT ELEMENT Quantity Rate FACTOR PERCENTAGE
£ £/m2 £ %
1 SUBSTRUCTURE 27,400 86.22 156 175.74 0.490 6.26
2A Frame 36,600 115.17 318 115.00 1.000 8.36 2B Upper floors 9,900 31.15 153 65.00 0.480 2.26 2C Roof 32,500 102.27 191 170.00 0.600 7.43
### 2D Stairs 7,600 24.00 0 152.48 1.74 2E External walls 45,400 142.86 165 275.00 0.520 10.37 2F Windows and external doors 17,600 55.38 32 550.00 0.100 4.02 2G Internal walls and partitions 22,300 70.17 369 60.31 5.09 2H Internal doors 13,300 41.85 21 640.41 3.04
2 SUPERSTRUCTURE 185,200 582.85 42.31
3A Wall finishes 19,800 62.30 720 27.46 4.52 3B Floor finishes 14,800 46.57 286 51.83 3.38 3C Ceiling finishes 10,400 32.73 286 36.24 2.38
3 INTERNAL FINISHES 45,000 141.60 10.28
4 FITTINGS & FURNISHINGS 10,800 33.98 2.47
5A Sanitary appliances 5,300 16.68 - - - 1.21 5C Disposal installations 4,800 15.00 - - - 1.10 5N BWIC 7,900 24.86 - - - 1.80 5O Profit and attendances 4,000 12.59 - - - 0.91
BUILDING SERVICES 22,000 69.13 5.02
5B Services equipment - 0.00 5D Water installations 17,700 55.57 4.04 5E Heat source 900 2.96 0.21 5F Space heating/air treatment 6,100 19.30 1.39 5G Ventilation system 9,000 28.20 2.06 5H Electrical installations 54,200 170.55 12.38 5I Gas installations 2,400 7.49 0.55 5J Lifts and conveyors 12,100 38.21 2.76 5K Protective installations 7,900 24.82 1.80 5L Communication installations 20,400 64.20 4.66 5M Special installations 16,600 52.31 3.79
M&E SERVICES 147,300 463.60 33.64
BUILDING & ENGINEERING 437,700 1,377.38 100.00
7 Preliminaries 65,700 206.74 15.00 8A Design risk 21,900 68.91 5.00 8B Employers variation risk - - 0.00 8C BREEAM allowance 13,100 41.22 3.00
TOTAL 100,700 316.87
TOTAL COST £ 538,400 £ 1,694.18 /m2
Building £ 357,200 £ 1,518.52 /m2
Engineering £ 181,200 £ 765.69 /m2

Healthcare Premises Cost Guides
60
HBN 12 – ‘Out-patients department’ (clinical space)
HBN 12 - 'Out-patients department' (6, 8 and 12 consulting/examination rooms) Jul-10
Index level : 480 MIPS(FP) Gross internal area : 631 m2
COST OF RATE ELEMENTAL DATA QUANTITY ELEMENTAL ELEMENT ELEMENT Quantity Rate FACTOR PERCENTAGE
£ £/m2 £ %
1 SUBSTRUCTURE 54,300 86.03 309 175.74 0.490 4.82
2A Frame 72,600 115.03 631 115.00 1.000 6.44 2B Upper floors 19,700 31.21 303 65.00 0.480 1.75 2C Roof 64,400 102.03 379 170.00 0.600 5.71
### 2D Stairs 15,100 24.00 0 152.48 1.34 2E External walls 90,200 142.91 328 275.00 0.520 8.00 2F Windows and external doors 34,700 54.98 63 550.00 0.100 3.08 2G Internal walls and partitions 45,200 71.61 850 53.17 4.01 2H Internal doors 23,400 37.07 36 645.49 2.08
2 SUPERSTRUCTURE 365,300 578.84 32.41
3A Wall finishes 72,200 114.39 1,790 40.37 6.41 3B Floor finishes 35,300 55.93 604 58.37 3.13 3C Ceiling finishes 21,900 34.70 604 36.24 1.94
3 INTERNAL FINISHES 129,400 205.02 11.48
4 FITTINGS & FURNISHINGS 17,400 27.57 1.54
5A Sanitary appliances 12,600 19.96 - - - 1.12 5C Disposal installations 9,500 15.00 - - - 0.84 5N BWIC 26,100 41.35 - - - 2.32 5O Profit and attendances 13,100 20.76 - - - 1.16
BUILDING SERVICES 61,300 97.07 5.44
5B Services equipment - 0.00 5D Water installations 45,600 72.27 4.05 5E Heat source 3,300 5.23 0.29 5F Space heating/air treatment 24,400 38.59 2.17 5G Ventilation system 77,400 122.61 6.87 5H Electrical installations 208,000 329.62 18.46 5I Gas installations 5,400 8.51 0.48 5J Lifts and conveyors 24,100 38.21 2.14 5K Protective installations 15,700 24.82 1.39 5L Communication installations 40,500 64.20 3.59 5M Special installations 54,800 86.87 4.86
M&E SERVICES 499,200 790.92 44.30
BUILDING & ENGINEERING 1,126,900 1,785.45 100.00
7 Preliminaries 169,100 267.92 15.00 8A Design risk 56,400 89.36 5.00 8B Employers variation risk - - 0.00 8C BREEAM allowance 33,800 53.55 3.00
TOTAL 259,300 410.83
TOTAL COST £ 1,386,200 £ 2,196.28 /m2
Building £ 772,100 £ 1,518.52 /m2
Engineering £ 614,100 £ 765.69 /m2

Appendix 6 – Elemental cost plans
61
HBN 12 – ‘Out-patients department’ (staff space)
HBN 12 - 'Out-patients department' (6, 8 and 12 consulting/examination rooms) Jul-10
Index level : 480 MIPS(FP) Gross internal area : 153 m2
COST OF RATE ELEMENTAL DATA QUANTITY ELEMENTAL ELEMENT ELEMENT Quantity Rate FACTOR PERCENTAGE
£ £/m2 £ %
1 SUBSTRUCTURE 13,200 86.48 75 175.74 0.490 5.04
2A Frame 17,600 115.31 153 115.00 1.000 6.71 2B Upper floors 4,700 30.79 73 65.00 0.480 1.79 2C Roof 15,600 102.21 92 170.00 0.600 5.95
### 2D Stairs 3,700 24.00 0 152.48 1.41 2E External walls 21,700 142.17 79 275.00 0.520 8.28 2F Windows and external doors 8,300 54.38 15 550.00 0.100 3.17 2G Internal walls and partitions 16,200 106.14 237 68.23 6.18 2H Internal doors 10,700 70.10 14 765.28 4.08
2 SUPERSTRUCTURE 98,500 645.10 37.57
3A Wall finishes 13,200 86.48 491 26.82 5.04 3B Floor finishes 7,900 51.76 146 54.03 3.01 3C Ceiling finishes 5,300 34.72 146 36.24 2.02
3 INTERNAL FINISHES 26,400 172.96 10.07
4 FITTINGS & FURNISHINGS 3,600 23.59 1.37
5A Sanitary appliances 5,800 38.00 - - - 2.21 5C Disposal installations 2,300 15.00 - - - 0.88 5N BWIC 5,600 36.69 - - - 2.14 5O Profit and attendances 2,800 18.34 - - - 1.07
BUILDING SERVICES 16,500 108.03 6.30
5B Services equipment - 0.00 5D Water installations 31,300 204.75 11.94 5E Heat source 900 5.77 0.34 5F Space heating/air treatment 5,700 37.66 2.17 5G Ventilation system 11,300 73.81 4.31 5H Electrical installations 26,000 170.55 9.92 5I Gas installations 1,300 8.75 0.50 5J Lifts and conveyors 5,800 38.21 2.21 5K Protective installations 3,800 24.82 1.45 5L Communication installations 9,800 64.20 3.74 5M Special installations 8,000 52.31 3.05
M&E SERVICES 103,900 680.82 39.63
BUILDING & ENGINEERING 262,100 1,716.98 100.00
7 Preliminaries 39,300 257.48 15.00 8A Design risk 13,100 85.83 5.00 8B Employers variation risk - - 0.00 8C BREEAM allowance 7,800 51.10 3.00
TOTAL 60,200 394.41
TOTAL COST £ 322,300 £ 2,111.63 /m2
Building £ 194,500 £ 1,518.52 /m2
Engineering £ 127,800 £ 765.69 /m2

Healthcare Premises Cost Guides
62
HBN 12 – ‘Out-patients department’ (overall space)
HBN 12 - 'Out-patients department' (6, 8 and 12 consulting/examination rooms) Jul-10
Index level : 480 MIPS(FP) Gross internal area : 1102 m2
COST OF RATE ELEMENTAL DATA QUANTITY ELEMENTAL ELEMENT ELEMENT Quantity Rate FACTOR PERCENTAGE
£ £/m2 £ %
1 SUBSTRUCTURE 94,900 86.15 540 175.74 0.490 5.22
2A Frame 126,700 115.02 1,102 115.00 1.000 6.972B Upper floors 34,400 31.23 529 65.00 0.480 1.892C Roof 112,400 102.03 661 170.00 0.600 6.192D Stairs 26,400 24.00 0 152.48 1.452E External walls 157,600 143.07 573 275.00 0.520 8.672F Windows and external doors 60,500 54.92 110 550.00 0.100 3.332G Internal walls and partitions 83,300 75.62 1,451 57.42 4.582H Internal doors 47,500 43.12 71 667.59 2.61
2 SUPERSTRUCTURE 648,800 589.01 35.69
3A Wall finishes 104,900 95.23 2,991 35.07 5.773B Floor finishes 57,900 52.56 1,037 55.86 3.193C Ceiling finishes 37,600 34.13 1,037 36.24 2.07
3 INTERNAL FINISHES 200,400 181.92 11.03
4 FITTINGS & FURNISHINGS 31,700 28.78 1.74
5A Sanitary appliances 23,700 21.51 - - - 1.305C Disposal installations 16,500 15.00 - - - 0.915N BWIC 39,100 35.49 - - - 2.155O Profit and attendances 19,600 17.79 - - - 1.08
BUILDING SERVICES 98,900 89.79 5.44
5B Services equipment - 0.005D Water installations 93,900 85.22 5.175E Heat source 5,100 4.60 0.285F Space heating/air treatment 35,800 32.46 1.975G Ventilation system 95,300 86.54 5.245H Electrical installations 284,600 258.32 15.665I Gas installations 9,100 8.23 0.505J Lifts and conveyors 42,100 38.21 2.325K Protective installations 27,300 24.82 1.505L Communication installations 70,700 64.20 3.895M Special installations 78,600 71.38 4.33
M&E SERVICES 742,500 673.96 40.86
BUILDING & ENGINEERING 1,817,200 1,649.61 100.00
7 Preliminaries 272,600 247.46 15.008A Design risk 90,800 82.43 5.008B Employers variation risk - - 0.008C BREEAM allowance 54,500 49.47 3.00
TOTAL 417,900 379.36
TOTAL COST £ 2,235,100 £ 2,028.99 /m2
Building £ 1,321,800 £ 1,518.52 /m2
Engineering £ 913,300 £ 765.69 /m2

Appendix 6 – Elemental cost plans
63
HBN 22 – ‘Accident and emergency facilities for adults and children’ (public space)
HBN 22 - 'Accident and emergency facilities for adults and children' (example 2) Jul-10
Index level : 480 MIPS(FP) Gross internal area : 271 m2
COST OF RATE ELEMENTAL DATA QUANTITY ELEMENTAL ELEMENT ELEMENT Quantity Rate FACTOR PERCENTAGE
£ £/m2 £ %
1 SUBSTRUCTURE 23,400 86.28 133 175.74 0.490 5.97
2A Frame 31,200 115.04 271 115.00 1.000 7.962B Upper floors 8,500 31.34 130 65.00 0.480 2.172C Roof 27,700 102.13 163 170.00 0.600 7.062D Stairs 3,900 14.50 0 152.48 0.992E External walls 38,800 143.06 141 275.00 0.520 9.902F Windows and external doors 14,900 54.94 27 550.00 0.100 3.802G Internal walls and partitions 22,800 84.07 419 54.30 5.812H Internal doors 15,000 55.31 23 661.21 3.83
2 SUPERSTRUCTURE 162,800 600.39 41.52
3A Wall finishes 23,800 87.75 869 27.45 6.073B Floor finishes 15,400 56.78 261 59.03 3.933C Ceiling finishes 9,500 35.03 261 36.24 2.42
3 INTERNAL FINISHES 48,700 179.56 12.42
4 FITTINGS & FURNISHINGS 5,100 18.80 1.30
5A Sanitary appliances 6,300 23.23 - - - 1.615C Disposal installations 4,100 15.00 - - - 1.055N BWIC 2,200 8.11 - - - 0.565O Profit and attendances 1,100 4.06 - - - 0.28
BUILDING SERVICES 13,700 50.40 3.50
5B Services equipment - - 0.005D Water installations 17,300 63.74 4.415E Heat source 1,200 4.44 0.315F Space heating/air treatment 9,900 36.37 2.525G Ventilation system 13,400 49.32 3.425H Electrical installations 45,700 168.43 11.665I Gas installations 2,200 8.15 0.565J Lifts and conveyors 10,400 38.16 2.655K Protective installations 6,700 24.82 1.715L Communication installations 17,400 64.20 4.445M Special installations 14,200 52.31 3.62
M&E SERVICES 138,400 509.94 35.30
BUILDING & ENGINEERING 392,100 1,445.37 100.00
7 Preliminaries 58,900 217.17 15.008A Design risk 19,600 72.27 5.008B Employers variation risk - - 0.008C BREEAM allowance 11,800 43.51 3.00
TOTAL 90,300 332.94
TOTAL COST £ 482,400 £ 1,778.65 /m2
Building £ 312,100 £ 1,150.74 /m2
Engineering £ 170,300 £ 627.91 /m2

Healthcare Premises Cost Guides
64
HBN 22 – ‘Accident and emergency facilities for adults and children’ (clinical space)
HBN 22 - 'Accident and emergency facilities for adults and children' (example 2) Jul-10
Index level : 480 MIPS(FP) Gross internal area : 1122 m2
COST OF RATE ELEMENTAL DATA QUANTITY ELEMENTAL ELEMENT ELEMENT Quantity Rate FACTOR PERCENTAGE
£ £/m2 £ %
1 SUBSTRUCTURE 96,700 86.20 550 175.74 0.490 4.4
2A Frame 129,000 114.99 1,122 115.00 1.000 5.872B Upper floors 35,000 31.20 538 65.00 0.480 1.592C Roof 114,400 101.97 673 170.00 0.600 5.212D Stairs 16,300 14.50 0 152.48 0.742E External walls 160,300 142.89 583 275.00 0.520 7.292F Windows and external doors 61,600 54.91 112 550.00 0.100 2.802G Internal walls and partitions 66,200 59.01 1,218 54.35 3.012H Internal doors 35,200 31.38 52 682.89 1.60
2 SUPERSTRUCTURE 618,000 550.85 28.11
3A Wall finishes 103,100 91.90 2,647 38.96 4.693B Floor finishes 61,400 54.73 1,075 57.17 2.793C Ceiling finishes 38,900 34.67 1,075 36.24 1.77
3 INTERNAL FINISHES 203,400 181.30 9.25
4 FITTINGS & FURNISHINGS 111,600 99.48 5.08
5A Sanitary appliances 19,900 17.74 - - - 0.915C Disposal installations 16,800 15.00 - - - 0.765N BWIC 17,100 15.24 - - - 0.785O Profit and attendances 8,600 7.67 - - - 0.39
BUILDING SERVICES 62,400 55.65 2.84
5B Services equipment - - 0.005D Water installations 70,500 62.85 3.215E Heat source 7,300 6.51 0.335F Space heating/air treatment 61,100 54.50 2.785G Ventilation system 101,300 90.31 4.615H Electrical installations 452,500 403.32 20.595I Gas installations 10,200 9.07 0.465J Lifts and conveyors 42,800 38.16 1.955K Protective Installations 27,800 24.82 1.265L Communication installations 72,000 64.20 3.285M Special installations 260,100 231.85 11.84
M&E SERVICES 1,105,600 985.58 50.31
BUILDING & ENGINEERING 2,197,700 1,959.06 100.00
7 Preliminaries 329,600 293.80 15.008A Design risk 109,900 97.96 5.008B Employers variation risk - - 0.008C BREEAM allowance 66,000 58.83 3.00
TOTAL 505,500 450.59
TOTAL COST £ 2,703,200 £ 2,409.59 /m2
Building £ 1,343,300 £ 1,197.40 /m2
Engineering £ 1,359,900 £ 1,212.19 /m2
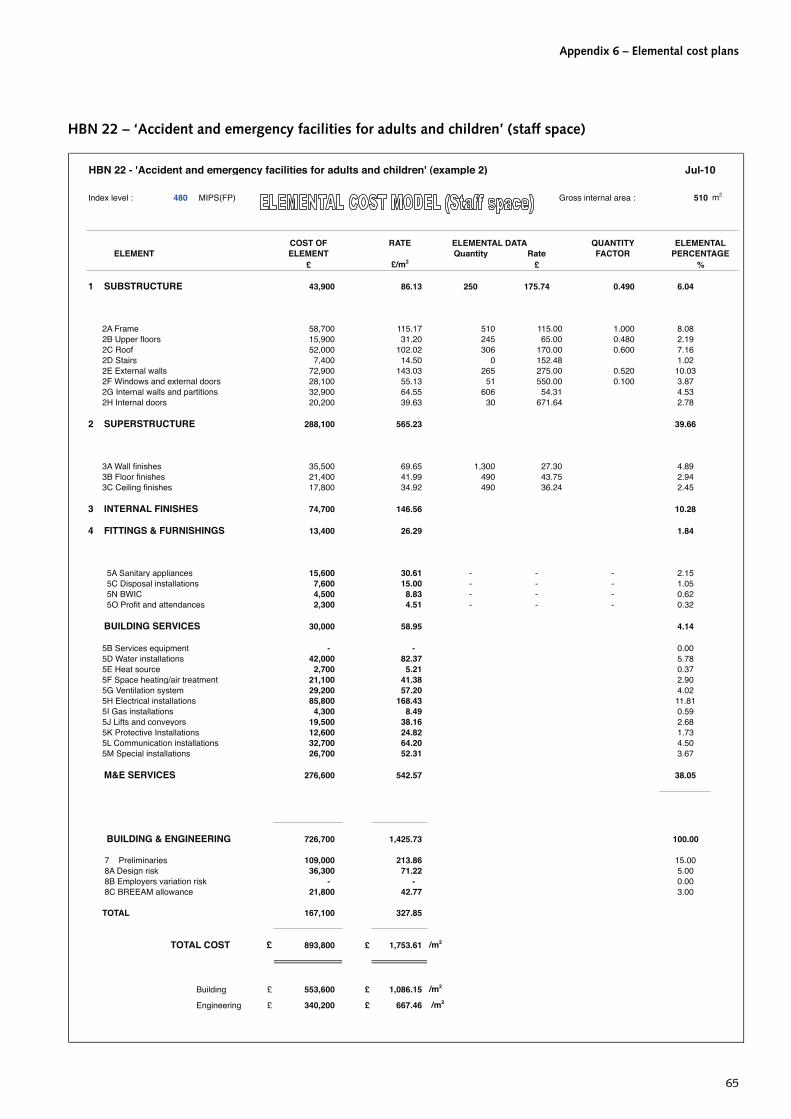
Appendix 6 – Elemental cost plans
65
HBN 22 – ‘Accident and emergency facilities for adults and children’ (staff space)
HBN 22 - 'Accident and emergency facilities for adults and children' (example 2) Jul-10
Index level : 480 MIPS(FP) Gross internal area : 510 m2
COST OF RATE ELEMENTAL DATA QUANTITY ELEMENTAL ELEMENT ELEMENT Quantity Rate FACTOR PERCENTAGE
£ £/m2 £ %
1 SUBSTRUCTURE 43,900 86.13 250 175.74 0.490 6.04
2A Frame 58,700 115.17 510 115.00 1.000 8.082B Upper floors 15,900 31.20 245 65.00 0.480 2.192C Roof 52,000 102.02 306 170.00 0.600 7.162D Stairs 7,400 14.50 0 152.48 1.022E External walls 72,900 143.03 265 275.00 0.520 10.032F Windows and external doors 28,100 55.13 51 550.00 0.100 3.872G Internal walls and partitions 32,900 64.55 606 54.31 4.532H Internal doors 20,200 39.63 30 671.64 2.78
2 SUPERSTRUCTURE 288,100 565.23 39.66
3A Wall finishes 35,500 69.65 1,300 27.30 4.893B Floor finishes 21,400 41.99 490 43.75 2.943C Ceiling finishes 17,800 34.92 490 36.24 2.45
3 INTERNAL FINISHES 74,700 146.56 10.28
4 FITTINGS & FURNISHINGS 13,400 26.29 1.84
5A Sanitary appliances 15,600 30.61 - - - 2.155C Disposal installations 7,600 15.00 - - - 1.055N BWIC 4,500 8.83 - - - 0.625O Profit and attendances 2,300 4.51 - - - 0.32
BUILDING SERVICES 30,000 58.95 4.14
5B Services equipment - - 0.005D Water installations 42,000 82.37 5.785E Heat source 2,700 5.21 0.375F Space heating/air treatment 21,100 41.38 2.905G Ventilation system 29,200 57.20 4.025H Electrical installations 85,800 168.43 11.815I Gas installations 4,300 8.49 0.595J Lifts and conveyors 19,500 38.16 2.685K Protective Installations 12,600 24.82 1.735L Communication installations 32,700 64.20 4.505M Special installations 26,700 52.31 3.67
M&E SERVICES 276,600 542.57 38.05
BUILDING & ENGINEERING 726,700 1,425.73 100.00
7 Preliminaries 109,000 213.86 15.008A Design risk 36,300 71.22 5.008B Employers variation risk - - 0.008C BREEAM allowance 21,800 42.77 3.00
TOTAL 167,100 327.85
TOTAL COST £ 893,800 £ 1,753.61 /m2
Building £ 553,600 £ 1,086.15 /m2
Engineering £ 340,200 £ 667.46 /m2
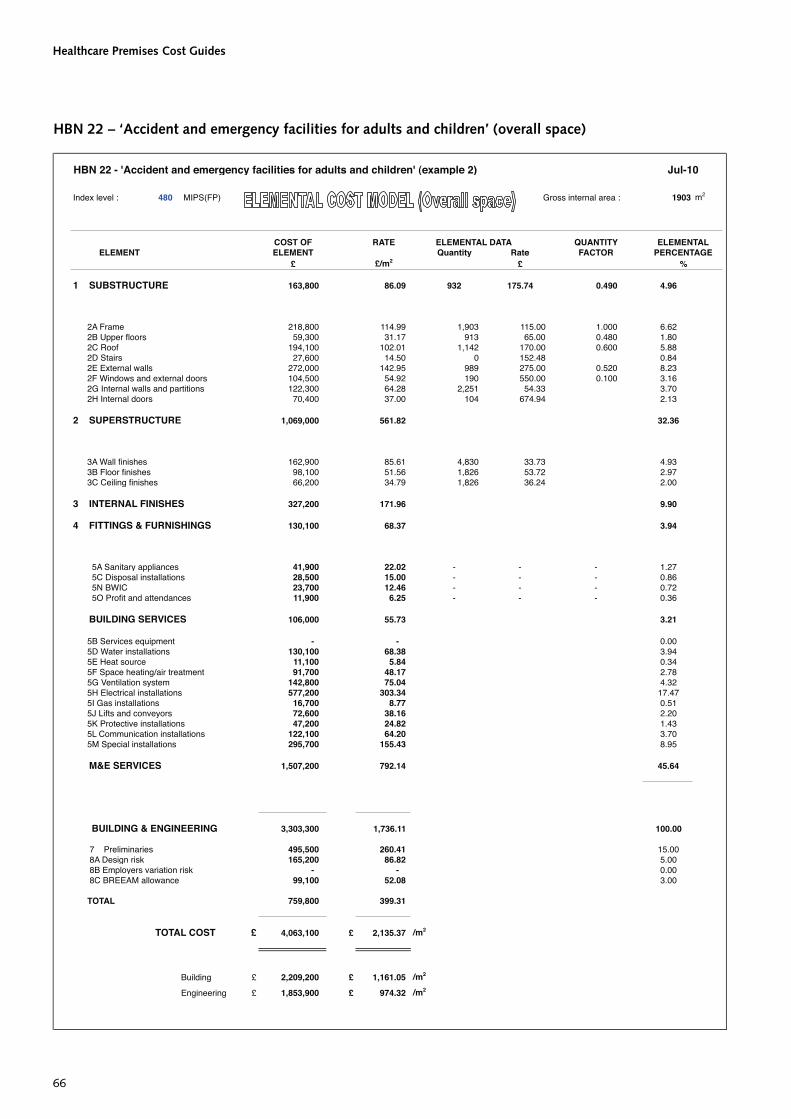
Healthcare Premises Cost Guides
66
HBN 22 – ‘Accident and emergency facilities for adults and children’ (overall space)
HBN 22 - 'Accident and emergency facilities for adults and children' (example 2) Jul-10
Index level : 480 MIPS(FP) Gross internal area : 1903 m2
COST OF RATE ELEMENTAL DATA QUANTITY ELEMENTAL ELEMENT ELEMENT Quantity Rate FACTOR PERCENTAGE
£ £/m2 £ %
1 SUBSTRUCTURE 163,800 86.09 932 175.74 0.490 4.96
2A Frame 218,800 114.99 1,903 115.00 1.000 6.622B Upper floors 59,300 31.17 913 65.00 0.480 1.802C Roof 194,100 102.01 1,142 170.00 0.600 5.882D Stairs 27,600 14.50 0 152.48 0.842E External walls 272,000 142.95 989 275.00 0.520 8.232F Windows and external doors 104,500 54.92 190 550.00 0.100 3.162G Internal walls and partitions 122,300 64.28 2,251 54.33 3.702H Internal doors 70,400 37.00 104 674.94 2.13
2 SUPERSTRUCTURE 1,069,000 561.82 32.36
3A Wall finishes 162,900 85.61 4,830 33.73 4.933B Floor finishes 98,100 51.56 1,826 53.72 2.973C Ceiling finishes 66,200 34.79 1,826 36.24 2.00
3 INTERNAL FINISHES 327,200 171.96 9.90
4 FITTINGS & FURNISHINGS 130,100 68.37 3.94
5A Sanitary appliances 41,900 22.02 - - - 1.275C Disposal installations 28,500 15.00 - - - 0.865N BWIC 23,700 12.46 - - - 0.725O Profit and attendances 11,900 6.25 - - - 0.36
BUILDING SERVICES 106,000 55.73 3.21
5B Services equipment - - 0.005D Water installations 130,100 68.38 3.945E Heat source 11,100 5.84 0.345F Space heating/air treatment 91,700 48.17 2.785G Ventilation system 142,800 75.04 4.325H Electrical installations 577,200 303.34 17.475I Gas installations 16,700 8.77 0.515J Lifts and conveyors 72,600 38.16 2.205K Protective installations 47,200 24.82 1.435L Communication installations 122,100 64.20 3.705M Special installations 295,700 155.43 8.95
M&E SERVICES 1,507,200 792.14 45.64
BUILDING & ENGINEERING 3,303,300 1,736.11 100.00
7 Preliminaries 495,500 260.41 15.008A Design risk 165,200 86.82 5.008B Employers variation risk - - 0.008C BREEAM allowance 99,100 52.08 3.00
TOTAL 759,800 399.31
TOTAL COST £ 4,063,100 £ 2,135.37 /m2
Building £ 2,209,200 £ 1,161.05 /m2
Engineering £ 1,853,900 £ 974.32 /m2

Appendix 6 – Elemental cost plans
67
HBN 26 Volume 1 – ‘Facilities for surgical procedures’ (clinical space)
HBN 26 Volume 1 - 'Facilities for surgical procedures' (example 1, 8 operating theatres) Aug-10
Index level : 480 MIPS(FP) Gross internal area : 3092 m2
COST OF RATE ELEMENTAL DATA QUANTITY ELEMENTAL ELEMENT ELEMENT Quantity Rate FACTOR PERCENTAGE
£ £/m2 £ %
1 SUBSTRUCTURE 266,200 86.09 1515 175.74 0.490 3.27
2A Frame 355,600 115.00 3,092 115.00 1.000 4.362B Upper floors 96,500 31.21 1,484 65.00 0.480 1.182C Roof 315,400 102.00 1,855 170.00 0.600 3.872D Stairs 17,800 5.75 0 152.48 0.222E External walls 442,200 143.00 1,608 275.00 0.520 5.432F Windows and external doors 170,000 54.98 309 550.00 0.100 2.092G Internal walls and partitions 179,000 57.89 3,251 55.06 2.202H Internal doors 97,100 31.40 141 686.65 1.19
2 SUPERSTRUCTURE 1,673,600 541.23 20.54
3A Wall finishes 287,100 92.84 7,083 40.53 3.523B Floor finishes 168,700 54.56 2,952 57.15 2.073C Ceiling finishes 128,500 41.56 2,952 43.53 1.58
3 INTERNAL FINISHES 584,300 188.96 7.17
4 FITTINGS & FURNISHINGS 263,700 85.28 3.24
5A Sanitary appliances 61,300 19.82 - - - 0.755C Disposal installations 46,400 15.00 - - - 0.575N BWIC 78,700 25.45 - - - 0.975O Profit and attendances 39,400 12.74 - - - 0.48
BUILDING SERVICES 225,800 73.01 2.77
5B Services equipment - 0.005D Water installations 150,800 48.77 1.855E Heat source 23,600 7.62 0.295F Space heating/air treatment 190,100 61.48 2.335G Ventilation system 2,549,000 824.32 31.285H Electrical installations 1,209,200 391.04 14.845I Gas installations 28,800 9.31 0.355J Lifts and conveyors 113,100 36.57 1.395K Protective installations 76,700 24.82 0.945L Communication installations 198,500 64.20 2.445M Special installations 596,500 192.89 7.32
M&E SERVICES 5,136,300 1,661.01 63.03
BUILDING & ENGINEERING 8,149,900 2,635.58 100.00
7 Preliminaries 1,222,400 395.31 15.008A Design risk 407,500 131.78 5.008B Employers variation risk - - 0.008C BREEAM allowance 244,500 79.07 3.00
TOTAL 1,874,400 606.16
TOTAL COST £ 10,024,300 £ 3,241.73 /m2
Building £ 3,706,700 £ 1,198.70 /m2
Engineering £ 6,317,600 £ 2,043.03 /m2

Healthcare Premises Cost Guides
68
HBN 26 Volume 1 – ‘Facilities for surgical procedures’ (staff space)
HBN 26 Volume 1 - 'Facilities for surgical procedures' (example 1, 8 operating theatres) Aug-10
Index level : 480 MIPS(FP) Gross internal area : 882 m2
COST OF RATE ELEMENTAL DATA QUANTITY ELEMENTAL ELEMENT ELEMENT Quantity Rate FACTOR PERCENTAGE
£ £/m2 £ %
1 SUBSTRUCTURE 75,900 86.09 432 175.74 0.490 6.44
2A Frame 101,400 115.02 882 115.00 1.000 8.602B Upper floors 27,500 31.19 423 65.00 0.480 2.332C Roof 89,900 101.97 529 170.00 0.600 7.622D Stairs 5,100 5.75 0 152.48 0.432E External walls 126,000 142.92 458 275.00 0.520 10.692F Windows and external doors 48,400 54.90 88 550.00 0.100 4.102G Internal walls and partitions 60,800 68.96 1,100 55.29 5.162H Internal doors 36,000 40.83 54 668.82 3.05
2 SUPERSTRUCTURE 495,100 561.54 41.98
3A Wall finishes 47,500 53.88 2,342 20.29 4.033B Floor finishes 34,300 38.91 851 40.25 2.913C Ceiling finishes 30,900 35.05 851 36.36 2.62
3 INTERNAL FINISHES 112,700 127.84 9.56
4 FITTINGS & FURNISHINGS 25,100 28.47 2.13
5A Sanitary appliances 12,400 14.07 - - - 1.055C Disposal installations 13,200 15.00 - - - 1.125N BWIC 6,900 7.83 - - - 0.595O Profit and attendances 3,500 3.97 - - - 0.30
BUILDING SERVICES 36,000 40.87 3.06
5B Services equipment - 0.005D Water installations 28,000 31.73 2.375E Heat source 3,300 3.79 0.285F Space heating/air treatment 22,800 25.90 1.935G Ventilation system 73,000 82.76 6.195H Electrical installations 143,700 162.96 12.195I Gas installations 6,700 7.60 0.575J Lifts and conveyors 32,200 36.57 2.735K Protective installations 21,900 24.82 1.865L Communication installations 56,600 64.20 4.805M Special installations 46,100 52.31 3.91
M&E SERVICES 434,300 492.64 36.83
BUILDING & ENGINEERING 1,179,100 1,337.45 100.00
7 Preliminaries 176,800 200.54 15.008A Design risk 58,900 66.81 5.008B Employers variation risk - - 0.008C BREEAM allowance 35,300 40.04 3.00
TOTAL 271,000 307.39
TOTAL COST £ 1,450,100 £ 1,644.82 /m2
Building £ 916,000 £ 1,039.00 /m2
Engineering £ 534,100 £ 605.82 /m2

Appendix 6 – Elemental cost plans
69
HBN 26 Volume 1 – ‘Facilities for surgical procedures’ (overall space)
HBN 26 Volume 1 - 'Facilities for surgical procedures' (example 1, 8 operating theatres) Aug-10
Index level : 480 MIPS(FP) Gross internal area : 3974 m2
COST OF RATE ELEMENTAL DATA QUANTITY ELEMENTAL ELEMENT ELEMENT Quantity Rate FACTOR PERCENTAGE
£ £/m2 £ %
1 SUBSTRUCTURE 342,200 86.11 1947 175.74 0.490 3.73
2A Frame 457,000 115.00 3,974 115.00 1.000 4.982B Upper floors 124,000 31.20 1,907 65.00 0.480 1.352C Roof 405,300 101.99 2,384 170.00 0.600 4.422D Stairs 22,800 5.75 0 152.48 0.252E External walls 568,200 142.98 2,066 275.00 0.520 6.192F Windows and external doors 218,400 54.96 397 550.00 0.100 2.382G Internal walls and partitions 241,200 60.70 4,376 55.12 2.632H Internal doors 133,100 33.49 195 681.73 1.45
2 SUPERSTRUCTURE 2,170,000 546.07 23.65
3A Wall finishes 336,000 84.55 9,472 35.48 3.663B Floor finishes 201,000 50.58 3,803 52.84 2.193C Ceiling finishes 158,600 39.91 3,803 41.70 1.73
3 INTERNAL FINISHES 695,600 175.04 7.58
4 FITTINGS & FURNISHINGS 288,800 72.67 3.15
5A Sanitary appliances 73,600 18.52 - - - 0.805C Disposal installations 59,600 15.00 - - - 0.655N BWIC 83,300 20.96 - - - 0.915O Profit and attendances 41,700 10.49 - - - 0.45
BUILDING SERVICES 258,200 64.97 2.81
5B Services equipment - 0.005D Water installations 176,500 44.42 1.925E Heat source 26,400 6.65 0.295F Space heating/air treatment 208,300 52.41 2.275G Ventilation system 2,524,900 635.37 27.535H Electrical installations 1,323,000 332.92 14.425I Gas installations 35,300 8.88 0.385J Lifts and conveyors 145,300 36.57 1.585K Protective installations 98,600 24.82 1.075L Communication installations 255,100 64.20 2.785M Special installations 624,200 157.07 6.81
M&E SERVICES 5,417,600 1,363.32 59.05
BUILDING & ENGINEERING 9,172,400 2,308.18 100.00
7 Preliminaries 1,375,800 346.21 15.008A Design risk 458,600 115.40 5.008B Employers variation risk - - 0.008C BREEAM allowance 275,100 69.23 3.00
TOTAL 2,109,500 530.84
TOTAL COST £ 11,281,900 £ 2,839.01 /m2
Building £ 4,618,300 £ 1,162.16 /m2
Engineering £ 6,663,600 £ 1,676.85 /m2

Healthcare Premises Cost Guides
70
HBN 11-01 – ‘Facilities for primary and community care services’ (primary care centre) (public space)
HBN 11-01 - 'Facilities for primary and community care services' (primary care centre) Jul-10
Index level : 480 MIPS(FP) Gross internal area: 294 m2
COST OF RATE ELEMENTAL DATA QUANTITY ELEMENTAL ELEMENT ELEMENT Quantity Rate FACTOR PERCENTAGE
£ £/m2 £ %
1 SUBSTRUCTURE 25,300 86.19 144 175.74 0.490 5.14
2A Frame 33,800 115.15 294 115.00 1.000 6.872B Upper floors 9,200 31.34 141 65.00 0.480 1.872C Roof 29,900 101.86 176 170.00 0.600 6.082D Stairs 2,500 8.37 0 152.48 0.512E External walls 42,100 143.42 153 275.00 0.520 8.562F Windows and external doors 16,000 54.51 29 550.00 0.100 3.252G Internal walls and partitions 13,800 47.01 217 63.67 2.802H Internal doors 7,600 25.89 11 685.17 0.038 1.54
2 SUPERSTRUCTURE 154,900 527.55 31.48
3A Wall finishes 15,100 51.44 498 30.37 3.073B Floor finishes 12,500 42.58 281 44.40 2.543C Ceiling finishes 10,200 34.75 281 36.24 2.07
3 INTERNAL FINISHES 37,800 128.77 7.68
4 FITTINGS & FURNISHINGS 5,700 19.42 1.16
5A Sanitary appliances 22,600 76.99 - - - 4.595C Disposal installations 4,400 15.00 - - - 0.895N BWIC 12,500 42.58 - - - 2.545O Profit and attendances 6,300 21.46 - - - 1.28
BUILDING SERVICES 45,800 156.03 9.30
5B Services equipment - - 0.005D Water installations 32,600 111.17 6.635E Heat source 5,000 16.95 1.025F Space heating/air treatment 12,400 42.41 2.525G Ventilation system 48,600 165.59 9.885H Electrical installations 62,700 213.65 12.745I Gas installations 2,500 8.40 0.515J Lifts and conveyors 24,800 84.34 5.045K Protective installations 6,800 23.19 1.385L Communication installations 14,000 47.59 2.855M Special installations 13,100 44.73 2.66
M&E SERVICES 222,500 758.01 45.23
BUILDING & ENGINEERING 492,000 1,675.97 100.00
7 Preliminaries 73,800 251.42 15.008A Design risk 24,600 83.81 5.008B Employers variation risk - - 0.008C BREEAM allowance 14,800 50.42 3.00
TOTAL 113,200 385.64
TOTAL COST £ 605,200 £ 2,061.77 /m2
Building £ 331,500 £ 1,129.34 /m2
Engineering £ 273,700 £ 932.43 /m2

Appendix 6 – Elemental cost plans
71
HBN 11-01 – ‘Facilities for primary and community care services’ (primary care centre) (clinical space)
HBN 11-01 - 'Facilities for primary and community care services' (primary care centre) Jul-10
Index level : 480 MIPS(FP) Gross internal area : 1800 m2
COST OF RATE ELEMENTAL DATA QUANTITY ELEMENTAL ELEMENT ELEMENT Quantity Rate FACTOR PERCENTAGE
£ £/m2 £ %
1 SUBSTRUCTURE 155,000 86.09 882 175.74 0.490 5.18
2A Frame 207,000 114.98 1,800 115.00 1.000 6.922B Upper floors 56,200 31.22 864 65.00 0.480 1.882C Roof 183,600 101.98 1,080 170.00 0.600 6.142D Stairs 15,100 8.37 0 152.48 0.502E External walls 257,400 142.97 936 275.00 0.520 8.602F Windows and external doors 99,000 54.99 180 550.00 0.100 3.312G Internal walls and partitions 108,200 60.10 1,940 55.79 3.622H Internal doors 55,100 30.61 83 661.94 1.84
2 SUPERSTRUCTURE 981,600 545.22 32.81
3A Wall finishes 140,500 78.04 4,208 33.40 4.703B Floor finishes 86,500 48.05 1,725 50.13 2.893C Ceiling finishes 62,500 34.72 1,725 36.24 2.09
3 INTERNAL FINISHES 289,500 160.81 9.68
4 FITTINGS & FURNISHINGS 82,800 45.99 2.77
5A Sanitary appliances 94,900 52.71 - - - 3.175C Disposal installations 27,000 15.00 - - - 0.905N BWIC 69,000 38.33 - - - 2.315O Profit and attendances 34,500 19.16 - - - 1.15
BUILDING SERVICES 225,400 125.20 7.53
5B Services equipment - - 0.005D Water installations 100,800 56.02 3.375E Heat source 27,100 15.07 0.915F Space heating/air treatment 70,700 39.26 2.365G Ventilation system 238,500 132.46 7.975H Electrical installations 419,500 233.02 14.025I Gas installations 14,500 8.07 0.485J Lifts and conveyors 151,800 84.34 5.075K Protective installations 41,800 23.19 1.405L Communication installations 85,700 47.59 2.865M Special installations 106,900 59.38 3.57
M&E SERVICES 1,257,300 698.40 42.01
BUILDING & ENGINEERING 2,991,600 1,661.71 100.00
7 Preliminaries 448,700 249.23 15.008A Design risk 149,600 83.09 5.008B Employers variation risk - - 0.008C BREEAM allowance 89,700 49.82 3.00
TOTAL 688,000 382.15
TOTAL COST £ 3,679,600 £ 2,043.82 /m2
Building £ 2,133,100 £ 1,184.82 /m2
Engineering £ 1,546,500 £ 859.00 /m2

Healthcare Premises Cost Guides
72
HBN 11-01 – ‘Facilities for primary and community care services’ (primary care centre) (staff space)
HBN 11-01 - 'Facilities for primary and community care services' (primary care centre) Jul-10
Index level : 480 MIPS(FP) Gross internal area : 511 m2
COST OF RATE ELEMENTAL DATA QUANTITY ELEMENTAL ELEMENT ELEMENT Quantity Rate FACTOR PERCENTAGE
£ £/m2 £ %
1 SUBSTRUCTURE 44,100 86.22 251 175.74 0.490 5.81
2A Frame 58,800 114.96 511 115.00 1.000 7.752B Upper floors 16,000 31.28 246 65.00 0.480 2.112C Roof 52,200 102.05 307 170.00 0.600 6.882D Stairs 4,300 8.37 0 152.48 0.572E External walls 73,200 143.11 266 275.00 0.520 9.652F Windows and external doors 28,100 54.94 51 550.00 0.100 3.712G Internal walls and partitions 27,300 53.37 502 54.32 3.602H Internal doors 14,800 28.93 22 664.00 1.95
2 SUPERSTRUCTURE 274,700 537.01 36.22
3A Wall finishes 24,100 47.12 1,111 21.71 3.183B Floor finishes 21,700 42.42 492 44.14 2.863C Ceiling finishes 17,800 34.80 492 36.24 2.35
3 INTERNAL FINISHES 63,600 124.34 8.39
4 FITTINGS & FURNISHINGS 12,200 23.85 1.61
5A Sanitary appliances 18,900 36.95 - - - 2.495C Disposal installations 7,700 15.00 - - - 1.025N BWIC 16,900 33.04 - - - 2.235O Profit and attendances 8,500 16.62 - - - 1.12
BUILDING SERVICES 52,000 101.61 6.86
5B Services equipment - - 0.005D Water installations 19,200 37.53 2.535E Heat source 5,700 11.20 0.755F Space heating/air treatment 14,300 28.04 1.895G Ventilation system 44,800 87.63 5.915H Electrical installations 121,800 238.10 16.065I Gas installations 3,800 7.41 0.505J Lifts and conveyors 43,100 84.34 5.685K Protective installations 11,900 23.19 1.575L Communication installations 24,300 47.59 3.205M Special installations 22,900 44.73 3.02
M&E SERVICES 311,800 609.76 41.11
BUILDING & ENGINEERING 758,400 1,482.79 100.00
7 Preliminaries 113,800 222.49 15.008A Design risk 37,900 74.10 5.008B Employers variation risk - - 0.008C BREEAM allowance 22,800 44.58 3.00
TOTAL 174,500 341.16
TOTAL COST £ 932,900 £ 1,823.87 /m2
Building £ 549,300 £ 1,073.91 /m2
Engineering £ 383,600 £ 749.96 /m2

Appendix 6 – Elemental cost plans
73
HBN 11-01 – ‘Facilities for primary and community care services’ (primary care centre) (overall space)
HBN 11-01 - 'Facilities for primary and community care services' (primary care centre) Jul-10
Index level : 480 MIPS(FP) Gross internal area : 1800 m2
COST OF RATE ELEMENTAL DATA QUANTITY ELEMENTAL ELEMENT ELEMENT Quantity Rate FACTOR PERCENTAGE
£ £/m2 £ %
1 SUBSTRUCTURE 155,000 86.09 882 175.74 0.490 5.18
2A Frame 207,000 114.98 1,800 115.00 1.000 6.922B Upper floors 56,200 31.22 864 65.00 0.480 1.882C Roof 183,600 101.98 1,080 170.00 0.600 6.142D Stairs 15,100 8.37 0 152.48 0.502E External walls 257,400 142.97 936 275.00 0.520 8.602F Windows and external doors 99,000 54.99 180 550.00 0.100 3.312G Internal walls and partitions 108,200 60.10 1,940 55.79 3.622H Internal doors 55,100 30.61 83 661.94 1.84
2 SUPERSTRUCTURE 981,600 545.22 32.81
3A Wall finishes 140,500 78.04 4,208 33.40 4.703B Floor finishes 86,500 48.05 1,725 50.13 2.893C Ceiling finishes 62,500 34.72 1,725 36.24 2.09
3 INTERNAL FINISHES 289,500 160.81 9.68
4 FITTINGS & FURNISHINGS 82,800 45.99 2.77
5A Sanitary appliances 94,900 52.71 - - - 3.175C Disposal installations 27,000 15.00 - - - 0.905N BWIC 69,000 38.33 - - - 2.315O Profit and attendances 34,500 19.16 - - - 1.15
BUILDING SERVICES 225,400 125.20 7.53
5B Services equipment - - 0.005D Water installations 100,800 56.02 3.375E Heat source 27,100 15.07 0.915F Space heating/air treatment 70,700 39.26 2.365G Ventilation system 238,500 132.46 7.975H Electrical installations 419,500 233.02 14.025I Gas installations 14,500 8.07 0.485J Lifts and conveyors 151,800 84.34 5.075K Protective installations 41,800 23.19 1.405L Communication installations 85,700 47.59 2.865M Special installations 106,900 59.38 3.57
M&E SERVICES 1,257,300 698.40 42.01
BUILDING & ENGINEERING 2,991,600 1,661.71 100.00
7 Preliminaries 448,700 249.23 15.008A Design risk 149,600 83.09 5.008B Employers variation risk - - 0.008C BREEAM allowance 89,700 49.82 3.00
TOTAL 688,000 382.15
TOTAL COST £ 3,679,600 £ 2,043.82 /m2
Building £ 2,133,100 £ 1,184.82 /m2
Engineering £ 1,546,500 £ 859.00 /m2

Healthcare Premises Cost Guides
74
HBN 11-01 – ‘Facilities for primary and community care services’ (extended primary care centre) (public space)
HBN 11-01 - 'Facilities for primary and community care services' (extended primary care centre) Jul-10
Index level : 480 MIPS(FP) Gross internal area : 967 m2
COST OF RATE ELEMENTAL DATA QUANTITY ELEMENTAL ELEMENT ELEMENT Quantity Rate FACTOR PERCENTAGE
£ £/m2 £ %
1 SUBSTRUCTURE 83,300 86.11 474 175.74 0.490 5.66
2A Frame 111,200 114.95 967 115.00 1.000 7.562B Upper floors 30,200 31.22 464 65.00 0.480 2.052C Roof 98,600 101.92 580 170.00 0.600 6.702D Stairs 8,100 8.37 0 152.48 0.552E External walls 138,300 142.96 503 275.00 0.520 9.402F Windows and external doors 53,400 55.20 97 550.00 0.100 3.632G Internal walls and partitions 30,100 31.11 472 63.76 2.052H Internal doors 18,100 18.71 26 694.24 1.23
2 SUPERSTRUCTURE 488,000 504.44 33.17
3A Wall finishes 37,300 38.56 1,202 31.07 2.543B Floor finishes 43,100 44.55 930 46.39 2.933C Ceiling finishes 33,700 34.84 930 36.24 2.29
3 INTERNAL FINISHES 114,100 117.95 7.76
4 FITTINGS & FURNISHINGS 16,900 17.47 1.15
5A Sanitary appliances 50,000 51.69 - - - 3.405C Disposal Installations 14,500 15.00 - - - 0.995N BWIC 35,800 37.01 - - - 2.435O Profit and attendances 17,900 18.50 - - - 1.22
BUILDING SERVICES 118,200 122.20 8.04
5B Services equipment - - 0.005D Water installations 91,600 94.71 6.235E Heat source 9,800 10.08 0.675F Space heating/air treatment 39,000 40.30 2.655G Ventilation system 148,200 153.22 10.075H Electrical installations 177,400 183.34 12.065I Gas Installations 8,000 8.25 0.545J Lifts and conveyors 51,700 53.48 3.515K Protective installations 22,400 23.19 1.525L Communication installations 54,800 56.65 3.725M Special installations 48,000 49.58 3.26
M&E SERVICES 650,900 672.80 44.23
BUILDING & ENGINEERING 1,471,400 1,520.97 100.00
7 Preliminaries 220,700 228.14 15.008A Design risk 73,500 75.98 5.008B Employers variation risk - - 0.008C BREEAM allowance 44,100 45.59 3.00
TOTAL 338,300 349.70
TOTAL COST £ 1,809,700 £ 1,870.69 /m2
Building £ 1,009,200 £ 1,043.21 /m2
Engineering £ 800,500 £ 827.48 /m2

Appendix 6 – Elemental cost plans
75
HBN 11-01 – ‘Facilities for primary and community care services’ (extended primary care centre) (clinical space)
HBN 11-01 - 'Facilities for primary and community care services' (extended primary care centre) Jul-10
Index level : 480 MIPS(FP) Gross internal area : 2727 m2
COST OF RATE ELEMENTAL DATA QUANTITY ELEMENTAL ELEMENT ELEMENT Quantity Rate FACTOR PERCENTAGE
£ £/m2 £ %
1 SUBSTRUCTURE 234,800 86.09 1336 175.74 0.490 4.79
2A Frame 313,600 114.99 2,727 115.00 1.000 6.402B Upper floors 85,100 31.20 1,309 65.00 0.480 1.742C Roof 278,100 101.97 1,636 170.00 0.600 5.672D Stairs 22,800 8.37 0 152.48 0.472E External walls 390,000 143.00 1,418 275.00 0.520 7.962F Windows and external doors 150,200 55.07 273 550.00 0.100 3.062G Internal walls and partitions 179,500 65.82 3,253 55.18 3.662H Internal doors 96,600 35.42 147 657.22 1.97
2 SUPERSTRUCTURE 1,515,900 555.84 30.93
3A Wall finishes 286,800 105.16 7,087 40.47 5.853B Floor finishes 146,500 53.72 2,611 56.11 2.993C Ceiling finishes 96,100 35.24 2,611 36.79 1.96
3 INTERNAL FINISHES 529,400 194.12 10.80
4 FITTINGS & FURNISHINGS 186,500 68.38 3.81
5A Sanitary appliances 160,100 58.70 - - - 3.275C Disposal installations 40,900 15.00 - - - 0.835N BWIC 113,200 41.51 - - - 2.315O Profit and attendances 56,600 20.75 - - - 1.15
BUILDING SERVICES 370,800 135.96 7.56
5B Services equipment - - 0.005D Water installations 178,200 65.34 3.645E Heat source 29,100 10.68 0.595F Space heating/air treatment 126,900 46.53 2.595G Ventilation system 398,700 146.20 8.135H Electrical installations 689,400 252.79 14.075I Gas installations 23,000 8.42 0.475J Lifts and conveyors 145,800 53.48 2.975K Protective installations 63,300 23.19 1.295L Communication installations 154,500 56.65 3.155M Special installations 254,800 93.43 5.20
M&E SERVICES 2,063,700 756.69 42.10
BUILDING & ENGINEERING 4,901,100 1,797.08 100.00
7 Preliminaries 735,200 269.57 15.008A Design risk 245,100 89.87 5.008B Employers variation risk - - 0.008C BREEAM allowance 147,000 53.90 3.00
TOTAL 1,127,300 413.34
TOTAL COST £ 6,028,400 £ 2,210.39 /m2
Building £ 3,490,000 £ 1,279.65 /m2
Engineering £ 2,538,400 £ 930.74 /m2

Healthcare Premises Cost Guides
76
HBN 11-01 – ‘Facilities for primary and community care services’ (extended primary care centre) (staff space)
HBN 11-01 - 'Facilities for primary and community care services' (extended primary care centre) Jul-10
Index level : 480 MIPS(FP) Gross internal area : 1348 m2
COST OF RATE ELEMENTAL DATA QUANTITY ELEMENTAL ELEMENT ELEMENT Quantity Rate FACTOR PERCENTAGE
£ £/m2 £ %
1 SUBSTRUCTURE 116,200 86.18 661 175.74 0.490 6.44
2A Frame 155,000 114.96 1,348 115.00 1.000 8.592B Upper floors 42,100 31.22 647 65.00 0.480 2.332C Roof 137,500 101.98 809 170.00 0.600 7.622D Stairs 11,300 8.37 0 152.48 0.632E External walls 192,800 142.99 701 275.00 0.520 10.682F Windows and external doors 74,300 55.11 135 550.00 0.100 4.122G Internal walls and partitions 45,700 33.89 841 54.29 2.532H Internal doors 28,100 20.84 42 669.63 1.56
2 SUPERSTRUCTURE 686,800 509.36 38.06
3A Wall finishes 46,500 34.49 2,045 22.75 2.583B Floor finishes 54,900 40.72 1,299 42.23 3.043C Ceiling finishes 47,100 34.93 1,299 36.24 2.61
3 INTERNAL FINISHES 148,500 110.14 8.23
4 FITTINGS & FURNISHINGS 16,700 12.39 0.93
5A Sanitary appliances 38,300 28.41 - - - 2.125C Disposal installations 20,200 15.00 - - - 1.125N BWIC 38,900 28.85 - - - 2.165O Profit and attendances 19,500 14.46 - - - 1.08
BUILDING SERVICES 116,900 86.72 6.48
5B Services equipment - - 0.005D Water installations 58,700 43.51 3.255E Heat source 9,400 6.99 0.525F Space heating/air treatment 37,700 27.94 2.095G Ventilation system 110,200 81.72 6.115H Electrical installations 247,200 183.34 13.705I Gas installations 10,000 7.41 0.555J Lifts and conveyors 72,100 53.48 3.995K Protective installations 31,300 23.19 1.735L Communication installations 76,400 56.65 4.235M Special installations 66,800 49.58 3.70
M&E SERVICES 719,800 533.80 39.87
BUILDING & ENGINEERING 1,804,900 1,338.59 100.00
7 Preliminaries 270,800 200.84 15.008A Design risk 90,300 66.97 5.008B Employers variation risk - - 0.008C BREEAM allowance 54,200 40.20 3.00
TOTAL 415,300 308.02
TOTAL COST £ 2,220,200 £ 1,646.66 /m2
Building £ 1,334,800 £ 989.98 /m2
Engineering £ 885,400 £ 656.68 /m2

Appendix 6 – Elemental cost plans
77
HBN 11-01 – ‘Facilities for primary and community care services’ (extended primary care centre) (overall space)
HBN 11-01 - 'Facilities for primary and community care services' (extended primary care centre) Jul-10
Index level : 480 MIPS(FP) Gross internal area : 5043 m2
COST OF RATE ELEMENTAL DATA QUANTITY ELEMENTAL ELEMENT ELEMENT Quantity Rate FACTOR PERCENTAGE
£ £/m2 £ %
1 SUBSTRUCTURE 434,300 86.12 2471 175.74 0.490 5.31
2A Frame 579,900 114.99 5,043 115.00 1.000 7.092B Upper floors 157,400 31.21 2,421 65.00 0.480 1.922C Roof 514,400 102.00 3,026 170.00 0.600 6.292D Stairs 42,200 8.37 0 152.48 0.522E External walls 721,100 142.99 2,622 275.00 0.520 8.822F Windows and external doors 277,200 54.97 504 550.00 0.100 3.392G Internal walls and partitions 280,600 55.64 4,528 61.96 3.432H Internal doors 140,600 27.88 212 663.62 1.72
2 SUPERSTRUCTURE 2,713,400 538.05 33.18
3A Wall finishes 368,700 73.11 10,269 35.91 2.036 4.513B Floor finishes 243,500 48.28 4,845 50.26 0.961 2.983C Ceiling finishes 176,300 34.96 4,845 36.38 0.961 2.16
3 INTERNAL FINISHES 788,500 156.35 9.65
4 FITTINGS & FURNISHINGS 220,100 43.64 2.69
5A Sanitary appliances 248,400 49.26 - - - 3.045C Disposal installations 75,600 15.00 - - - 0.925N BWIC 187,200 37.12 - - - 2.295O Profit and attendances 93,600 18.56 - - - 1.14
BUILDING SERVICES 604,800 119.94 7.39
5B Services equipment - - 0.005D Water installations 327,200 64.87 4.005E Heat source 48,000 9.53 0.595F Space heating/air treatment 202,300 40.11 2.475G Ventilation system 652,800 129.45 7.985H Electrical installations 1,109,000 219.91 13.565I Gas installations 40,900 8.10 0.505J Lifts and conveyors 269,700 53.48 3.305K Protective installations 117,000 23.19 1.435L Communication installations 285,700 56.65 3.495M Special installations 366,400 72.66 4.48
M&E SERVICES 3,419,000 677.96 41.80
BUILDING & ENGINEERING 8,180,100 1,622.06 100.00
7 Preliminaries 1,227,100 243.33 15.008A Design risk 409,100 81.12 5.008B Employers variation risk - - 0.008C BREEAM allowance 245,400 48.66 3.00
TOTAL 1,881,600 373.11
TOTAL COST £ 10,061,700 £ 1,995.18 /m2
Building £ 5,856,200 £ 1,161.25 /m2
Engineering £ 4,205,500 £ 833.93 /m2
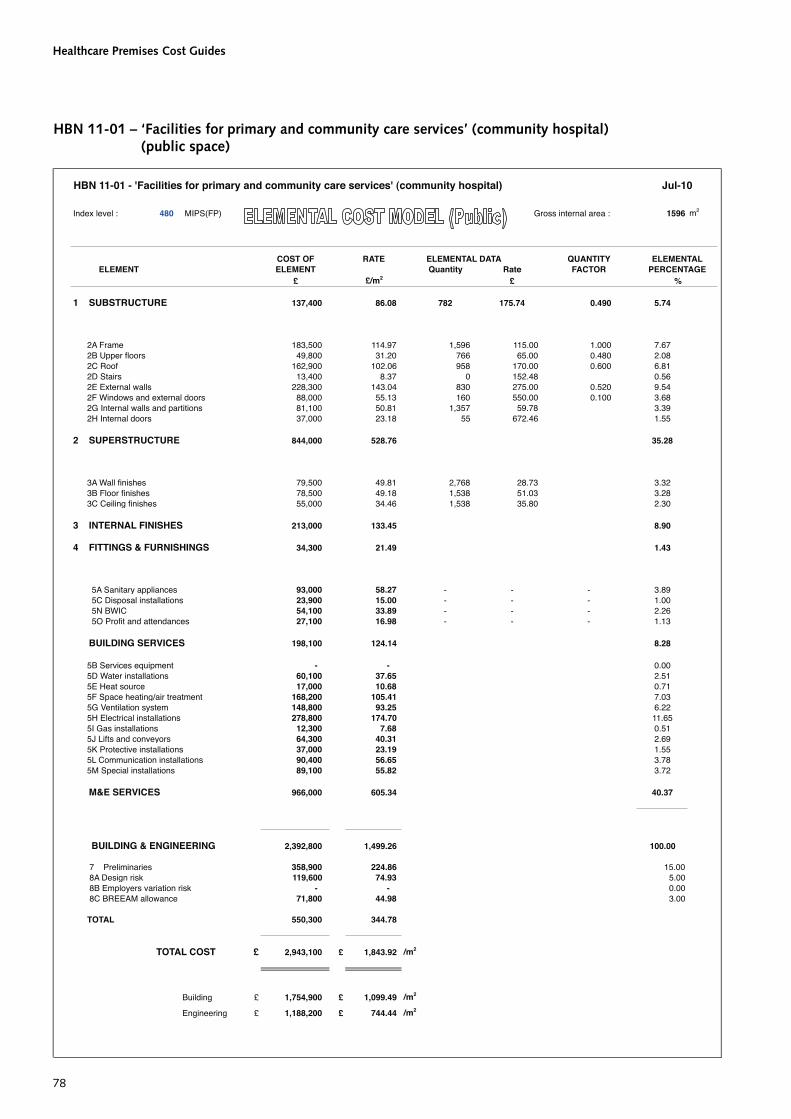
Healthcare Premises Cost Guides
78
HBN 11-01 – ‘Facilities for primary and community care services’ (community hospital) (public space)
HBN 11-01 - 'Facilities for primary and community care services' (community hospital) Jul-10
Index level : 480 MIPS(FP) Gross internal area : 1596 m2
COST OF RATE ELEMENTAL DATA QUANTITY ELEMENTAL ELEMENT ELEMENT Quantity Rate FACTOR PERCENTAGE
£ £/m2 £ %
1 SUBSTRUCTURE 137,400 86.08 782 175.74 0.490 5.74
2A Frame 183,500 114.97 1,596 115.00 1.000 7.672B Upper floors 49,800 31.20 766 65.00 0.480 2.082C Roof 162,900 102.06 958 170.00 0.600 6.812D Stairs 13,400 8.37 0 152.48 0.562E External walls 228,300 143.04 830 275.00 0.520 9.542F Windows and external doors 88,000 55.13 160 550.00 0.100 3.682G Internal walls and partitions 81,100 50.81 1,357 59.78 3.392H Internal doors 37,000 23.18 55 672.46 1.55
2 SUPERSTRUCTURE 844,000 528.76 35.28
3A Wall finishes 79,500 49.81 2,768 28.73 3.323B Floor finishes 78,500 49.18 1,538 51.03 3.283C Ceiling finishes 55,000 34.46 1,538 35.80 2.30
3 INTERNAL FINISHES 213,000 133.45 8.90
4 FITTINGS & FURNISHINGS 34,300 21.49 1.43
5A Sanitary appliances 93,000 58.27 - - - 3.895C Disposal installations 23,900 15.00 - - - 1.005N BWIC 54,100 33.89 - - - 2.265O Profit and attendances 27,100 16.98 - - - 1.13
BUILDING SERVICES 198,100 124.14 8.28
5B Services equipment - - 0.005D Water installations 60,100 37.65 2.515E Heat source 17,000 10.68 0.715F Space heating/air treatment 168,200 105.41 7.035G Ventilation system 148,800 93.25 6.225H Electrical installations 278,800 174.70 11.655I Gas installations 12,300 7.68 0.515J Lifts and conveyors 64,300 40.31 2.695K Protective installations 37,000 23.19 1.555L Communication installations 90,400 56.65 3.785M Special installations 89,100 55.82 3.72
M&E SERVICES 966,000 605.34 40.37
BUILDING & ENGINEERING 2,392,800 1,499.26 100.00
7 Preliminaries 358,900 224.86 15.008A Design risk 119,600 74.93 5.008B Employers variation risk - - 0.008C BREEAM allowance 71,800 44.98 3.00
TOTAL 550,300 344.78
TOTAL COST £ 2,943,100 £ 1,843.92 /m2
Building £ 1,754,900 £ 1,099.49 /m2
Engineering £ 1,188,200 £ 744.44 /m2

Appendix 6 – Elemental cost plans
79
HBN 11-01 – ‘Facilities for primary and community care services’ (community hospital) (clinical space)
HBN 11-01 - 'Facilities for primary and community care services' (community hospital) Jul-10
Index level : 480 MIPS(FP) Gross internal area : 9267 m2
COST OF RATE ELEMENTAL DATA QUANTITY ELEMENTAL ELEMENT ELEMENT Quantity Rate FACTOR PERCENTAGE
£ £/m2 £ %
1 SUBSTRUCTURE 798,000 86.11 4541 175.74 0.490 4.33
2A Frame 1,065,700 115.00 9,267 115.00 1.000 5.792B Upper floors 289,100 31.20 4,448 65.00 0.480 1.572C Roof 945,200 102.00 5,560 170.00 0.600 5.132D Stairs 77,600 8.37 0 152.48 0.422E External walls 1,325,200 143.00 4,819 275.00 0.520 7.202F Windows and external doors 509,900 55.02 927 550.00 0.100 2.772G Internal walls and partitions 732,800 79.08 12,148 60.32 3.982H Internal doors 318,100 34.33 472 674.62 1.73
2 SUPERSTRUCTURE 5,263,600 568.00 28.59
3A Wall finishes 924,000 99.71 22,348 41.35 5.023B Floor finishes 495,700 53.49 8,899 55.70 2.693C Ceiling finishes 334,000 36.04 8,899 37.53 1.81
3 INTERNAL FINISHES 1,753,700 189.24 9.52
4 FITTINGS & FURNISHINGS 524,900 56.64 2.85
5A Sanitary appliances 838,700 90.51 - - - 4.565C Disposal installations 139,000 15.00 - - - 0.765N BWIC 468,400 50.55 - - - 2.545O Profit and attendances 234,200 25.27 - - - 1.27
BUILDING SERVICES 1,680,300 181.33 9.13
5B Services equipment - - 0.005D Water installations 788,600 85.10 4.285E Heat source 128,700 13.89 0.705F Space heating/air treatment 722,000 77.91 3.925G Ventilation system 2,163,000 233.41 11.755H Electrical installations 2,396,800 258.65 13.025I Gas installations 76,700 8.27 0.425J Lifts and conveyors 369,800 39.91 2.015K Protective installations 214,900 23.19 1.175L Communication installations 654,300 70.61 3.555M Special installations 875,000 94.43 4.75
M&E SERVICES 8,389,800 905.37 45.57
BUILDING & ENGINEERING 18,410,300 1,986.69 100.00
7 Preliminaries 2,761,600 298.01 15.008A Design risk 920,500 99.33 5.008B Employers variation risk - - 0.008C BREEAM allowance 552,300 59.60 3.00
TOTAL 4,234,400 456.94
TOTAL COST £ 22,644,700 £ 2,443.63 /m2
Building £ 12,325,200 £ 1,330.04 /m2
Engineering £ 10,319,500 £ 1,113.60 /m2

Healthcare Premises Cost Guides
80
HBN 11-01 – ‘Facilities for primary and community care services’ (community hospital) (staff space)
HBN 11-01 - 'Facilities for primary and community care services' (community hospital) Jul-10
Index level : 480 MIPS(FP) Gross internal area : 2824 m2
COST OF RATE ELEMENTAL DATA QUANTITY ELEMENTAL ELEMENT ELEMENT Quantity Rate FACTOR PERCENTAGE
£ £/m2 £ %
1 SUBSTRUCTURE 243,200 86.11 1384 175.74 0.490 6.54
2A Frame 324,800 115.01 2,824 115.00 1.000 8.732B Upper floors 88,100 31.20 1,356 65.00 0.480 2.372C Roof 288,200 102.05 1,695 170.00 0.600 7.752D Stairs 23,600 8.37 0 152.48 0.632E External walls 404,000 143.05 1,469 275.00 0.520 10.862F Windows and external doors 155,100 54.92 282 550.00 0.100 4.172G Internal walls and partitions 98,700 34.95 1,819 54.28 2.652H Internal doors 59,700 21.14 89 667.78 1.60
2 SUPERSTRUCTURE 1,442,200 510.69 38.76
3A Wall finishes 95,800 33.92 4,297 22.29 2.573B Floor finishes 111,700 39.55 2,678 41.69 3.003C Ceiling finishes 97,100 34.38 2,678 36.24 2.61
3 INTERNAL FINISHES 304,600 107.85 8.18
4 FITTINGS & FURNISHINGS 47,800 16.93 1.28
5A Sanitary appliances 116,400 41.22 - - - 3.135C Disposal installations 42,400 15.00 - - - 1.145N BWIC 78,300 27.72 - - - 2.105O Profit and attendances 39,200 13.88 - - - 1.05
BUILDING SERVICES 276,300 97.82 7.42
5B Services equipment - - 0.005D Water installations 70,900 25.12 1.915E Heat source 27,000 9.56 0.735F Space heating/air treatment 96,300 34.09 2.595G Ventilation system 200,000 70.83 5.385H Electrical installations 493,400 174.70 13.265I Gas installations 21,100 7.49 0.575J Lifts and conveyors 114,500 40.55 3.085K Protective installations 65,500 23.19 1.765L Communication installations 160,000 56.65 4.305M Special installations 157,600 55.82 4.24
M&E SERVICES 1,406,300 498.00 37.82
BUILDING & ENGINEERING 3,720,400 1,317.40 100.00
7 Preliminaries 558,000 197.58 15.008A Design risk 186,000 65.86 5.008B Employers variation risk - - 0.008C BREEAM allowance 111,600 39.52 3.00
TOTAL 855,600 302.96
TOTAL COST £ 4,576,000 £ 1,620.30 /m2
Building £ 2,846,300 £ 1,007.84 /m2
Engineering £ 1,729,700 £ 612.46 /m2
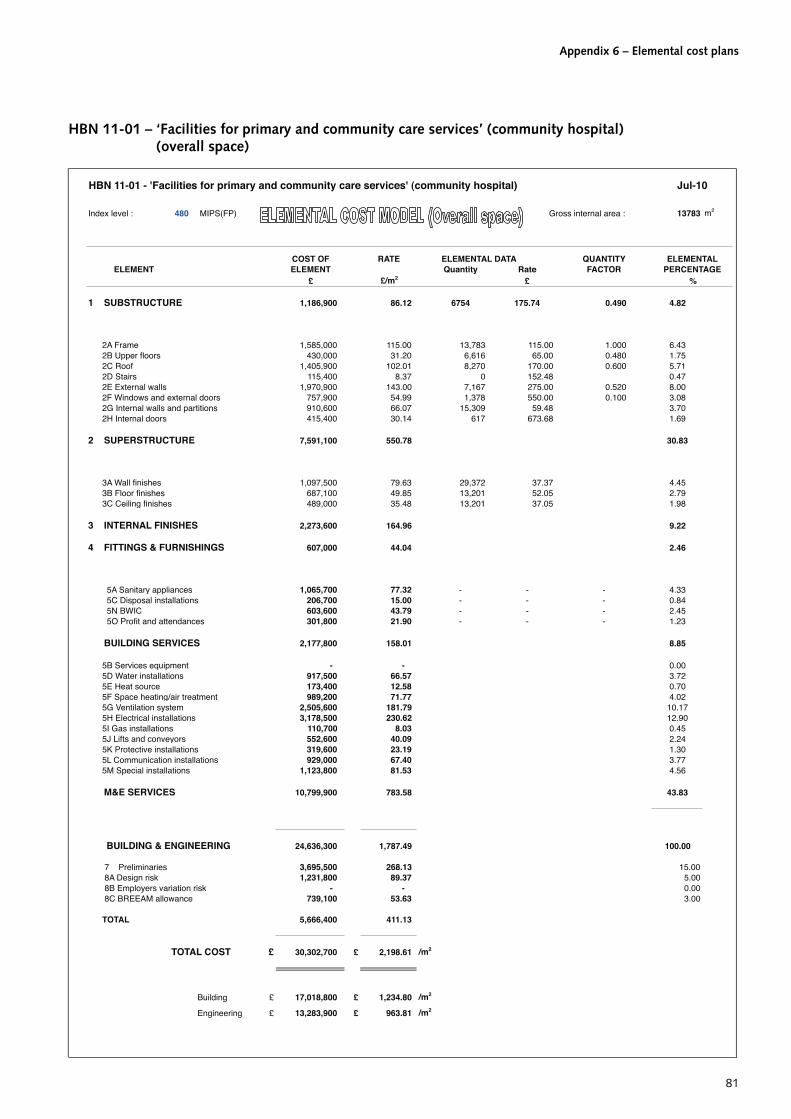
Appendix 6 – Elemental cost plans
81
HBN 11-01 – ‘Facilities for primary and community care services’ (community hospital) (overall space)
HBN 11-01 - 'Facilities for primary and community care services' (community hospital) Jul-10
Index level : 480 MIPS(FP) Gross internal area : 13783 m2
COST OF RATE ELEMENTAL DATA QUANTITY ELEMENTAL ELEMENT ELEMENT Quantity Rate FACTOR PERCENTAGE
£ £/m2 £ %
1 SUBSTRUCTURE 1,186,900 86.12 6754 175.74 0.490 4.82
2A Frame 1,585,000 115.00 13,783 115.00 1.000 6.432B Upper floors 430,000 31.20 6,616 65.00 0.480 1.752C Roof 1,405,900 102.01 8,270 170.00 0.600 5.712D Stairs 115,400 8.37 0 152.48 0.472E External walls 1,970,900 143.00 7,167 275.00 0.520 8.002F Windows and external doors 757,900 54.99 1,378 550.00 0.100 3.082G Internal walls and partitions 910,600 66.07 15,309 59.48 3.702H Internal doors 415,400 30.14 617 673.68 1.69
2 SUPERSTRUCTURE 7,591,100 550.78 30.83
3A Wall finishes 1,097,500 79.63 29,372 37.37 4.453B Floor finishes 687,100 49.85 13,201 52.05 2.793C Ceiling finishes 489,000 35.48 13,201 37.05 1.98
3 INTERNAL FINISHES 2,273,600 164.96 9.22
4 FITTINGS & FURNISHINGS 607,000 44.04 2.46
5A Sanitary appliances 1,065,700 77.32 - - - 4.335C Disposal installations 206,700 15.00 - - - 0.845N BWIC 603,600 43.79 - - - 2.455O Profit and attendances 301,800 21.90 - - - 1.23
BUILDING SERVICES 2,177,800 158.01 8.85
5B Services equipment - - 0.005D Water installations 917,500 66.57 3.725E Heat source 173,400 12.58 0.705F Space heating/air treatment 989,200 71.77 4.025G Ventilation system 2,505,600 181.79 10.175H Electrical installations 3,178,500 230.62 12.905I Gas installations 110,700 8.03 0.455J Lifts and conveyors 552,600 40.09 2.245K Protective installations 319,600 23.19 1.305L Communication installations 929,000 67.40 3.775M Special installations 1,123,800 81.53 4.56
M&E SERVICES 10,799,900 783.58 43.83
BUILDING & ENGINEERING 24,636,300 1,787.49 100.00
7 Preliminaries 3,695,500 268.13 15.008A Design risk 1,231,800 89.37 5.008B Employers variation risk - - 0.008C BREEAM allowance 739,100 53.63 3.00
TOTAL 5,666,400 411.13
TOTAL COST £ 30,302,700 £ 2,198.61 /m2
Building £ 17,018,800 £ 1,234.80 /m2
Engineering £ 13,283,900 £ 963.81 /m2

Healthcare Prem
ises Cost G
uides
82
Appendix 7 – Outline specification and design notes
ELEMENT AND DESIGN CRITERIA SPECIFICATION NOTES
1 SUBSTRUCTURE
1A Substructure 1A1 Standard foundations
Foundations are of reinforced concrete construction.
Nature of soil 1A2 Special foundations
Permissible soil loading British Standards (BS) kN/m2 1A3 Lowest floor bed/slab
Ground floor slab is a minimum 150 mm thick reinforced concrete with a light tamp finish and colour tinted PVA spray on damp proof membrane on a minimum 150 mm thick hardcore bed. All necessary expansion and contraction joints should be incorporated.
Bearing strata depth Excluded m 1A4 Basement excavation Excluded (to be included in site-specific works)
Site levels: main gradients
Excluded m 1A5 Basement retaining walls
Excluded (to be included in site-specific works)
Water table depth Excluded m Excluded (to be included in site-specific works)
Average pile loading Excluded kN Excluded (to be included in site-specific works)
Volume of basement Excluded m3 Excluded (to be included in site-specific works)
2 SUPERSTRUCTURE
2A Frame 2A1 Structural frame The structural steel frame is based on clear span across the building without intermediate support utilising beams to support the first floor and steel portal rafters to support the roof. Secondary steel is included for supports around a central courtyard area.
Grid pattern of main columns
British Standards (BS) To British Standards (BS)
2B Upper floors 2B1 Upper floors Upper floors are constructed of composite metal deck and reinforced concrete construction with a light tamp finish and colour tinted PVA spray.
Design loads 4 kN/m2 4 kN/m2 + 1 kN/m2 for partitions. 7.5 kN/m2 for plantrooms, birthing pools and equipment with excessive loads.
Spans ≤ 9 m
Sound insulation British Standards (BS) dB To British Standards (BS)

Appendix 7 – O
utline specification and design notes
83
ELEMENT AND DESIGN CRITERIA SPECIFICATION NOTES
2C Roof 2C1 Roof structure The roof will be “SpeedDeck Building Systems Limited” or equal standing seam insulated aluminium roofing fixed to galvanised steel purlin complete with vapour barrier and insulated with mineral wool fibre insulation to achieve a maximum “U” value of 0.25 W/m2K.
Design loads British Standards (BS) kN/m2 2C2 Roof coverings
Spans British Standards (BS) m 2C3 Roof drainage Gutters to the standing seam roof should be metal, compatible with the roofing system and insulated to the same standard as the general roof areas. Gutters should be provided with weir overflows. The rainwater installation is based on a conventional system with PVC rainwater pipes located internally.
Angle of pitch of sloping roofs
≤ 5 deg 2C4 Rooflights and openings
Approximately 10% of roof area.
Area of roof surface m2 2C5 Roof features Excluded (to be included in site-specific works)
2D Stairs 2D1 Stair structure Main staircase construction is based on an in-situ or precast reinforced concrete.
Total vertical height of each staircase and width between strings
2D2 Stair finishes Treads to receive carpeted finish with non-slip nosings. The main staircase is to include features to ensure it is in keeping with the quality of the reception area.
3.5 m 2D3 Stair balustrades and handrails
The handrail to be stainless steel with painted mild steel balustrades.
2E External walls 2E1 External enclosing walls
External walls to comprise a palette of materials including proprietary rain screen cladding on either masonry construction or metal stud walling system, double-glazed curtain walling, composite flat panel cladding systems and facing brickwork.
Design loads of load bearing walls
British Standards (BS) kN/m2 2E2 External wall finishes
Thermal conductivity – “U” value
British Standards (BS) W/m2K 2E3 Solar/rain screening The external walls comprise a palette of materials with a solid to glazed ratio of 70:30.
Approximate area of external walls above ground
Site-specific works m2 2E4 Basement walls Excluded (to be included in site-specific works)
Area of basement walls N/A m2 2E5 Façade access Included

Healthcare Prem
ises Cost G
uides
84
ELEMENT AND DESIGN CRITERIA SPECIFICATION NOTES
2F External windows and doors
2F1 External windows Curtain walling should comprise a “Technal”, “Kawneer” or similar double glazed and fully drained polyester powder coated thermally broken installation with no opening lights. Windows are double glazed aluminium powder coated windows.
Approximate total window area
Solid to glazed ratio of 70:30
2F2 External doors External escape doors should be solid core metal faced doors. Colour to match the panel cladding system.
Approximate area of opening lights to windows
50% of window area The main entrance door should be a circular bi-parting door finished as the curtain walling system operated by proximity sensors with internal manual override.
System adjustments may be required to specialist units e.g. mental health.2G Internal walls and
partitions 2G1 Internal walls/
partitions Lift shafts are constructed from 215 mm thick blockwork. Internal walls generally constructed from 140 mm blockwork or dry lined construction. All exposed walls are in fair face paint quality blockwork.
Sound insulation British Standards (BS) dB 2G2 Balustrades and handrails
Included
Number of WC cubicles
N/A nr 2G3 Moveable room dividers
Glazed screens to be “Komfort” glazed office partitions or similar.
2G4 Cubicles Site-specific
2H Internal doors 2H1 Internal doors Internal doors, fire resistant as appropriate, to be generally of flush hardwood veneered (beech) construction in hardwood frames with hardwood architraves including good quality brushed stainless steel ironmongery.
Approximate number of doors by type and size
Site-specific nr Main entrance doors into each office from common areas to have feature glazing panels glazed with “Pyran” or similar clear fire resistant glass.
Fire rating British Standards (BS) Doors to plant rooms to be plywood veneered solid core doors in softwood frames. All painted.
All doors to offices, service riser cupboards, cleaners’ cupboard and plant room should be fitted with 5 lever mortice dead locks.
3 FINISHES
3A Wall finishes 3A1 Wall finishes Offices and meeting room areas: plaster/skim and emulsion paint; 1 base coat, two finishing coats.
Clinical and clinical support areas; “Altro Whiterock” hygienic wall finish.
Circulation and communication areas: “Superhard” gypsum wallboard, eggshell paint to wall surfaces; 1 base coat and two finishing coats. Perimeter/impact protection to corridor walls.
FM and plantroom areas: eggshell paint to wall surfaces; 1 base coat and two finishing coats.

Appendix 7 – O
utline specification and design notes
85
ELEMENT AND DESIGN CRITERIA SPECIFICATION NOTES
3B Floor finishes 3B1 Finishes to floors Offices and meeting room areas: broadloom carpet.
Clinical and clinical support areas: vinyl/PVCu flooring (“Altro” or similar) with coved vinyl/PVCu skirting; all joints to be welded and sealed.
Circulation and communication areas: vinyl/PVCu flooring (“Altro” or similar) with coved vinyl/PVCu skirting; all joints to be welded and sealed.
FM and plantroom areas: epoxy floor paint to plantroom areas.3B2 Raised access floors Excluded (to be included in site-specific works)
3C Ceiling finishes 3C1 Finishes to ceilings Generally; suspended ceilings throughout.3C2 Suspended ceilings “Armstrong Cortega” or similar approved; exposed 24 wide XL/TL grid;
600 × 600 “Cortega Tegular” tiles; “Prelude XL/TL” perimeter trim with 25 × 38 mm shadow batten.
Some clinical areas to receive specialist finishes.4 FITTINGS
4A Fittings and furnishings
4A1 Fittings, fixtures and furniture
All Group 1 equipment (all fixtures, fittings and equipment wall, floor or ceiling mounted that are supplied and fixed under the terms of the building contract). Examples of which include fixed storage, kitchenette, wall-mounted clocks, notice boards, cabinets, floor-mounted surgical, clinical and treatment chairs. All to be in accordance with the relevant HBN, HTM and ADB documentation. Group 2 equipment (all loose fixtures, fittings and equipment and secondary fixed fixtures fittings and equipment). Examples of which include dispensers, wall-mounted magazine racks, floor standing lockers. All to be in accordance with the relevant HBN, HTM and ADB documentation. Group 3 and 4 equipment is to be excluded and to be included in equipment.
4A2 Soft furnishing Excluded (to be included in site-specific works)
4A3 Works of art Excluded (to be included in site-specific works)
4A4 Equipment See 4A15 SERVICES
5A Sanitary appliances 5A1 Sanitaryware Sanitaryware to be “Armitage Shanks” or similar approved and must meet the standards set out in the HTM documentation.
5A2 Pods Excluded (to be included in site-specific works)

Healthcare Prem
ises Cost G
uides
86
ELEMENT AND DESIGN CRITERIA SPECIFICATION NOTES
5B Services equipment 5B1 Services equipment Mechanical and electrical services equipment to be installed in accordance with manufacturers’ recommendations, inclusive of testing and making operational. Group 1 mechanical and electrical equipment (to be supplied and installed as part of the building contract). Group 1 mechanical and electrical equipment includes all equipment required in order for the building and each department to fulfil its functional requirements. Group 2 equipment (to be supplied by others and installed, as appropriate, by the mechanical & electrical/main contractor under the terms of the building contract) Examples of Group 2 equipment include items such as X-ray film viewers. Groups 3 and 4 equipment is excluded and is to be included in equipment costs.
5C Disposal installations 5C1 Internal drainage PVCu internal drainage pipework.5C2 Refuse disposal To British Standards (BS)
5C3 Chemical and industrial waste disposal
To British Standards (BS)
5D Water installations 5D1 Mains supply Single mains cold water intake supply to be derived from the utility water main supply and be complete with isolation valves, meter and by-pass facilities for when fire hydrants are being used.
5D2 Cold water services Potable cold water from the incoming utility main supply to feed a storage header tank having capacity for at least 12 hours supply. Cold water to be distributed and circulated throughout the building via insulated table X copper pipe at a temperature no greater than 20°C to reduce the risk of legionella. The cold water installation to comply with HTM 07-04 and HTM 04-01. Grey water and rainwater are not to be utilised. Temperature equilibrium to be achieved within 2 minutes at draw off points. Water services to tenanted areas to be sub-metered.
5D3 Hot water services The domestic hot water (DHW) system to be compliant with HTM 04-01 and HTM 07-04 taking into account the requirements for safe hot water in patient areas and the prevention of legionella. The domestic hot water to be stored centrally with a minimum of 2 hour capacity and circulated to draw off points within a temperature range of 55°C to 60°C. Temperature equilibrium to be achieved at draw off points within 2 minutes. Type 3 mixing valves to be used to ensure safe hot water temperatures to patient sanitary facilities.
5D4 Steam and condensate
Not applicable

Appendix 7 – O
utline specification and design notes
87
ELEMENT AND DESIGN CRITERIA SPECIFICATION NOTES
5E Heat source 5E1 Heat source Low pressure gas-fired high efficiency condensing boilers, each with the capability to serve the anticipated maximum heating, ventilation and domestic hot water system loads taking into account diversity and outside temperature factors. A minimum of two boilers to be provided to aid resilience and provisions to include 35 sec. light fuel oil standby facilities enabling up to 3 days continuity of service during loss of incoming gas supplies. Single incoming utility natural gas supply, inclusive of isolation values and meter house with sub-metering to tenanted areas.
5F Space heating and air-conditioning
5F1 Central heating Low pressure hot water system utilising insulated steel and copper distribution pipework serving under floor heating, ceiling mounted radiant panels and wall mounted heat emitters, as appropriate. The system to be capable of achieving room temperatures stipulated on ADB sheets at an outside temperature of –5°C and be compliant with low surface temperature requirements to HTM 04-01. The system should be designed to optimise energy efficiency.
5F2 Local heating Not applicable.5F3 Central cooling Compressor/air cooled evaporator/condensing refrigeration plant serving
chilled water to relevant ventilation cooler batteries sufficient to ensure that the maximum temperature within patient areas does not reach 28°C for more than 50 hours per year, or as designated on ADB sheets, to control the highest temperature to within 25°C for clinical purposes (eg. operating theatres). Includes refrigeration plant, distribution pipework, air handling units, supply and control equipment as required.
5F4 Local cooling Excluded (to be included in site-specific works)
5F5 Central heating and cooling
Excluded (to be included in site-specific works)
5F6 Local heating and cooling
Excluded (to be included in site-specific works)
5F7 Central air-conditioning
Excluded (to be included in site-specific works)
5F8 Local air-conditioning
Excluded (to be included in site-specific works)
5F9 Instrumentation and controls for more than one system
Building Management System (BMS) to provide automatic/manual monitoring and control of heating, ventilation and air-conditioning systems together with local thermostatic radiator valves (TRV) fitted to heat emitters.

Healthcare Prem
ises Cost G
uides
88
ELEMENT AND DESIGN CRITERIA SPECIFICATION NOTES
5G Ventilating system 5G1 Central ventilation Mechanical ventilation systems to be designed to comply with HTM 03-01 Part A and achieve ADB environmental requirements for each room or area. Filtered supply air to be derived from centralised plant with grouped or local extraction to provide the required air change rates and pressure differentials. Rooms located against external walls to be naturally ventilated where possible. Acoustic emissions to comply with HTM 08-01.
5G2 Smoke ventilation Ventilation systems to facilitate smoke extraction in the event of fire to be installed in accordance with Firecode and HTM 05 series of documents as applicable.
5G3 Local and special ventilation
Local dedicated ventilation systems to be provided for each operating theatre and where necessary in clinical locations to meet the required aseptic conditions.
5H Electrical installations 5H1 Electric source and mains
A separate neutral and earth TN-S low voltage (400v) three phase metered intake supply to be derived from the local distribution network operator (DNO) low voltage or high voltage network, whichever is of adequate capacity to meet the necessary demand. Dry-type power transformers to be used where possible. Moulded-case circuit breakers (MCCB) and high rupturing capacity (HRC) fuses used to protect main LV electrical switchboards and sub-main distribution circuits. Local distribution boards to be fitted with miniture circuit breaker (MCB) and residual current breaker operated (RCBO) protection devices as appropriate. Segregated and unified mains distribution system strategies to be designed and installed sufficient to ensure resilience risks are low to moderate as defined in HTM 06-01 Part A and that systems can be maintained with minimal disruption to electrical services. Halogen free, low smoke (OHLS) cables with copper conductors to be used wherever possible.
Power factor correction equipment to be incorporated to achieve at least 0.9 lagging or better along with surge protection equipment at relevant main and sub-main distribution switchboards. System resilience provisions to be designed to take account of clinical and business continuity risks and include an N+1 standby generator installation together with local uninterruptible power supply (UPS) and other secondary sources of supply, as necessary. Provision for combined heat and power to be included. The whole of the electrical installation to comply with HTM 06-01, Part A and BS 7671:2008. Tenanted areas to be sub-metered.

Appendix 7 – O
utline specification and design notes
89
ELEMENT AND DESIGN CRITERIA SPECIFICATION NOTES
5H Electrical installations (continued) Total electric load kVA 5H2 Electric power
suppliesLocal isolated power supplies and medical ICT outlets to be provided in accordance with Medical Electrical Installation Guidance Notes (MEIGaN) requirements. Power circuits to be wired in OHLS cable, installed concealed wherever practical, with 30 mA RCBO protected final circuits in compliance with BS 7671:2008. Sub-main electrical circuits to be HRC protected. Accessories and terminal outlets within rooms/areas to be as defined in the relevant HBN/HTM and ADB sheets.
Illumination levels British Standards (BS) lux 5H3 Electric lighting High frequency fluorescent luminaires and low energy lamps to be used with lighting levels in accordance with ADB requirements and Chartered Institute of Building Services Engineers (CIBSE) LG2:2008 guide. CIBSE LG3 and LG7 guide to be applied for areas in which display screen equipment is installed. The lighting design and luminaires to be fit for purpose for the environment in which they are to operate taking into account Disability Discrimination Act (DDA) requirements. Where practical, presence detectors to be installed to automatically switch lighting to reduce levels when areas such as circulation corridors and WCs are not in use.
Capacity of local electricity generation
British Standards (BS) % 5H4 Electric light fittings Fluorescent luminaires of appropriate type and design and fitted with suitable light control diffuser to be used generally throughout the healthcare premises. Tungsten lamps not to be used unless for specific purposes. Luminaires to be sealed and recessed as necessary to meet aseptic condition and aesthetic requirements. External lighting to consist of high pressure sodium discharge luminaires mounted on suitable lamp columns. Infrared night lighting to be provided for CCTV where appropriate.
Capacity for emergency generation
British Standards (BS) % 5H5 Specialist lighting Emergency lighting to be provided in compliance with BS 5266, BS EN 50172 and BS EN 1838, and comprise self-contained maintained and non-maintained luminaires. Surgical and medical examination lamps to be installed where designated on ADB sheets. Overbed lighting for reading purposes to comply with HTM 08-03. External lighting to be installed to provide adequate illumination for roadways, car parking, pedestrian walkways, security CCTV, signage, specialist equipment (e.g. pay and display machines) and entrances to the building in compliance with manufacturers’ recommendations and CIBSE LG2 guidance.
Capacity for uninterruptible power supply
British Standards (BS) % 5H6 Local electric supply UPS systems to be provided as necessary to ensure continuity of local electrical circuits during loss of normal mains supplies and prior to central secondary sources of supply (e.g. emergency standby generators) becoming available. This will include support to systems such as fire alarms, medical gas alarms, telecommunication private branch exchange (PBX), essential ICT equipment, theatre operating lamps, emergency lighting, nurse call systems, security alarm systems etc.

Healthcare Prem
ises Cost G
uides
90 ELEMENT AND DESIGN CRITERIA SPECIFICATION NOTES
5H Electrical installations (continued) Period for
uninterruptible power supply
British Standards (BS) min 5H7 Earthing systems Earth electrodes and equipotential bonding requirements to be provided in accordance with DNO requirements to meet the Electrical Safety, Quality and Continuity Regulations and Electrical at Work Regulations. Main and supplementary equipotential bonding to be compliant with BS 7671:2008. Lightning protection earthing to comply with BS EN 62305.
5I Fuel installations 5I1 Fuel installations Steel tank contained within bund wall to be installed to store boiler and generator fuel oil.
5L Lift and conveyor installations
5J1 Lifts and enclosed hoists
Lifts to comply with HTM 08-02 and relevant British Standards. Bed passenger and service delivery lifts to be provided sufficient to provide adequate transportation of passengers, food and equipment between 2 floors within acceptable time periods. Machine room-less to be considered, where appropriate, installed with control and access provisions taking into account DDA requirements and need for reliable operation. Emergency call facilities to be provided within the lift car linked to a manned staff base. Fire fighting and escape lifts not included.
Lifts – number of passengers
5J2 Escalators Not applicable
Lifts – designed waiting times
5J3 Conveyors Not applicable
Lifts – number, capacity, speed, number of doors and height served
5J4 Dock levellers and scissor lifts
Not applicable
Escalators – rise and travel
5J5 Cranes and unenclosed hoists
Hoists within workshops and plant rooms to be provided to raise/lower equipment as required (2 tonne SWL per room). Mobile hoists to be provided where stipulated on ADB sheets to facilitate the lifting of patients into/from baths or for other defined purposes.
Conveyors – rise and travel
5J6 Car lifts, turntables and the like
Not applicable
Goods lifts, hoists, cranes, dock levellers, scissor lifts, etc – designed load
kN Not applicable
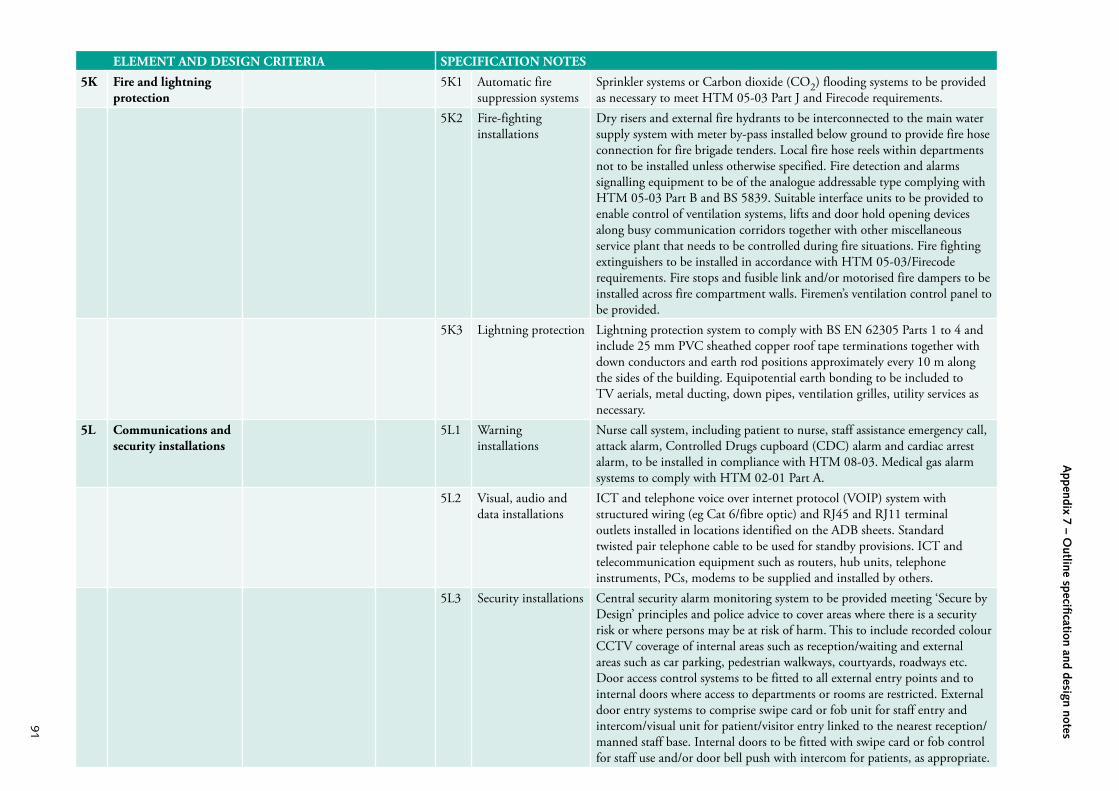
Appendix 7 – O
utline specification and design notes
91
ELEMENT AND DESIGN CRITERIA SPECIFICATION NOTES
5K Fire and lightning protection
5K1 Automatic fire suppression systems
Sprinkler systems or Carbon dioxide (CO2) flooding systems to be provided as necessary to meet HTM 05-03 Part J and Firecode requirements.
5K2 Fire-fighting installations
Dry risers and external fire hydrants to be interconnected to the main water supply system with meter by-pass installed below ground to provide fire hose connection for fire brigade tenders. Local fire hose reels within departments not to be installed unless otherwise specified. Fire detection and alarms signalling equipment to be of the analogue addressable type complying with HTM 05-03 Part B and BS 5839. Suitable interface units to be provided to enable control of ventilation systems, lifts and door hold opening devices along busy communication corridors together with other miscellaneous service plant that needs to be controlled during fire situations. Fire fighting extinguishers to be installed in accordance with HTM 05-03/Firecode requirements. Fire stops and fusible link and/or motorised fire dampers to be installed across fire compartment walls. Firemen’s ventilation control panel to be provided.
5K3 Lightning protection Lightning protection system to comply with BS EN 62305 Parts 1 to 4 and include 25 mm PVC sheathed copper roof tape terminations together with down conductors and earth rod positions approximately every 10 m along the sides of the building. Equipotential earth bonding to be included to TV aerials, metal ducting, down pipes, ventilation grilles, utility services as necessary.
5L Communications and security installations
5L1 Warning installations
Nurse call system, including patient to nurse, staff assistance emergency call, attack alarm, Controlled Drugs cupboard (CDC) alarm and cardiac arrest alarm, to be installed in compliance with HTM 08-03. Medical gas alarm systems to comply with HTM 02-01 Part A.
5L2 Visual, audio and data installations
ICT and telephone voice over internet protocol (VOIP) system with structured wiring (eg Cat 6/fibre optic) and RJ45 and RJ11 terminal outlets installed in locations identified on the ADB sheets. Standard twisted pair telephone cable to be used for standby provisions. ICT and telecommunication equipment such as routers, hub units, telephone instruments, PCs, modems to be supplied and installed by others.
5L3 Security installations Central security alarm monitoring system to be provided meeting ‘Secure by Design’ principles and police advice to cover areas where there is a security risk or where persons may be at risk of harm. This to include recorded colour CCTV coverage of internal areas such as reception/waiting and external areas such as car parking, pedestrian walkways, courtyards, roadways etc. Door access control systems to be fitted to all external entry points and to internal doors where access to departments or rooms are restricted. External door entry systems to comprise swipe card or fob unit for staff entry and intercom/visual unit for patient/visitor entry linked to the nearest reception/manned staff base. Internal doors to be fitted with swipe card or fob control for staff use and/or door bell push with intercom for patients, as appropriate.

ELEMENT AND DESIGN CRITERIA SPECIFICATION NOTES
5M Special installations 5M1 Mechanical and electrical systems
Special mechanical and electrical installations, such as piped medical gas installations, “bleep” paging systems, docking stations for mobile units, bedhead entertainment systems and pneumatic air tube systems, to be installed in accordance with the relevant British Standard, HTM and best practice guidance. Piped medical gas installations to comply with HTM 02-01 complete with local and central display alarm panels and all plant, equipment, piped distribution, and terminal outlets to provide oxygen, nitrous oxide, medical air (400 kPa), surgical air (700 kPa), medical vacuum and anaesthetic gas scavenging plant as necessary to meet ADB requirements. Portable gas facilities provided as Group 3 equipment.
Water and electrical connection for the docking of mobile clinical units to be provided where necessary. Bedhead entertainment systems to be in accordance with HTM 08-03 and include digital TV and radio/music amplification and distribution to bed spaces and key areas such as patient waiting/reception areas where masking of confidential conversations and/or background entertainment is required. Satellite TV and interfacing with the healthcare premises ICT system to be included. Pneumatic air tube systems to comply with HTM 2009. Visual display panels (eg “Jayex” or similar) to provide ‘next patient call’ messages in conjunction with patient call announcements to be installed in main reception/waiting areas as stipulated on ADB sheets.
5M2 Building Management Control installations
A building management system to be provided inclusive of electrical wiring and terminal units to interconnect HVAC and other service plant controlled by the system.
5N Builders’ Work in Connection
5N1 Builders’ Work in Connection
Holes chasings and penetrations provided by main contractor to allow for services to run through the building.
5O Commissioning of services
5O1 Management of the commissioning of services
To British Standards (BS)
6 EXTERNAL WORKS
6A Site works 6A1 Site preparation General site preparation; clearing and disposal of top 300 mm of soil ready for construction.
6A2 Site remediation and decontamination
Excluded (to be included in site-specific works)
6A3 Surface treatments Tarmacadam roads; PCC paving slabs; PCC kerbs and edgings; seeding landscape areas; shrubs and planting works.
6A4 Site enclosure and division
Close boarded timber fencing, gates to service areas.
6A5 Fittings and furniture
External furniture including heavy-duty benches, bins, bollards, cycle stands, smoking shelters etc.
Healthcare Prem
ises Cost G
uides
92
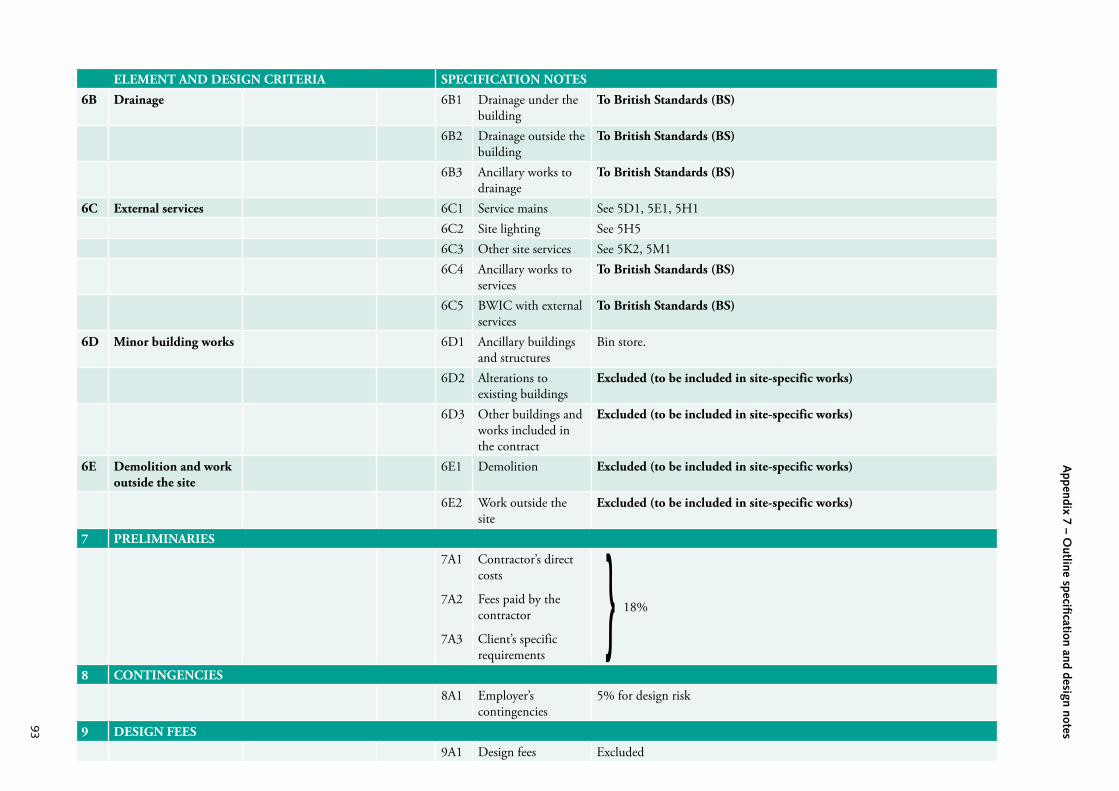
ELEMENT AND DESIGN CRITERIA SPECIFICATION NOTES
6B Drainage 6B1 Drainage under the building
To British Standards (BS)
6B2 Drainage outside the building
To British Standards (BS)
6B3 Ancillary works to drainage
To British Standards (BS)
6C External services 6C1 Service mains See 5D1, 5E1, 5H16C2 Site lighting See 5H56C3 Other site services See 5K2, 5M16C4 Ancillary works to
servicesTo British Standards (BS)
6C5 BWIC with external services
To British Standards (BS)
6D Minor building works 6D1 Ancillary buildings and structures
Bin store.
6D2 Alterations to existing buildings
Excluded (to be included in site-specific works)
6D3 Other buildings and works included in the contract
Excluded (to be included in site-specific works)
6E Demolition and work outside the site
6E1 Demolition Excluded (to be included in site-specific works)
6E2 Work outside the site
Excluded (to be included in site-specific works)
7 PRELIMINARIES
7A1
7A2
7A3
Contractor’s direct costs
Fees paid by the contractor
Client’s specific requirements
18%
8 CONTINGENCIES
8A1 Employer’s contingencies
5% for design risk
9 DESIGN FEES
9A1 Design fees Excluded
}
Appendix 7 – O
utline specification and design notes
93

Healthcare Premises Cost Guides
94
Energy Performance of Buildings Directive
Building Regulations 2000 including amendments and associated approved documents
HMT Green Book (2003 edition)www.hm-treasury.gov.uk/data_greenbook_index.htm
Capital Investment Manual (DH, 1994)www.dh.gov.uk/en/Publicationsandstatistics/Publications/PublicationsPolicyAndGuidance/DH_4119896
Health Building Note 11-01 – ‘Facilities for primary and community care services’ (DH, 2009)
References