health situation in mongolia n.sumberzul m.d., ph.d. u.ganchimeg m.d., mph school of public health,...
TRANSCRIPT

HEALTH SITUATION HEALTH SITUATION IN MONGOLIAIN MONGOLIA
N.Sumberzul M.D., Ph.D.N.Sumberzul M.D., Ph.D.U.Ganchimeg M.D., MPHU.Ganchimeg M.D., MPH School of Public Health, School of Public Health, Health Sciences University of MongoliaHealth Sciences University of Mongolia


Country profile (2004)Country profile (2004)
Territory Territory 1.56 million sq. km 1.56 million sq. km Population Population 2 533 1202 533 120Population in urban areas (%)Population in urban areas (%) 5757Growth rate per 1000 populationGrowth rate per 1000 population 11.6311.63GDP per capita (thousands tugrics)GDP per capita (thousands tugrics) 717.7717.7Poverty rate (%)Poverty rate (%) 31.631.6Adult literacy rate (%)Adult literacy rate (%) 98.9 98.9
Source: MoH (2005) Health indicators 2004. p 104 Enkhtuya.B.and others(2005) Current situation of Mongolian macro economy. Capital Market No.6 (90) 2005., p 5UNFPA (2005) World population 2005. p 102

-200 -100 0 100 200 -200 -100 0 100 200
Age groups
70<
65-69
60-64
55-59
50-54
45-49
40-44
35-39
30-34
25-29
20-24
15-19
10-14
5-9
0-4
+
1989 2000
male malefemale female
Demographic pyramid by age group and sexDemographic pyramid by age group and sex
Source: NSO (2000) Population and household census-2000Source: NSO (2000) Population and household census-2000

Life expectancy at birthLife expectancy at birth 6464
Infant mortality rate per 1000 live birthsInfant mortality rate per 1000 live births 22.8222.82
Under 5 mortality rate per 1000 live births Under 5 mortality rate per 1000 live births 29.1129.11
Maternal mortality rate per 100 000 live birthsMaternal mortality rate per 100 000 live births 98.698.6
Health indicators in 2004Health indicators in 2004
Source: MoH (2005) Health indicators-2004 Source: MoH (2005) Health indicators-2004

The life expectancy at births,in years, both sexes, 1989-2002
56
58
60
62
64
66
68
70
72
741989
1990
1991
1992
1993
1994
1995
1996
1997
1998
1999
2000
2001
2002
years
Kazakhstan Kyrgyzstan Tajikistan
Turkmenistan Uzbekistan Mongolia
Sources: WHO. Health for All Database, European Region; Health sector 2002, MoH, Mongolia

Sources: WHO. Health for All Database, European Region; Health sector 2002, MoH, Mongolia
The life expectancy at birth,in years, both sexes, 1989, 1996 and 2002
58
60
62
64
66
68
70
72
1989
1996
2002

Sources: WHO. Health for All Database, European Region; Health sector 2002, MoH, Mongolia
Infant deaths per 1000 life births, 1985-2002
0
10
20
30
40
50
60
70
80
1985 1990 1991 1992 1993 1994 1995 1996 1997 1998 1999 2000 2001 2002
Kazakhstan Kyrgyzstan Tajikistan
Turkmenistan Uzbekistan Mongolia

Sources: WHO. Health for All Database, European Region; Health sector 2002, MoH, Mongolia
Infant deaths per 1000 live births 1990, 1996 and 2002
26.6930.19
40.41
45.15
34.28
63.42
16.91
21.07
16.57
30.42
0
10
20
30
40
50
60
70
Kazakhstan Kyrgyzstan Tajikistan Turkmenistan Uzbekistan Mongolia
1990
1996
2002

Sources: WHO. Health for All Database, European Region; Health sector 2002, MoH, Mongolia
Maternal deaths per 100000 live births, 1985-2002
0
50
100
150
200
250
300
1985
1990
1991
1992
1993
1994
1995
1996
1997
1998
1999
2000
2001
2002
Kazakhstan Kyrgyzstan Tajikistan
Turkmenistan Uzbekistan Mongolia

Sources: WHO. Health for All Database, European Region; Health sector 2002, MoH, Mongolia
Maternal deaths per 100000 live births, 1990, 1996 and 2002
54.7762.88
41.79 42.2834.12
118
51.9458.41
44.9932.68
124
0
20
40
60
80
100
120
140
160
180
200
1990
1996
2002

Structure of maternal death by level of Structure of maternal death by level of health care service, 2004 health care service, 2004
Soum andintersoum hospital
General hospital ofaimag (province)
Ulaanbaatar
At home
Source: MoH (2005) Health indicators-2004 Source: MoH (2005) Health indicators-2004
38 %
25 %
30 %
7 %

MGNMGN KYRZKYRZ KAZKAZ TURKTURK TAJ TAJ UZBUZB
11
22
33
44
55
MGNMGN KYRZKYRZ KAZKAZ TURKTURK TAJ TAJ UZBUZB
11 2-12-1
22 3-23-2 3-23-2
33 5-35-3 2-32-3
44 +4+4 +4+4 5-45-4
55 1-51-5 4-54-5
Sources: WHO. Health for All Database, European Region; Health Indicators, MoH and National Center for Health Development, 2001 and Health Statistics, National Center for Health Development, 1990-2000
Diseases of the circulatory system
Malignant neoplasm
Injury, poisoning and certain other consequences of external causes
Diseases of the digestive system
Diseases of the respiratory system
Infectious and Parasitic disease
The main causes of deathThe main causes of death
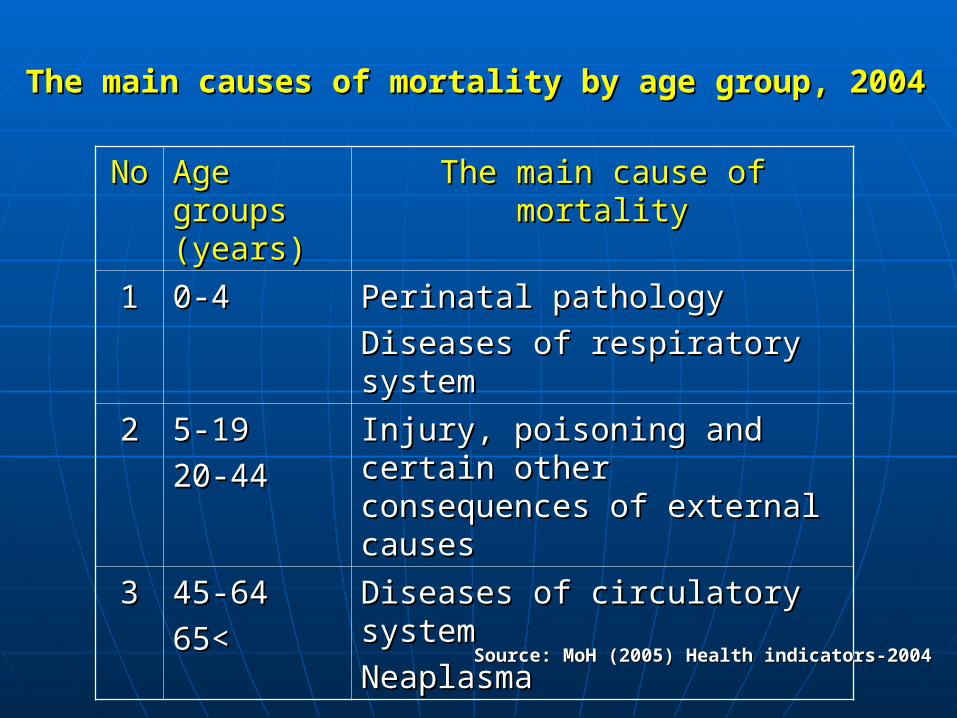
The main causes of mortality by age group, 2004The main causes of mortality by age group, 2004
NoNo Age groups Age groups (years)(years)
The main cause of mortalityThe main cause of mortality
11 0-4 0-4 Perinatal pathologyPerinatal pathology
Diseases of respiratory systemDiseases of respiratory system
22 5-195-19
20-4420-44
Injury, poisoning and certain other Injury, poisoning and certain other consequences of external causesconsequences of external causes
33 45-6445-64
65<65<
Diseases of circulatory systemDiseases of circulatory system
NeaplasmaNeaplasma
Source: MoH (2005) Health indicators-2004 Source: MoH (2005) Health indicators-2004

Causes of malignant neoplasma death, 2004Causes of malignant neoplasma death, 2004
CausesCauses Percentage Percentage Per 10 000 Per 10 000 populationpopulation
Per 10 000 Per 10 000 male male populationpopulation
Per 10 000 Per 10 000 female female populationpopulation
Liver cancerLiver cancer 44.044.0 4.74.7 5.65.6 3.93.9
Stomach cancer Stomach cancer 14.814.8 1.61.6 2.12.1 1.11.1
Lung cuncerLung cuncer 11.711.7 1.21.2 2.02.0 0.50.5
Cervix uteri cancerCervix uteri cancer 7.27.2 0.60.6 -- 0.60.6
Source: MoH (2005) Health indicators-2004 Source: MoH (2005) Health indicators-2004

Structure of death caused by accident, Structure of death caused by accident, injury and certain other consequences of External causesinjury and certain other consequences of External causes
Traffic accident
suicide
killed by others
Other
20.4 %20.4 %
17.1 %17.1 %
14.1 %14.1 %
44.9 %44.9 %
Source: MoH (2005) Health indicators-2004 Source: MoH (2005) Health indicators-2004
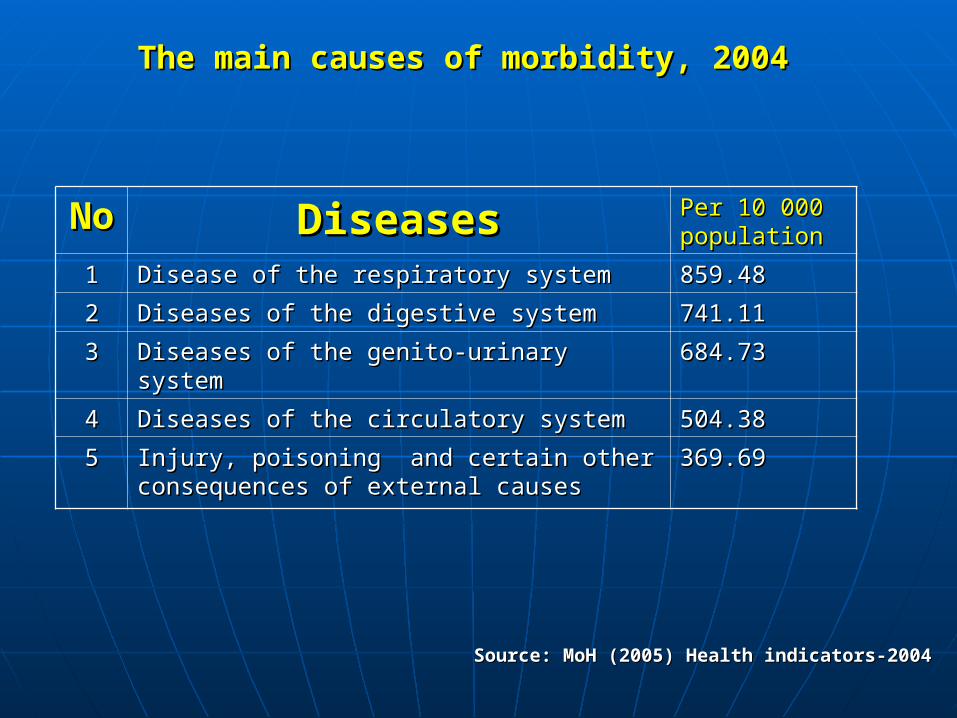
The main causes of morbidity, 2004The main causes of morbidity, 2004
NoNo DiseasesDiseases Per 10 000 Per 10 000 populationpopulation
11 Disease of the respiratory systemDisease of the respiratory system 859.48859.48
22 Diseases of the digestive systemDiseases of the digestive system 741.11741.11
33 Diseases of the genito-urinary systemDiseases of the genito-urinary system 684.73684.73
44 Diseases of the circulatory systemDiseases of the circulatory system 504.38504.38
55 Injury, poisoning and certain other Injury, poisoning and certain other consequences of external causesconsequences of external causes
369.69369.69
Source: MoH (2005) Health indicators-2004 Source: MoH (2005) Health indicators-2004

The main 5 causes of morbidityThe main 5 causes of morbidity (per 10 000 population), 1999-2004(per 10 000 population), 1999-2004
0
100200
300
400500
600
700
800900
1000
1999 2000 2001 2002 2003 2004
Diseases ofrespiratorysystem
Diseases ofgenito-urinarysystem
Injury
Diseases ofdigestive system
Diseases ofcirculatorysystem

The main causes of inpatient morbidity, 2004The main causes of inpatient morbidity, 2004
NoNo DiseasesDiseases Per 10 000 Per 10 000 populationpopulation
11 Diseases of the genito-urinary systemDiseases of the genito-urinary system 353.81353.81
22 Disease of the respiratory systemDisease of the respiratory system 338.10338.10
33 Diseases of the digestive systemDiseases of the digestive system 308.97308.97
44 Diseases of the circulatory systemDiseases of the circulatory system 286.06286.06
55 Diseases of nervous systemDiseases of nervous system 123.09123.09
Source: MoH (2005) Health indicators-2004 Source: MoH (2005) Health indicators-2004

The main registered infectious diseases, The main registered infectious diseases, per 10 000 population (1999-2004)per 10 000 population (1999-2004)
0
510
15
2025
30
35
4045
50
1999 2000 2001 2002 2003 2004
Trichomoniasis
Viral hepatitis
Gonococcal infection
Tuberculosis
Shigellosis
Source: MoH (2005) Health indicators-2004 Source: MoH (2005) Health indicators-2004

National programsNational programs
1. Health Education of Population 1998-20052. Oral Health of Population 2000-20053. Reproductive Health 2002-20064. Reduction of Infectious Diseases 2002-20105. Reduction of Malignant Neoplasm 1997-20056. Physical Strengthening of Population 2002-20087. Prevention from Accident and Injury 2002-20088. Prevention from Iodine Deficiency Disorders 2002-20069. Mental Health 2002-200710.Development of Natural Mineral Water Sanatorium 2003-201011.Soum Hospital Development 2002-200812.Development of Health Technology 2003-2008

Thank you Thank you for your attention.for your attention.