health service provision in kenya: assessing facility capacity, costs of care, and patient...
TRANSCRIPT

Health Service Provision in Kenya: Assessing Facility Capacity, Costs of
Care, and Patient Perspectives
Dr Caroline Kisia
Action Africa Help - International
26th Nov. 2014
Presentation Outline
• Background to the Study
• Study Objectives
• Methodology
• Results
• Conclusions
23-04-19 2

Background to the Study
23-04-19 3
Background• Kenya’s new Constitution – citizens’ right to health
• Devolution of healthcare service provision to Counties
• Limited health care budgets
• Need for evidence to guide policymaking and resource allocation
• Multidimensionality of health system functions
• Comprehensive and detailed assessment of the healthcare system performance rarely occurs
23-04-19 4

Overview of the ABCE Study• A collaborative project between Action Africa Help-
International (AAH-I) and the Institute for Health Metrics and Evaluation (IHME), an independent global health research center at the University of Washington, Seattle
• Launched in 2011
• Funded through the Disease Control Priorities Network (DCPN), a multiyear grant from the Bill & Melinda Gates Foundation
• To comprehensively estimate the costs and cost-effectiveness of a range of health interventions and delivery platforms
• A Multi-country Study allowing for comparisons
23-04-19 5

Objectives of the Study
23-04-19 6

Objectives of the ABCE Study• The ABCE project aimed to
answer the questions of :– What is the Cost of producing
health services?
– Who is Accessing these health services?
– What Bottlenecks exist to health service delivery expansion
– How Equitable is access to health care services?
– What Tools exist for real-time monitoring and tracking health sector growth?
23-04-19 7

Methodology
23-04-19 8

Study DesignSample design
•Stratified random sampling - nationally representative sample of health facilities
Step 1: Counties from which facilities were drawn were initially grouped into 27 and later into 16 unique categories based on their:
•Average malnutrition rates – low, middle and high
•Health expenditures – poor, middle and wealthy
•Population density - rural, semi-dense and dense
Nairobi and Mombasa were automatically included due to their size and relevance to Kenya’s health service provision
18 counties were selected through the county sampling frame
Step 2: Entailed sampling facilities from each selected county across the range of platforms i.e. channels identified as offering health services in Kenya.
254 facilities (excluding DHMTs) were randomly selected through the facility sampling frame
23-04-19 9

Sampling strategy for facilities
Data Collection
• Primary data collection took place from April to November 2012
• Four main data collection mechanisms:1. Existing data
2. ABCE Facility Survey – over 2,600 data elements• District Health Management Teams (DHMTs) received a modified
version of the ABCE Facility Survey.
3. Clinical chart extractions of HIV-positive patients on ART
4. Patient Exit Interview Survey
23-04-19 11

ABCE Facility Survey
• Primary data collection from a nationally representative sample of 254 facilities
• Collected data on a full range of indicatorso Inputs, finances, outputs, supply-
side constraints and bottlenecks, indicators for HIV care
• Randomly sampled a full range of facility typeso National and provincial hospitals,
district and sub-district hospitals, maternity homes, health centers, clinics, dispensaries, VCT centers, drug stores or pharmacies, and DHMTs

Clinical chart extraction• Extracted data on HIV-positive patients currently enrolled in ART
• Chart data included patient demographic information, ART initiation characteristics (e.g., CD4 cell count, WHO stage, drug regimen, referral points), and patient outcomes

Patient Exit Interview Survey
• Over 4,200 structured interviews were conducted with patients after they exited study facilities.
• Questions included • reasons for the facility visit,• satisfaction with services• expenses paid associated with
the facility visit, • For the ART sub-sample HIV-
specific indicators.

Results
23-04-19 15
Facility capacity and service provision
Facility capacity and service provision
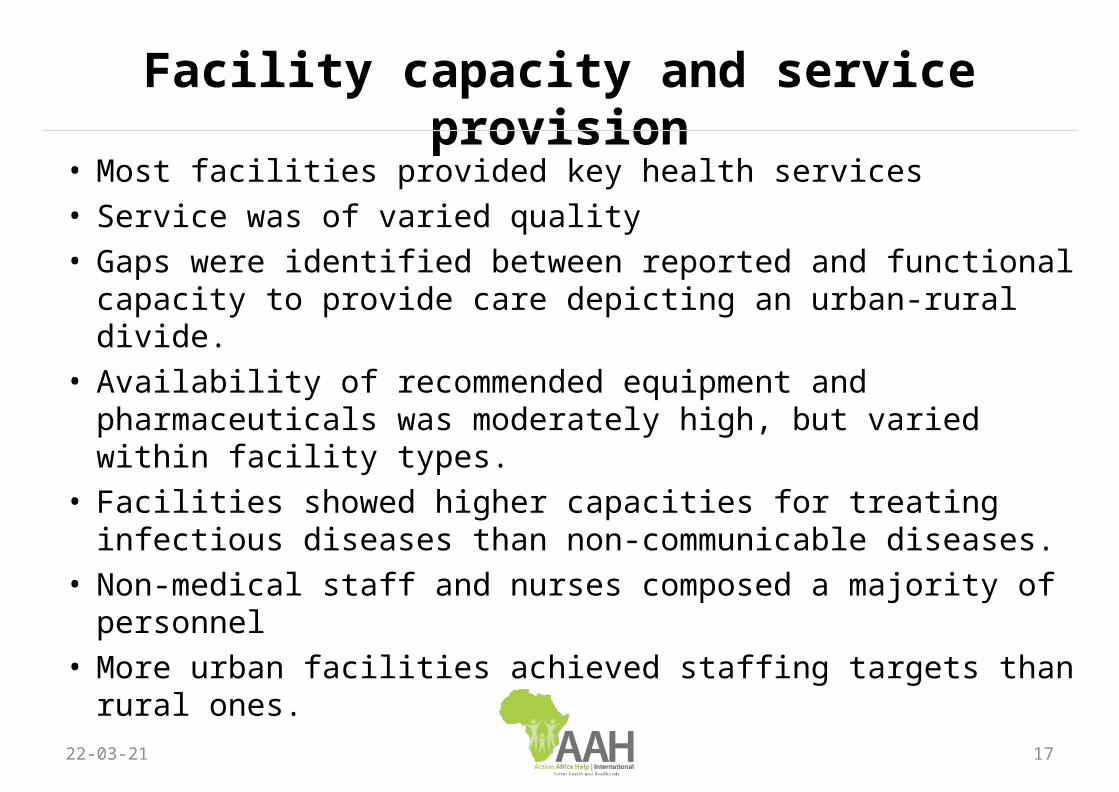
• Most facilities provided key health services
• Service was of varied quality
• Gaps were identified between reported and functional capacity to provide care depicting an urban-rural divide.
• Availability of recommended equipment and pharmaceuticals was moderately high, but varied within facility types.
• Facilities showed higher capacities for treating infectious diseases than non-communicable diseases.
• Non-medical staff and nurses composed a majority of personnel
• More urban facilities achieved staffing targets than rural ones.
23-04-19 17
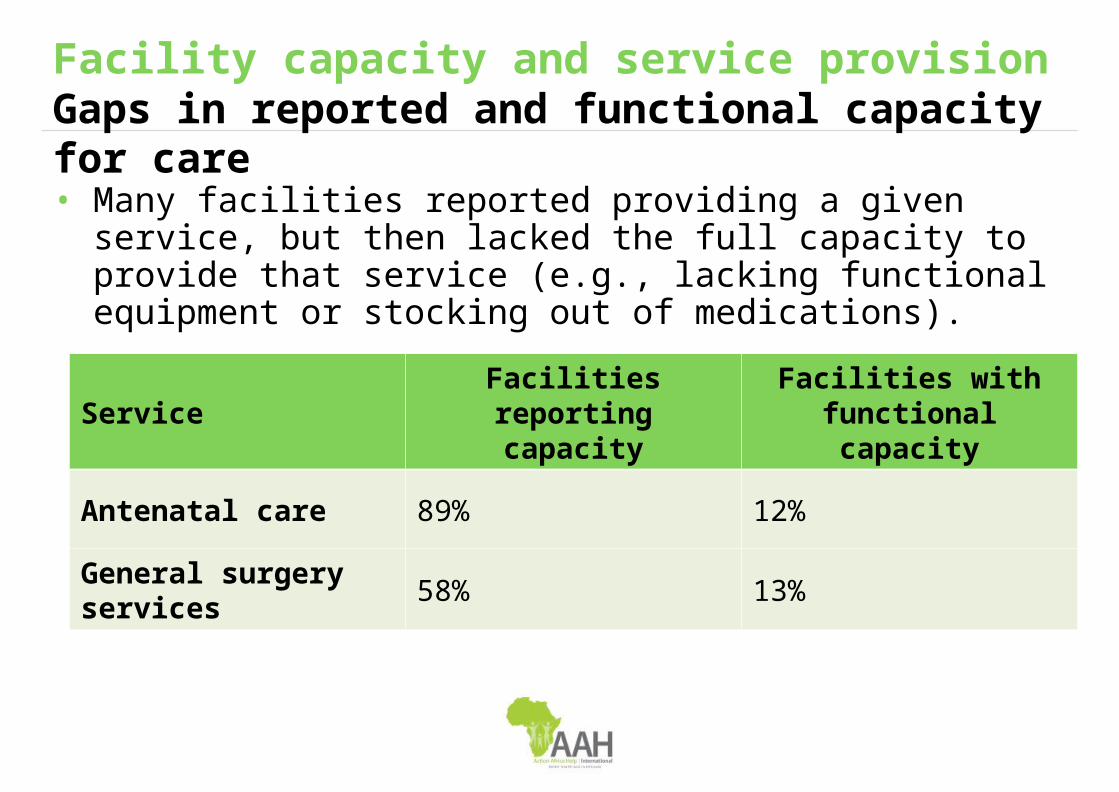
Facility capacity and service provisionGaps in reported and functional capacity for care
• Many facilities reported providing a given service, but then lacked the full capacity to provide that service (e.g., lacking functional equipment or stocking out of medications).
Service Facilities reporting capacity
Facilities with functional capacity
Antenatal care 89% 12%
General surgery services 58% 13%
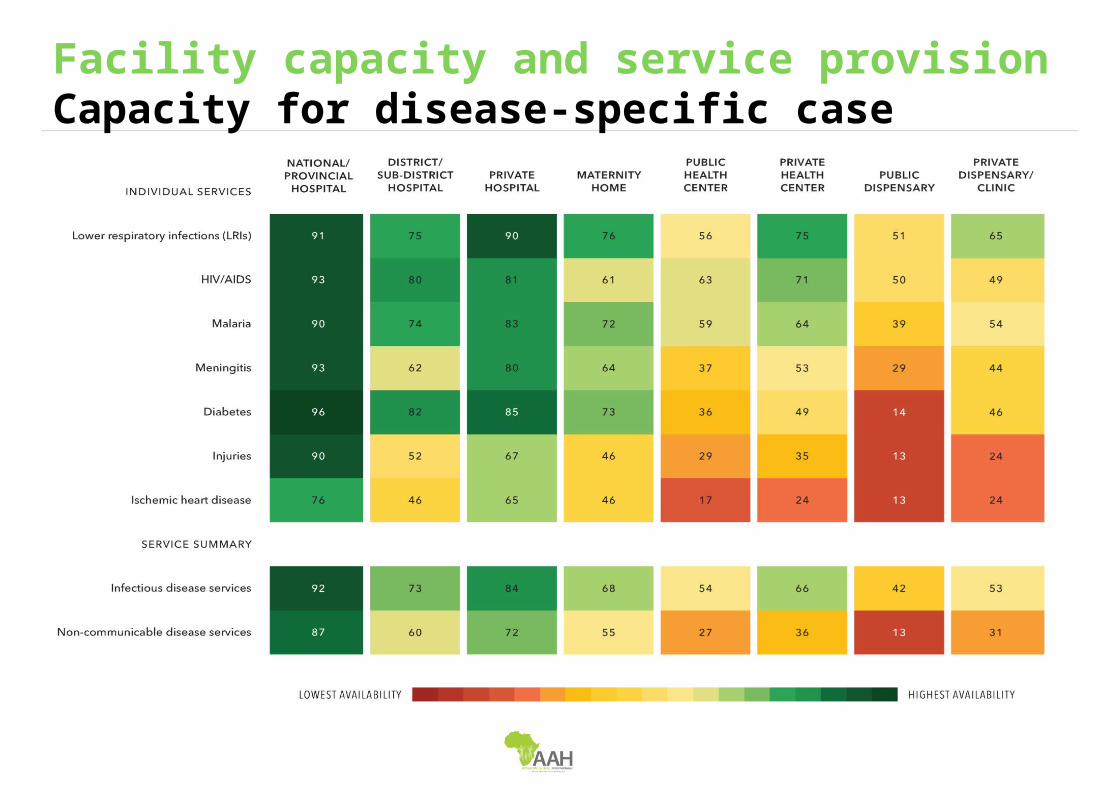
Facility capacity and service provisionCapacity for disease-specific case management
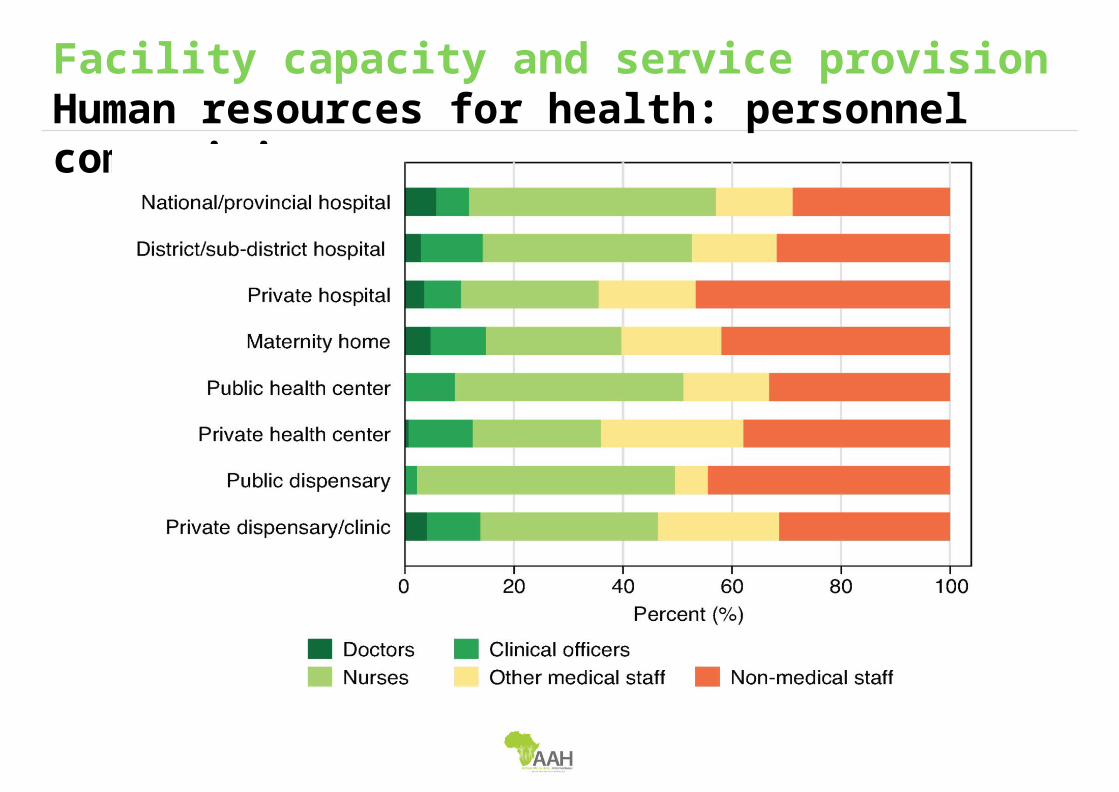
Facility capacity and service provisionHuman resources for health: personnel composition

Facility production of health services
Facility production of health services
• ART patient volumes quickly increased at primary care facilities; other patient visits were more variable over time.
• Medical staff in most facilities experienced low patient volumes each day.
• Facilities showed capacity for larger patient volumes given observed resources.
• ART patient volumes could moderately increase given facility resources, especially for district and sub-district hospitals.
23-04-19 22

Facility capacity and service provisionOutputs: average outpatient visits, by platform, 2007-2011

Facility capacity and service provisionOutputs: average inpatient visits, by platform, 2007-2011

Facility capacity and service provisionOutputs: average ART visits, by platform, 2007-2011

Efficiency and Cost of Care

Efficiency and Cost of Care• Efficiency scores across platforms showed wide heterogeneity,
particularly within the private sector ranging from below 20% to 100%.
• On average, efficiency of public health facilities increased along the levels of care, posting dispensaries at 46% and national and provincial hospitals at 75%.
• In terms of spending, personnel accounted for the vast majority of annual expenditures across facility types.
• On average, facility costs per patient varied markedly across facility types– cost per outpatient visit ranged from KShs 342 at public dispensaries to
KShs 2,825 at national and provincial hospitals.
23-04-19 27

Efficiency and costs of careEfficiency scores across platforms, 2007-2011
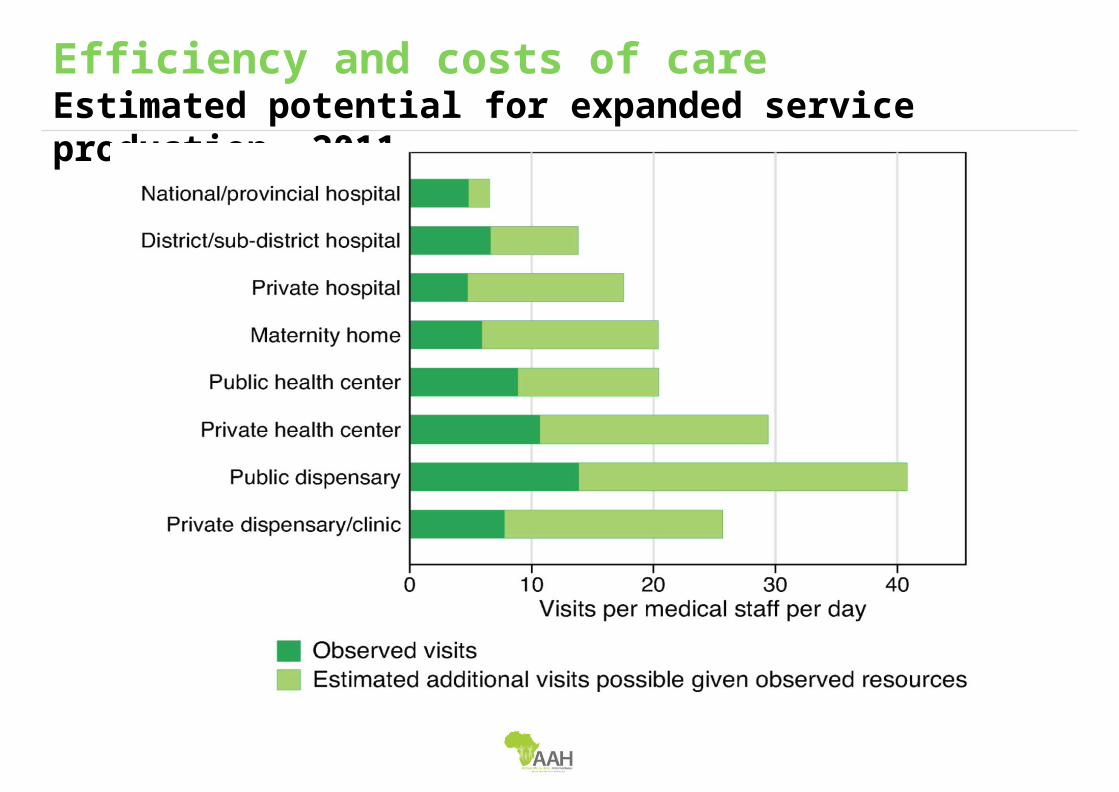
Efficiency and costs of careEstimated potential for expanded service production, 2011

Patient perspectives

Patient Perspectives
• Most non-HIV patients had medical expenses, whereas few ART patients reported paying for care
• Most patients spent less than an hour traveling to facilities, whereas waiting times for care varied more
• Patients gave high ratings for facility providers and slightly lower ratings for facility-based qualities
23-04-19 31

Non-HIV patient perspectivesPatient reports of expenses associated with facility visit, 2012

Percent of patients ‘very likely’ to return to this facility if needing health services in the future
0.2
.4.6
.81
0.2
.4.6
.81
0.2
.4.6
.81
15
915
11
510
12
438
13
023
12
004
13
194
10
903
15
204
13
939
15
288
11
522
16
157
14
555
10
890
15
311
12
618
15
074
10
171
11
740
13
805
14
321
15
739
12
719
11
861
13
663
12
094
12
626
12
255
13
656
15
068
14
897
13
680
12
077
13
625
13
550
15
880
10
974
10
294
11
774
15
946
11
235
11
434
13
014
13
595
15
104
12
413
13
098
11
573
13
011
14
061
11
955
14
139
16
742
10
940
10
438
10
058
12
013
12
643
13
629
14
014
14
098
14
101
15
649
11
472
11
499
15
866
11
995
15
616
15
753
13
006
16
098
15
209
13
517
13
897
13
892
15
197
11
004
11
436
10
829
13
778
13
779
13
239
10
671
14
453
10
878
11
170
14
131
15
312
10
655
12
130
16
463
13
969
11
936
12
521
14
025
10
774
12
179
15
605
16
450
12
995
17
595
14
822
12
512
13
088
15
722
10
979
17
862
13
865
12
979
17
492
11
797
10
938
15
640
10
862
13
017
12
489
13
049
13
821
17
352
14
665
10
907
11
657
10
728
12
371
12
789
13
094
13
481
14
479
16
267
17
517
11
785
11
873
11
676
15
878
16
060
17
555
11
239
15
465
17
743
14
812
16
437
12
393
13
804
14
347
12
722
13
630
12
253
12
274
13
942
17
314
N/P Hosp. Dist. Hosp. SD Hosp.
Priv. Hosp./Maternity Pub. HC Priv. HC/Disp.
Pub. Disp.

Conclusions

Conclusions
• This multidimensional assessment provides a unique perspective on health facility capacity, costs and quality of care.
• The study indicates that there is room to utilize existing capacity to expand healthcare service provision at a relatively low marginal cost.
• Further analyses on this front would provide helpful insights towards Kenya’s aspirations of universal health coverage.
23-04-19 35

Acknowledgements

Acknowledgements
23-04-19 37
• This study was made possible through the efforts of a number of institutions and individuals:– The Institute of Health Metrics and Evaluation/UoW – managing the
ABCE project grant and providing the technical team for the study– Bill & Melinda Gates Foundation for providing funding– The Ministry of Health, Kenya for supporting the study– The 24 Research Assistants who conducted the field work
• The co-authors of the abstract from:• AAH-I (Ms Ann Thuo), • AAH Kenya (Ms Caroline Jepchumba & Dr Githaiga Kamau)• IHME-Africa (Prof. Tom Achoki)

For further information,
below are our contacts
23-04-19 38
FAWE House, Chania Avenue P.O. Box 76598 00508
Nairobi, KenyaMobile: +254 (0) 20 3007755/6
www.actionafricahelp.org