health risk assessment of factory workers in the bottling …
TRANSCRIPT

1
HEALTH RISK ASSESSMENT OF FACTORY WORKERS IN THE BOTTLING
AND BREWING INDUSTRIES IN BENIN CITY, EDO STATE-A COMPARATIVE
STUDY
BY
DR. NYEMIKE SIMEON AWUNOR
DEPARTMENT OF COMMUNITY HEALTH
UNIVERSITY OF BENIN TEACHING HOSPITAL
BENIN CITY, EDO STATE
A DISSERTATION SUBMITTED IN PARTIAL FULFILMENT OF THE
REQUIREMENTS FOR THE PART II FELLOWSHIP EXAMINATION
IN THE
FACULTY OF PUBLIC HEALTH
THE NATIONAL POSTGRADUATE MEDICAL COLLEGE OF NIGERIA
MAY, 2011
2
DECLARATION
I, Dr Nyemike Simeon Awunor, hereby declare that I have written this dissertation titled
HEALTH RISK ASSESSMENT OF FACTORY WORKERS IN THE BOTTLING
AND BREWING INDUSTRIES IN BENIN CITY, EDO STATE – A
COMPARATIVE STUDY being presented under appropriate supervision and that it has
not been submitted in part or in full for any other examination.
________________________________
Dr NYEMIKE SIMEON AWUNOR

3
CERTIFICATION
I testify that the dissertation titled HEALTH RISK ASSESSMENT OF FACTORY
WORKERS IN THE BOTTLING AND BREWING INDUSTRIES IN BENIN
CITY, EDO STATE – A COMPARATIVE STUDY was written by the candidate
under my supervision.
_____________________________
Supervisor
PROFESSOR (MRS) E.C ISAH
MBBS, M.Sc., FMCPH, FWACP
PROFESSOR/CONSULTANT
DEPARTMENT OF COMMUNITY HEALTH
UNIVERSITY OF BENIN/ UNIVERSITY OF BENIN TEACHING HOSPITAL
____________________________________
Head of department
DR (MRS) V.O OMUEMU
MBBS, MPH, FMCPH
SENIOR LECTURER/ CONSULTANT
DEPARTMENT OF COMMUNITY HEALTH
UNIVERSITY OF BENIN/ UNIVERSITY OF BENIN TEACHING HOSPITAL

4
DEDICATION
Firstly, this work is dedicated to the immortal, invincible and only wise God who makes
all things beautiful in His time.
Secondly, this work is dedicated to factory workers in all industries in Nigeria who
represent a silent majority and whose powers if effectively harnessed could leapfrog our
nation from a third world to a first world country and achieve the much vaunted vision
20:20:20.

5
ACKNOWLEDGEMENTS
I thank my supervisor, Prof. (Mrs) E.C. Isah for her time and painstaking attention to
detail in supervising this work, I remain grateful for the mentorship, ma. I thank my head
of department Dr (Mrs) V.O. Omuemu for her subtle guidance, steady concern and
uncommon concessions during the course of this work.
I am very grateful for the direction shown to me by Prof. (Mrs) Obehi H. Okojie
especially with regards to health risk assessments and mentorship through the years. I
sincerely appreciate my teachers Dr J.C. Chiwuzie, Dr (Mrs) A.N. Ofili, Dr A.O.
Adeleye, Prof. V. Wagbatsoma, Chief (Dr) S.U. Ighedosa for the training I have received
and have continued to receive from them.
I thank Dr A.R. Isara and Dr V.Y. Adam for their continued insistence on adherence to
time lines and standards. I thank them for their incisive comments and ready critique at
every stage of this research. I appreciate the contribution of Drs A. Okoh, E. Tobin, G.
Eze, S. Rotifa, R. Ibekwe, P. Okeowo and all the resident doctors in the Department of
Community Health UBTH, Benin City to this work.
I thank Dr Bright Oniovokurkor, Dr Richard Agabielesin, Mr Mathew Aigbukor and Mr
Ogaga Ajakpovi for their ready assistance on the field. To my industrial hygienist Mr
Greg Onaiwu of the Edo Environmental Laboratory and my research assistants Messrs Y.
Adeboye, S. Adebayo, A. Awoyomi, I. Ogunboye and S. Amodu, thank you for the co
- operation in getting things done, properly.
To my parents Engr. and Mrs E.S.O. Awunor, my in – laws Prof. and Mrs E.U. Nwa, I
thank you for the heritage of a good education. To my wife, Ido and daughter, Faith, I
thank you both for the understanding and support through this project.
Finally and most importantly to God be the glory for granting me the grace to conduct
this research.

6
TABLE OF CONTENTS
Declaration ii
Certification iii
Dedication iv
Acknowledgements v
Table of Contents vi
List of Tables vii
List of Figures ix
List of Appendices x
List of Abbreviations xi
Definition of Terms xii
Abstract xiv
CHAPTER ONE
Introduction 1
CHAPTER TWO
Literature Review 8
CHAPTER THREE
Materials and methods 21
CHAPTER FOUR
Results 34
CHAPTER FIVE
Discussion, conclusion and recommendations 77
References 91
Appendices

7
LIST OF TABLES
Table 1: Socio-demographic characteristics of respondents 34
Table 2: Qualitative risk assessment in the beverage industries 37
Table 3: Environmental monitoring of noise and particulate concentration in
air
39
Table 4: Self reported occupational injuries among respondents in the past 12
months
41
Table 5: Prevalence and frequency of occupational injuries among
respondents
42
Table 6: Self reported notifiable injury among injured respondents 47
Table 7: Cigarette smoking among respondents 48
Table 8: Alcohol habit of respondents 49
Table 9: Frequency of intake of alcohol by respondents 50
Table 10: Respondents’ involvement in sporting activity 51
Table 11: Pre – employment medical examination 52
Table 12: Periodic medical examination 53
Table 13: Respondent who were being treated for hypertension or diabetes
mellitus
54
Table 14: Body mass index (BMI) of respondents 55
Table 15: Blood pressure of respondents 56
Table 16: Random blood glucose of respondents 57
Table 17: Multiple correlations of age, BMI, BP (systolic), BP (diastolic) and
random blood glucose of respondent in the bottling industry
58
Table 18: Multiple correlations of age, BMI, BP (systolic), BP (diastolic) and
random blood glucose of respondent in the brewing industry
59
Table 19: Knowledge and practice of personal protective equipment use by
respondents
60
Table 20: Training in correct use of personal protective equipments by
respondents
62
Table 21: Difficulty using personal protective equipments by respondents 63
Table 22: Frequency of use of personal protective equipments by respondents 64
Table 23: Respondents opinion on the use of personal protective equipments as
necessary
65

8
Table 24: Responsibility for prevention of accidents in the workplace 66
Table 25: Health and safety training at work 67
Table 26: Frequency of health and safety trining for respondents at work 68
Table 27: Knowledge of health and safety committee in the industry by
respondents
69
Table 28: Practices of occupation health and safety by respondents 70
Table 29: Socio demographic characteristics and practice of occupational
health and safety among respondents in the bottling industry.
71
Table 30: Socio demographic characteristics and practice of occupational
health and safety among respondents in the brewing industry.
72
Table 31: Satisfaction with presently assigned job 73

9
LIST OF FIGURES
Figure 1: Part of the body where injury occurred to respondents 43
Figure 2: Type of injury to respondents 44
Figure 3: Cause of injury to respondents 45
Figure 4: Period of the day when injury occured to respondents 46
10
LIST OF APPENDICES
Appendix I: Questionnaire
Appendix II: Observational checklist
Appendix III: In depth interview guide
Appendix IV: Ethical clearance certificate
Appendix V: Letters of introduction to the industries
Appendix VI: Reminder letters to the industries
Appendix VII: Health screening slip
Appendix VIII: Result of noise and Particulate in air survey
Appendix IX: Occupational injury prevalence and frequency rates
Appendix X: Instruments used in the study
Appendix XI: Pictures of environmental monitoring

11
LIST OF ABBREVIATIONS
BLS- Bureau of Labor Statistics
BOHS- Basic Occupational Health Services
FMOH- Federal Ministry of Health
HSE- Health and Safety Executive
ILO- International Labour Organisation
NIOSH- National Institute for Occupational Safety and Health
OHS- Occupational Health and Safety
OR – Odd’s ratio
OSHA- Occupational Health and Safety Administration
PET- Polyethylene terephthalate
PPE- Personal Protective Equipment
WHO- World Health Organisation
12
DEFINITION OF TERMS
Accident: an unplanned, unexpected event in a sequence of events that occur through a
combination of causes. It results in physical harm (injury or disease) to an individual,
damage to property, a near miss, a loss, business interruption or any combination of these
effects.
Beverage: any type of drink except water.
Factory: any premises in which or within the close or cartilage or precincts of which one
person is or more persons are employed in any process for or incidental to any of the
following purposes namely;
(a) The making of any article or part of an article; or
(b) The altering, repairing, ornamenting, finishing, cleaning, or washing, or the breaking
up or demolition of any article; or
(c) The adapting for sale of any article16.
Hazard: a substance, agent or physical situation with a potential for harm in terms of
injury or ill health, damage to property, damage to the environment or a combination of
these.
Large scale industry: an industry comprised of greater than 1000 employees4.
Medium scale industry: an Industry comprised of 51-1000 employees
Notifiable accidents: accidents that result in loss of working capacity of at least one
worker for three days or more.
Occupational disease: is a disease contracted as a result of an exposure over a period of
time to risk factors arising from work activity.
Occupational health: is the discipline that promotes the physical, mental and social
well being of man in the work place by ensuring anticipation, evaluation and control.
Occupational injury: any personal injury resulting from an occupational accident.

13
Risk: it is the probability that a particular adverse event occurs during a stated period of
time.
Risk assessment: is the qualitative and quantitative assessment of the likelihood of
adverse effects that may result from exposure to specified health hazards.
Safety: is to be free from danger or situations that can cause harm or injury.
Small scale industry: an industry comprised of 50 employees or less.

14
ABSTRACT
INTRODUCTION: The International Labour Organisation states that 80% of
occupational injuries worldwide are largely preventable if available health and safety
interventions are carried out. Factory workers in the beverage industries are particularly
exposed to occupational hazards, injuries and work related diseases.
OBJECTIVE: The objective of this study was to assess the health risk of factory
workers and compare between the bottling and brewing industries in Benin City, Edo
State.
MATERIALS AND METHOD: A comparative cross sectional analytical study was
carried out in Benin City, Edo State. Two hundred and one respondents in the bottling
industry and 148 respondents in the brewing industry participated. This study was
conducted using researcher administered questionnaires, an observational checklist for
the workplace and an in-depth interview guide for the human resources officers. Data
was analysed using SPSS version 16.0, STATCALC and PEPI software version 4.4.
RESULT: The mean age of respondents was 30.2 ± 7.9 years in the bottling industry and
39.8 ± 12.2 years in the brewing industry (t = 8.91, p = 0.000, 95% CI = 7.48 – 11.71). A
majority of respondents in the bottling ( 94.7%) and brewing industries ( 90.5%) were
male, while the mean duration of employment was 4.8 ± 3.4 and 11.31 ± 9.6 years (t =
8.89, p = 0.000, 95% CI = 5.07 - 7.95) in the bottling and brewing industries respectively.
Mechanical hazards were the major hazard identified in both Industries. The mean level
of noise was within the permissible exposure limit of < 90dBA at 75.5 ± 12.1 dBA in the
bottling industry and 72.2 ± 12.1 dBA in the brewing industry, the mean particulate
concentration in air was within the permissible exposure limit of < 0.25mg/m3 at 0.01 ±
0.01mg/m3 in the bottling industry and 0.02 ± 0.01mg/m3 in the brewing industry. The
prevalence of self reported occupational injuries in the industries per 1000 workers per

15
year was 263 in the bottling and 506 in the brewing industries. The prevalence of
hypertension, diabetes mellitus and obesity were 26.4%, 0.01% and 5.5% respectively in
the bottling industry, and 30.4%, 2.7% and 12.1% in the brewing industry. The
proportion of respondents with a good practice of occupational health and safety ( OHS
) was 74.1% in the bottling industry compared to 16.9% in the brewing industry.
Generally, while the practice of OHS in the brewing industry was poor, it improved with
increasing age, being married, increasing duration of employment and increasing level of
education of respondents. There were no such associations seen in the bottling industry.
Workers in the brewing industry did not receive safety training in the preceding 12
months unlike workers in the bottling company. The use of PPEs was better among
workers in the bottling industry and most respondents in the bottling industry had a pre –
employment medical examination (OR = 1.99, 95%CI =1.26 – 3.13).
CONCLUSION: Hazards identified, mainly mechanical hazards, were similar in both
Industries even though the mean level of noise and particulate concentration in air were
within the permissible exposure limits. The prevalence of self reported occupational
injuries was higher in the brewing industry so also was the prevalence of hypertension,
diabetes mellitus and obesity. The practice of OHS was good in the bottling industry but
poor in the brewing industry.
RECOMMENDATIONS: Regular safety programmes and training should be instituted,
health risk assessments and medical examinations should be the norm, adequate PPEs
should be provided for workers especially in the brewing Industry and regular inspection
carried out by the factories inspectorate of the Ministry of Labour and Productivity.
Key words: Risk assessment, beverage industries, health, safety.
CHAPTER ONE

16
INTRODUCTION
A landmark in the field of occupational health was achieved in 1950 by the report of the
first joint WHO/ILO committee on occupational health in which the purpose of
occupational health and its definition was stated as follows1:
“Occupational health should aim at the promotion and maintenance of the highest degree
of physical, mental and social well being of the workers in all occupations; the prevention
among workers of departures from health caused by their employment, from risks resulting
from factors adverse to health: the placing and maintenance of the worker in an
occupational environment adapted to his physiological equipment and, to summarise; the
adaptation of work to man and each man to his work. The main focus in occupational
health is on three different objectives;(1) the maintenance and promotion of workers’
health and working capacity, (2) the improvement of working environment and work to
become conducive to safety and health and (3) development of work organizations and
working cultures in a direction which supports health and safety at work and in doing so
also promotes a positive social climate and smooth operation and may enhance productivity
of the undertakings. The concept of working cultures is intended in this context to mean a
reflection of the essential value systems adopted by the undertaking concerned. Such a
culture is reflected in practice in the managerial systems, personnel policy, principles for
participation, training policies and quality management of the undertaking”1.
The practice of occupational health remains grateful to such notables as Bernadino
Ramazzini (1633-1714), the Italian physician who is regarded as the father of occupational
health. He wrote the famous treatise “De Morbis Artificum Diatriba” which was the first
systematic study of trade diseases2. He also stated the need to elicit the occupation of
patients when taking a good history stating that a doctor treating commoners should
enquire about their jobs. Percival Pott, a Briton, established the link between chimney

17
sweeping and cancer of the scrotum in these sweeps. Lord Anthony Ashley Cooper (1801-
1885) who as a member of the British parliament helped to promote legislation which
reduced the hours of work and improved the conditions of work of women and young
persons employed in mines, factories and other workplaces. Sir Thomas Morrison Legge
(1863-1932) was an English physician who introduced the idea of notifying occupational
diseases especially lead. He also stressed a number of preventive aspects of occupational
health practice known as the Legge’s aphorisms3 and which are still relevant today namely:
1. “Unless and until the employer has done everything – and everything means a great deal -
the workman can do next to nothing to protect himself, although he is naturally willing
enough to do his share”.
2. “If you can bring an influence to bear external to the workman - that is one over which he
has no control - you will be successful; and if you cannot or do not you will never be
wholly successful”.
3. “Practically all industrial lead poisoning is due to the inhalation of dust and fume, and if
you stop their inhalation you stop their poisoning”.
4. “All workmen should be told something of the danger of the material with which they
come into contact, and not be left to find it out for themselves - sometimes at the cost of
their lives”3 .
He was appointed the first British medical factory inspector in 1898.
Industrialization is a significant marker of development from an agrarian society to a
developed society. The 18th century was marked by remarkable progress in inventions and
innovations to improve remarkably the productive forces of western nations and
developments in occupational health followed this trend of Industrialization4. The
expansion of multinationals and the need for sustainable development has led to the
establishment of industries in the developing nations like Nigeria to further reduce the cost

18
of production and serve as a source of employment for the indigenes. This is particularly so
for the bottling and brewing industries. The transfer of technology has contributed to an
increase in machinery and productivity which has also introduced new hazards; dangerous
processes, continuing use of chemicals of which the toxicity is not fully known, heat, noise,
and vibration, paced or repetitive work, night and shift work and occupational stress 4.
Though a number of developing countries are rapidly industrializing, occupational health
and safety facilities are often very limited and in some cases nonexistent. The World Health
Organisation (WHO) states that of the total 3 billion workers in the world more than 80%
work and live without having access to occupational health services5,6. Developing
countries are often recipients of technology transfer from developed countries and some
multinationals which are well established in developed economies have large factories in
developing countries expected to follow international standards of occupational safety and
health. Some of these industries which have difficulties operating in countries with
stringent occupational health and safety legislation may “export” quite hazardous
operations to developing countries with weak legislation and enforcement, thus
occupational hazards, injuries and illnesses remain a concern in the bottling and brewing
industry7.
1.1 STATEMENT OF THE PROBLEM
Occupational injuries and illnesses though largely preventable, unnecessarily affect the
health of the working population and have effects on the work productivity, economic and
social well being of workers, their families, and society8.
The beverage industry is a substantial employer of labour, with a number of bottling and
brewing industries located in Nigeria, there is currently no published data on injury and
illness rates specific to the beverage industry, there is also a paucity of research literature

19
published on the beverage industry in Nigeria. Data from the United Kingdom (Health
and Safety Executive) and United States of America (Bureau of Labor Statistics), however,
show a high level of reported injuries in the bottling and brewing industries. In the United
Kingdom the incidence rates of reported injuries per 100 000 employees for 1996/97 were
3521 in the brewing industry and 1166 in the bottling industry9-12 . In the United States, the
bottling industry’s 1990 injury and illness rate of 21.5% was well above the 13.2% in
manufacturing as a whole13.
Surveillance of workers’ health in developing countries like Nigeria should not be limited
to occupational diseases but also the general diseases of the working population3,6. This is
because the main health problems of the workers may not be occupational but the general
communicable and non communicable diseases of the populace5. The workplace, by
ensuring early detection and treatment for these diseases, can thus be seen as an avenue to
promote workers’ health.
The presence of occupational health and safety legislation without adequate enforcement
and penalties guarantees neither safe work practices nor proper work environment in these
factories. In spite of the existence of the 2004 factories act and labour laws14-17 with
seemingly appropriate legislative provisions, they do not appear to have had made much
impact primarily due to the shortage of trained factory inspectors thereby making
enforcement of the law impracticable. In 2006 there were 5,888 registered factories in the
country, but only 39 inspectors for the Factories Inspectorate of the Ministry of Labour and
Productivity. This number is grossly inadequate to cope with the demands of the job18. In
the Ministry of Health, the occupational health unit, formerly a full division, is presently
lumped with the Non Communicable Disease (NCD) and Neglected Tropical Disease
(NTD) programmes to form a division, and is ill equipped to carry out effective

20
occupational health duties. There is little synergy between the Ministry of Health and the
Ministry of Labour and Productivity on occupational health and safety matters. This lack of
co-operation and use of available competencies further lowers the level of occupational
health and safety regulation and enforcement in the country. Nigeria is yet to have a clear
health and safety policy produced and widely circulated like developed countries such as
the United Kingdom12 and Australia19. An occupational health and safety bill has not yet
been passed by the legislative houses even when Industry regulation is inadequate.
Presently in Edo State, there is only one factory inspector covering the entire state18.
Most government owned Industries are not as effectively run as privately owned, multi
national, industries delivering similar products. A reason for this could be the ”for –
profit” motive of privately owned companies and competition in the marketplace to deliver
world class products. The need for International Organisation for Standardisation (ISO)
certification in some industries would demand meeting up to best practices in health and
safety. Bureaucratic bottlenecks with a sometimes poor response to competition by
government owned industries could also have an effect on establishing effective health and
safety programmes for the workers. Indeed a major reason accounting for differences in
outcome on productivity and safety could be the type of ownership of these industries4.
1.2 JUSTIFICATION OF THE STUDY
Occupational hazards, injuries and illnesses are a significant health problem and there is a
paucity of studies in Nigeria specific to beverage industry20 - 22. This study will help to
determine the prevalence of occupational injuries among the factory workers and the injury
prevention strategies available to them, thus providing baseline data for further research.
With the prevalence of diabetes mellitus as 2.2%23and the prevalence of hypertension at
10-12%24 of the general population in Nigeria; the level of awareness, screening and
control of these non communicable diseases among workers is an important health

21
promotional activity25. A health risk assessment in the beverage industry will help to
establish the prevalence of these work related diseases and serve as a guide in designing a
relevant workplace health promotion programme where none is currently available7.
This study will also help to determine the level of practice of factory workers towards
occupational health and safety in order to ascertain the determinants of safety behaviour
among them26, Information collected could then be useful in planning and allocation of
healthcare resources for the promotion of the health of the working population.
A study of this nature can facilitate in ascertaining the level of compliance in the industry
with the provisions of the 2004 factories Act in the area of health, safety and welfare17 , It
can also help in developing an appropriate protocol for workplace hazard control and
Basic Occupational Health Services (BOHS) in the beverage industries5.
1.3 RESEARCH QUESTIONS
This study will attempt to answer the following questions
1. What are the Identified hazards in the beverage industries? Is the mean level of noise (<
90dBA) and particulate in air (<0.25mg/m3) within the permissible exposure limit of the
Federal Ministry of Environment?
2. What is the prevalence of occupational injuries and illnesses in the bottling and brewing
industries in Benin City, Edo State? What factors are responsible for any observed
difference? Could it be attributable to the type of ownership of the industries or differences
in socio – demographic characteristics of respondents?
3. Is there any difference in practice of occupational health and safety among workers in the
bottling and the brewing industries in Edo State? What factors are responsible for any
observed difference? Could it be attributable to the type of ownership of the industries or
differences in socio – demographic characteristics of respondents?
1.4 OBJECTIVES OF THE STUDY

22
1.4.1 GENERAL OBJECTIVE
To compare the health risks to which factory workers are exposed in the bottling and
brewing Industries in Benin City, Edo state.
1.4.2 SPECIFIC OBJECTIVES
1. To determine and compare the magnitude of occupational hazards, injuries and illnesses in
the bottling and brewing industries.
2. To determine and compare the level of noise and particulate in the air that factory workers
are exposed to in the bottling and brewing industries.
3. To compare the practice of occupational health and safety among the factory workers in the
bottling and brewing industries.

23
CHAPTER TWO
LITERATURE REVIEW
The beverage industry is made up of two broad categories and eight subgroups7. The non
alcoholic beverages make up the first category which comprise soft drink syrup
manufacture, soft drink and water bottling and canning, fruit juices bottling, canning and
boxing, the coffee industry and the tea industry. The alcoholic beverages which are the
second category include distilled spirits, wine and brewing. The workforce in this industry
range from low income unskilled individuals involved in the process of harvesting raw
materials to skilled educated individuals involved in automated and mechanized processes.
2.1 OCCUPATIONAL HAZARDS IN THE BEVERAGE INDUSTRY
Occupational hazards in the bottling and brewing industry are encountered from the point
of production, during storage or following distribution of the product. The bottling and
brewing industries are largely dependent on automation with some level of manual
handling and coupling of highly mechanized processes with repetitive motion of the
workers. Workers are thus exposed to ergonomic, mechanical, physical, chemical,
biological and psychosocial hazards 27-28. These increased workplace hazards predispose
factory workers to increased workplace morbidities and mortalities.
Mechanical hazards in the beverage industries would include falls from slippery floors with
water and other liquids, cuts, bruises and punctures from splinters of wood, broken glass
and flying glass by workers on the factory floor during production. Injuries from confined
spaces which could occur during cleaning and maintenance functions, crushing injuries
from forklift and loading accidents, repetitive motion injuries which can occur among
palletizers, sorters, crushers and driver - sales workers. Workers on the factory floor are at
24
risk of burns, electric shock and fire hazard. Eye strain could also occur among empty and
full sighters11.
Physical hazards in the beverage industries would include noise, being a highly automated
industry a lot of noise is generated by machinery along the production line, this is
irrespective of efforts at damping and sound proofing. The use of metallic cask in the
brewing industry can cause some noise in such casks and boilers. A challenge for
manufacturers in Nigeria, of which the beverage industries are not exempt, is to provide
alternative sources of power due to inadequate supply from the Power Holding Company of
Nigeria. A lot of noise arises from such industrial generating plants and in most cases it is
the highest single source of noise in the industry. Noise is one of the most common of
occupational hazards in the brewing and bottling industry which could arise from
generating plants and the production processes such as casking/ kegging, decrating and
washing, bottling, canning and packaging machinery29,30. Modern automated bottling plants
generate a considerable volume of noise and the effect of noise exposure can range fom
being annoying, to fatiguing and to downright damaging to the ear. This noise can be
reduced by the introduction of mechanical handling by pallets. It is important that noise is
controlled to reduce the incidence of noise induced hearing loss amongst the workers in the
industry. Nations have their permissible exposure limits (PEL) that have been set for noise
in an eight hour work period. In the United Kingdom it is 85 dBA, in the United States of
America it is 90dBA, in Nigeria it is 90dBA31-33. Noise levels in many work area in the
beverage industry range from 85 to over 90 dBA. The major potential hazard associated
with exposure to noise lies in the possibility of producing noise induced hearing loss.
Noise induced hearing loss is the most well known effect of noise, other detrimental effects
of noise include tinnitus (ringing in the ears), interference with speech communication and

25
with the perception of warning signals, disruption of work performance, annoyance and
extra-auditory effects. The severity of hearing loss is thus dependent on the noise levels in
the workplace, duration of exposure and the individual’s personal susceptibility. Noise
induced hearing impairment is very common but it is often under reported because there
are no visible effect and in most cases no pain. Protecting the workers hearing under most
circumstances should protect against most other health effects of noise32.
The permissible exposure limit (PEL) of noise define the threshold over which workers
are required to be provided with and to wear hearing protection such as ear plugs and ear
muffs while at work. Environmental monitoring entails the measurement of air borne
concentration of working substances in the air. Environmental monitoring of noise can thus
be achieved by a sound survey using a sound level meter or by personal monitoring of the
workers using dosimeters. This gives an estimate of the background exposure of workers
to the hazard in the atmosphere, the location in which the noise hazard is at its highest and
with time help to evaluate the environmental control measures put in place in the industry.
Ear plugs (inserted into the ear canal) and ear muffs (covering the external ear) are personal
protective equipment that can be useful in reducing the impact of excessive noise in the
workplaces. Audiometry is the medical test used to identify and characterize workers with
various degrees of hearing loss and should be part of test to be done for susceptible
workers in a periodic medical examination30.
In a study33 on industrial employees exposure to noise in sundry processing and
manufacturing industries in Ilorin metropolis Nigeria a mineral crushing mill, a soft drink
manufacturing industry, a beer brewing and bottling industry, a tobacco making industry
and a mattress manufacturing Industry were studied. Emphasis was on the noise emitted by
individual machinery from the selected industries. Findings showed that hammer mill
26
machine from mineral crushing mill produced the highest average noise 98.4dB(A), electric
generator from beer brewing and bottling industry 97.7dB(A), electric generator from soft
drink bottling industry 95.6dB(A), electric generator from mattress making industry
94.1dB(A) and vacuum pump from tobacco making industry 93.1dB(A). the highest and
lowest average noise exposure levels were recorded in the mineral crushing mill
93.16dB(A) and mattress making industry 84.69dB(A) respectively. There was a
significant difference (p<0.05) in noise levels in the industries surveyed. The percentages
of machines emitting noise above FEPA and OSHA recommendation (90 dB(A)) were:
minerals crushing mills (87.5%), soft drink bottling industry (83.3%), tobacco making
industry (71.4%), beer brewing and bottling industry (42.9%), and mattress making
industry (11.1%). In the past 20 years, the noise levels in soft drink bottling industry
reduced by 0.58 dB(A) and that of beer brewing and bottling industry reduced by 9.66
dB(A). But that of mattress making industry increased by 2.69 dB(A). On the average, the
noise level in these industries had reduced by 2.52 dB(A). Temperature variation in the
factory floor can also be a problem as excessive heat can be generated in some lines such as
the PET line if there is inadequate air conditioning giving rise to discomfort, increased
irritability and fatigue to the worker. Where the factory floor is poorly lit there is an
increased need for workers to strain their eyes and they are thus prone to more accidents.
Chemical hazards arise from carbon dioxide and other refrigerant gasses such as ammonia.
Workers involved in cleaning and equipment maintenance working in confined spaces are
particularly exposed to such hazards. Inhalation of grain dust especially in the brewing
industry could also be a hazard. Fumes and sprays from cleaning solvents, acids or alkalis
could lead to burns and inhalational injuries to factory floor workers especially those
involved in maintenance and cleaning. Organic dust can be a problem to workers in the
mills or store in the brewing industry. Occupational lung disease from exposure to grain

27
and malt dust is an important occupational ill health risk in the brewing industry. Mill
worker’s asthma (malt fever), extrinsic allergic alveolitis (Aspergillus clavatus), allergic
response to grain weevil (Sitophilus granaries), barley itch, organic dust toxic syndrome are
some of the reported lung diseases particular to the brewing industry29.
Grain dust is the dust produced during harvesting, drying, handling, storage or processing
of wheat, oats, barley, maize or rye. It is a complex mixture of fragments of grain,
inorganic soil particles, and associated organic contaminants. These contaminants may
include plant cell debris, insect parts and mites as well as viable and non viable micro-
organisms (vegetative cells and spores of fungi, actinomyces and bacteria, and their
components such as endotoxins and myco toxins). This complicated mixture makes the
effect of grain dust on the lungs difficult to determine.
When grain is handled clouds of grain dust, which is a complex mixture, are dispersed in
the air. In sensitized individuals, inhalation of allergens (fungal spores or avian proteins)
provokes a hypersensitivity reaction34,35. In the acute phase, the alveoli are infiltrated with
acute inflammatory cells. With chronic exposure granuloma formation and obliterative
bronchiolitis occur. Acute symptoms include fevers, rigors, myalgia, dry cough, dyspneoa
and crackles (no wheeze). Chronic symptoms include increased dyspneoa, weight loss,
exertional dyspneoa, type II respiratory failure and cor pulmonale. In the United Kingdom
the maximum exposure unit (MEL) is an average of 10mg/m3 of total respirable dust in the
air over an 8 hour period. This is a maximum and not a target, dust level must be reduced
as far below the MEL as reasonably possible. Higher concentrations can be permitted if
exposure levels are shorter but the maximum dust level should never exceed 30mg/m3
measured over a 10 minute period.
28
A study by Carveilhero et al36 of organic dust containing high level of endotoxin in two
breweries in Portugal found the prevalence of symptoms of organic dust syndrome to be
18% among brewery workers. Mucous membrane irritation was found among 39% brewery
workers. In an exposed population the incidence of the disease is about 5% but with the
introduction of automated malting in factories, where workers are not exposed, this disease
has been largely eliminated.
Biological hazards are of concern to workers involved in harvesting, milling and storage of
the barley and hops used in the brewing industry. These hazards include mill worker’s
asthma (malt fever) extrinsic allergic alveolitis (Aspergillus clavatus), allergic response to
grain weevil (Sitophilus granarius), barley itch, organic dust toxic syndrome, rodents and
insects28.
Psychosocial hazards to factory workers often occur with 8 – hour work shifts in 40 hour
work weeks for at least 50 weeks a year. In a situation where there is little job security,
wages are poor, employee benefits are minimal with little or no opportunity for
advancement, job dissatisfaction, depression and anxiety may arise in meeting production
demands especially under difficult work condition. This could have a bearing on the level
of OHS practice of the workers in particular and the level of productivity in the industries
in general2.
2.2 PREVALENCE OF OCCUPATIONAL INJURIES IN THE BEVERAGE
INDUSTRIES
Most of the published data on occupational injuries are derived from record reviews carried
out by regulatory agencies like the Health and Safety Executive (of the United Kingdom)
and the Bereau of Labor Statistics (of the United States of America). There are little or no
studies worldwide to provide substantive evidence. In the United Kingdom the incidence

29
rates of reported injuries per 100 000 employees for 1996/97 were 3521 in the brewing
industry and 1166 in the bottling industry9-11. The average for all manufacturing industries
in the period under review was 1210. The brewing industry has consistently had a high
injury incidence rate primarily because of the high level of manual handling. Still in the
UK an estimated 1.1 million people suffered from work related musculo-skeletal disorders
(WRMSD)14 and there were an estimated 265 000 new cases of stress, anxiety and
depression made worse by work which resulted in an estimated 13.5 million working days
lost due to stress, anxiety and depression in 2001/2002. In the same year there were 69 fatal
injuries from falling from a height, these facts are adverse to the optimum performance of
the worker.
In the United States, the bottling industry’s 1990 injury and illness rate of 21.5% was well
above the 13.2% in manufacturing as a whole and more than double the private industry
rate, which was 8.8%13. Still in the United States, the total corporate health and safety cost
in 1997 were estimated to be $418 billion in direct cost, and over $837 billion in indirect
cost14.
Differences also occur in the methods of calculating the various injury and illness rates
showing some national variations in criteria for recording these rates. The World Health
Organisation uses the number of accidents or injuries over a specified period divided by the
number of workers at risk in the Industry × 100037. The Health and Safety Executive (HSE)
of UK uses the number of injuries over a specified period divided by the number of
workers × 100 000 9. The Bureau of Labor Statistics (BLS) of the United States of America
uses the incidence of injury and illness per 10 000 full time workers 38, while in Australia
(Australia Bureau of Statistics) it is the number of injured workers in the previous twelve
months divided by the number of people employed in the Industry × 1000 39.
30
The Bureau of Labor Statistics (BLS) in 1997 stated that over 50% of all occupational
illnesses worldwide were associated with repetitive motion injuries40. The three most
common repetitive motion injuries were the muscle, tendon and nerve injuries. Repetitive
motion injuries, back pain and other musculoskeletal injuries occur in this industry
following the coupling of highly mechanized processes20 in the beverage industry.
Repetitive motion injury is not an acute or short term result of a onetime accident, but
instead, the chronic result of gradual repeated trauma. The main causes of injuries in the
beverage industry according to the HSE include slips and trips, being struck by falling
objects such as barrels, boxes and equipment, falls from heights, machinery mainly
conveyors, exposure to harmful substances such as cleaning chemicals and hot liquids and
transport accidents. Ergonomic considerations, inappropriate matching of workers with
tasks may cause or exacerbate occupational injuries and illnesses.
In the United States, the bottling industry’s 1990 injury and illness rate of 21.5% was well
above the 14.1% in the malt brewing industry, 13.25% in manufacturing as a whole and
more than double the private industry rate, which was 8.8%. In 1990 nearly three fifths of
the injury and illness cases in soft drink industry were serious enough to require workers to
take time off from their jobs or be assigned duties restricted to light work or a shortened
schedule13.
Occupational health concerns can be linked with specific jobs carried out in the Industry.
The common jobs seen in the industry include packaging and filling machine operators,
mechanic and manual labourers whose training for the position is completed on site with
extensive on the job instruction. The injuries are related primarily to manual material
handling activities such as unloading trucks filled with soda cans and bottles, and carting
and stacking of containers on customers’ premises. By repeatedly maneuvering heavy

31
loads, many soft drink drivers eventually sustain serious sprains and strains due to over
extension of their trunk and limbs.
The nature of injury included contusion, crushing and bruise, cut, laceration and fracture.
The back and other portions of the trunk (abdomen and shoulders) were the major parts of
the body affected by injuries and illnesses, accounting for one half of the soft drink cases
recorded by the supplementary data system. Another two fifths of the industry’s cases were
divided evenly between two other major body parts; the lower extremities (especially the
legs and knees) and the upper extremities (particularly the fingers)13.
Studies on occupational injuries in various industries have shown that work conditions 41,
shift of work42, speed of work43, education status and safety training44, alcohol and other
psychosocial factors 45 have effect on occupational injury causation. Sex, age, length of
service and occupation of the injured or ill worker and other case characteristic have also
helped analysts identify workers sharing risks commonly associated with workplace
injury46-51.
A study done to assess the association of job and some individual factors with occupational
injuries in northeastern France indicated job category (60.8%), sex (16.2%), regular
psychotropic drug use (8.5%), age groups (7.5%) and presence of disease were significant
contributing factors for occupational injuries46. Several studies on injuries at work in the
US adult population revealed more work related injury rates for males than females39,40. In
a study on construction workers in the United States, permanent (union) workers were
more likely than temporary (non union) workers to: perceive their supervisors as caring
about their safety, be made aware of dangerous work practices, have received safety
instructions when hired, have regular job safety meetings and perceive that taking risks was
not a part of their job52.

32
2.3 PREVALENCE OF HYPERTENSION, DIABETES MELLITUS AND
OBESITY: THE CONCEPT OF HEALTH RISK ASSESSMENT
According to the Centers for Disease Control and Prevention, a health risk assessment is “a
systematic approach to collecting information from individuals that identifies risk factors,
provides an individualised feedback and links with at least one intervention to promote
health, sustain function and/ or prevent disease53 .
Industries have reasons for initiating health promotion programmes which could include
cost containment, staff welfare improvement, positive corporate image and increased
productivity54. The broad components of worksite health promotion include medical care
with early detection and control of conditions that represent illness or are biological
precursors to illnesses such as diabetes mellitus or hypertension screening. Modification of
high risk behavior55-57 with known or suspected negative health effects such as smoking,
inactivity and poor nutrition. Methods to bring about successful behaviour modification
would include health information, education, counselling and incentives58.
In Nigeria, there is an awareness of the increasing importance of chronic diseases like
hypertension, diabetes mellitus and obesity as a cause of morbidity and mortality amongst
the populace. Reports of clinical research show that Nigeria is apparently at the early stage
of an epidemic rise in the frequency of non – communicable diseases. The epidemiological
and demographic transitions both demand appropriate response from the health system with
a need to adapt national health policy to the changing realities of disease profile and
population dynamics 59. Early diagnosis and treatment will reduce the risk of complications
from hypertension, diabetes mellitus and obesity. A study by Carel et al60 following a
multiphasic screening on prevalence and control of hypertension in a mixture of employed
populations showed that 8% of the 15 000 examinees were classified as hypertensives,

33
most of the hypertensives were unaware of their condition. Of those that were aware of
having hypertension (541 persons), about 75% were taking anti hypertensives and in about
67% of them the blood pressure was adequately controlled. A study in Zaria61, Kaduna
State among 3250 civil servants between the ages 25 – 65yrs) showed that the prevalence
of obesity was 13.5% among males and 16.1% among the females. The beverage industries
can serve as a place for initiating health promotion programmes to screen and control for
these diseases. Pre – employment medical examination provides a baseline on the health
status of the workers. Health risk assessments can thus serve for periodic medical
examination of the workforce.
2.4 PRACTICE OF OCCUPATIONAL HEALTH AND SAFETY
The basic principle of control of occupational hazards apply in the bottling and brewing
industries namely elimination, containment and adjunct measures2.
Elimination by substitution or change of process in production have helped to reduce the
incidence of injuries. The use of PETs instead of reusable glass bottles has helped to reduce
the incidence of glass cuts in the factory. The use of raised crates instead of half cut crates
for re usable glass bottles where in use has reduced the incidence of breakages and falls of
crates when moving them on pallets and forklifts as they are made to fit and grove
effectively to the crate above or beneath.
Containment of hazards at source can be done using total enclosing machinery or by partial
enclosures through the appropriate use of machine guards and reduction in the frequency of
man machine interface. Time limited exposure through 8 hour shift duties and days off as
appropriate help to contain the level of exposure of factory workers to hazards even when
their levels are below permissible exposure limits e.g noise . The use of personal protective
equipment by employees where provided by the employer can be an indicator to the safety
34
behaviour of the individual worker and adherence to safety rules in the organization. The
proper use of PPE’s, observance of safety rules, identification and proper application of
safety signs in the workplace by employees all help to guarantee safety as adjunct
prevention and control measures in the Industry28.
A study on occupational health hazards in manufacturing industries in Nigeria62 showed
that the attitude of workers towards the use of protective equipment was poor, since in
96.7% of all the industries studied these equipment were not in use despite having been
provided by management. There is a critical need for supervisors to alert workers to
dangerous work practices and conditions more frequently, and express concern, and praise
workers on safe work in a manner that is culturally acceptable.
A study in the United Arab Emirates among farm workers showed that protective
equipment was worn by a minority of farm workers while handling pesticides- gloves by
35%, work coveralls by 36%, a scarf to cover to the nose and mouth 39%, shoes at work by
79%. Acetylcholinesterase depletion was then found to be negatively associated with the
use of gloves, of work coveralls, and of a scarf to cover the nose and the mouth and with
the implementation of safety and hygiene procedures on the farm63.
Some studies have adduced reasons for non use of personal protective equipment to include
such factors as discomfort due to weather conditions, wrong size and ill fitting PPE and
payment for PPE by the individual worker. Other reasons include a lack of safety training
and ignorance on the importance of the PPEs. The measures to ensure effective use of
personal protective equipment would include education on the importance of proper use of
PPE to enhance safety in the workplace and to protect the worker, inclusion of proper use
of PPE’s as a condition for employment ab initio, provision of PPE’s free of charge to
35
employees and allowing employees to choose from a variety of styles of PPE’s provided to
ensure fitting59.
Safety professionals have increasingly turned their attention to social science for insight
into the causation of industrial accidents. Safety culture is defined as “ the product of
individual values, attitudes and beliefs, competencies and pattern of behaviour that
determine the commitment to, and the style and proficiency of, an organisation’s health
and safety management.” A social construct, safety climate, has been examined by several
researchers and it measures workers’ perception of organizational factors related to
occupational health and safety such as managements’ commitment to risk prevention or
priorities of safety versus production. Researchers have developed instruments for
measuring safety climate and have established some degree of psychometric reliability and
validity64. There is an empirical link between safety climate perceptions and objective
injury data65-67.
Adjunct measures would include good housekeeping practices, appropriate provision and
use of personal protective equipment (PPE), biological monitoring, environmental
monitoring, health promotional activities (disease screening programmes, incentive
programmes et al) and use of safety committees in the industry amongst others2.

36
CHAPTER THREE
MATERIALS AND METHODS
3.1 STUDY AREA
The study was carried out in Benin City the capital of Edo State in the south south
geopolitical zone of Nigeria. Edo State is bounded by Kogi State to the north, Delta State to
the south which also form the eastern border, Ondo State forms the southwest border. The
State was created on the 27th of August 1991 with Delta from the defunct Bendel State. It is
located in the heart of the tropical rainforest and it lies between longitude 50E and 60 42”E
and latitude 50 45”N and 70 35”N of the equator. Benin City is comprised of three Local
government areas namely Egor, Ikpoba Okha and Oredo with a total population of one
million eighty five thousand six hundred and seventy people (1 085 670)68. Majority of the
dwellers are of Benin tribe, the others are non indigenes and include the Esan, Igbo, Etsako,
Owan, Urhobo and Yoruba.
There is the presence of four medium scale beverage industries particularly involved in the
bottling and brewing of alcoholic and non alcoholic beverages in Benin City, two of which
participated in this study.
The Nigerian Bottling Company (NBC) PLC is a multinational public liability company
with a production plant located in Eyaen in Ikpoba Okha LGA along the Benin–Auchi
road, Benin City. NBC was established in Nigeria in 1953 at Ebute Meta, Lagos Nigeria
and was listed in the Nigeria stock exchange in 1972. It presently has 13 plants with over
80 depots to reach consumers at their doorstep. The Benin plant of the NBC was
established in the year 2000 and is the second largest in Nigeria, In April 2008 an incident
of fire occurred which led to the complete burning down of the factory. The plant re-
opened to production in 2009 following reconstruction. The products of the company

37
include soft drinks like Coca cola, Sprite, Fanta, Krest and Schweppes. Fruit juices such as
Five Alive and Cappy are also produced by the NBC. The Benin plant has 245 factory
workers. The factory workers work three shifts of eight hour per shift, NBC has various
departments namely human resources, finance, logistics, information, commercial, quality
assurance, fleet, plant, production, maintenance and safety. The factory has three
production lines namely the re-usable glass bottles (RGB) line, the polyethylene terephtate
(PET) line and the Juice line. The Benin plant has an effluent treatment plant and
discharges the treated effluent into the Ikpoba river. Staff of the NBC are covered by health
insurance under a health maintenance organization (Clearline HMO) in Benin City. There
is a factory clinic with an on - site doctor and nurses for treatment of minor ailments and
injuries. For more serious cases, staff of the plant are managed at the Faith Mediplex and
The Central Hospital Benin City.
The Bendel Breweries Limited which is located along the Benin-Agbor road, in Ikpoba
Okha Local Government Area, Benin City was founded in 1974 and commissioned by
Colonel Yakubu Gowon. It is fully owned by the Edo State Government. Bendel Breweries
has an administrative section and a factory which comprise the following units namely
brewing, fermentation, bottling, quality control and water treatment. The factory has a
production line that produces re-usable glass bottles (RGB); the products of the company
include Crystal malt and Crystal beer. The company discharges its effluent into the Ikpoba
river. It has a staff strength of 193 factory workers, with factory workers working shifts.
The company maintains retainership with some private hospitals in Benin City and the
Central Hospital Benin City. It has an on - site clinic managed by a nurse and a health
assistant.

38
Benin City has many health facilities both public and private ranging the three tiers of
primary, secondary and tertiary health care. It has numerous educational institutions,
religious institutions and other social amenities. There is also the presence of various other
industries such as agro-allied industries, construction and civil works, woodwork and
numerous small scale industries.
3.2 STUDY POPULATION
The study population comprised factory workers and relevant administrative staff in the
Nigeria Bottling Company PLC and Bendel Breweries Limited in Benin City, Edo State.
3.2.1 Inclusion criteria
All workers and their supervisors involved in the production process, storage and
distribution of the finished products who had been in employment for at least 6 months in
the industry were included in this study. A duration of at least 6 months from date of
employment was allowed for the assumption that the worker would have undergone a pre-
employment medical examination and would have received some safety training and
supervision, if available, in the industry within that period.
Key administrative staff in the human resources department of the respective industries
were included for an in-depth interview.
3.3 SCOPE OF THE STUDY
This study focused on a health risk assessment of the beverage industries in Benin City,
Edo state. Two industries, a bottling and a brewing industry in Benin City agreed to
participate in this study as examples of the non-alcoholic ( NBC PLC) and alcoholic
beverage (Bendel Breweries Ltd) industries, while NBC is a public liability company
Bendel Breweries Ltd. is a state government owned industry. The 7-Up bottling company

39
PLC and Guinness Nigeria PLC, however, did not participate in this study despite
correspondences and requests by the researcher (Appendix VI).
This study sought to examine the work environment in the two beverage industries in line
with the health, safety and welfare provisions of the 2004 Factories Act and HSE
guidelines for the bottling and brewing industries.
3.4 STUDY DESIGN
A comparative cross-sectional, analytical study design was used.
3.5 SAMPLE SIZE DETERMINATION
The minimum sample size for this study was calculated using the formula to compare two
proportions in two independent study samples considering alpha and beta errors69.
N= (Zα +Zβ)2
.2.p(1-p) 69
(d)2
Data sets: Inter-factory comparison, bottling (p1) and brewing (p2) industries
Variable: Injury rate
Where p= p1+p2 , Injury rate in bottling industry (p1 ) = 0.211
2 Injury rate in brewing industry (p2) = 0.141
P (1-p) : p=0.824, (1-p) =0.176
Zα =1.96, α = 0.05, therefore 95% confidence desired
Zβ = 0.84, β = 0.2, therefore 80% power desired
Difference to be detected (d) = 0.14 which is the difference in injury and illness rate
between the bottling and brewing industries15.
N= (Zα +Zβ)2
.2.p(1-p)
(d)2
N= (1.96+0.84)2.2. (0.824)(0.176)
(0.14)2

40
=116
Allowing for a non-response rate of 10%
11.6, approximately 12
Therefore N=116+ 12= 128
Subjects per group (minimum) = 128
Subjects in total (minimum) =256
3.6 SAMPLING METHOD
A total population survey was conducted in the two industries studied. One hundred and
forty eight respondents out of a total of 178 factory workers who participated met the
inclusion criteria in the Bendel Breweries Limited while 201 out of a total of 210
respondents who participated in the NBC met the inclusion criteria for the study.
3.7 STUDY DURATION
The study was conducted between July and December 2010.
3.8 DATA COLLECTION
Qualitative and quantitative data were collected using the following instruments.
3.8.1 Questionnaire:
A structured 60 - item questionnaire which consisted of both open and closed ended
questions was administered by the researcher and 5 trained research assistants who were
final year medical students of the University of Benin. The research assistants were trained
for two days on the proper use of the research tools to ensure uniformity in eliciting
information from respondents. The questionnaire (Appendix 1) was divided into sections
and information was sought on:
A: Socio-demographic and occupational characteristics

41
B: Injury and illness characteristics
C: Practice of occupational health and safety
C: Health screening
Twenty five questionnaires were pre-tested in a beverage industry in Ovia North East Local
Government Edo State owned by the Nigeria Institute for Oil Palm Research (NIFOR)
involved in Palm wine Production. The questionnaires were pre - tested to determine the
average duration of administration, comprehensibility, sensitivity, validity and reliability of
questions to respondents. Corrections to the questionnaires were effected before the
commencement of the study.
Interviews were conducted in batches with the assistance of the human resources
department of the two factories that circulated internal memoranda and worked out a
schedule with the various unit heads so as not to adversely affect production.
Occupational injury prevalence rate and frequency rate were calculated for both Industries
using the formulae adopted from the WHO module for primary health care workers
(Appendix IX), total number of injuries per worker was calculated summing up the number
of injuries suffered by respondents in the last 12 months. Period prevalence was thus
calculated37.
Occupational Injury
Prevalence rate = Total number of occupational injuries × 1000
Total number of workers exposed
Frequency rate = Total number of occupational injuries × 1000
Total number of work hours worked
The health screening70 included;
1. Anthropometric measurements namely height and weight measurements from which the
body mass index (BMI) was computed.

42
Height measurement: The height in metres was measured with the subject standing as tall
as possible, looking ahead, barefooted with the feet together and against a portable
lightweight taxiometer with a measuring range as 6 - 78 inches and graduations in 1/8 inch
(207cm x 1mm).
Weight measurement: The body weight of respondents was measured in kilograms using
a weighing scale with maximum capacity of 150 kg in divisions of 100 grams with the
respondents standing upright without shoes and in light clothing71.
The body mass index (BMI) was computed from the weight of respondents (kg) divided by
the square of their height (m2) 72
Body mass index (BMI) = weight(kg)
Height2 (m2)
The respondents were classified according to their BMI thus:
Underweight <18.5
Normal 18.5 – 24.9
Overweight 25 – 29.9
Obese I 30 – 34.9
Obese II 35 – 39.9
Obese III ≥ 40
respondents were finally categorized as underweight, normal, overweight and obese
1. Blood pressure measurement: Blood pressure was measured using an OMRON M2 basic
digital automatic blood pressure monitor with an accuracy of calibration at +3mmHg and a
range of measurement of 0 – 299 mmHg (Appendix 10). The respondent was made to sit in
a chair with the feet flat on the floor and the left arm placed on the table with the air tube
made to run down the medial side of the forearm and be in line with the middle finger. The
lower cuff was approximately 2cm above the elbow, measurement was taken with the cuff

43
covering about three quarters of the left arm and the respondent seated for at least five
minutes before taking measurement. The respondent was directed to keep still and not talk
during measurement. Two blood pressure readings were taken at an interval of 15 minutes
and the mean of the two readings taken as the individual’s blood pressure measurement.
Respondents were classified using the WHO – ISH criteria for grading blood pressure 73.
Normal <130 / <85 mmHg
High normal 130 – 139/ 85 -89 mmHg
Hypertension Grade I 140 – 159 / 90 -99 mmHg
Hypertension Grade II 160 -179 /100 -109 mmHg
Hypertension Grade III ≥180 / ≥110 mmHg
Blood pressure readings were recoded as normal blood pressure ( < 140/90mmHg),
elevated blood pressure ( >140/ >90 mmHg), isolated systolic elevated blood pressure (
≥140/ 90 mmHg) and isolated diastolic elevated blood pressure ( <140/ ≥ 90 mmHg)
following the American Heart Association74 recommendation to determine prevalence.
2. Random blood glucose measurements: was taken using an ACCU - CHEKR Active blood
glucose monitoring system (Appendix 10) with a measuring range from 10 – 600mg/dl (0.6
– 33.3mmol/L) in the following procedure; The test strip was inserted with the silver -
coloured bars facing up and towards the meter (meter will turn on automatically). The
researcher wore disposable latex hand gloves then verified that the code on the meter
display matched the code on the test strip vial. A blood sample was obtained by pricking
the side of the finger tip, after cleaning the site with methylated spirit and cotton wool,
gently with a lancet using standard precautions until a drop of blood formed. When the
blood drop symbol flashed on the display the drop of blood was touched and held to the
edge of test strip (to make sure all of the yellow area was filled). The result was then read75.
The sharps were disposed in a safety box and disposable hand glove and spirit swab was

44
disposed in a lined plastic bin. Respondents were then classified using the WHO criteria
into normal ( <140 mg/dL), impaired glucose tolerance (141 – 199mg/dL) and diabetes
mellitus (≥ 200mg/ dL).
The questionnaires and measurements were administered from 5th - 8th October, 2010 at
the Bendel Breweries Ltd. and 12th - 15th October, 2010 at the Nigeria Bottling Company
Plc.
3.8.2 In-depth interview guide
This was used to conduct interviews with the respective human resource managers in the
industries studied following their consent to get a management perspective on occupational
health and safety.
3.8.3 Observational checklist:
This was used to inspect and assess the bottling and brewing industry (walk through
survey) on their compliance with recommended international code of practice (HSE
guidelines) and their compliance to the 2004 Factories Act of Nigeria on health, safety and
welfare. Relevant aspects of the job load and hazard analysis checklist by Mattila and the
WHO training module on occupational health and safety were adapted for this purpose56,57.
3.9 ENVIRONMENTAL MONITORING
1. Noise survey
Environmental monitoring of noise was done using a BK precision sound level meter with
measures taken at 12 sites in each Industry. The instrument had been calibrated at the Edo
Environmental Laboratory using a standard acoustic calibrator (94dB, 110 Hz sine wave).
A- weighting for general noise sound level was chosen. The instrument was comfortably
held in the hand of the recorder and the microphone pointed at the suspected noise source.
45
The MAX MIN (maximum, minimum) mode was chosen and held, the sound pressure
level was displayed at their maximum and minimum readings. The average reading was
then taken for each of the twelve sites in both industries77.
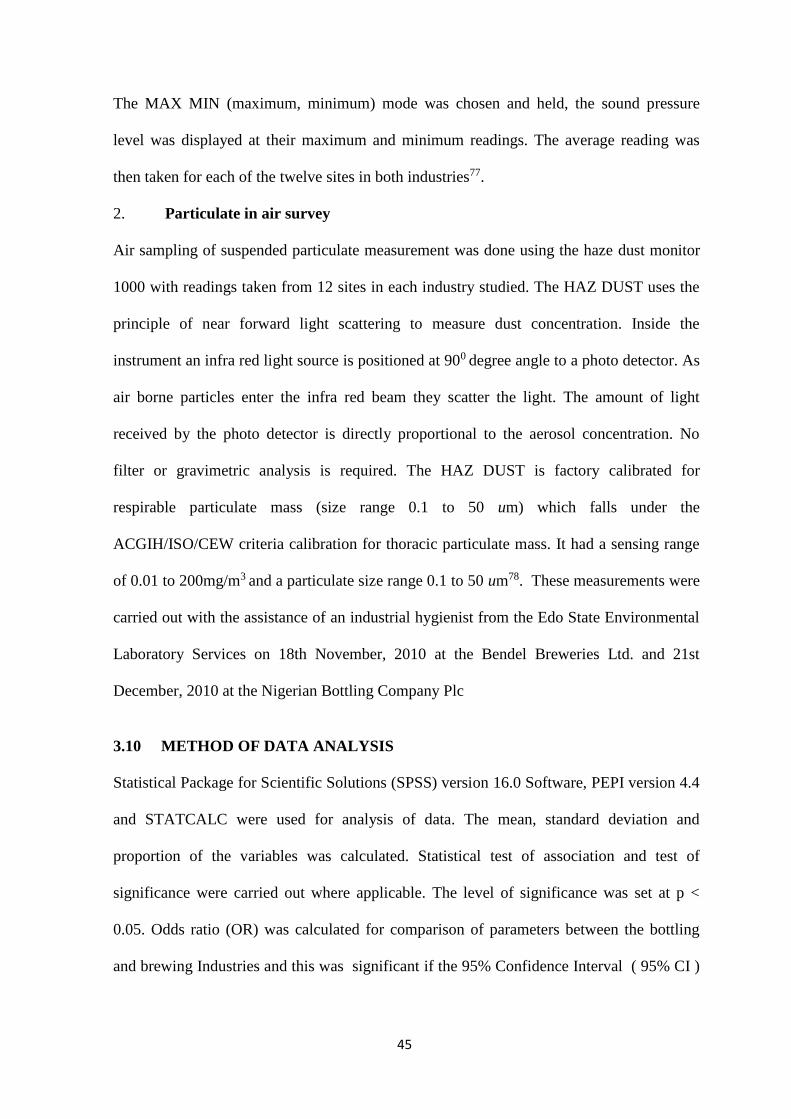
2. Particulate in air survey
Air sampling of suspended particulate measurement was done using the haze dust monitor
1000 with readings taken from 12 sites in each industry studied. The HAZ DUST uses the
principle of near forward light scattering to measure dust concentration. Inside the
instrument an infra red light source is positioned at 900 degree angle to a photo detector. As
air borne particles enter the infra red beam they scatter the light. The amount of light
received by the photo detector is directly proportional to the aerosol concentration. No
filter or gravimetric analysis is required. The HAZ DUST is factory calibrated for
respirable particulate mass (size range 0.1 to 50 um) which falls under the
ACGIH/ISO/CEW criteria calibration for thoracic particulate mass. It had a sensing range
of 0.01 to 200mg/m3 and a particulate size range 0.1 to 50 um78. These measurements were
carried out with the assistance of an industrial hygienist from the Edo State Environmental
Laboratory Services on 18th November, 2010 at the Bendel Breweries Ltd. and 21st
December, 2010 at the Nigerian Bottling Company Plc
3.10 METHOD OF DATA ANALYSIS
Statistical Package for Scientific Solutions (SPSS) version 16.0 Software, PEPI version 4.4
and STATCALC were used for analysis of data. The mean, standard deviation and
proportion of the variables was calculated. Statistical test of association and test of
significance were carried out where applicable. The level of significance was set at p <
0.05. Odds ratio (OR) was calculated for comparison of parameters between the bottling
and brewing Industries and this was significant if the 95% Confidence Interval ( 95% CI )
46
was not inclusive of 1.0. The data was presented in statements, frequency distribution
tables, cross-tables and figures .
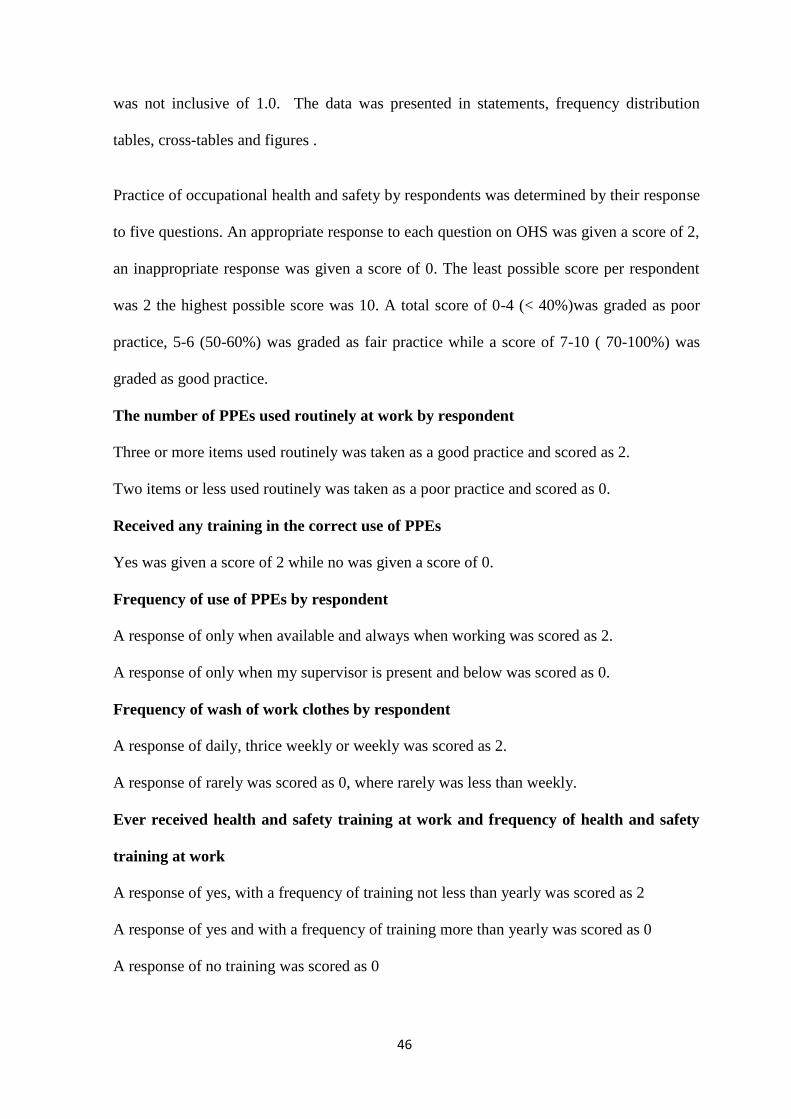
Practice of occupational health and safety by respondents was determined by their response
to five questions. An appropriate response to each question on OHS was given a score of 2,
an inappropriate response was given a score of 0. The least possible score per respondent
was 2 the highest possible score was 10. A total score of 0-4 (< 40%)was graded as poor
practice, 5-6 (50-60%) was graded as fair practice while a score of 7-10 ( 70-100%) was
graded as good practice.
The number of PPEs used routinely at work by respondent
Three or more items used routinely was taken as a good practice and scored as 2.
Two items or less used routinely was taken as a poor practice and scored as 0.
Received any training in the correct use of PPEs
Yes was given a score of 2 while no was given a score of 0.
Frequency of use of PPEs by respondent
A response of only when available and always when working was scored as 2.
A response of only when my supervisor is present and below was scored as 0.
Frequency of wash of work clothes by respondent
A response of daily, thrice weekly or weekly was scored as 2.
A response of rarely was scored as 0, where rarely was less than weekly.
Ever received health and safety training at work and frequency of health and safety
training at work
A response of yes, with a frequency of training not less than yearly was scored as 2
A response of yes and with a frequency of training more than yearly was scored as 0
A response of no training was scored as 0

47
3.11 ETHICAL CONSIDERATION
1. Individual consent: A written informed consent form was attached to each of the
questionnaires which was signed by the respondents after full explanation of the purpose
for the study by the researcher and research assistants (Appendix 1). Respondents were
duly informed of the voluntary nature of participation in the study. No token or inducement
was given to respondents who agreed to take part in the study.
2. Establishment consent: Permission was sought and obtained from the management of the
respective bottling or brewing industries that were used for the study ( Appendix V ).
3. Institutional ethical clearance: This was obtained from the University of Benin Teaching
Hospital Ethical Committee. The study proposal was submitted to the committee for
approval before the commencement of actual fieldwork (Appendix IV).
All respondents voluntarily agreed to participate in the health screening for hypertension,
diabetes mellitus and obesity. While the questionnaires were administered anonymously,
Respondents were given a screening slip (Appendix VII) recording their measurement in a
simple format to ease understanding and for their personal record and this was signed by
the researcher as evidence of the test and measurements carried out after which a brief
counseling session was given. Respondents with abnormal readings were counseled and
promptly referred to a nearby health facility or the University of Benin Teaching Hospital
as appropriate for further medical care. The health screening was done at the on - site clinic
and with the co-operation of the health personnel in both industries.
3.13 STUDY LIMITATIONS
Audiometric testing for the factory workers was not carried out in this study due to
resource and logistic constraint even though environmental monitoring through a noise
survey was done using a sound level meter.

48
Information on injury and illnesses in the past one year elicited from the questionnaire were
self reported by respondents which could have had some recall bias. The researcher sought
to examine the injury and illness register in the Industry to know the level of incident
reporting in the workplace. There was none available in the brewing industry as at the time
of conducting this study, while there was an up to date register in the bottling industry, the
researcher however was not permitted to copy accident and injury records from the register
for use in this study.
For the screening of diabetes mellitus, random blood glucose measurement was used
instead of fasting blood glucose due to the inability of the researcher to guarantee a fast
among the study subjects.

49
CHAPTER FOUR
RESULTS
A total of 201 factory workers in the Bottling industry and 148 factory workers in the
Brewing industry who met the inclusion criteria were interviewed in this study
TABLE 1: SOCIO-DEMOGRAPHIC CHARACTERISTICS OF RESPONDENTS
Variable Industry
Bottling
Freq. (%) N=201
Brewing
Freq. (%) N=148
Age (years)
15-24
25-34
35-44
45-54
>55
49 (24.4)
113 (56.2)
22 (10.9)
15 ( 7.5)
2 ( 1.0)
20 (13.5)
30 (20.3)
43 (29.1)
31 (20.9)
24 (16.3)
Sex
Male
Female
190 (94.5)
11 ( 5.5)
134 (90.5)
14 ( 9.5)
Marital status
Single
Married
117 (58.2)
84 (41.8)
51 (34.5)
97 (65.5)
Religion
Christianity
Islam
African Traditional Rel.
184 (91.5)
16 ( 8.0)
1 ( 0.5)
144 (97.3)
2 ( 1.4)
2 (1.4)
Level of education
Primary
Secondary
Tertiary
12( 6.0)
54 (26.9)
135 (67.1)
22 (16.3)
66 (45.2)
58 (39.2)
50
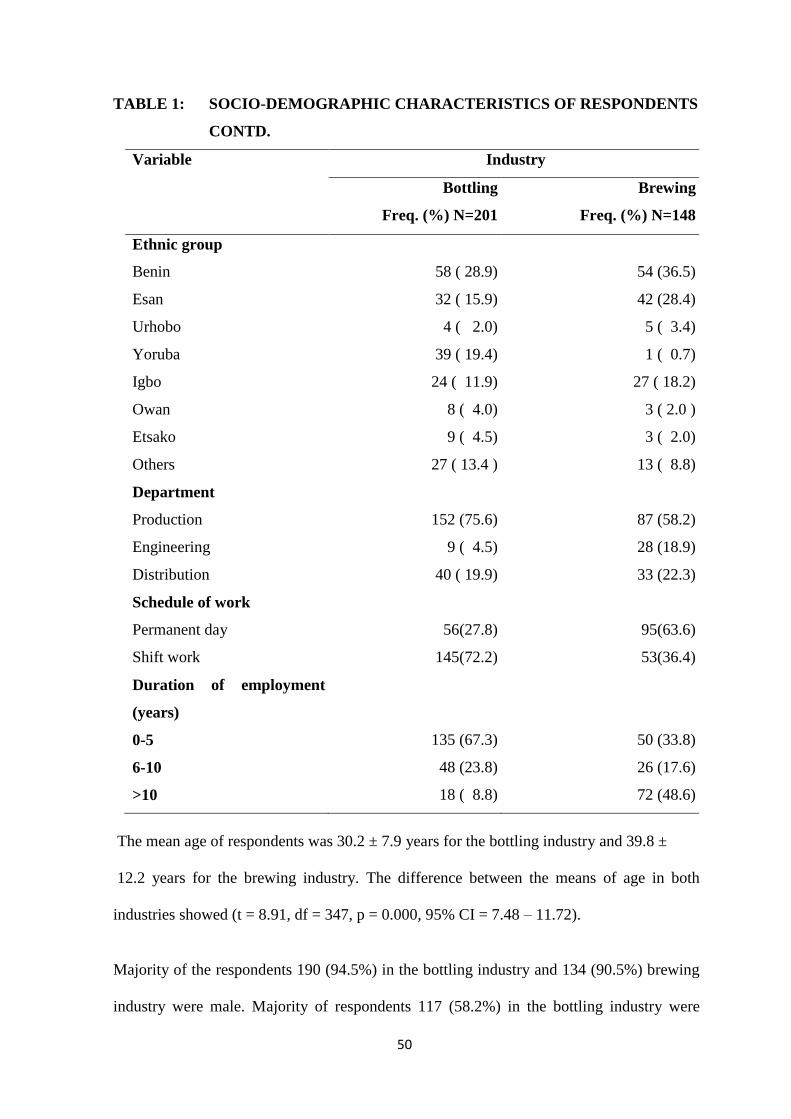
TABLE 1: SOCIO-DEMOGRAPHIC CHARACTERISTICS OF RESPONDENTS
CONTD.
Variable Industry
Bottling
Freq. (%) N=201
Brewing
Freq. (%) N=148
Ethnic group
Benin
Esan
Urhobo
Yoruba
Igbo
Owan
Etsako
Others
58 ( 28.9)
32 ( 15.9)
4 ( 2.0)
39 ( 19.4)
24 ( 11.9)
8 ( 4.0)
9 ( 4.5)
27 ( 13.4 )
54 (36.5)
42 (28.4)
5 ( 3.4)
1 ( 0.7)
27 ( 18.2)
3 ( 2.0 )
3 ( 2.0)
13 ( 8.8)
Department
Production
Engineering
Distribution
152 (75.6)
9 ( 4.5)
40 ( 19.9)
87 (58.2)
28 (18.9)
33 (22.3)
Schedule of work
Permanent day
Shift work
56(27.8)
145(72.2)
95(63.6)
53(36.4)
Duration of employment
(years)
0-5
6-10
>10
135 (67.3)
48 (23.8)
18 ( 8.8)
50 (33.8)
26 (17.6)
72 (48.6)
The mean age of respondents was 30.2 ± 7.9 years for the bottling industry and 39.8 ±
12.2 years for the brewing industry. The difference between the means of age in both
industries showed (t = 8.91, df = 347, p = 0.000, 95% CI = 7.48 – 11.72).
Majority of the respondents 190 (94.5%) in the bottling industry and 134 (90.5%) brewing
industry were male. Majority of respondents 117 (58.2%) in the bottling industry were

51
single while majority of respondents in the brewing industry 97 (65.5%) were married. In
both industries majority of the respondents 184 (91.5%) bottling and 144 (97.3%) brewing
were Christians. Majority of the respondents in the bottling industry 135 (67.1%) had
tertiary education while most of the respondents in the brewing industry 66 (45.2%) had
secondary education.
In both industries the Benin tribe represented the largest ethnic group with 58 (28.9%) in
the bottling industry and 54 (36.5%) in the brewing industry. In the bottling industry the
Yoruba ethnic group followed with 39 (19.4%) while in the brewing industry the Esan
ethnic goup followed with 48 (32.4%). The other ethnic groups represented in the study
include Igbo, Urhobo and Ijaw. With regard to the department of respondents, the
production department represented the largest category with 152 (75.6%) in the bottling
industry and 87 (58.2%) in the brewing industry.
Majority of respondents in the bottling Industry 145 (72.2%) did shift work while majority
in the brewing Industry 95 (63.3%) did Permanent day. The mean number of hours worked
by respondents per day in the industries studied were 7.8 ± 2.3 in the bottling industry and
8.16 ± 0.57 in the brewing industry. The mean duration of employment of respondents was
4.8 ± 3.4 years for the bottling industry and 11.31 ± 9.6 years for the brewing industry ( t
= 8.89, df = 347, p = 0.000, 95% CI = 5.07 – 7.95).

52
TABLE 2: QUALITATIVE RISK ASSESSMENT IN THE BEVERAGE
INDUSTRIES
Hazard identified
Risk of exposure in the industries
Bottling Brewing
Mechanical
i. Broken glass
ii. Slippery floor
iii. Repetitive motion
iv. Unguarded machinery/
moving machine parts
+
+
++
+
++
++
++
++
Physical
i. Noise
ii. Temperature variation
+
+
+
+
Chemical
i. Cleaning agent (e.g caustic
soda)
_
+
Psychosocial
i. Job dissatisfaction
+
++
Key
( +) Present
( ─) Absent
Broken glass was a hazard identified in the brewing and re usable glass bottle line in the
bottling Industries, Some workers were involved in manually crushing condemned glass
bottles for recycling as seen in the bottling company and were at increased risk of injuries
from broken glass.
The floor of both Industries was well drained except for some area in the re usable glass
bottle line where bottles were washed and the filling section which was wet and slippery.
The floor of the engineering workshop in the brewing industry was both greasy and
slippery. The Engineering section in the bottling Industry, however, was clean.

53
Repetitive motions and manual handling was seen among workers involved in loading and
unloading pallets in both Industries. Empty sighters involved in inspecting bottles were at
increased risk of eye strain, headaches and visual acuity problems in both industries. There
were well marked pedestrian walk ways in the bottling Industry but none in the brewing
Industry. Workers in the brewing industry were thus more exposed to accidents from
moving machine parts and forklifts.
The generator house in both Industries produced excessive noise, maintenance workers in
both industries were at risk of noise induced hearing loss. Noise was a hazard in the Quality
control room of the brewing Industry as it was located above the factory floor. The Quality
control room in the bottling Industry, however, was sound proofed and located adjacent to
the Polyethylene terephthalate (PET) line (Appendix VIII)
Excessive heat, evidenced by excessive sweating among workers in the factory floor was
not noticed except among the workers in the PET line in the bottling industry.
Some workers in the brewing Industry were manually involved in loading caustic soda into
the washer for washing the glass bottles and were at an inreased risk of sustaining chemical
burns.
More of the workers in the brewing industry expressed dissatisfaction with their presently
assigned job when compared with the bottling Industry (Table 31).

54
TABLE 3: ENVIRONMENTAL MONITORING OF NOISE AND
PARTICULATE CONCENTRATION IN AIR
Variable
Industry
Permissible
exposure limit
FMENV
Test statistic
t-test
Bottling
N =12
Brewing
N=12
Noise
Mean + SD
Range
Highest source
dBA
75.5 +12.1
56.8- 93.5
Generator house
(93.5)
dBA
72.19 +13.1
55.6 – 94.2
Generator house
(94.2)
dBA
< 90
< 90
< 90
t=0.64
df=22
p=0.527
Particulate in
air
Mean
Range
mg/m3
0.02+0.01
0.01-0.02
mg/m3
0.01+0.01
0.01-0.02
mg/m3
< 0.25mg/m3
< 0.25mg/m3
t=2.42
df=22
p=0.023
*** Detection limit for particulate in air is 0.01mg/m3
FMENV – Federal Ministry of Environment
The average noise levels in both industries fell below the permissible exposure limit of
90dBA in both industries with 75.5+ 12.1 dBA in the bottling industry and 72.2+ 13.1 in
the brewing industry. The highest source of noise in both industries came from the
generator house with 93.5dBA in the bottling industry and 94.2 dBA in the brewing
industry. There was no statistically significant difference in the mean noise levels in both
industries (p= 0.527).

55
The mean particulate in air levels of both industries was far below the 0.25 mg/m3
permissible exposure limit of the FMENV at 0.01mg/m3 in the bottling industry and
0.02mg/m3 in the brewing industry. It was barely at the detection limit of the HAZ DUST
monitor used at 0.01mg/m3 in both industries even though there was a statistically
significant difference in the particulate in air levels of both industries (p=0.023) studied.

56
TABLE 4: SELF REPORTED OCCUPATIONAL INJURIES AMONG
RESPONDENTS IN THE PAST 12 MONTHS
Injured
Industry
Bottling
Freq. (%)
Brewing
Freq. (%)
Yes
No
33 ( 16.4 )
136 ( 83.6 )
33 ( 22.3)
115 ( 77.7)
Total
201 (100.0)
148 (100.0)
X2 = 1.921, df = 1, p = 0.166 OR = 0.85, 95% CI = 0.57 - 1.35
The proportion of workers who had suffered at least 1 occupational injury in the bottling
industry was 33 (16.4%) while in the brewing industry it was 33 (22.3%). There was no
statistically significant difference (p = 0.166) among respondents in both industries studied.
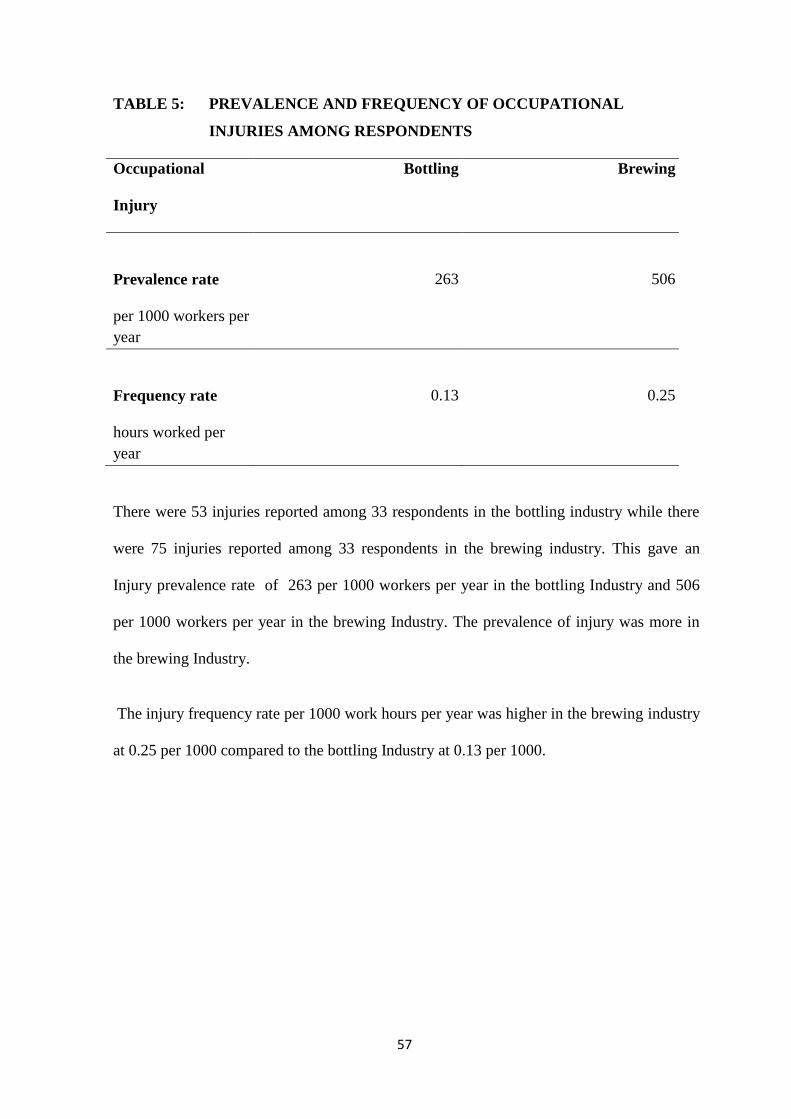
57
TABLE 5: PREVALENCE AND FREQUENCY OF OCCUPATIONAL
INJURIES AMONG RESPONDENTS
Occupational
Injury
Bottling
Brewing
Prevalence rate
per 1000 workers per
year
263
506
Frequency rate
hours worked per
year
0.13
0.25
There were 53 injuries reported among 33 respondents in the bottling industry while there
were 75 injuries reported among 33 respondents in the brewing industry. This gave an
Injury prevalence rate of 263 per 1000 workers per year in the bottling Industry and 506
per 1000 workers per year in the brewing Industry. The prevalence of injury was more in
the brewing Industry.
The injury frequency rate per 1000 work hours per year was higher in the brewing industry
at 0.25 per 1000 compared to the bottling Industry at 0.13 per 1000.

58
FIGURE 1: PART OF THE BODY WHERE INJURY OCURRED TO
RESPONDENTS
Majority of the respondents in the bottling industry were injured in the hand (66%), most of
the respondents in the brewing industry were injured in the hand (33%) followed by the
upper limb (27.3%) and lower limb (27.3%).
0
10
20
30
40
50
60
70
Head &neck
Upperlimb
Hand Lowerlimb
Feet Trunk Back
9.1%12.1%
66.6%
0 0 0 00
27.3%
33.3%
27.3%
6.1%3% 3%
FREQ
UEN
CY
%
Part of the body affected
Bottling
Brewing

59
FIGURE 2: TYPE OF INJURY TO RESPONDENTS
Majority of the respondents in both industries sustained lacerations as the type of injury in
the bottling 22 (66.7%) and the brewing 28 (84%) industries.
0
10
20
30
40
50
60
70
80
90
Sprain Laceration Dislocation Crushing Burns
3%
66.7%
6.1% 6.1%
18.1%
6.1%
84.6%
03%
6.1%
FREQ
UEN
CY
%
TYPE OF INJURY
Bottling
Brewing
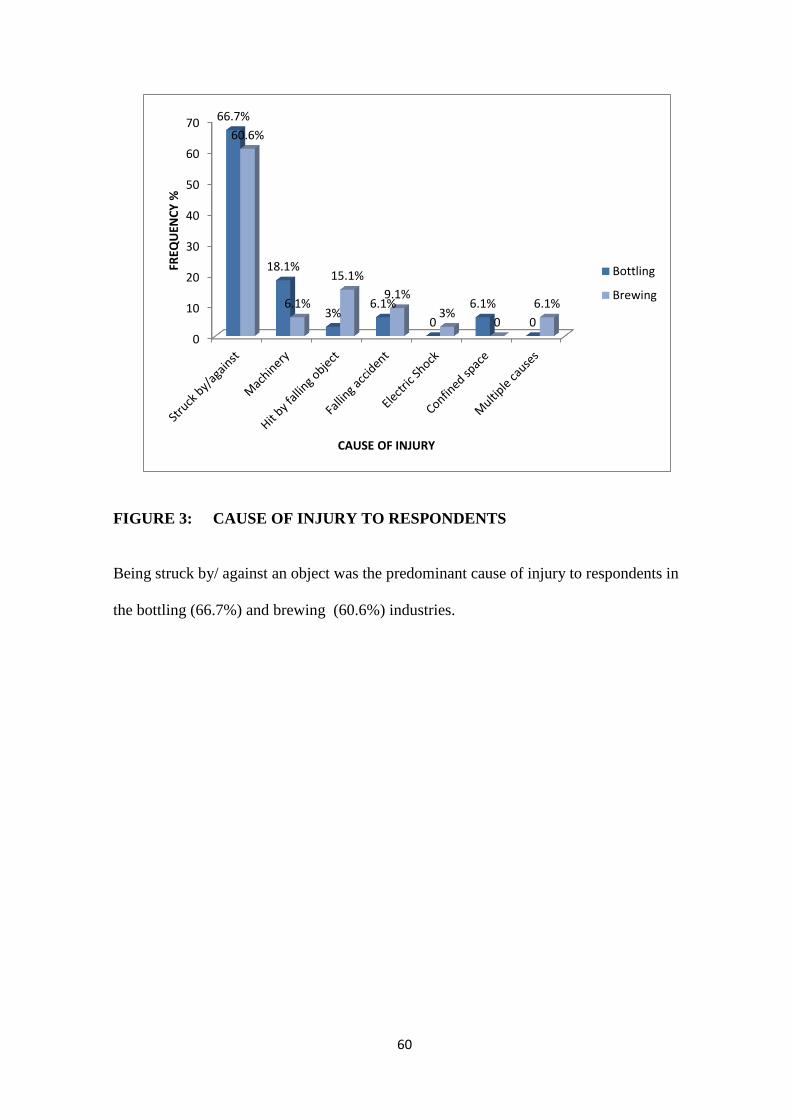
60
FIGURE 3: CAUSE OF INJURY TO RESPONDENTS
Being struck by/ against an object was the predominant cause of injury to respondents in
the bottling (66.7%) and brewing (60.6%) industries.
0
10
20
30
40
50
60
7066.7%
18.1%
3%6.1%
0
6.1%
0
60.6%
6.1%
15.1%
9.1%
3%0
6.1%
FREQ
UEN
CY
%
CAUSE OF INJURY
Bottling
Brewing

61
FIGURE 4: PERIOD OF THE DAY WHEN INJURY OCCURRED TO
RESPONDENTS
The afternoon 17 (58.7%) was the period of highest occurrence of injury in the brewing
industry even though morning and afternoon was equally shared among injured
respondents at 11 (33%) in the bottling company as the period the when most injuries
occurred to respondents.
0
10
20
30
40
50
60
Morning Afternoon Night Can't remember
33.3% 33.3%
24.3%
9.1%
21.2%
51.5%
15.2%12.1%
FREQ
UEN
CY
%
PERIOD OF THE DAY
Bottling
Brewing

62
TABLE 6: SELF REPORTED NOTIFIABLE INJURY AMONG RESPONDENTS
Notifable injury
Industry
Bottling
Freq. (%)
Brewing
Freq. (%)
Yes
No
8 (3.9)
193 (96.1)
4 (2.7)
144 ( 97.3)
Total
201 (100.0)
148 (100.0)
X2 = 1.630 , df = 1, p =0.202
Eight (3.9%) of the workers injured required to be absent from work for more than three
days in the bottling industry while 4 (2.7%) of the workers injured required to be absent
from work for more than 3 days There was no statistically significant difference (p= 0.202)
in the number of injured workers in both industries that were of work for more than three
days following injury. This finding, however, gave a prevalence of notifiable injury of 8
(3.7%) in the bottling industry and 4 (2.7%) in the brewing industry.
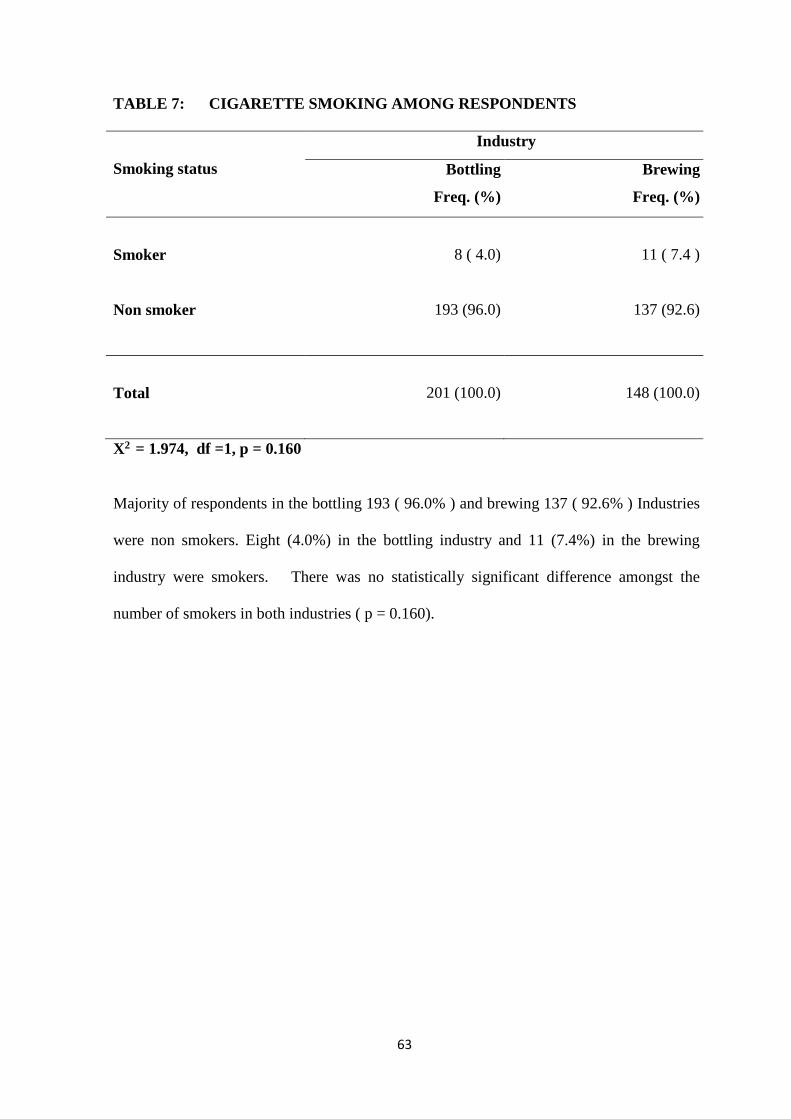
63
TABLE 7: CIGARETTE SMOKING AMONG RESPONDENTS
Smoking status
Industry
Bottling
Freq. (%)
Brewing
Freq. (%)
Smoker
Non smoker
8 ( 4.0)
193 (96.0)
11 ( 7.4 )
137 (92.6)
Total
201 (100.0)
148 (100.0)
X2 = 1.974, df =1, p = 0.160
Majority of respondents in the bottling 193 ( 96.0% ) and brewing 137 ( 92.6% ) Industries
were non smokers. Eight (4.0%) in the bottling industry and 11 (7.4%) in the brewing
industry were smokers. There was no statistically significant difference amongst the
number of smokers in both industries ( p = 0.160).

64
TABLE 8: ALCOHOL HABIT OF RESPONDENTS
Alcohol intake
Industry
Bottling
Freq. (%)
Brewing
Freq. (%)
Yes
No
74 ( 36.8)
127 (63.2)
97 (66.9)
51 (33.1)
Total
201 (100.0)
148 (100.0)
X2 = 28.143, df =1, p =0.000 OR = 0.31, 95% CI = 0.19 -0.49
In the bottling industry 74 (36.8%) respondents took alcohol while in the brewing industry
97 (66.9) respondents took alcohol. There was a statistically significant difference (OR =
0.31, 95% CI = 0.19 -0.49) in the proportion of respondents that took alcohol in both
industries.

65
TABLE 9: FREQUENCY OF INTAKE OF ALCOHOL BY RESPONDENTS
Frequency
Industry
Bottling
Freq. (%)
n=74
Brewing
Freq. (%)
n=97
Daily
Thrice weekly
Weekly
Monthly
Rarely
6 ( 8.1 )
8 ( 10.8)
21 (28.4)
15 (20.3)
24 (32.4)
22 (22.7 )
26 (26.8)
21 (21.6)
7 ( 7.2)
21 (21.6)
Total
74 (100.0)
97 (100.0)
X2 = 19.032, df = 4, p = 0.001
In the bottling industry 8 (10.8%) took alcohol thrice weekly compared to 26 (26.8%) of
the respondents in the brewing industry. There was a statistically significant difference in
the frequency of intake of alcohol among respondents (p = 0.001)

66
TABLE 10: RESPONDENTS’ INVOLVEMENT IN SPORTING ACTIVITY
Involved in sporting
activity
Industry
Bottling
Freq. (%)
Brewing
Freq. (%)
Yes
No
116 (57.7)
85 (42.3)
80 (54.0)
68 (46.0)
Total
201 (100.0)
148 (100.0)
X2 = 0.463, df = 1 , p = 0.496
One hundred and sixteen (57.7%) of the respondents were involved in sporting activity in
the previous week prior to the study in the bottling industry compared to 80 (54.0 %) of
respondents in the brewing industry studied. There was no statistically significant
difference (p = 0.496) in involvement in sporting activity among respondents in both
industries. The sporting activities included jogging, brisk walking and football.

67
TABLE 11: PRE- EMPLOYMENT MEDICAL EXAMINATION
Pre employment medical
examination
Industry
Bottling
Freq. (%)
Brewing
Freq. (%)
Yes
No
121 (60.2)
80 ( 39.8)
64 (43.2 )
84 ( 56.8)
Total
201 (100.0)
148 (100.0)
X2 = 9.838, df = 1, p = 0.002 OR = 1.99, 95% CI = 1.26 – 3.13
One hundred and twenty one (63.0%) of respondents in the bottling industry had a medical
examination in the past before starting work in the industry compared to 64 (44.0%) in the
brewing industry. There was a statistically significant difference (OR = 1.99, 95% CI =
1.26 – 3.13) in the proportion of respondents who had a medical examination before
starting work in both industries.

68
TABLE 12: PERIODIC MEDICAL EXAMINATION
Periodic medical
examination
Industry
Bottling
Freq. (%)
Brewing
Freq. (%)
Yes
No
126(62.7)
75 (37.3)
38 (25.7)
110 (74.3)
Total
201 (100.0)
148 (100.0)
X2 = 49.87, df = 1 , p = 0.000 OR = 4.86, 95% C.I = 2.97 – 7.98
One hundred and twenty six (62.7%) respondents in the bottling industry had a medical
examination in the past since starting work in the industry compared to 38 (25.7%) in the
brewing industry. There was a statistically significant difference (OR = 4.86, 95% C.I =
2.97 – 7.98) in the proportion of respondents who had a medical examination since starting
work in both industries.

69
TABLE 13: RESPONDENTS WHO WERE BEING TREATED FOR
HYPERTENSION OR DIABETES MELLITUS
On treatment
Industry
Bottling
Freq. (%)
Brewing
Freq. (%)
Yes
No
9 (4.5)
192 ( 95.5)
11 ( 7.4)
137 ( 92.6)
Total
201 (100.0)
148 (100.0)
X2 = 1.38, df = 1, p = 0.241 OR = 0.58, 95% = 0.22 – 1.57
Nine (4.5% ) of respondents in the bottling industry were being treated for a chronic illness
compared to 11 ( 7.4% ) in the brewing industry. Further data analysis showed that
Hypertension was the predominant chronic illness in the bottling 7 (87.5%) and brewing 9
(81.8%) respondents were receiving treatment for. There was no statistically significant
difference ( OR = 0.58, 95% = 0.22 – 1.57 ) in the distribution of respondents being
treated for a chronic illness in both industries studied.
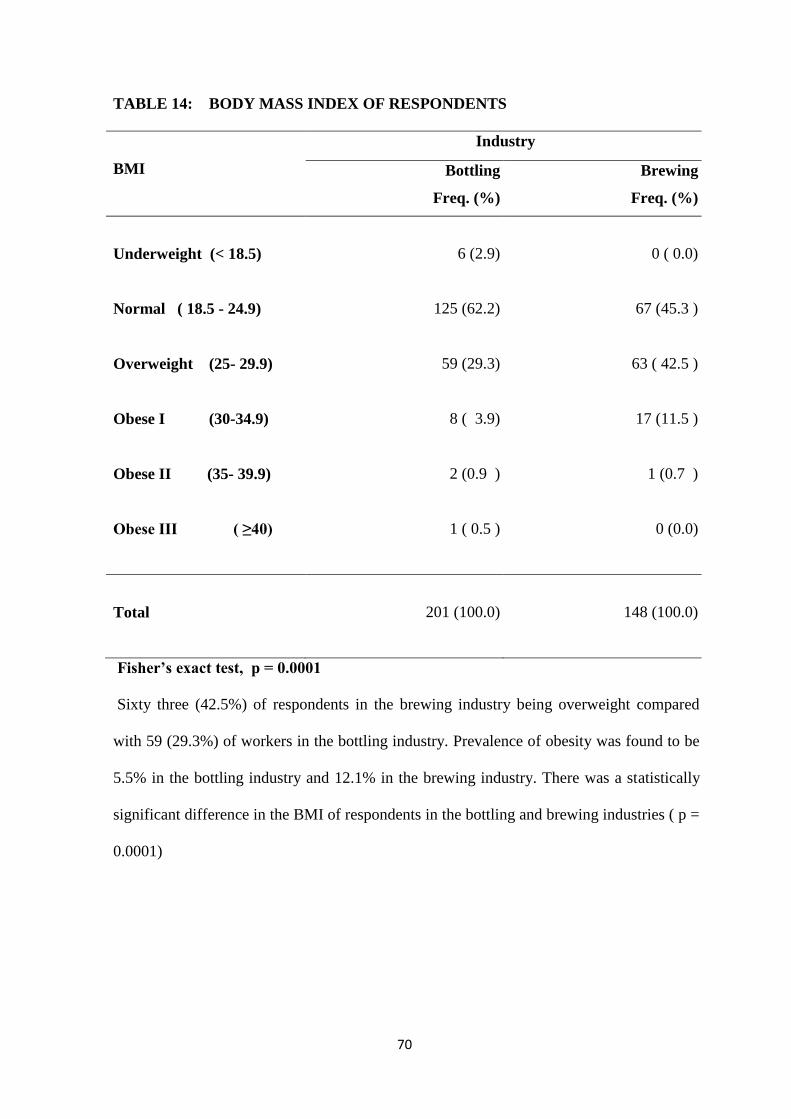
70
TABLE 14: BODY MASS INDEX OF RESPONDENTS
BMI
Industry
Bottling
Freq. (%)
Brewing
Freq. (%)
Underweight (< 18.5)
Normal ( 18.5 - 24.9)
Overweight (25- 29.9)
Obese I (30-34.9)
Obese II (35- 39.9)
Obese III ( ≥40)
6 (2.9)
125 (62.2)
59 (29.3)
8 ( 3.9)
2 (0.9 )
1 ( 0.5 )
0 ( 0.0)
67 (45.3 )
63 ( 42.5 )
17 (11.5 )
1 (0.7 )
0 (0.0)
Total
201 (100.0)
148 (100.0)
Fisher’s exact test, p = 0.0001
Sixty three (42.5%) of respondents in the brewing industry being overweight compared
with 59 (29.3%) of workers in the bottling industry. Prevalence of obesity was found to be
5.5% in the bottling industry and 12.1% in the brewing industry. There was a statistically
significant difference in the BMI of respondents in the bottling and brewing industries ( p =
0.0001)

71
TABLE 15: BLOOD PRESSURE OF RESPONDENTS
Blood pressure [mmHg]
Industry
Bottling Freq. (%)
Brewing Freq. (%)
Normal
[<130/ <85]
High normal
[130-139/ 85 - 89]
Mild Hypertension (Grade
I)
[140 – 159/ 90 - 99]
Moderate Hypertension
(Grade II)
[ 160 – 179/ 100 - 109]
Severe Hypertension
(Grade III)
[>180 / ≥110]
105 ( 52.2 )
43 (21.4 )
44 ( 21.9 )
6 ( 2.9)
3 (1.4)
78( 52.7 )
25 ( 16.9 )
20 (13.5 )
15 (10.2 )
10 ( 6.8 )
Total
201 ( 100.0 )
148 ( 100.0 )
X2 = 17.735, df = 4, p = 0.001
The prevalence of high blood pressure was found to be 26.4% in the bottling industry and
30.0% in the brewing industry. There was a statistically significant difference in the blood
pressure categories of respondents in the bottling and brewing industries studied (p
=0.002).

72
TABLE 16: RANDOM BLOOD GLUCOSE OF RESPONDENTS
Random blood glucose
Industry
Bottling
Freq. (%)
Brewing
Freq. (%)
Normal
197 (98.0)
139 (93.9 )
Impaired glucose tolerance
3 (1.5)
5 ( 3.4)
Diabetes mellitus
1 (0.5) 4 ( 2.7 )
Total
201 (100.0)
148 (100.0)
Fisher’s exact, p=0.1319
[Normal < 139mg/dl, Impaired glucose tolerance 140-199mg/dl, Diabetes mellitus >
200mg/dl].
The prevalence of diabetes mellitus was 0.01% in the bottling industry and 2.7% in the
brewing industry studied. There was no statistically significant difference in the random
blood glucose measurements of respondents (p = 0.1319) in both industries.

73
TABLE 17: MULTIPLE CORRELATIONS OF AGE, BMI, BP (SYSTOLIC), BP
(DIASTOLIC) AND RBG OF RESPONDENTS IN THE BOTTLING
INDUSTRY
AGE BMI BP(SYSTOLIC) BP(DIASTOLIC) RBG
AGE
Pearson correlation
Sig.(2 tailed)
N
1
201
442**
.000
201
177*
.012
201
.392**
.000
201
.130
.067
201
BMI
Pearson correlation
Sig.(2 tailed)
N
442**
.000
201
1
201
.101
.154
201
.199**
.005
201
.024
.738
201
BP(SYSTOLIC)
Pearson correlation
Sig.(2 tailed)
N
.177*
.012
201
.101
.154
201
1
201
.
.661**
.000
201
.
297**
.000
201
BP(DIASTOLIC)
Pearson correlation
Sig.(2 tailed)
N
.392**
.000
201
.199**
.005
201
.661**
.000
201
1
201
235**
.001
201
RBG
Pearson correlation
Sig.(2 tailed)
N
.130
.067
201
.024
.738
201
.297**
.000
201
.235**
.001
201
1
201
** Correlation is significant at 0.01 level (2 – tailed)
*Correlation is significant at 0.05 level (2 – tailed)
Correlating the above variables with diastolic BP it is observed that that all the
correlations are significant at 0.01 level and range from .199 to .661. systolic and diastolic
blood pressure being, expectedly, moderately correlated (0.661), BMI (0.199) and random
blood glucose (0.235) having little, if any, correlation with BP(diastolic) . Age (0.392) had
a low correlation with the BP (diastolic) of respondents in the bottling industry.

74
TABLE 18: MULTIPLE CORRELATIONS OF AGE, BMI, BP (SYSTOLIC), BP
(DIASTOLIC) AND RBG OF RESPONDENTS IN THE BREWING INDUSTRY
** Correlation is significant at 0.01 level (2 – tailed)
*Correlation is significant at 0.05 level (2 – tailed)
Correlating the above variables with diastolic BP it is observed that the correlations of age
and BP (systolic) were significant at 0.01 level, while the correlations of BMI and RBG
were significant at 0.05 level with a range from. 208 to 731. systolic and diastolic blood
pressure being highly correlated (0.731), BMI (0.208) and random blood glucose (0.210)
and age (0.311) having a low correlation with BP (diastolic) of respondents studied in the
brewing industry.
AGE BMI BP(SYSTOLIC) BP(DIASTOLIC) RBG
AGE
Pearson correlation
Sig.(2 tailed)
N
1
148
.064
.436
148
.410**
.000
148
.311**
.000
148
.177*
.031
148
BMI
Pearson correlation
Sig.(2 tailed)
N
.064
.436
148
1
148
.159
.053
148
.208*
.011
148
.032
.702
148
BP(SYSTOLIC)
Pearson correlation
Sig.(2 tailed)
N
.410**
.000
148
.159
.053
148
1
148
731**
.000
148
.279**
.001
148
BP(DIASTOLIC)
Pearson correlation
Sig.(2 tailed)
N
.311**
.000
148
.208*
.011
148
.731**
.000
148
1
148
.210*
.010
148
RBG
Pearson correlation
Sig.(2 tailed)
N
.177*
.031
148
.032
.702
148
.279**
.001
148
.210*
.010
148
1
148

75
TABLE 19: KNOWLEDGE AND PRACTICE OF PERSONAL PROTECTIVE
EQUIPMENTS USE BY RESPONDENTS*
Type
Industry
Bottling (N =201) Brewing (N = 148)
Knowledge
Freq. (%)
Practice
Freq. (%)
Knowledge
Freq. (%)
Practice
Freq.(%)
Helmet
Face shield
Eye goggle
Earmuff/ earplug
Nose mask
Hand gloves
Safety shoes
Coveralls
185 (92.0)
161 (80.1)
193 (96.0)
194 (96.5)
180 (89.6)
195 (97.0)
194 ( 96.5)
192 (95.5)
54 (26.9)
39 (19.4)
105 (52.2)
117 (58.2)
82 (40.8)
140 (69.7)
184 (91.5)
178 (88.5)
128 (86.5)
111 (75.0)
139 (94.0)
126 (85.1)
35 (91.2)
143 (96.6)
139 (93.9)
137 (92.6)
21 (14.2)
20 (13.5)
63 (42.5)
27 (18.2)
49 (33.1)
77 (52.0)
65 (43.9)
71 (48.0)
* Multiple responses
Respondents in the bottling industry knew of the PPEs required in the industry in the
following order for the first four namely hand gloves 195 (97.0%), ear muff/ earplugs 194
(96.5 %), safety shoes 194 (96.5%), eye goggles 193 (96.0%) whereas respondents in the
brewing industry were aware of PPEs used in the industry in the following order for the
first four namely hand gloves 143 (96.6%), safety shoes 139 (93.9%), eye goggle 139
(94.0%), coveralls 137 (92.6%)

76
The four most frequently used PPEs by respondents in the bottling industry were safety
shoes 184 (91.5%), coveralls 178 (88.5%), hand gloves 140 (69.7%) and ear muff/ earplug
117 (58.2%) whereas the four most frequently used PPEs among respondents in the
brewing industry studied were coveralls hand gloves 77 (52.0%), 71 (48.0%), safety shoes
65 (43.9%) and eye goggle 63 (42.5%) respectively.

77
TABLE 20: TRAINING IN THE CORRECT USE OF PERSONAL PROTECTIVE
EQUIPMENT BY RESPONDENTS
Received training
Industry
Bottling
Freq. (%)
Brewing
Freq. (%)
Yes
No
150 (74.6)
51 (25.4)
61 (41.2 )
87 ( 58.8)
Total 201 (100.0) 148 (100.0)
X2 = 39.801 , df = 1, p = 0.000 OR = 4.19, 95% CI = 2.59 – 6.80
One hundred and fifty (74.6%) of respondents in the bottling industry had received training
on the correct use of PPEs compared to 61 (41.2%) in the brewing industry studied. There
was a statistically significant difference ( p= 0.000) in receiving training in the correct use
of PPES between respondents in both industries studied with proportionally more
respondents in the bottling industry having received training in the correct use of PPEs.

78
TABLE 21: DIFFICULTY USING PERSONAL PROTECTIVE EQUIPMENT BY
RESPONDENTS
Difficulty using PPEs
Industry
Bottling
Freq. (%)
Brewing
Freq. (%)
Yes
No
11 ( 5.5 )
190 ( 94.5)
11 ( 7.4)
137 (92.6 )
Total 201 (100.0) 148 (100.0)
X2 = 0.554 , df = 1 , p = 0.457 OR = 0.72, 95% CI = 0.28 – 1.85
Majority of respondents in the bottling industry 190 (94.3%) and brewing industry 137
(92.6%) had no difficulty in using the PPEs provided. There was no statistically significant
difference (p = 0.457) observed among respondents in both industries.
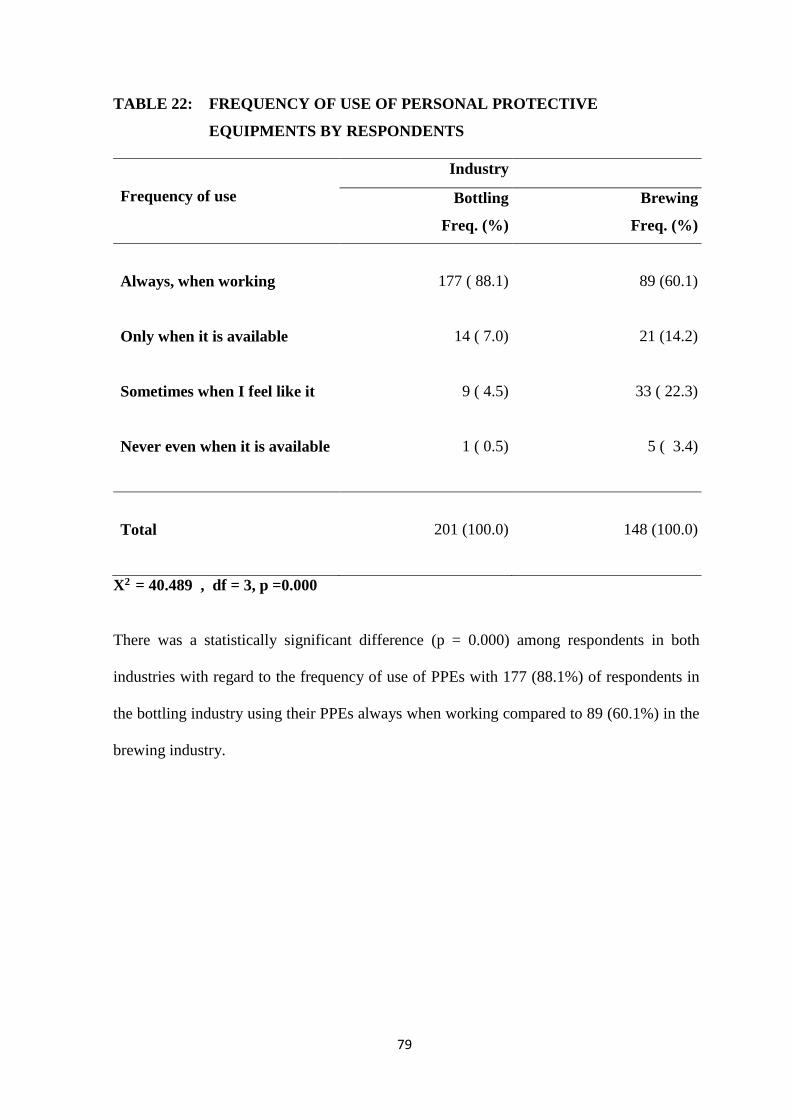
79
TABLE 22: FREQUENCY OF USE OF PERSONAL PROTECTIVE
EQUIPMENTS BY RESPONDENTS
Frequency of use
Industry
Bottling
Freq. (%)
Brewing
Freq. (%)
Always, when working
Only when it is available
Sometimes when I feel like it
Never even when it is available
177 ( 88.1)
14 ( 7.0)
9 ( 4.5)
1 ( 0.5)
89 (60.1)
21 (14.2)
33 ( 22.3)
5 ( 3.4)
Total
201 (100.0)
148 (100.0)
X2 = 40.489 , df = 3, p =0.000
There was a statistically significant difference (p = 0.000) among respondents in both
industries with regard to the frequency of use of PPEs with 177 (88.1%) of respondents in
the bottling industry using their PPEs always when working compared to 89 (60.1%) in the
brewing industry.
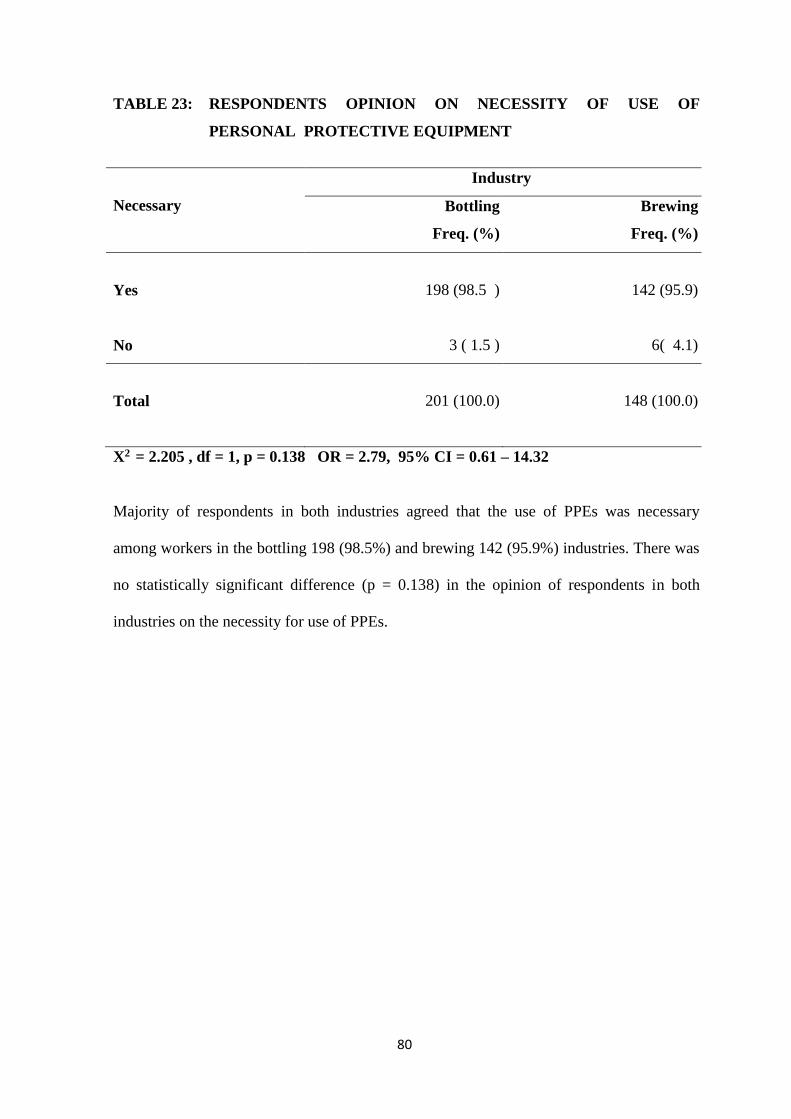
80
TABLE 23: RESPONDENTS OPINION ON NECESSITY OF USE OF
PERSONAL PROTECTIVE EQUIPMENT
Necessary
Industry
Bottling
Freq. (%)
Brewing
Freq. (%)
Yes
No
198 (98.5 )
3 ( 1.5 )
142 (95.9)
6( 4.1)
Total
201 (100.0)
148 (100.0)
X2 = 2.205 , df = 1, p = 0.138 OR = 2.79, 95% CI = 0.61 – 14.32
Majority of respondents in both industries agreed that the use of PPEs was necessary
among workers in the bottling 198 (98.5%) and brewing 142 (95.9%) industries. There was
no statistically significant difference (p = 0.138) in the opinion of respondents in both
industries on the necessity for use of PPEs.

81
TABLE 24: RESPONSIBILITY FOR PREVENTION OF ACCIDENTS IN THE
WORKPLACE
Responsibility
Industry
Bottling
Freq. (%)
Brewing
Freq. (%)
Management
Supervisors
Workers
Everybody
30 (14.9 )
10 (4.9 )
4 ( 2.0)
157 ( 78.1)
45 (30.4 )
3 ( 2.0 )
14 ( 9.5 )
86 ( 58.1)
Total
201 (100.0)
148 (100.0)
X2 = 25.851 , df = 3, p = 0.000
One hundred and fifty three (78.1%) respondents in the bottling industry stated that
everybody was responsible for prevention of accidents in the workplace compared to 83
(58.1%) in the brewing industry. There was a statistically significant difference (p = 0.000 )
in the opinion of respondents in the bottling and brewing industries on who was responsible
for prevention of accidents in the workplace with

82
TABLE 25: HEALTH AND SAFETY TRAINING AT WORK
Received training
Industry
Bottling
Freq. (%)
Brewing
Freq. (%)
Yes
No
152 (75.6)
49 (24.4)
62 ( 41.9)
86 (58.1 )
Total
201 (100.0)
148 (100.0)
X2 = 40.885 , df = 1, p = 0.000 OR = 4.30, 95% = 2.65 – 6.99
One hundred and fifty two (75.6%) of respondents in the bottling industry had received
health and safety training at work compared to 62 (41.9%) of respondents in the brewing
industry. There was a statistically significant difference (p= 0.000) in receiving health and
safety training among respondents in both industries studied.

83
TABLE 26: FREQUENCY OF HEALTH AND SAFETY TRAINING FOR
RESPONDENTS AT WORK
Frequency
Industry
Bottling
Freq. (%)
Brewing
Freq. (%)
Monthly
Quarterly
Half yearly
Yearly
Rarely
60 (29.8 )
32 ( 15.9 )
11 ( 5.5 )
26 (12.9 )
49 (35.8 )
1 (0.6 )
3 (2.0 )
3 (2.0)
9 (6.1)
132 (89.2)
Total
201 (100.0)
148 (100.0)
X2 = 125.711 , df = 4 , p = 0.000
One hundred and thirty two (89.1%) of respondents in the brewing industry reported as not
receiving any health and safety training compared with 49 (35.8%) in the bottling industry
studied. There was a statistically significant difference in the frequency of health and
safety training to respondents in the bottling and brewing industries (p= 0.000) with

84
TABLE 27: KNOWLEDGE OF A HEALTH AND SAFETY COMMITTEE IN
THE INDUSTRY BY RESPONDENTS
Knowledge
Industry
Bottling
Freq. (%)
Brewing
Freq. (%)
Correct
Incorrect
162 (80.6 )
39 ( 19.4)
39 ( 26.3)
109 ( 73.6)
Total
201 (100.0)
148 (100.0)
X2 = 102.696 , df = 1 , p = 0.000 OR = 11.61, 95% CI = 6.80 – 19.93
One hundred and sixty two (80.6%) of respondents in the bottling industry had a correct
knowledge of a health and safety committee in the industry compared to 39 (26.3%) of
respondents in the brewing industry. There was a statistically significant difference (p =
0.000) in the knowledge of respondents on a health and safety committee in the industry.

85
TABLE 28: PRACTICE OF OCCUPATIONAL HEALTH AND SAFETY BY
RESPONDENTS
Level of practice
Industry
Bottling
Freq. (%)
Brewing
Freq. (%)
Poor
Fair
Good
18 ( 9.0 )
34 (16.9)
149 (74.1)
78 (52.7 )
45 ( 30.4)
25 (16.9)
Total
201 (100.0)
148 (100.0)
X2 = 122.168 , df = 2 , p = 0.000
One hundred and forty nine (74.1%) in the bottling industry had a good practice while 78
(52.7%) in the brewing industry had a poor practice of occupational health and safety.
There was a statistically significant difference (p= 0.000) in the practice of occupational
health and safety by respondents in both industries.

86
TABLE 29: SOCIO DEMOGRAPHIC CHARACTERISTICS AND PRACTICE
OF OCCUPATIONAL HEALTH AND SAFETY AMONG
RESPONDENTS IN THE BOTTLING INDUSTRY
Variable
Practice of Occupational Health and
Safety
Total
Freq. (%)
N=201
Test statistic Poor
Freq. (%)
n=18
Fair
Freq. (%)
n=34
Good Freq.
(%)
n=149
Age group
15 – 24
25 -34
35 - 44
45 – 54
>55
7 (14.3)
7 ( 6.2)
2 (9.1)
2 (13.3)
0 (0.0)
10 (20.4)
17 (15.0)
4 (18.2)
2 (20.0)
0 ( 0.0)
32 (65.3)
89 (78.8)
16 (72.7)
10 (66.7)
2 (100.0)
49(100.0)
113(100.0)
22(100.0)
15(100.0)
2(100.0)
X2 =5.524
df= 8
p=0.700
Marital status
Single
Married
12 (10.3 )
6 (7.1)
20 ( 17.2)
14 (16.7)
85 (73.2 )
64 ( 76.2 )
116(100.0)
84 (100.0)
X2 =0.617
df= 2
p=0.734
Level of education
Primary
Secondary
Tertiary
1 (9.1)
4 (7.4)
13(9.6)
1(9.1)
9(16.7)
24(17.8)
10(81.8)
41(75.9)
99(72.6)
12(100.0)
54(100.0)
135(100.0)
X2 =1.088
df= 4
p=0.896
Duration of
employment
(years)
0.5 – 5
6 – 10
>10
13 ( 7.8 )
4 (8.2)
1 (14.3)
22 (14.9)
10 (20.4)
2 (28.6)
110 ( 74.3)
35 (71.4)
4 (57.1)
148(100.0)
49(100.0)
79100.0)
X2 =1.692
df= 4
p=0.792
There was no statistically significant association between the age (p=0.700), marital status
(p=0.734), level of education (p=0.896) and the duration of employment of respondents
with their practice of occupational health and safety.
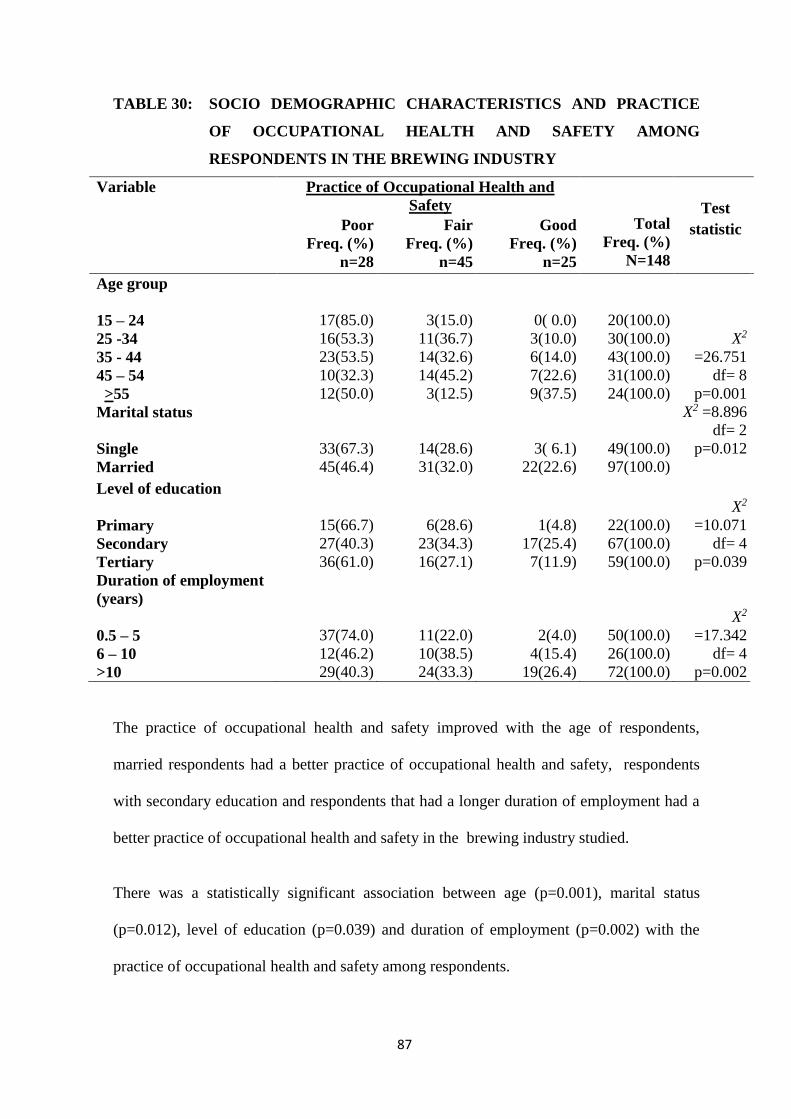
87
TABLE 30: SOCIO DEMOGRAPHIC CHARACTERISTICS AND PRACTICE
OF OCCUPATIONAL HEALTH AND SAFETY AMONG
RESPONDENTS IN THE BREWING INDUSTRY
Variable
Practice of Occupational Health and
Safety
Total
Freq. (%)
N=148
Test
statistic Poor
Freq. (%)
n=28
Fair
Freq. (%)
n=45
Good
Freq. (%)
n=25
Age group
15 – 24
25 -34
35 - 44
45 – 54
>55
17(85.0)
16(53.3)
23(53.5)
10(32.3)
12(50.0)
3(15.0)
11(36.7)
14(32.6)
14(45.2)
3(12.5)
0( 0.0)
3(10.0)
6(14.0)
7(22.6)
9(37.5)
20(100.0)
30(100.0)
43(100.0)
31(100.0)
24(100.0)
X2
=26.751
df= 8
p=0.001
Marital status
Single
Married
33(67.3)
45(46.4)
14(28.6)
31(32.0)
3( 6.1)
22(22.6)
49(100.0)
97(100.0)
X2 =8.896
df= 2
p=0.012
Level of education
Primary
Secondary
Tertiary
15(66.7)
27(40.3)
36(61.0)
6(28.6)
23(34.3)
16(27.1)
1(4.8)
17(25.4)
7(11.9)
22(100.0)
67(100.0)
59(100.0)
X2
=10.071
df= 4
p=0.039
Duration of employment
(years)
0.5 – 5
6 – 10
>10
37(74.0)
12(46.2)
29(40.3)
11(22.0)
10(38.5)
24(33.3)
2(4.0)
4(15.4)
19(26.4)
50(100.0)
26(100.0)
72(100.0)
X2
=17.342
df= 4
p=0.002
The practice of occupational health and safety improved with the age of respondents,
married respondents had a better practice of occupational health and safety, respondents
with secondary education and respondents that had a longer duration of employment had a
better practice of occupational health and safety in the brewing industry studied.
There was a statistically significant association between age (p=0.001), marital status
(p=0.012), level of education (p=0.039) and duration of employment (p=0.002) with the
practice of occupational health and safety among respondents.

88
TABLE 31: SATISFACTION WITH PRESENTLY ASSIGNED JOB
Satisfied Bottling
Freq. (%)
Brewing
Freq. (%)
Yes
No
150 (74.6)
51 (25.4)
80 (54.0)
68 (46.0)
Total
201 (100.0)
148 (100.0)
X2 = 16.054 , df = 1 , p = 0.000 OR = 2.50, 95% C.I = 1.55 – 4.04
Majority of the respondents in the bottling company 150 (74.6%) were satisfied with their
job compared with 80 (54.0%) in the brewing industry studied. There was a statistically
significant difference (OR = 2.50, 95% C.I = 1.55 – 4.04) in the satisfaction of
respondents with their jobs in both industries.

89
IN - DEPTH INTERVIEW
In depth interviews were conducted with the human resources officers in the two industries
following their informed consent. Below is a report of both interviews using the in-depth
interview guide.
1. What in your opinion is occupational health and safety in this industry
Bottling: Occupational health and safety is balancing the burden of work and the health of
staff so that over time they are still as effective as expected.
Brewing: It is working with the axiom “safety first and safety always”, the need to protect
the staff from injuries and industrial accidents.
2. Who in your opinion is responsible for health and safety in the workplace:
management, supervisors, workers or all the above.
Bottling: Everybody, your safety is your responsibility
Brewing: Safety is everybody’s responsibility though management has a heavier burden to
ensure safety.
3. Is there a specific officer in charge of health and safety in the workplace
Bottling: Yes, the safety manager.
Brewing: Yes, there is a safety officer in this factory.
4. Is there a health and safety committee in this industry
Bottling: Yes, they are known in this factory as the “emergency response team”
Brewing: No
5. If yes, what are the duties of the health and safety committee
Bottling: They investigate injuries and accidents thoroughly, they supervise periodic pep
talks on health and safety to employees, they ensure staff and contractors are PPE
compliant and ensure that plant safety rules and code of conduct are kept by staff and
contractors.

90
6. If no, will it be necessary to set up a health and safety committee in this
industry
Brewing: It won’t be necessary as the safety officer takes care of that.
7. Is there a need for training of factory workers in occupational safety
Bottling: Yes there is a need for safety training and it is done periodically in the year in
this factory. Every new staff or visitor to the plant goes through a brief induction
programme (10 minutes HSE video) the first time he enters the factory. A more elaborate
training is given subsequently employees are provided free copies of the “Staff safety
induction handbook” and “Employees health and safety at work handbook”.
Brewing: Yes there is a need for safety training but none has been done in the past year.
8. Can you mention some of the personal protective equipment provided for
workers in this industry
Bottling: Safety shoes, coveralls, ear plugs/ ear muffs, eye goggles
Brewing: Helmet, glove, nose mask, safety shoes, coveralls.
9. In your opinion are workers compliant with the use of personal protective
equipment and in the practice of safety in the Industry
Bottling: Yes, spot check show an average of 75% compliance every month
Brewing: Yes, there are sanctions for unsafe acts in the factory such as query and
suspension to erring workers.
10. Are there incentives to workers on good occupational health and safety
practices
Bottling: Yes there are, such as commendations, distribution of promotional gift items
such as T-shirts, fez caps, insecticide treated nets and mugs.
Brewing: None presently in the factory.
11. If, no will you consider incentives as necessary.

91
Brewing: Yes, they would be necessary to encourage staff. Awards can be given.
12. Are health promotional activities appropriate in this industry viz health
education, health screening, incentive programme, recreational activities etc. (kindly
state them).
Bottling: Yes but there is room for improvement as we just concluded a heath week in
December comprising health talks, free health screening and a walk for life
programme. There is presently no area delineated for recreational activities in the factory.
Brewing: More still needs to be done.
13. What would you suggest to improve occupational health and safety in this
industry.
Bottling: Continuous education of workers on health and safety, improvement in
observations already made in the factory. There has been strong emphasis on OHS in the
workplace since the unfortunate fire incident of 2008. A lot of improvement has however
happened since then such as the establishment of an emergency response team, provision of
fire hydrants in various points in the factory, first aid training and the annual health week
for employees. Even at that there is still room for improvement following observations you
might have made in this factory.
Brewing: Increase in the number of PPEs provided, increased training of workers on health
and safety, prompt payment of health retainers for the care of workers and improved
equipping and stocking of staff clinic.

92
CHAPTER FIVE
DISCUSSION
The mean age of respondents and the mean duration of employment of workers in the
bottling industry were 30 ± 7.9 and 4.8 ± 5.4 years respectively, this was lower than the
mean age and duration of employment of respondents in the brewing industry at 39.8 ±
12.2 and 11.3 ± 9.6 years. A possible reason could be the relative difference in the date of
establishment of these industries in Benin City. The Brewing industry was established in
1974 while the bottling industry began production in Benin City in 2000 even though it was
established in Nigeria in 1952.
Expectedly the Benin Ethnic group comprised the majority in both industries studied at
28.9% in the bottling industry and 36.5% in the brewing industry. This was followed by the
Yoruba (19.4%) and the Esan (28.4%) ethnic groups in the bottling and brewing industries
respectively. While the brewing industry represented the order of distribution of an Edo
state owned industry, the Bottling company, headquartered in Lagos, reflected a
cosmopolitan distribution of its employees in Benin City as staff can be transferred from
factories in other locations to work in Benin City. The majority of respondents in both
industries were male 94.5% in the bottling industry and 90.5% in the brewing industry
which is expected in a manufacturing Industry going by estimates from National Bureau of
Statistics79.
While most of the respondents in the bottling industry were single (58.2%), most of the
respondents in the brewing industry were married (65.5%). The relative difference in age
and duration of employment of respondents could explain this difference (p =0.000) in
marital status in the industries. Age and employment status determine significantly
preparedness for marriage in various ethnic groups in Nigeria. In both industries majority

93
of respondents were Christians which was in keeping with the predominant religion in Edo
state.
The beverage Industries employ people of varied academic qualifications ranging from
illiterate and semi literate involved in farming and harvesting raw materials to semi –
skilled and highly skilled professionals involved in the highly automated processes6 of
production of the beverages. Edo state provides a rich pool of such academically qualified
manpower having the second largest adult literacy rate (91.1%) in Nigeria after Lagos state
and having an unemployment rate as at 2005 of 8.0% when the national average was
11.9%85. Majority of respondents in the bottling industry (67.1%) had tertiary education
while most of the respondents in the brewing industry had secondary education (45.2%).
The production department employed the largest proportion of respondents in both
industries with (75.6%) bottling and (58.2%) in the brewing industry respectively, this was
expected of a factory46,50.
The risk assessment showed that workers in the bottling and brewing Industries were
mainly exposed to mechanical hazards such as broken glass, slippery floor, repetitive
motion and unguarded machinery/ moving machine parts especially in the re usable glass
bottle section of both industries. This was similar to the reports of the HSE on the beverage
industries. Interventions to reduce occupational injuries should be targeted at those
production lines as they contribute to a large proportion of the injury burden. The mean
level of noise and particulate in air in both industries was within the permissible exposure
limit of the Federal Ministry of Environment. The highest level of noise occurred in the
Generator houses of both Industries. This was in keeping with the finding in an earlier
study33 on Industrial employees exposure to noise in five industries including a bottling
and a brewing factory in Ilorin metropolis, where it was observed that there has been a drop

94
in the mean noise levels in bottling and brewing Industries in the last 20 years which could
have been due to change of processes in the factories. It was stated that over all, the
average noise levels in these industries had reduced. A pre – employment and periodic
audiometry however would give the incidence of noise induced hearing loss among
workers as this is usually insidious in onset45. High levels of particulate in air have ceased
to be a problem in the brewing Industry due to the highly automated milling processes
present in most breweries, thus eliminating dust production50.
The prevalence rate of occupational injuries was less in the bottling industry at 263 per
1000 workers compared to the brewing industry at 506 per 1000 workers ( OR = 0.52,
95%CI = 0.44 – 0.62). Though this was in keeping with findings from the United Kingdom
citing an increased incidence of injuries among workers in the brewing industry9 the
reverse was the case from the survey of BLS data in the United States of America which
showed an increased incidence of injuries and illnesses in the bottling industry when
compared with the brewing Industry15. The proportion of workers incurring injuries at work
was high in both Industries, this could have been due to the fact that the beverage industry
requires a lot of manual handling which predisposes workers to injuries. An observation
however is that workers in the brewing Industry were at an increased risk of sustaining
occupational injuries even though hazards in both Industries were similar. A study on tile
factories in India showed an overall prevalence rate for accidents as 185 per 1000 workers
80 which was lower than that found in these beverage industries. The Indian study was a 12
month record based cross sectional study of 416 workers in three tile factories whereas this
study relied on self reporting by respondents and was comparative of the bottling and
brewing Industries.

95
Individual analysis of injuries in this study showed that the hand followed by other parts of
the upper limb was the predominant part of the body affected by injury in both industries,
studies in manufacturing industries reported that majority of accidents affected the limbs
as the main part of the body usually involved in the production process9,11 . This was in
keeping with the observations from a study on the bottling plant in Ilorin which showed
that due to the coupling of workers with the highly mechanised processes such as
depalletising the upper limbs and hands were highly exposed to most injuries20. Lacerations
were the predominant type of injury to respondents in both industries with 66.7% in the
bottling industry and 84.8% in the brewing industry, these were mostly due to cuts from
glass bottles, poorly guarded equipment or dangerous processes like palletizing. The HSE
fact sheet reports a similar pattern 11.
The cause of injury to respondents was mainly struck by/ against an object most times such
objects include glass, machine parts and pallets. If the worker is not adequately protected
such loose objects from working sections could cause injuries49. In the brewing industry a
greater proportion of accident occurred during the afternoon shift though there was no
statistically significant difference in the occurrence of accidents according to shifts covered
by respondents51. A possible reason could be the rush to hand over to a later shift or
reduced supervision in the afternoon shift compared to the morning shift in the brewing
Industry. There was no such variation in the bottling Industry.
It would seem that even though the prevalence of injuries was more in the brewing
industry, the proportion of notifiable injuries/accidents requiring the injured worker to be
off work for three days or more was slightly higher in the bottling industry (3.9%) when
compared with the brewing industry (2.7%). Fatigue following the heavier schedule of
workers observed in the bottling industry as seen in a higher proportion of them running

96
shift could aggravate the severity of injuries necessitating the more days of work following
an injury compared to the brewing industry.
The health screening revealed that with regard to the social habits of respondents most of
the respondents in the brewing industry (66.9%) took alcohol compared to a few in the
bottling Industry (26.8%). A possible reason could be an easier access to alcoholic
beverage by workers in the brewing industry. A few of the respondents in both industries
smoked cigarettes, 4.0% in the bottling industry and 7.4% in the brewing industry. Alcohol
intake and smoking are modifiable risk factors for developing cardiovascular diseases and
diabetes mellitus. The ongoing concerted Federal Ministry of Health campaign against
tobacco smoking may be responsible for the low prevalence of tobacco smoking among the
workers.
Barely above half of the respondents in both industries were involved in sporting activities
(57.7%) in the bottling and (54.0%) in the brewing industry. The sporting activities
included brisk walking, jogging, football and table tennis. There were no recreational
facilities available for workers in both industries. Cigarette smoking, alcohol intake and
lack of physical activity are known risk factors in the development of chronic diseases like
hypertension, diabetes mellitus and obesity.
Most respondents in the bottling industry (60.2%) had a pre employment medical
examination done for them compared to (43.2%) in the brewing industry which was a
statistically significant (p=0.002).
Nine (4.5%) and 12 (8.1%) of respondents in the bottling and brewing industries studied
had been diagnosed with a chronic illness (hypertension and diabetes mellitus) in the past.
All the previously diagnosed respondents except one in the brewing industry were

97
presently receiving treatment for the chronic illnesses diagnosed. Majority of those
diagnosed with a chronic illness were receiving treatment for hypertension 7 (87.5%) in the
bottling industry and 9 (81.8%) in the brewing industry. Effective work site health
promotion programmes should include health education and periodic screening for non –
communicable diseases like hypertension and diabetes mellitus to ensure prompt treatment
of the affected worker.
The prevalence of high blood pressure following the screening exercise was 26.4% in the
bottling industry and 30.0% in the brewing industry. The cut off for hypertension was set at
> 140/90mmHg following the WHO/ISH criteria some previous studies of hypertension in
Nigeria used a cut off of >160/95mmHg and thus reporting a prevalence ranging from of
10-12%24. This difference in cut off for diagnosis could account for the higher yield
reported in this study. Risk factors such as age, intake of alcohol, smoking and level of
exercise would seem to favour a higher prevalence of HBP in the brewing industry when
compared with the bottling industry. The increased health awareness in the bottling
industry following the frequency and uptake of health and safety training would favour an
early detection and treatment of respondents with regard to hypertension and other chronic
illnesses. The relatively young age of respondents in the bottling Industry compared with
the respondents in the brewing industry could put the workers at a reduced risk of
developing hypertension. A similar study among bank workers in Benin City on the
knowledge and prevalence of factors for hypertension showed a prevalence of 17.7% for
hypertension81.
The health screening exercise for diabetes mellitus using random blood glucose
measurement of respondents gave a prevalence of 0.01% in the bottling industry and a

98
prevalence of 2.7% in the brewing industry. The prevalence in the brewing industry was
similar to the national prevalence of 2.2% 23.
With regards to the body mass index (BMI) of respondents, this study showed that majority
of respondents in the bottling industry (65.1%) were of normal weight, whereas 45% of
respondents in the brewing industry were of normal weight. This study showed a
prevalence of obesity of 5.5% in the bottling industry and 12.1% in the brewing industry.
This was lower than that recorded among Nigerian adults attending Family Medicine
Clinics as outpatients in Rivers state which gave a prevalence of 14% in an urban centre
and 16.3% in a rural centre82. A possible reason could be the relatively high level of work
activity among the factory workers and the healthy worker effect which would show a
reduced prevalence among the beverage workers compared with the general population.
Multiple correlations of systolic blood pressure, diastolic blood pressure, BMI, RBG and
age showed a similar pattern in both Industries. Age however was more strongly correlated
with the systolic blood pressure of respondents in the brewing industry (r = 0.410**)
compared to the bottling Industry (r = 0.177*). The relatively older population in the
brewing Industry could explain this difference.
This study found out that the workers knew of the personal protective equipment (PPEs)
that were necessary for operations in the beverage industries. A difference though was in
the use of these PPEs by respondents, this was determined by such factors as availability,
fit and enforcement. Literature has shown that in the beverage industries safety shoes,
coveralls, ear muff / ear plugs and eye goggles were the most commonly used PPEs 31. The
use of PPEs by workers is dependent on their adequate provision by the employer, good
safety practice, demands that such workers provided with PPEs use them. The level of use
of PPEs by workers could then be an indirect means to evaluate the level of compliance

99
with safety rules. This study found that the use of these PPEs was higher in the bottling
industry compared to the brewing industry. A possible reason could be the level of safety
awareness in both industries and a higher level of availability and enforcement of PPEs in
the bottling industry. Spot checks in the bottling industry revealed an average of 75%
compliance per month (reported in- depth interview) there was no similar measure in the
brewing industry. Studies have shown improved compliance with safety rules and measures
following an improved attitude of management towards safety i.e. safety culture61, 62. The
walk through survey revealed that most workers in the bottling industry were observed to
put on their safety shoes, coveralls and ear plugs in the least, few workers in the brewing
industry had coveralls, fewer still wore safety shoes and no earplug/ear muff was observed
among workers in the brewing industry. It was observed by the researcher that visitors were
not allowed into the bottling factory without covered shoes and workers were not allowed
into the factory without safety shoes. These enforcements encourage safe work practices.
The high prevalence and frequency of accidents and injuries in the brewing could be a
consequence of inadequate provision and enforcement of PPEs. It was observed in both
Industries that there was supervision on the production floor of workers by supervisors.
The response of workers with regard to training in correct use of PPEs revealed that more
workers in the bottling industry 74.6% compared to 41.2% in the brewing industry received
training in correct use of PPEs. This was reflected in the frequency of use of PPEs by
respondents as 88.1% of workers in the bottling industry compared to 60.9% of workers in
the brewing industry. It was interesting to note that majority of workers in the bottling
industry ( 98.5%) and brewing industry ( 95.9%) considered the use of PPEs as necessary.
The gap noticed in the opinion of workers and their actual use could stem from the level of
provision of these PPEs by management, frequency and adequacy of safety education, and
the safety culture in the industries which other studies have shown52,61,62.

100
The fire incident suffered by the bottling company in 2008 could also have induced an
improved awareness and practice of OHS. The need for ISO certification on HSE by most
multinational companies such as the bottling company study may also have improved the
level of health and safety. Predictive safety management as practiced in Japan and Finland
aims at being proactive to safety and not reactive as in most situations in Nigeria51. This
serves to reduce the direct and indirect cost of accidents to industries and individuals. A
positive observation however is that with the opinion of respondents in the brewing
industry that PPEs are necessary, with adequate provision, training and motivation, their
practice could improve. This study showed that the frequency of wash of work clothes
(thrice weekly) was higher among respondents in the bottling industry at (45.8%) compared
with the brewing industry (19.6%). The opinion of respondents on whose responsibility it
was to prevent accidents in the workplace showed that the workers believed it was
everybody’s responsibility at 78.1% in the bottling industry and 58.1% in the brewing
industry. Workers in the brewing industry (30.4%) indirectly expected their management to
do more when compared with workers in the bottling industry (14.9%). Thomas Legge
clearly stated in his first Aphorism that “Unless and until the employer has done everything
– and everything means a great deal - the workman can do next to nothing to protect
himself, although he is naturally willing enough to do his share”. This aphorism remains
relevant even to findings from this study.
Majority of respondents in the bottling industry had ever received health and safety training
(75.6%) compared to (41.9%) in the brewing industry (p=0.000). Majority of respondents
in the bottling industry (80.6%) were aware of a health and safety committee referred to as
the “emergency response team”. There was no such committee available in the brewing
industry. This study showed that overall the practice of OHS was good among respondents
in the bottling industry 149 (74.1%) but poor among respondents in the brewing industry
101
78 (52.7%). Earlier highlighted factors such as adequate and frequent health and safety
education, provision of safety equipment, proper enforcement of safety rules, accident
investigation, safety training and safety committees have a positive influence on the
practice of OHS in the industry32,59. The difference in prevalence and frequency rates in
both industries would seem to be more of institutional than due to personal characteristics
of respondents.
Even though, overall, the practice of OHS was poor in the brewing industry it would seem
that practice improved, however, with increasing age of respondents, being married,
having a secondary level of education and working more than ten years in the industry37.
Studies have shown that accidents are more common with the younger age group and less
experienced workers83. This study showed that no such difference or variation among
respondents in the bottling Industry with regard to their practice of safety, a possible
reason could be the level of management support for health and safety in the bottling
industry.
It would seem that more respondents in the bottling industry (74.6%) were satisfied with
their presently assigned job compared to 54.0% in the brewing which was statistically
significant (p= 0.000). Job satisfaction plays a positive role in reducing accidents in the
workplace while psycho social stressors increase them61.
Finally, the type of ownership of these companies could be the main factor accounting for
the observed differences in occupational health and safety. State owned industries are most
time run as parastatals of the state government with the ideology of a public concern and
not a business entity. Providing baseline services, employment and public utility by such
companies is usually at the expense of efficiency and competitiveness. Private concerns as
part of multinationals, however, have international standards to live up to and remuneration

102
and incentives for their workers are sometimes better than in the public sector. These
factors may have influenced the observed differences in occupational health and safety, as
Edward Deming, the advocate of Total Quality Management, aptly stated “ 85% of the
problems in any company are from the management, just 15% are from the workers84”.
The type of management, therefore, will largely influence the level of occupational health
and safety in any Industry.

103
CONCLUSION
Information from this study showed that mechanical hazards were the main hazard
affecting workers in both industries. The level of noise and particulate in air workers were
exposed to was within the recommended permissible exposure limits in an eight – hour
work period, it was observed however that the generator houses in both industries produced
the highest level of noise which was above the permissible exposure limit.
The prevalence of injuries was higher in the brewing industry when compared with the
bottling industry. The prevalence of hypertension, diabetes mellitus and obesity was also
higher in the brewing industry when compared to the bottling industry.
The practice of occupational health and safety among respondents was good in the bottling
industry but poor in the brewing industry. This was largely due to inadequate provision of
safety equipment, absence of health and safety training in the last 12 months and the
absence of a health and safety committee in the brewing industry. A fire incident engulfing
the bottling factory in 2008 could have however influenced its’ current emphasis on safety.

104
RECOMMENDATIONS
Based on the findings from this study and the conclusions reached, the following
recommendations are hereby made:
1 There should be improved health education, safety training and adequate provision of
safety equipment especially in the brewing industry.
2 A health and safety committee should be set up in the brewing industry as this would help
in the co-ordination of health and safety programmes across all cadre of staff as is already
being done in the bottling industry
3 Pre – employment and pre - placement medical examinations should be the norm in both
industries. Health risk assessments could also be done periodically to identify workers at
risk of developing or who have developed non communicable diseases like hypertension,
diabetes mellitus and obesity. The scope could be broadened to include communicable
diseases like HIV/ AIDS.
4 Recreational facilities could be set up in both Industries to encourage physical activity and
exercise among the workers. In addition, a worksite health promotion programme for
workers especially in the brewing industry should be initiated in order to effectively
manage identified work related diseases and thus reduce workplace morbidity and
morbidity.
5 Proper records of occupational accidents and injuries should be kept by the management of
both industries.
6 The Factories inspectorate of the Federal Ministry of Labour and Productivity should
endeavour employ and train more staff to enforce proper factory inspection for the health,
safety and welfare of the Nigerian worker.
7 The current power sector reform by the Federal Government should be expedited, if
successful, it will effectively eliminate noise as a hazard produced by the various industrial

105
generating plants with their consequent pollution of the environment. This will help
safeguard the workers health as the generating plants, in most instances, are the single
highest sources of noise in the Industries.

106
REFERENCES
1 World Health Organisation. Joint ILO/WHO Committee on Occupational Health: Second
Report. World Health Organisation Technical Report Series. 66 Geneva: World Health
Organisation, 1953.
2 Asuzu MC. Occupational health: a summary introduction and outline of principles. Ibadan,
Africa–Link Books. 1994; 10-3.
3 Asogwa SE. A guide to occupational health practice in developing countries. 3rd ed. Enugu,
Snaap Press Ltd. 2007; 5.
4 Sofoluwe GO, Schram R, Ogunmekan DA, (Editors). Principles and practice of public
health in Africa, 2nd ed. Ibadan, University Press Plc. 1998; 2: 585-609.
5 Rantanen J. Basic Occupational Health Services (BOHS). Working paper for the joint
ILO/WHO Committee on Occupational Health, 3rd ed. Geneva. 2007.
6 World Health Organisation. Global strategy on occupational health for all. The way to
health at work. Geneva, WHO. 1995.
7 Hirsheimer M. Soft drink bottling and canning. In Encyclopedia of occupational health and
safety. 4th ed. Geneva, International Labour Office. 1998; 65.3.
8 International Labour Organisation. Resolutions concerning statistics of occupational
injuries (resulting from occupational accidents) adopted by the Sixteenth International
Conference of Labour Statisticians. Geneva, International Labour Organisation. 1998; 2.
9 Health and Safety Executive. Priorities for health and safety in the brewing industry. Food
information sheet 18. 1999. http://www.hse.gov.uk/pubn/fis18.pdf accessed 5 June 2010
10 Health and Safety Executive. Priorities for health and safety in the potable spirits industry.
Food information sheet 20. 1999. http://www.hse.gov.uk/pubn/fis20.pdf accessed 5 June
2010

107
11 Health and Safety Executive. Priorities for health and safety in the soft drinks industry.
Food information sheet 19. 1999. http://www.hse.gov.uk/pubn/fis19.pdf accessed 5 June
2010
12 Health and Safety Executive. Delivering health and safety in Great Britain. Health and
safety targets: how are we doing? Sudbury, HSE Books. 2003; 6-13.
13 Personick ME, Harthun LA. Profiles in safety and health: the soft drink industry. Monthly
Labour Review. 1992; 12-7.
14 Detels R, McEwan J, Beaglehole R, Tanaka H, editors. Oxford textbook of public health.
The scope of public health 4th Edition. Oxford University Press. 2002.
15 Laws of Federation of Nigeria. Volume 6. Factories acts.CAP F1. LFN, 2004.
16 Laws of Federation of Nigeria. Volume 8, Labour act.CAP W6. LFN, 2004
17 Laws of Federation of Nigeria. Volume 16. Workmen’s Compensation Act.CAP.L1. LFN,
2004.
18 International Labour Organisation. Nigeria: Report of the National occupational safety and
health information centre (CIS) Geneva, Switzerland. 14th – 15th September 2006.
Available at:
http://www.ilo/org/public/english/protection/safework/cis/about/mtg2006/pnga_mlpi.pdf
accessed 20 March 2010.
19 Occupational health, safety and welfare (Safe Work SA) Bill 2003 of South Australia.
20 Ajimotan HA. The effects of coupling repetitive motion tasks with a manually stressed
work environment. Ergonomic Reference 2009; 1(2): 37-40.
21 Amosun SL, Oduah JC. A survey of the health problems in five industrial settings in
Nigeria. Physiotherapy Theory and Practice 1992; 8(2): 109-16.
22 Oyedepo OS, Saadu AA. An overview of industrial employees’ exposure to noise in sundry
processing and manufacturing industries in Ilorin metropolis, Nigeria. Industrial Health
2009; 47(2) 123-33.
108
23 Mbanya J, Ramiaya K. Diabetes mellitus disease and mortality in Sub-Saharan Africa.
2003. Available @http://www.ncbi.nlm.nih.gov/bookshelf/br.fcgi?
book=dmssa&part=A1764 accessed on 19/06/10.
24 Akinboboye O, Idris O, Akinboboye O, Akinkugbe O. Trends in coronary artery disease
and associated risk factors in Sub- Saharan Africans. Journal of Human Hypertension.
2003; 17: 381-7
25 Siririttanapruk S, Anantagulnathi P. Occupational health and safety situation research
priority in Thailand. Industrial health. 2004; 42: 135-140.
26 Cavazza N Serpe A. Effects of safety climate on safety norm violations: exploring the
mediating role of attitudinal ambivalence toward personal protective equipment J Safety
Res. 2009; 40(4): 277-83.
27 Colon Z. Soft drinks concentrate manufacturing. In Encyclopedia of occupational health
and safety. 4th ed. Geneva, International Labour Office. 1998. 65.2.
28 Eustace JF. Brewing industry. In Encyclopedia of occupational health and safety. 4th ed.
Geneva, International Labour Office. 1998; 65.13.
29 Ward LA. Beverage Industry. In Encyclopedia of occupational health and safety. 4th ed.
Geneva, International Labour Office. 1998; 65.
30 Sutter AH. Noise. In Encyclopedia of occupational health and safety. 4th ed. Geneva,
International Labour Office. 1998; 47.
31 Sbihi H, Teschke K, Macnab YC, Davies HW. An investigation of the adjustment of
retrospective noise exposure for use of hearing protection devices. Annals of occupational
Hygiene. 2010; 54:329-39.
32 Palmer KT, Griffin MJ, Sydall HT, Loggon D. Cigarette smoking, occupational exposure
to noise and self reporting hearing difficulties. Occup Environ Med 2004; 61: 340- 344.
33 Olayinka OS, Abdullahi SA. An overview of industrial employees exposure to noise in
sundry processing and manufacturing industries in Ilorin metropolis Nigeria. Industrial
Health 2009; 47(2): 123-33.

109
34 Health and Safety Executive. The HSE grain dust study- workers’ exposure to grain dust
contaminants, immunological and clinical response (RR540). UK, HSE books. 2007; 1-5.
35 Longmore M, Wilkinson I, Torok E. Oxford handbook of clinical medicine. 5th ed. London,
Oxford University Press. 2002; 186.
36 Carveilheiro M, Gomes M, Santo O, Duarte G, Henrique J, Mendes B, Marques A, Avila
R. Sympotoms and exposure to endotoxin among brewery employees. AM J Ind Med.
1994; 25:113-5.
37 World Health Organisation. Occupational Health: a manual for primary health workers.
Cairo, EMRO-WHO. 2001; 102.
38 Bureau of Labor Statistics. Non fatal occupational injuries and illnesses requiring days
away from work. BLS, 2009
39 Australia Bureau of Statistics. Australia social trends. Canberra, ABS. 2007.
40 Bureau of labor statistics. Annual statistics report.1997. Washington DC, US Department
of labor.
41 Melamed S, Yekutiel D, Froom P, Kristal – Bone E, Ribak J. Adverse work and
environmental conditions predict occupational injuries. The Isreali cardiovascular risk
factor determination in Isreal (CORDIS) study. Am J Epidemiology 1999; 150: 18 -26.
42 Smith L, Folklards S, Poole CJ. Increased injuries on night shift. Lancet 1994; 344: 1137 –
9.
43 Harrel WA. Perceived risk of occupational injury: control over pace of work and blue
collar versus white collar work. Percept Mot Skills 1990; 70: 1351 -9.
44 Niedhammer I, Bugel I, Goldberg M, Leclerc A, Guegen A. Psychosocial factors at work
and sickness absence in the Gazel cohort: a prospective study.
45 Salminen ST. Epidemiological analysis of serious occupational accidents in Southern
Finland. Scand J. Soc Med 1994; 22: 225 – 7.

110
46 Bhattachergee A, Chau N, Sierra CO et al. Relationships of Jobs and some individual
characteristics to occupational injuries in employed people: a community based study. J
Occup Health. 2003; 45: 382-91.
47 Stout NA, Linn HL. Occupational injury prevention research: progress and priorities. Inj.
Prev. 2002; 8(suppl 4); 9-14.
48 Wagener DK, Winn DW. Injuries in working populations: Black- white difference. Am J
Public Health. 1991; 81: 1408-14.
49 Oh JH, Shin EH. Inequalities in non fatal work injury: the significance of race, human
capacity and occupations. Soc. Sci Med. 2003; 57: 2173- 82.
50 Leigh JP. Individual and job characteristics as predictors of Industrial accidents. Accid
Anal prev. 1986; 18: 209-16.
51 Oginski A, Oginska H, Pokorski J, Kmita W, Gozdziela R. Internal and external factors
influencing time-related injury risk in continous shift work. Int J. Occup Saf Ergon. 2000;
6: 405-21.
52 Gillen M, Baltz D, Gassel M, Kirsch L, Vaccaro D. Perceived safety climate, job demands,
and coworker support among union and nonunion injured construction workers. J Safety
Res. 2002; 33(1): 33-51.
53 Centers for Disease Control and Prevention. Health risk appraisals. Assessed on 27th May,
2011 @ 1230hrs.
54 Warshaw LJ. Health risk appraisal. In Encyclopedia of occupational health and safety. 4th
ed. Geneva, International Labour Office. 1998; 15.24.
55 Sunmola AM. Factors associated with consistent condom use by employees in the brewery
industry in Nigeria. Journal of social aspects of HIV/AIDS research alliance. 2004;
1(1):27-34.
56 Godnic – Cvar J, Zuskin E, Mustajbegovic J, Schachter EN, Kanceljak B, Macan J, Ilic Z,
Ebling Z. Respiratory and immunological findings in brewery workers. Am J Ind Med
1999; 35(1): 68-75.

111
57 Thygesen LC, Albertsen K, Johansen C, Gronbaek M. Cancer incidence among Danish
brewery workers. Int. J Cancer. 2005; 116(5): 774-8.
58 Hensrud DD. Clinical preventive medicine, 2nd ed. USA, AMA Press. 2004; 477-83.
59 Gruber A, Nasser K, Smith R, Sharma JC, Thomson GA. Diabetes prevention: is there
more to it than lifestyle changes? Int J Clin Pract. 2006; 60 (5): 590 – 4.
60 Carel RS, Silverberg DS, Mor G. Screening for hypertension in a working population.
Public Health.
61 Toryila JE, Mohammed A, Adelaye AB, Achia LN, Tende JA. Prevalence of overweight
and obesity among civil servants in Zaria, Nigeria. International Journalm of pure and
applied sciences; 2009: 3 (2.
62 Isah EC, Asuzu MC, Okojie OH. Occupational health hazards in manufacturing Industries
in Nigeria. Journal of Community Medicine & Primary Health Care. 1997; 9: 26-34.
63 Gomes J, Loyd OL, Revitt DM. The influence of personal protection, environmental
hygiene and exposure to pesticides in a desert country. Int Arch Occup Environ Health
1999; 72(1): 40-45.
64 Marcel S. Safety culture and management. In Encyclopedia of occupational health and
safety. 4th ed. Geneva, International Labour Office.1998. 59.4.
65 Garcia AM, Boix P, Canosa C. Why do workers behave unsafely at work? Determinants of
safe work practices in industrial workers. Occup Environ Med. 2004 Mar; 61(3): 239-46.
66 Cavazza N Serpe A. Effects of safety climate on safety norm violations: exploring the
mediating role of attitudinal ambivalence toward personal protective equipment J Safety
Res. 2009; 40(4): 277-83.
67 Zohar D.A group-level model of safety climate: testing the effect of group climate on
microaccidents in manufacturing jobs. J Appl Psychol. 2000; 85(4): 587-96.

112
68 Federal Government of Nigeria. Legal notice on publication of the details of the breakdown
of the National and State provisional totals of the 2006 census. Federal Republic of Nigeria
Official Gazette, 2007; 97(24): B184.
69 Ibrahim T. Research methodology and dissertation writing for health and allied health
professionals. Abuja, Cress Global Link Ltd. 2010; 33-52.
70 Micheal Swash. Hutchinson’s clinical methods. 20th ed. London, W.B Saunders. 1995; 61-
74, 165-206, 462-3.
71 National health and nutrition examination survey (NHANES) III. Body measurements
(anthropometry) manual available from:
www.cdc.gov/nchs/data/nhanes3/cdrom/nchs/manual/anthro.pdf (cited 14/09/2010
1400hrs)
72 World Health Organisation. Obesity: prevention and managing the global epidemic.
Report of a WHO Technical Report Series. 894. Geneva: World Health Organisation. 2000.
73 World Health Organisation / International Society of Hypertension Guidelines for the
management of hypertension. J Hypertension, 1999; 17: 151 – 83.
74 Pickering TG, Hall JE, Appel W, Falkner BE, Graves J, Hill MN et al. Recommendations
for blood pressure measurements in humans and experimental animals: part 1: blood
pressure measurements in humans: a statement for professional and public education of the
American Heart Association Council on high blood pressure research. Hypertension. 2005;
45: 142 – 61.
75 ACCU-CHEK Advantage, Roche Diagnostics GmbH, Sandhofer Strasse 116, D-68305.
Manheim, Germany. 2003.
76 Federal Ministry of Health. Standard treatment guidelines. Nigeria, FMOH. 2008; 91.
77 BK Precision. Sound level meter. California, BK Precision Corp. 2000.
78 Environmental Devices Corporation. HAZ DUST – 1000. New Hampshire, Environmental
Devices Corporation. 2006

113
79 National Bureau of statistics. Social statistics in Nigeria. Federal Republic of Nigeria 2009;
54, 228
80 Ganesh Kumar S, Rathnaker UP, Harsha Kumar HN Epidemiology of accidents in tile
factories in Mangalore city in Karnataka. Indian J of Community Med. 2010; 35 (1): 78 -
81.
81 Ofili AN, Omuemu VO. The Knowledge and prevalence of risk factors for hypertension
among workers in the banking Industry in Benin City, Edo State, Nigeria. The Tropical
Journal of Health Sciences. 2005; 12 (1): 26 – 30).
82 Siminialayi IM, Emem – Chioma PC, Dapper DV. The prevalence of obesity as indicated
by BMI and waist circumference among Nigerian adults attending family medicine clinics
as outpatients in Rivers state. Nigerian Journal of Medicine. 2008; 17 (3): 340 -345.)
83 Saha A, Kulkarni PK, Chaudhari R, Saiyed H Occupational Injuries: is job security a
factor? Indian J Med Sci. 2005;59 (9): 375 – 81.
84 Walton M. The Deming Management Method. New York, Putnam Publishing Group.
1986. 145.