health insurance and the demand for medical care: evidence ...hmlien/social...
TRANSCRIPT

Health Insurance and the Demand for MedicalCare: Evidence from a Randomized Experiment
Willard G. Manning et al. (1987)
June 1, 2007
Willard G. Manning et al. (1987)
Health Insurance and the Demand for Medical Care: Evidence from a Randomized Experiment

Introdution and literature
I Medicare costs have grown about 4% per year in real terms in1940’s-1980’s.
I A prominent explanation: generated demand for medicalservice and health insurance. But no literature has shown that.
I Coinsurance elasticity:I If insurance was treated as endogenous variable (selection
issuea): the coinsurance elasticity is not significant (Newhouseand Phelps (1976)).
I If insurance was treated as exogenous variable: The coinsuranceelasticity is significant. (the elasticity is around -0.1 to -2.1) ⇒Mainly in natural experiments research.
Willard G. Manning et al. (1987)
Health Insurance and the Demand for Medical Care: Evidence from a Randomized Experiment

Introdution and literature
Several objectives of HIE (Rand Health Insurance Experiment):
I Uncertainty about how demand responds to insurance-inducedchanges in price.
I Learn the behavior of poor individuals’ insurance throughpublic program.
I Learn if insurance elasticity differed for various medical service.
I Quantify how the change in the consumption of medical servicemight affect health.
I Determine whether any reduced use of service affect healthstatus. (HMO system)
Willard G. Manning et al. (1987)
Health Insurance and the Demand for Medical Care: Evidence from a Randomized Experiment

Data and the design of the HIE
I Data: The HIE enrolled families in six cities, betweenNovember 1974 and February 1977.
I Two service system:I Prepaid system (ex. HMO)– separate group.I Free-for-service (FFS)– the main focus of this paper.
I Plans of FFS insurance:I Different coinsurance rate, ex. 0, 25, 50, or 95 percent.I Each plan has upper limit on annual out-of-pocket (MDE)
expense, ex maximum of $1000.
I Select families to these insurance randomly.
I Subsidy to the experiment family: (1) Lump sum subsidy to allfamilies, (2) Unanticipate increase in the lump sum payment to40% families.
Willard G. Manning et al. (1987)
Health Insurance and the Demand for Medical Care: Evidence from a Randomized Experiment

Sample
I Sample: Random sample of each city’s nonaged population,but excluding some groups.
I Dependent variables: The use of medical service (ruling outoutpatient psychotherapy and dental services)
I Independent Variables:I Insurance plan variables:
1 The free plan;2 25% coinsurance rate;3 50% coinsurance rate;4 95% coinsurance rate;5 Individual deductible – 95% coinsurance rate for outpatient
service, and free for inpatient care (has upper limit)
I Other covariates: Age, sex, race, family income, health status,family size and city.
Willard G. Manning et al. (1987)
Health Insurance and the Demand for Medical Care: Evidence from a Randomized Experiment

Willard G. Manning et al. (1987)
Health Insurance and the Demand for Medical Care: Evidence from a Randomized Experiment

Statistical Methods
I Three characteristics of distribution of medica expenses:I A large proportion use no medical services.I Medical expense is Highly skewed.I Distribution is different between outpatient use and inpatient
use.
I Method: ANOVA and the four-equation model.
Willard G. Manning et al. (1987)
Health Insurance and the Demand for Medical Care: Evidence from a Randomized Experiment

The four-equation model
1 The 1st equation: A probit equation to estimate the probabilityof receiving any medical service.
2 The 2nd equation: A probit equation to estimate theprobability of having at least one inpatient stay (given somemedical use).
3 The 3rd equation: A linear for log(expense) of outpatient-onlyusers.
4 The 4th equation: A linear for log(expense) of both inpatientand outpatient users.
Willard G. Manning et al. (1987)
Health Insurance and the Demand for Medical Care: Evidence from a Randomized Experiment

Main effects in ANOVA (Table 2)
Clearly show that the use of medical services responds to thechanges in the coinsurance rate.
I The expense (and visit number) on the free plan are higherthan those on the plan with the higher coinsurance rate.
I The largest decrease in the use of outpatient service occursbetween the free and 25% plans.
I There are no significant differences among the family-pay plan(20, 50 and 95 percent) in the inpatient service. ⇒ due to theeffect of the upper limit on out-of-pocket expenses ($1000).
I Total expenditures on the plan of Individual deductible aresignificant less than the free plan.
Willard G. Manning et al. (1987)
Health Insurance and the Demand for Medical Care: Evidence from a Randomized Experiment

Willard G. Manning et al. (1987)
Health Insurance and the Demand for Medical Care: Evidence from a Randomized Experiment
Main effects in the four-equation model (Table 3)
I The pattern is similar to table 2.
I Outpatient-only cost sharing (Individual deductible plan)reduces total expenditures relative to free care, largely byreducing the likelihood of any use.
Willard G. Manning et al. (1987)
Health Insurance and the Demand for Medical Care: Evidence from a Randomized Experiment

Willard G. Manning et al. (1987)
Health Insurance and the Demand for Medical Care: Evidence from a Randomized Experiment

Main effects across income groups (Table 4)
I Likelihood of any use: Significant increase with income, withlarge increase for the family-pay plans.
I Likelihood of one or more admissions (for inpatient stay):insignificant decrease with income (due to the upper limit).
I Expenses: U-shaped response with income.
Willard G. Manning et al. (1987)
Health Insurance and the Demand for Medical Care: Evidence from a Randomized Experiment

Willard G. Manning et al. (1987)
Health Insurance and the Demand for Medical Care: Evidence from a Randomized Experiment

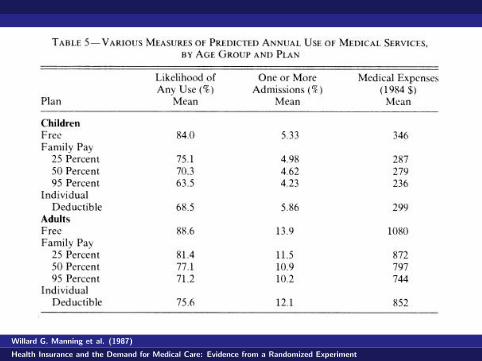
Main effects across age groups (Table 5)
I Children are less responsive for inpatient care.
I Adults have significant lower use of inpatient services on thefamily-pay plans than on the free plan.
I For other subgroups, for example, health status (healthy v.s.sickly), there is no evidence to show the differential response tohealth insurance coverage between these two subgroups.
Willard G. Manning et al. (1987)
Health Insurance and the Demand for Medical Care: Evidence from a Randomized Experiment
Willard G. Manning et al. (1987)
Health Insurance and the Demand for Medical Care: Evidence from a Randomized Experiment

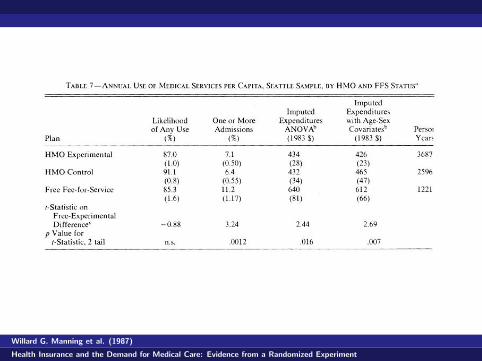
Other results
I Health status outcome: Patients with The relatively prevalentchronic problems (high blood pressure, myopia) have specificgains in use of free FFS rather in use plans with cost sharing.
I HMO results (table 7):I Same rate of using service among the plans.I The participants with one or more hospital admissions differs
with plans.
Willard G. Manning et al. (1987)
Health Insurance and the Demand for Medical Care: Evidence from a Randomized Experiment
Willard G. Manning et al. (1987)
Health Insurance and the Demand for Medical Care: Evidence from a Randomized Experiment

Conclusions
1 The coinsurance elasticity (demand for medical care): around-0.1 to -0.2.
I Estimating a pure coinsurance elasticity (table 8)I Using indirect utility function:-0.18I Similar calculation to the literature (table 9): -0.10 to -0.21
range.
2 The change of insurance can only explain only a small part ofthe increase in health expenditures.(table 10)
Willard G. Manning et al. (1987)
Health Insurance and the Demand for Medical Care: Evidence from a Randomized Experiment

Willard G. Manning et al. (1987)
Health Insurance and the Demand for Medical Care: Evidence from a Randomized Experiment

Willard G. Manning et al. (1987)
Health Insurance and the Demand for Medical Care: Evidence from a Randomized Experiment

Willard G. Manning et al. (1987)
Health Insurance and the Demand for Medical Care: Evidence from a Randomized Experiment

Conclusions
3 Welfare loss moving from 95 percent plan (with a $1000 MDE)to the free care plan is $37 to $60 billion.(It may be overstatedby ignoring externalities)
4 Reject the hypothesis that increased coverage of outpatientservices, holding constant the coverage of inpatient service, willreduce expenditure.⇒ As table3 shows, expenditure on theindividual deductive plan (costly outpatient) is 20 % less thanon the free plan(free outpatient)
Willard G. Manning et al. (1987)
Health Insurance and the Demand for Medical Care: Evidence from a Randomized Experiment
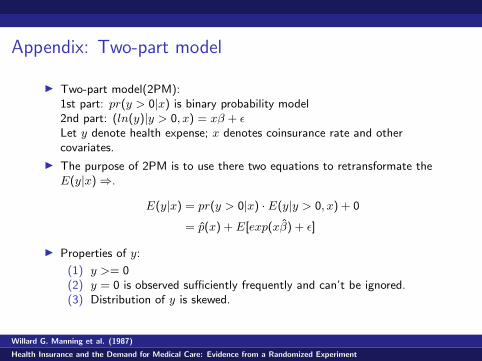
Appendix: Two-part model
I Two-part model(2PM):1st part: pr(y > 0|x) is binary probability model2nd part: (ln(y)|y > 0, x) = xβ + εLet y denote health expense; x denotes coinsurance rate and othercovariates.
I The purpose of 2PM is to use there two equations to retransformate theE(y|x) ⇒.
E(y|x) = pr(y > 0|x) · E(y|y > 0, x) + 0
= p̂(x) + E[exp(xβ̂) + ε]
I Properties of y:
(1) y >= 0(2) y = 0 is observed sufficiently frequently and can’t be ignored.(3) Distribution of y is skewed.
Willard G. Manning et al. (1987)
Health Insurance and the Demand for Medical Care: Evidence from a Randomized Experiment

Appendix: Two-part model (cont.)
I Error term (ε) issue: Smearing estimator (Duan (1983))
Let smearing estimator φ =P
exp(ε̂i)ni
= E(exp(ε̂i)), where ni is the
number of y > 0 and ε̂i = ln(y)− xβ̂
I Expected expenditure for y > 0
E(y|y > 0, x) = E(exp(xβ̂ + ε̂))
= exp(xβ̂) · E(exp(ε̂))
= exp(xβ̂) · φ
I Expected expenditure
E(y|x) = p̂(y > 0|x) · exp(xβ̂) · φ
Willard G. Manning et al. (1987)
Health Insurance and the Demand for Medical Care: Evidence from a Randomized Experiment

Appendix: Four-part model (HIE project)
Denote the expense of inpatient: yi; expense of outpatient: yo; totalexpense: y.
I Equation (1): Use probit model to estimate the probability of having anymedical service ⇒ p̂i = φ(xβ̂1)
I Equation (2): Use probit model to estimate the probability for a medicaluser to have any inpatient use ⇒ π̂i = φ(xβ̂2)
I Equation (3) – outpatient expense:⇒ ln(yo) = xβ3 + εo
⇒ Retransformate to get the estimated outpatient expense.⇒ E(yo|yo > 0, x) = exp(xβ̂3) · φ̂3
I Equation (4) – inpatient expense:⇒ ln(yi) = xβ4 + εi
⇒ E(yi|yi > 0, x) = exp(xβ̂4) · φ̂4
Willard G. Manning et al. (1987)
Health Insurance and the Demand for Medical Care: Evidence from a Randomized Experiment

Appendix: Four-part model (HIE project)
According to Equation (1) – (4):
I The expected total expense is:
E(y|x) = P (y > 0, x) · E(y|y > 0, x) + 0 · E(y|y = 0, x)
= P (y > 0, x) ·[(1− π)E(yo|yo > 0, x)
+ πE(yi|yi > 0, x)]+ 0
⇒ E(y|x) = p̂[(1− π̂)exp(xiβ̂3)φ̂3 + π̂exp(xiβ̂4)φ̂4]As reported in pp. 257 in the paper.
Willard G. Manning et al. (1987)
Health Insurance and the Demand for Medical Care: Evidence from a Randomized Experiment