health impact assessment of the ... · web viewhealth impact assessment of the massachusetts...
TRANSCRIPT

HEALTH IMPACT ASSESSMENT OF THE MASSACHUSETTS DEPARTMENT OF TRANSPORTATION (MassDOT) GROUNDING McGRATH STUDY
7/1/2013Massachusetts Department of Public Health Bureau of Environmental Health


HEALTH IMPACT ASSESSMENT OF THE MASSACHUSETTS DEPARTMENT OF TRANSPORTATION (MassDOT) GROUNDING McGRATH STUDY
Table of ContentsEXECUTIVE SUMMARY....................................................................I1. INTRODUCTION........................................................................12. IMPLEMENTATION OF THE PILOT HIA............................................2
2.1. Steps of the HIA Process.....................................................................23. SCREENING............................................................................3
3.1. Selection of MassDOT’s Grounding McGrath Study for the Pilot HIA..........34. STAKEHOLDER ENGAGEMENT PROCESS.......................................4
4.1. Key Stakeholders...............................................................................54.2. Purpose and Scope of the Engagement.................................................54.3. Engagement Activities.........................................................................5
5. SCOPING................................................................................75.1. Overall Approach of the Scoping Phase of the HIA..................................75.2. Alternatives To Be Considered..............................................................8
5.2.1. Boulevard Alternative......................................................................95.2.2. Access Road Alternative..................................................................95.2.3. Hybrid U-Turn/Rotary Alternative.......................................................95.2.4. Boulevard with Inner Belt Connection Alternative.................................9
5.3. Scoping of Health Issues...................................................................105.3.1. The Decision and Alternatives That Will Be Studied...........................105.3.2. Potential Significant Health Impacts................................................105.3.3. Literature Review: Potential Impacts on Health from Built Environment 115.3.4. Pathway Diagrams and Research Questions....................................155.3.5. Geographic and Temporal Boundaries and Demographics for HIA.......165.3.6. Identity of Affected Populations Including Vulnerable Groups..............175.3.7. Roles for Experts and Key Informants..............................................175.3.8. Analytical Plan for Assessing Distribution of Impacts..........................18
5.4. Figures...........................................................................................316. ASSESSMENT........................................................................47
6.1. Introduction.....................................................................................476.2. Summary of 2010 Existing Conditions.................................................47
i
HEALTH IMPACT ASSESSMENT OF THE MASSACHUSETTS DEPARTMENT OF TRANSPORTATION (MassDOT) GROUNDING McGRATH STUDY
6.2.1. Demographics and Socioeconomic Factors......................................476.2.2. Environmental Justice Populations in Somerville, MA........................506.2.3. Baseline Health Data....................................................................51
6.3. Assessment of Health Determinants....................................................556.3.1. Air Quality...................................................................................556.3.2. Noise..........................................................................................596.3.3. Mobility and Connectivity...............................................................616.3.4. Public Safety................................................................................646.3.5. Land Use and Economic Development............................................66
6.4. Overall Assessment..........................................................................696.5. Figures...........................................................................................75
7. LIMITATIONS..........................................................................888. FINDINGS AND RECOMMENDATIONS...........................................89
Air Quality.................................................................................................90Noise........................................................................................................90Mobility and Connectivity.............................................................................91Public Safety.............................................................................................91Land Use and Economic Development..........................................................91
9. REPORTING, EVALUATION AND MONITORING................................92Reporting..................................................................................................92Monitoring.................................................................................................92
10. REFERENCES......................................................................93APPENDIX A...............................................................................................99
ii

HEALTH IMPACT ASSESSMENT OF THE MASSACHUSETTS DEPARTMENT OF TRANSPORTATION (MassDOT) GROUNDING McGRATH STUDY
List of TablesTable 5-1: Examples of Health Outcomes Associated with Health Determinants for Pilot HIA......11Table 5-2: Health Data, Geography, Data Sources and Methods Used in GM HIA.....................19Table 6-1: Population Estimates and Projected Change from 2010 to 2035 in Somerville, MA.....47Table 6-2: Selected Demographic and Socioeconomic Characteristics.....................................48Table 6-3: Age of Somerville Population..............................................................................48Table 6-4: Race and Ethnicity of the Somerville Residents.....................................................49Table 6-5: Selected Socioeconomic Factors.........................................................................49Table 6-6: Selected Housing Characteristics and Population Density.......................................50Table 6-7: Future Employment Projections in Somverville from 2010 to 2035............................50Table 6-8: Inpatient Hospitalizations and Emergency Room Visits in MA, Somerville, and Zip Codes Abutting McGrath Highway (2010)......................................................................................51Table 6-9: Birth Characteristics for Select Census Tracts in Somerville, MA (2007)....................52Table 6-10: Pediatric Asthma Rates for K-8th Grade Students in Somerville, MA (2008-2009).....53Table 6-11: Estimated Prevalence of Adult Obesity, Hypertension, Type II Diabetes, Exercise, and Fruit/Vegetable Intake in Somerville, MA (2009)....................................................................54Table 6-12: NOx and PM2.5 Concentrations at McGrath Highway Intersections..........................58Table 6-13: Noise Levels (LAeq1H) Associated with Peak 1-Hour Morning Traffic Volume for 2010 Existing Conditions, 2035 No-Build and the Alternatives........................................................60Table 6-14: Data Used To Evaluate Shift in Travel Mode........................................................63Table 6-15: Volume Change for 2035 No-Build Compared To Boulevard Alternative For A Peak 3-Hour Period During A Weekday Morning..............................................................................64Table 6-16: VMT and Predicted Fatalities and Injuries Associated with 2010 Existing Conditions, 2035 No-Build and Alternatives..........................................................................................65Table 6-17: Travel Time Along McGrath Highway for 2010 Existing Conditions, 2035 No-Build and Each Alternative...............................................................................................................66Table 6-18: Key Features and Attributes of the 2010 Existing Conditions, 2035 No-Build, and the Four Alternatives..............................................................................................................68Table 6-19: Overall Health Assessment of Air Quality............................................................70Table 6-20: Overall Health Assessment for Noise..................................................................71Table 6-21: Overall Health Assessment for Mobility and Connectivity.......................................72Table 6-22: Overall Health Assessment for Public Safety.......................................................73Table 6-23: Overall Health Assessment for Land Use and Economic Development....................74
iii

HEALTH IMPACT ASSESSMENT OF THE MASSACHUSETTS DEPARTMENT OF TRANSPORTATION (MassDOT) GROUNDING McGRATH STUDY
List of Figures
Figure 5-A: Boulevard Alternative.......................................................................................31Figure 5-B: Access Road Alternative...................................................................................32Figure 5-C: Hybrid U-Turn/Rotary Alternative.......................................................................33Figure 5-D: Boulevard with Inner Belt Connection Alternative.................................................34Figure 5-E: Air Quality Pathway..........................................................................................35Figure 5-F: Noise Pathway................................................................................................36Figure 5-G: Mobility and Connectivity Pathway.....................................................................37Figure 5-H: Public Safety Pathway.....................................................................................38Figure 5-I: Land Use and Economic Development Pathway...................................................39Figure 5-J: Research Questions.........................................................................................40Figure 5-K: Study Area for the MassDOT Grounding McGrath Study.......................................41Figure 5-L: Pilot HIA Study Area According to Census Tracts in Somerville, MA........................42Figure 5-M: Pilot HIA Study Area According to Zip Codes In Somerville, MA.............................43Figure 5-N: Pilot HIA Study Area According to Neighborhoods in Somerville, MA.......................44Figure 5-O: Pilot HIA Study Area According to Transportation Analysis Zones in Somerville, MA..45Figure 5-P: Pathways Evaluated in MassDOT GM Study.......................................................46Figure 6-A: Census Tracts in Somerville Meeting EOEEA’s Environmental Justice Criteria.........75Figure 6-B: Predicted Traffic Density During Morning Peak Traffic Period.................................76Figure 6-C: Predicted NOx Concentrations (Morning Peak)....................................................77Figure 6-D: Predicted PM2.5 Concentrations (Morning Peak)...................................................78Figure 6-E: Comparison of Predicted NOx and PM2.5 Concentrations and Traffic Density............79Figure 6-F: PEQI Scores of Existing McGrath Highway and Nearby Roadways.........................80Figure 6-G: PEQI Scores of Proposed MassDOT Alternatives for McGrath Highway..................81Figure 6-H: BEQI Scores of Existing McGrath Highway and Nearby Roadways.........................82Figure 6-I: BEQI Scores of Proposed MassDOT Alternatives for McGrath Highway....................83Figure 6-J: Two Routes Evaluated for Mode Shift in GM HIA..................................................84Figure 6-K: Goods and Services in GM HIA Study Area.........................................................85Figure 6-L: Households Within 0.5 Miles of Selected Points...................................................86Figure 6-M: K-8 Schools In Somerville................................................................................87
iv

HEALTH IMPACT ASSESSMENT OF THE MASSACHUSETTS DEPARTMENT OF TRANSPORTATION (MassDOT) GROUNDING McGRATH STUDY
EXECUTIVE SUMMARY
Background
In 2009, Massachusetts enacted a transportation reform law that significantly modified the state’s transportation agency in order to streamline operations, share services, and reduce costs. A key public health feature of the law was the establishment of a Healthy Transportation Compact (HTC) that was charged with adopting best practices to achieve positive health outcomes through the coordination of land use, transportation, and public health policy. The HTC is co-chaired by the Secretary of the Executive Office of Health and Human Services (EOHHS) and the Massachusetts Department of Transportation (MassDOT). There are four other members including the Commissioner of Public Health.
Section 33 of the transportation reform law directs the HTC to: (v) establish methods to implement the use of health impact assessments (HIAs) to
determine the effect of transportation projects on public health and vulnerable populations; and
(x) institute a health impact assessment for use by planners, transportation administrators, public health administrators, and developers.
HIAs seek to improve the quality of policy decisions by evaluating the likely positive and negative health impacts from proposed projects, programs or policies, and making recommendations to improve positive health impacts and mitigate negative impacts. The Massachusetts Department of Public Health Bureau of Environmental Health (MDPH/BEH) applied for and received funds from the Health Impact Project, a collaboration of the Robert Wood Johnson Foundation and The Pew Charitable Trusts, to assist MDPH and the HTC in implementing the HIA directives by conducting a pilot HIA of a transportation planning study.
MassDOT worked closely with MDPH/BEH to select the Grounding McGrath Study for the pilot HIA. MassDOT’s Grounding McGrath Study (MassDOT GM Study) was a planning study to determine the future of the Route 28 corridor in Somerville and Cambridge. While McGrath Highway carries a high volume of both local and regional traffic, McGrath Highway has physically deteriorated since it was built in the 1950s and is in need of substantial repairs. In addition, the highway structure creates a significant barrier between Somerville neighborhoods and the Inner Belt and Brickbottom areas on its east side, and the rest of Somerville on its west side. Due to the investment necessary to restore the elevated portion of McGrath Highway (i.e., McCarthy Overpass), long-term maintenance costs of the structure, changes to the area from various transit and development projects (e.g., the Green Line Extension project; Inner Belt and Brickbottom development), and the longstanding desire of the community to transform the corridor, MassDOT initiated the Grounding McGrath Study.
Executive Summary I
HEALTH IMPACT ASSESSMENT OF THE MASSACHUSETTS DEPARTMENT OF TRANSPORTATION (MassDOT) GROUNDING McGRATH STUDY
Working closely with MassDOT and their contractors, the pilot HIA was structured to be conducted in tandem with an active MassDOT study to provide supplemental health data to better inform the MassDOT GM Study. The geographical scope of the study area for the GM HIA was determined by extending the study area defined in the MassDOT GM Study to the boundaries of zip code areas adjacent to the McGrath Highway. Zip code areas represent the smallest geographical area that some health data (in this case, hospitalization data) are available.
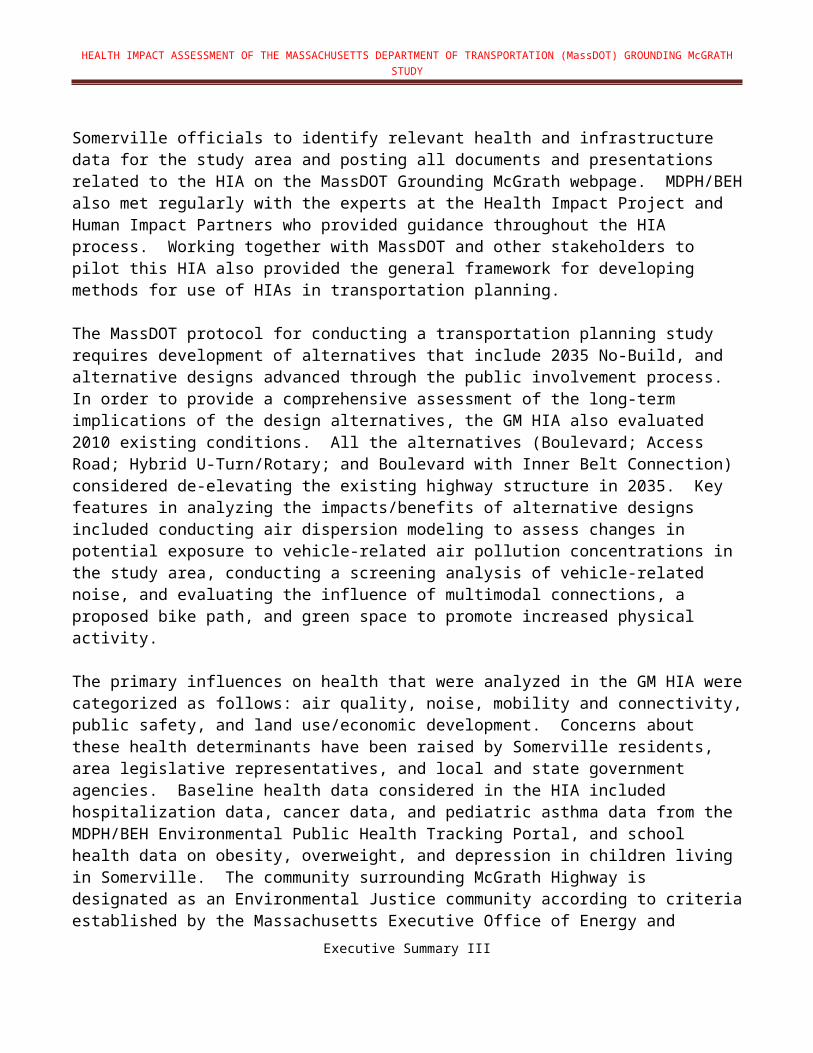
An important feature of MassDOT’s existing protocol that lends uniquely to the HIA stakeholder process is the establishment of the Grounding McGrath Working Group at the beginning of the transportation planning study. As part of the stakeholder process, HIA training was conducted in October 2011. The staff from MDPH bureaus active in HIA work, MassDOT, Executive Office of Energy and Environmental Affairs, other state agencies, and representatives of the City of Somerville participated in the training, with a focus on screening and scoping of the pilot HIA. MDPH/BEH also shared updates and received feedback on the HIA at Grounding McGrath Working Group meetings and two community meetings. Engagement activities also involved meetings with Somerville officials to identify relevant health and infrastructure data for the study area and posting all documents and presentations related to the HIA on the MassDOT Grounding McGrath webpage. MDPH/BEH also met regularly with the experts at the Health Impact Project and Human Impact Partners who provided guidance throughout the HIA process. Working together with MassDOT and other stakeholders to pilot this HIA also provided the general framework for developing methods for use of HIAs in transportation planning.
The MassDOT protocol for conducting a transportation planning study requires development of alternatives that include 2035 No-Build, and alternative designs advanced through the public involvement process. In order to provide a comprehensive assessment of the long-term implications of the design alternatives, the GM HIA also evaluated 2010 existing conditions. All the alternatives (Boulevard; Access Road; Hybrid U-Turn/Rotary; and Boulevard with Inner Belt Connection) considered de-elevating the existing highway structure in 2035. Key features in analyzing the impacts/benefits of alternative designs included conducting air dispersion modeling to assess changes in potential exposure to vehicle-related air pollution concentrations in the study area, conducting a screening analysis of vehicle-related noise, and evaluating the influence of multimodal connections, a proposed bike path, and green space to promote increased physical activity.
The primary influences on health that were analyzed in the GM HIA were categorized as follows: air quality, noise, mobility and connectivity, public safety, and land use/economic development. Concerns about these health determinants have been raised by Somerville residents, area legislative representatives, and local and state government agencies. Baseline health data considered in the HIA included hospitalization data, cancer data, and pediatric asthma data from the MDPH/BEH Environmental Public Health Tracking Portal, and school health data on obesity, overweight, and depression in children living in Somerville. The community surrounding McGrath Highway is designated as an Environmental Justice
Executive Summary II

HEALTH IMPACT ASSESSMENT OF THE MASSACHUSETTS DEPARTMENT OF TRANSPORTATION (MassDOT) GROUNDING McGRATH STUDY
community according to criteria established by the Massachusetts Executive Office of Energy and Environmental Affairs (EOEEA). Hence, socio-economic factors including income, housing availability/costs, and access to goods and services were important factors that needed to be considered in the baseline health assessment of the transportation planning study.
Findings and Recommendations
The study area is one of the most densely populated communities in Massachusetts. There is a 12% higher rate of Somerville residents that were foreign born or have a language other than English spoken in the home compared to the state as a whole. The fact that significantly more children are currently obese compared to the statewide average indicates that alternatives that promote healthy behaviors are paramount.
Based upon data reviewed for the GM HIA, and the cumulative health impacts from multiple factors in the study area, the two optimal alternatives are the Boulevard Alternative and Boulevard with Inner Belt Connection Alternative because they offer the greatest opportunities for mobility and access.
Given that the study area is classified as an Environmental Justice community it is critical that long-term plans that involve current residents are developed to ensure affordability of goods and services, stabilization of the cost of rental apartments, and that employment opportunities are made available.
Future assessment of health impacts and benefits of proposed study alternatives should be conducted once more robust project-specific information and transportation data become available.
Conducting an HIA in tandem with the first phase of a transportation planning study can provide good preliminary information on health impacts at an early stage of project development. However, a more detailed and precise assessment of health impacts and benefits of proposed alternatives would be possible at a later stage of project development, once more robust project-specific information and transportation data become available.
The alternatives assume significant trip diversions from McGrath Highway that will impact roadways outside of the corridor. As a result, significant mode shift is needed to reduce volumes without adding capacity. Thus, additional analysis is needed to better understand and characterize the delays along the de-elevated roadway due to congestion and the potential for diversionary traffic from the de-elevated roadway into surrounding neighborhoods.
Existing health data resources such as the MDPH Environmental Public Health Tracking portal provide publicly available information on a variety of health outcomes and
Executive Summary III

HEALTH IMPACT ASSESSMENT OF THE MASSACHUSETTS DEPARTMENT OF TRANSPORTATION (MassDOT) GROUNDING McGRATH STUDY
environmental data that can be readily incorporated into future assessments of existing health conditions and potential health impacts associated with transportation projects.
The following study-specific recommendations were generated based on the assessment of public health impacts/benefits associated with the pilot GM HIA:
Air Quality
All future study alternatives, including the 2035 No-Build, will result in significant reductions in traffic-related air pollution largely attributed to advancements in vehicle emissions standards and technologies. Continued support for the implementation of MassDEP efforts to reduce motor-vehicle related emissions including the Low Emissions Vehicle (LEV) program, emission control retrofits on diesel buses and construction equipment, and vehicle inspection programs may further improve both local and regional air quality.
De-elevation of the highway structure is anticipated to result in an increase in ground-level exposure to traffic-related air pollutant emissions (i.e., criteria pollutants, hazardous air pollutants, ultrafine particles). Thus, implementation of mitigation measures (e.g., locating sidewalks and bike paths further away from the roadway, installation of barriers, planting of trees) based on more comprehensive assessment of air pollution impacts should be explored where possible to reduce exposure to traffic- related air pollutants.
When available, traffic density information can provide a reasonable surrogate for exposure to traffic-related pollutant emissions and should be considered as a viable screening tool in the early phases of the transportation planning process and potential alternative to more resource intensive air quality modeling efforts.
The CTPS is expected to update the travel survey data and model used to estimate emissions in the Travel Demand Model. As a result, a sensitivity analysis to determine if major changes to the model output will occur when the Travel Demand Model is updated should be considered.
Noise
A screening-level analysis of noise impacts in an area with the highest predicted traffic volumes indicated higher noise impacts would be expected with a de-elevated highway structure. A more comprehensive analysis of noise impacts to sensitive receptors from de-elevating the highway within the buffer area is recommended in order to identify areas where noise mitigation may be warranted.
Mobility and Connectivity
Executive Summary IV

HEALTH IMPACT ASSESSMENT OF THE MASSACHUSETTS DEPARTMENT OF TRANSPORTATION (MassDOT) GROUNDING McGRATH STUDY
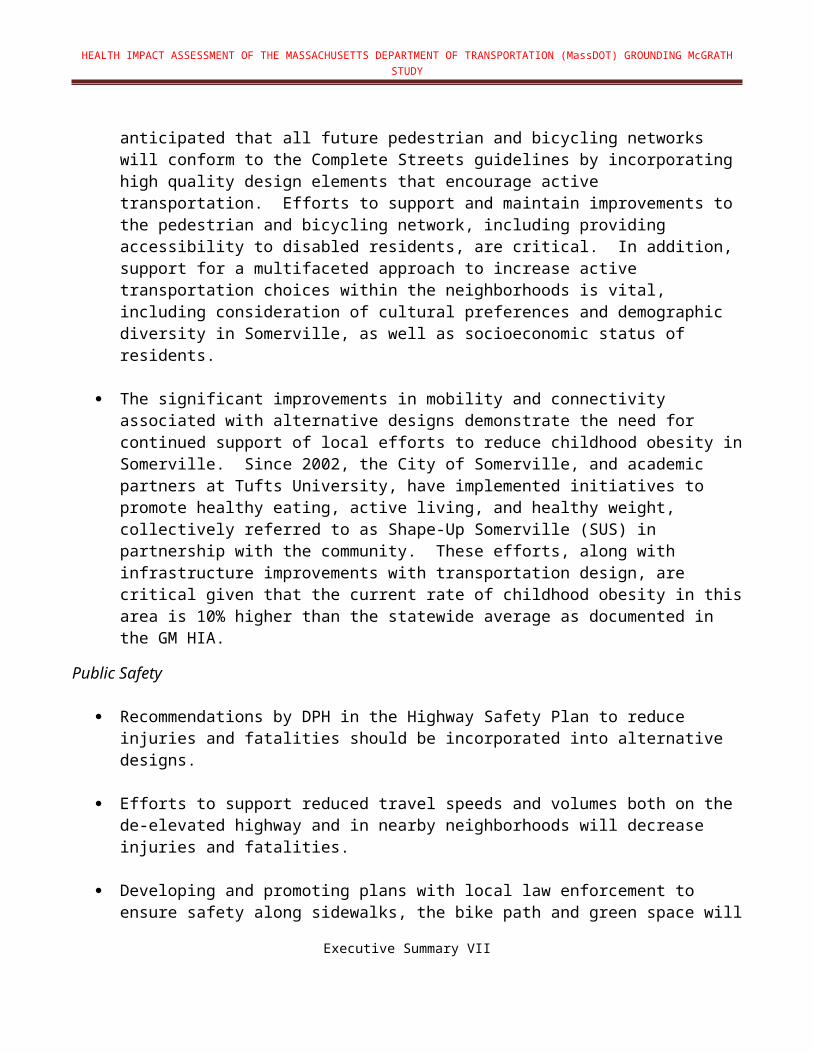
Although detailed designs of all four future alternatives have not been developed at this stage of the MassDOT GM Study, it is anticipated that all future pedestrian and bicycling networks will conform to the Complete Streets guidelines by incorporating high quality design elements that encourage active transportation. Efforts to support and maintain improvements to the pedestrian and bicycling network, including providing accessibility to disabled residents, are critical. In addition, support for a multifaceted approach to increase active transportation choices within the neighborhoods is vital, including consideration of cultural preferences and demographic diversity in Somerville, as well as socioeconomic status of residents.
The significant improvements in mobility and connectivity associated with alternative designs demonstrate the need for continued support of local efforts to reduce childhood obesity in Somerville. Since 2002, the City of Somerville, and academic partners at Tufts University, have implemented initiatives to promote healthy eating, active living, and healthy weight, collectively referred to as Shape-Up Somerville (SUS) in partnership with the community. These efforts, along with infrastructure improvements with transportation design, are critical given that the current rate of childhood obesity in this area is 10% higher than the statewide average as documented in the GM HIA.
Public Safety
Recommendations by DPH in the Highway Safety Plan to reduce injuries and fatalities should be incorporated into alternative designs.
Efforts to support reduced travel speeds and volumes both on the de-elevated highway and in nearby neighborhoods will decrease injuries and fatalities.
Developing and promoting plans with local law enforcement to ensure safety along sidewalks, the bike path and green space will increase the likelihood of selecting active transportation options.
Land Use and Economic Development
The MassDOT GM Study and this HIA assume that future development of the area around the McGrath Highway, along with the operation of the Green Line Extension, will greatly increase the availability and accessibility of goods and services in the area. This, in turn, is likely to enhance employment opportunities presumably for local residents, as projected in the MassDOT GM Study. In addition, access to green space will increase. All of these improvements should result in better physical and mental health and social cohesion due to a greater sense of connection to the neighborhood and its goods and services. While these efforts will likely have a significant benefit to this neighborhood, the potential for gentrification is high. For that reason, future plans should consider significant community involvement in future housing plans such that current residents might best benefit.
Executive Summary V
HEALTH IMPACT ASSESSMENT OF THE MASSACHUSETTS DEPARTMENT OF TRANSPORTATION (MassDOT) GROUNDING McGRATH STUDY
Executive Summary VI

HEALTH IMPACT ASSESSMENT OF THE MASSACHUSETTS DEPARTMENT OF TRANSPORTATION (MassDOT) GROUNDING McGRATH STUDY
1. INTRODUCTIONIn 2009, Massachusetts enacted a transportation reform law that significantly modified the state’s transportation agency in order to streamline operations, share services, and reduce costs. A key public health feature of the law was the establishment of a Healthy Transportation Compact (HTC) that was charged with adopting best practices to achieve positive health outcomes through the coordination of land use, transportation, and public health policy.
The HTC is co-chaired by the Secretary of the Executive Office of Health and Human Services (EOHHS) and the Massachusetts Department of Transportation (MassDOT). Other members include the Secretary of the Executive Office of Energy and Environmental Affairs (EOEEA), the Administrator of Transportation for Highways, the Administrator of Transportation for Mass Transit, and the Commissioner of Public Health.
M.G.L. Chapter 6, Section 33 of the transportation reform law directs the HTC to:
(v) establish methods to implement the use of health impact assessments (HIAs) to determine the effect of transportation projects on public health and vulnerable populations; and
(x) institute a health impact assessment for use by planners, transportation administrators, public health administrators and developers.
The Massachusetts Department of Public Health Bureau of Environmental Health (MDPH/BEH) was awarded funds from the Health Impact Project (HIP), a collaboration of the Robert Wood Johnson Foundation and The Pew Charitable Trusts, to assist the HTC in implementing the HIA directives by conducting a pilot HIA of a transportation planning study. The pilot HIA is intended to provide the framework for developing methods for use of HIAs in transportation planning. The pilot HIA was structured to be conducted in tandem with an active Massachusetts Department of Transportation (MassDOT) study in order to provide supplemental health data to better inform optimal transportation design alternatives. MassDOT worked closely with the Massachusetts Department of Public Health (MDPH) in the selection of the transportation project to pilot an HIA. The grant from the Health Impact Project also supported the development of draft proposed criteria to determine which types of transportation projects might benefit from conducting an HIA and the process to make such determinations. The proposed criteria will be released in a separate document. The opinions expressed in this report are those of the author(s) and do not necessarily reflect the views of the Health Impact Project, Robert Wood Johnson Foundation, or The Pew Charitable Trusts.
1

HEALTH IMPACT ASSESSMENT OF THE MASSACHUSETTS DEPARTMENT OF TRANSPORTATION (MassDOT) GROUNDING McGRATH STUDY
2. IMPLEMENTATION OF THE PILOT HIA
2.1. Steps of the HIA Process
HIAs seek to improve the quality of policy decisions by evaluating the likely positive and negative health impacts from proposed programs or policies, and making recommendations to improve positive health impacts and mitigate negative impacts. HIAs provide a unique opportunity for public health officials and the communities they represent to work collaboratively across agencies and secretariats to promote the idea of health in all policies. The HIA is a public engagement and decision-support tool that can be used to assess project, planning or policy proposals, and make recommendations to improve the health outcomes associated with those proposals. An HIA systematically analyzes how a proposed project, plan, or policy affects environmental, social, demographic, and economic conditions that drive the health and well-being of communities and, in turn, how these impacts are likely to positively or adversely influence health. The HIA evaluates factors such as transportation, employment status, income, noise, air/water quality, access to goods and services, and social networks —often collectively referred to as “determinants of health”— that have well-demonstrated and reproducible links to health outcomes (HIP, 2011).
The goal of an HIA is to inform the decision-making process and recommend strategies that best protect and promote health (Bhatia, 2011). The five guiding principles of HIAs are:
Involvement and engagement of stakeholders to inform a decision, Consideration of the distribution of health impacts across the affected population with
specific attention to vulnerable groups, Consideration of both short- and long-term impacts and benefits, Objective evidence-based synthesis of methods and data to assess impacts and inform
recommendations, and Comprehensive assessment of health that considers physical, mental, environmental,
economic, and social determinants of health.
The HIA methodology integrates these guiding principles into a six-step process that forms the basis for a decision support tool. The six steps of the HIA are described below and also form the organization of this report.
The first step, or screening phase of the HIA, evaluates whether the HIA can inform the decision-making process associated with a project, plan, or policy that is under active consideration. MDPH/BEH worked with MassDOT and other members of the HTC staff to identify transportation projects that were underway that would possibly benefit from an HIA. The team selected the Grounding McGrath Study in Somerville, MA.
Following the screening phase, the scoping phase identifies the pathways and health effects/benefits of concern, develops an approach for identifying data sources and information for evaluating health effects/benefits, and identifies tools and methods for assessing health effects/benefits associated with the project/plan/policy. Identifying the
2

HEALTH IMPACT ASSESSMENT OF THE MASSACHUSETTS DEPARTMENT OF TRANSPORTATION (MassDOT) GROUNDING McGRATH STUDY
roles of stakeholders in prioritizing research questions also takes place in the scoping phase.
The assessment phase evaluates the health impacts/benefits by applying methods and tools for analyzing data collected in the scoping phase, and predicts changes to health if recommendations included in the HIA go forward.
Recommendations are developed to improve positive health impacts and mitigate negative impacts identified in the HIA.
This report constitutes the initial phase of reporting and communicating the findings of the pilot HIA.
The final step of the HIA is evaluation and monitoring. Evaluation can be an analysis of whether the HIA was conducted according to its plan of action; an analysis of whether the health impact assessment influenced the decision-making process or had other beneficial outcomes, such as informing the public and building new partnerships or collaborations; or an analysis of whether the health impact assessment caused changes in health outcomes via continual monitoring.
3. SCREENING
3.1. Selection of MassDOT’s Grounding McGrath Study for the Pilot HIA
The screening phase of an HIA determines the need and value of the HIA to inform the decision-making process. MDPH/BEH worked closely with HTC agency staff to screen active transportation planning projects to determine the optimal project for the pilot HIA.
McGrath Highway (also known as Route 28) is primarily a four- and six-lane divided highway that spans approximately 1 mile. The highway includes a combination of an elevated overpass, known as the “McCarthy Overpass,” as well as at-grade roadways that traverse and bisect neighborhoods in Somerville. Originally built to connect the northern communities to Boston in the mid-1950s, the functionality of the McGrath Highway changed significantly after the construction of an interstate highway through Boston (Interstate 93). McGrath Highway is currently in poor condition, and the McCarthy Overpass was officially rated “structurally deficient” by MassDOT’s Highway Division in 2010. MassDOT determined that restoration of the elevated structure will require significant concrete work, steel repair, and deck reconstruction. MassDOT concluded that the size of the investment necessary to complete this work suggested that other options should be considered. Specifically, MassDOT believed that it was an opportune time to evaluate the feasibility, benefits, impacts, and costs of removing at least a portion of the elevated structure and commissioned a study to further explore these options.
3
HEALTH IMPACT ASSESSMENT OF THE MASSACHUSETTS DEPARTMENT OF TRANSPORTATION (MassDOT) GROUNDING McGRATH STUDY
The primary influences on health that will be affected by this decision include: the current barriers to physical activity due to lack of sidewalks and the current transportation infrastructure; impeded mobility and access to neighborhoods located east and west of the highway; pedestrian safety; lack of access to jobs, goods and services, schools, churches, businesses, and recreational areas (e.g., Charles River) due to current land use and other factors; decreased property values; exposure to air pollution and noise; and lack of green space. Concerns about these health impacts have been raised by Somerville residents, area legislative representatives, and local and state government agencies. The potential for disproportionate impacts to residents in the community surrounding McGrath Highway is significant, given that the area is designated by the EOEEA as an Environmental Justice community. Hence, socio-economic factors including income, housing availability/costs, and access to medical care are important factors that need to be considered in the baseline health assessment of a transportation planning study. Given that the location of the McGrath Highway in Somerville, MA is a densely populated area, the number of people likely to be impacted is significant. For these reasons, improving the overall transportation infrastructure on McGrath Highway could potentially address a wide range of public health impacts particularly among vulnerable populations living in Somerville.
The MassDOT GM Study is considered an exploratory study that will evaluate existing conditions, a 2035 No-Build scenario, and proposed recommendations for structural improvements. The HIA analysis is intended to provide value to the decision-making process by providing supplemental health data that stakeholders can consider in selecting alternative designs to the existing highway structure. Thus, the HIA will help inform how determinants of health may be considered in the development of short- and long-term recommendations at the early stages of the project. Working together with MassDOT and other stakeholders to pilot this HIA also provides the framework for developing methods for determining what such a process would entail.
4. STAKEHOLDER ENGAGEMENT PROCESS
The pilot HIA was structured to be conducted in tandem with the MassDOT GM Study in order to provide supplemental health data analysis to best inform optimal transportation design alternatives. An important feature of MassDOT’s existing protocol that lends uniquely to the HIA stakeholder process is the establishment of such a process at the beginning of transportation planning studies. MDPH/BEH built their stakeholder strategy using the MassDOT stakeholder workgroup as an important communication tool. MDPH/BEH also identified a sub-group of these individuals within the stakeholder workgroup that were interested in providing additional review. The integration of the HIA process into the MassDOT GM Study provided an opportunity to familiarize transportation planners, consultants working for MassDOT, stakeholders involved in the MassDOT GM Study, and the public with the HIA process, including developing common language and understanding of the HIA framework and practice as it relates to transportation planning projects in Massachusetts. The experience in
4

HEALTH IMPACT ASSESSMENT OF THE MASSACHUSETTS DEPARTMENT OF TRANSPORTATION (MassDOT) GROUNDING McGRATH STUDY
working with stakeholders on the pilot HIA has also informed the development of a framework for integrating the HIA process into future transportation planning projects.
4.1. Key Stakeholders
The stakeholders involved in working with MDPH/BEH on the pilot HIA include: MDPH Bureau of Community Health and Prevention; Healthy Transportation Compact member staff; MassDOT and their consultants on the Grounding McGrath Study; MassDOT Grounding McGrath Working Group that includes community representatives
and stakeholders; Grounding McGrath Working Group Pilot HIA Subteam that provided additional review
and comments on the HIA; and City of Somerville School Nurse Leader (Gay Cote), Health Department (Paulette
Renault-Caragianes, Director) and Office of Planning (Brad Rawson).
4.2. Purpose and Scope of the Engagement
The purpose of the stakeholder engagement process was to: 1) Collaborate with MassDOT staff and members of the GM Working Group to identify data
generated for the MassDOT GM Study that has been publicly vetted and could be used in the pilot HIA;
2) Facilitate public stakeholder involvement in the HIA process by providing presentations at the GM Working Group meetings and public informational meetings on the pilot HIA. MassDOT coordinated with MDPH/BEH on the dates of the MassDOT GM Working Group and public meetings to ensure participation; and
3) Inform stakeholders of the pilot HIA analysis by presenting draft pathways and research questions at the GM Working Group meetings. These documents were also available electronically through the MassDOT GM Study webpage dedicated to the pilot HIA with links to MDPH/BEH website. In addition, a draft final report will be provided to the GM Working Group for review and comment. MDPH/BEH plans to include the final draft pilot HIA on the MDPH website to provide the public with an opportunity to comment on the document.
It is important to note that the MassDOT GM Working Group has a direct role in the selection and design of alternatives considered by MassDOT.
4.3. Engagement Activities
Engagement activities involve four general approaches: (1) stakeholder meetings; (2) tiered stakeholder process; (3) posting all documents related to the pilot HIA on a website; and (4) outreach to other interested groups.
5

HEALTH IMPACT ASSESSMENT OF THE MASSACHUSETTS DEPARTMENT OF TRANSPORTATION (MassDOT) GROUNDING McGRATH STUDY
Stakeholder Meetings
HIA Training
As part of the stakeholder process, HIA training was conducted on October 5 and 6, 2011 by the Human Impact Partners (HIP) in collaboration with the Health Impact Project. Regina Villa Associates provided administrative coordination and support. Training participants included representatives from the three executive branch secretariats involved in the HTC and importantly those individuals who will be charged with working on transportation HIA work statewide. Staff from MDPH bureaus active in HIA work (e.g., Bureau of Community Health and Prevention, BCHAP), MassDOT, EOEEA, other state agencies, and representatives of the City of Somerville also participated, with a focus on screening and scoping of the pilot HIA.
GM Working Group and Public Informational Meetings
The engagement methods and activities to share information about the study analyses have been accomplished through stakeholder and public information meetings convened by MassDOT and attended by MDPH/BEH and others. MassDOT committed to: scheduling meetings in advance, providing opportunities for timely review of materials in advance of milestones, and seeking input on wide public meeting agendas and venues. The HIA process was integrated into this schedule to ensure stakeholder involvement. The GM Working Group meetings and public informational meetings were scheduled at each major juncture of the study where decisions needed to be made regarding the selection and design of alternatives. MDPH/BEH participated in the seven GM Working Group meetings, on June 29, 2011, August 3, 2011, December 12, 2011, March 7, 2012, September 27, 2012, April 4, 2013 and April 25, 2013. MDPH/BEH also participated in two Public Informational Meetings held on September 21, 2011 and May 15, 2013.
The MDPH/BEH has worked closely with MassDOT and their contractors as the study developed to identify and collect the information relevant to the pilot HIA. This approach also provided the opportunity to evaluate components of the transportation planning process that are amenable to the HIA process for developing methods and for consideration of criteria to identify transportation initiatives that would best benefit from an HIA.
Enhanced Stakeholder Process
It is important to note that the GM Working Group has a direct role in the selection and design of alternatives considered in the MassDOT GM Study. MDPH/BEH has also established an enhanced stakeholder process to gain input from the working group members who are specifically interested in health and the pilot HIA.
Posting all documents related to the Pilot HIA on a website
MassDOT is maintaining a website for the Grounding McGrath Study:
6

HEALTH IMPACT ASSESSMENT OF THE MASSACHUSETTS DEPARTMENT OF TRANSPORTATION (MassDOT) GROUNDING McGRATH STUDY
http://www.massdot.state.ma.us/planning/GroundingMcGrath.aspx. The website contains notices of meetings as well as agendas, meeting notes, and presentation slides. MDPH/BEH also provided a link to the MassDOT website on the DPH portal with the following information posted:
PowerPoint presentations to the GM Working Group; Draft interim documents; Draft Pilot HIA report; and Final Pilot HIA report
Outreach to other interested groups
In addition to coordinating outreach efforts with MassDOT, MDPH/BEH has worked closely with the Central Transportation Planning Staff (CTPS) of the Boston Region Metropolitan Planning Organization (MPO) to identify and analyze data from CTPS’s Travel Demand Model for use in the pilot HIA. MDPH/BEH has also met with officials from the City of Somerville including the Local Health Department and the Economic Development Division to gain access to city-specific data for the HIA analysis. MDPH/BEH has also been actively engaged with several public and professional organizations (e.g., Association of State and Territorial Health Officials, Massachusetts local health organizations) and HIA conferences (e.g., International HIA Conference in Quebec City, August 2012) that have requested presentations on the pilot HIA. In addition, the study is receiving a significant amount of attention from the print media including newspaper articles and op-eds, Internet blogs, and other forums that actively engage Somerville residents potentially affected by the study.
Public Comment Period for Draft GM HIA
MDPH/BEH released a draft HIA of the MassDOT GM Study for a 30-day public comment period from April 5, 2013 to May 5, 2013. The comment period was extended to May 20, 2013 to provide additional opportunity for public comments following the public information meeting held on May 15, 2013. All comments were reviewed and addressed in the final report as appropriate.
5. SCOPING
5.1. Overall Approach of the Scoping Phase of the HIA
As previously discussed, the goal of the pilot HIA is to help inform the decision-making process by supplementing the transportation planning study with a systematic evaluation of potential risks, benefits, and tradeoffs of planning options developed in the MassDOT GM Study. The scoping phase of the HIA:
Identified the alternatives to be assessed and data and methods to be used, Identified research questions and developed methods to address them,
7
HEALTH IMPACT ASSESSMENT OF THE MASSACHUSETTS DEPARTMENT OF TRANSPORTATION (MassDOT) GROUNDING McGRATH STUDY
Determined which public health effects will be evaluated, Identified populations that might be affected including vulnerable populations, and Identified key informants to provide community level information.
According to the North American Practice Standards for an HIA, the scoping of health concerns related to the decision should include identification of the following: (1) the decision and decision alternatives that will be studied; (2) potential significant health impacts; (3) pathways, research questions, sources of data, and methods; (4) demographic, geographical, and temporal boundaries for impact analysis; (5) the identity of affected populations including vulnerable groups; (6) roles for experts and key informants; and (7) analytical plan for assessing distribution of impacts. Conducting the HIA work in tandem with the MassDOT GM Study was accomplished by integrating the framework of the transportation planning study into the scoping phase of the HIA. Thus, the HIA has drawn extensively on the information generated from the MassDOT GM Study process.
5.2. Alternatives To Be Considered
The MassDOT protocol for conducting a transportation planning study requires development of alternatives that include 2035 No-Build, and alternative designs advanced through the public involvement process. MassDOT selected four alternative designs to the existing highway structure. The alternatives are as follows:
Boulevard Alternative Access Road Alternative Hybrid U-Turn/Rotary Alternative (U-Turn/Rotary), and Boulevard with Inner Belt Connection Alternative (Boulevard/Inner Belt)
All available MassDOT alternatives considered de-elevating the existing highway structure in 2035. The HIA compared alternatives to the 2010 existing conditions and the 2035 No-Build option. Three important assumptions are built into the analysis of the MassDOT GM Study: (a) development and operation of the Inner Belt and Brickbottom area with a mixture of residential, work/live studio lofts, and retail stores; (b) completion and operation of the MBTA Green Line subway extension that will connect this area with the public transportation system; and (c) significant reductions from 2010 to 2035 in motor vehicle emissions from advancements in motor vehicle technology and emission control requirements.
Other important considerations in DOT’s selection of alternatives included the following: De-elevation can only take place between two “fixed points” along the McGrath Highway
in order to maintain two bridges over separate commuter rail lines (a truss bridge over the Lowell Commuter Rail Line and Squire’s Bridge over the Fitchburg Commuter Rail Line) that cannot be significantly lowered. The “fixed points” (those points that are highly unlikely to be de-elevated) and the allowable slope of the roadway from the bridges represent the key issues identified by MassDOT in terms of the structure of the new roadway. Further, roadway design standards limit the distance required to de-
8

HEALTH IMPACT ASSESSMENT OF THE MASSACHUSETTS DEPARTMENT OF TRANSPORTATION (MassDOT) GROUNDING McGRATH STUDY
elevate McGrath Highway from the two fixed points. According to MassDOT, this distance will be dependent on the design speed for the road, and whether pedestrian routes along McGrath Highway will follow the traffic alignment.
Opportunities for new development parcels and/or park space from an overall reduction in rights of way will be possible by the elimination of elevated structures.
Each alternative has common features: a bike path along the eastern border of the McGrath Highway, implementation of Complete Streets guidelines that allow all users (pedestrians, bicyclists, motorists, and bus riders) and the ability to safely move along and across a complete street.
The following briefly describes each alternative with accompanying maps at the end of this chapter (pages 32-35). Further information on alternatives is expected as they are more fully developed during later stages of the MassDOT Grounding McGrath decision-making process.
5.2.1. Boulevard Alternative
This alternative features three through lanes northbound and southbound on McGrath Highway between Medford Street to the north and Poplar Street to the south. There are left turn restrictions from McGrath Highway at Washington Street. Poplar Street is realigned slightly north of its current location (See Figure 5-A, page 32).
5.2.2. Access Road Alternative
The Access Road alternative features two lanes on McGrath Highway in each direction for the major north/south travel, while cross-street traffic is connected via a circulating access road (with signal control). The access roads allow two-lane access to/from Poplar Street, Washington Street, Somerville Avenue, and Medford Street. This alternative provides northbound access to Union Square via Linwood Street. Southbound access from Union Square is provided via Somerville Avenue (See Figure 5-B, page 33).
5.2.3. Hybrid U-Turn/Rotary Alternative
This alternative combines two initial alternatives and features a rotary at the McGrath Highway, Poplar Street, Somerville Avenue, and Medford Street intersection, with the McGrath mainline passing through the rotary. All left turns at the McGrath Highway and Washington Street intersection are processed via signalized u-turn intersections located north and south of Washington Street (See Figure 5-C, page 33).
5.2.4. Boulevard with Inner Belt Connection Alternative
This alternative was developed by the City of Somerville through its Inner Belt/Brickbottom Study process. This alternative would include a multimodal bridge connection from Inner Belt across the Fitchburg Line tracks connecting through NorthPoint to McGrath Highway in
9

HEALTH IMPACT ASSESSMENT OF THE MASSACHUSETTS DEPARTMENT OF TRANSPORTATION (MassDOT) GROUNDING McGRATH STUDY
Cambridge. It also would include an extension of Poplar Street across the Lowell Line tracks to connect Inner Belt and Brickbottom (See Figure 5-D, page 34).
5.3. Scoping of Health Issues
As mentioned, participants in the two-day training included representatives from MDPH/BEH and MDPH/BCHAP, EOEEA, MassDOT and City of Somerville, and Massport. Available information sources for conducting the HIA included the MassDOT evaluation criteria used to select the alternatives and related spreadsheets that summarized the modeling and spatial analysis of each alternative conducted by MassDOT and contractors. Preliminary input for the scoping phase was received during the October 5-6, 2011 HIA training. In addition, MassDOT provided CAD and Adobe Acrobat PDF files of the alternative designs. Information from meeting presentations, other draft materials, and decisions made at meetings of the MassDOT GM Study Working Group were also evaluated. MDPH/BEH staff also met with MassDOT staff and contractors and CTPS staff to review the preliminary results of the analysis of alternatives. The complete analysis of alternatives and a final MassDOT GM Study report was not available at the time that the GM HIA was drafted. However, it is unlikely that information presented in the final report would substantially impact the outcome(s) of this HIA.
5.3.1. The Decision and Alternatives That Will Be Studied
As discussed previously, the decision that the HIA will help inform is the selection of an alternative design for the McGrath Highway in Somerville, MA. The MassDOT study is considering the potential removal of elevated portions to enhance access for all modes of travel. The HIA supplements the MassDOT GM Study evaluation criteria with health-related information to more fully inform the selection of the optimal design alternative. In order to provide a comprehensive assessment of the long-term implications of the design alternatives, the GM HIA aims to assess the health impacts/benefits of the four alternatives as well as 2010 existing conditions and the 2035 No-Build case.
5.3.2. Potential Significant Health Impacts
During the October 2011 HIA training, and in subsequent discussions with the GM Study Working Group, the following health determinants that are associated with transportation planning were identified as key to the GM alternative decision:
Air quality: Exposure to traffic-related air pollution; Noise: Exposure to traffic-related noise; Mobility: Impeded mobility and lack of physical activity due to existing infrastructure of
sidewalks and crosswalks along McGrath Highway; Connectivity: Impeded physical activity and access to health promoting goods and
services (e.g., retail, health care, employment);
10

HEALTH IMPACT ASSESSMENT OF THE MASSACHUSETTS DEPARTMENT OF TRANSPORTATION (MassDOT) GROUNDING McGRATH STUDY
Public safety: Injuries/fatalities of pedestrians, motorists, and cyclists; travel time for public safety vehicles;
Mental health: Stress associated with noise, congestion, general neighborhood conditions;
Social cohesion: Lack of sense of community due to physical barriers under 2010 existing conditions; and
Land use and economic development: Access to goods and services (e.g., local businesses, medical services), potential for gentrification, and green space.
In summary, the primary influences on health that were considered in the GM HIA related to how existing transportation conditions associated with the McGrath Highway may have an impact on public health in the surrounding communities. The unintended health impacts of transportation projects may include direct impacts from exposure to air pollutants, emissions of greenhouse gases, physical inactivity (due to infrastructure designs that favor motor vehicle use and limit active transportation options), pedestrian safety, mental health impacts (e.g., stressful commutes), and safety concerns (e.g., auto accidents). Indirect effects may include a lack of access to goods and services, suppressed property values and displacement, and reduced employment opportunities (Litman, 2009). In addition, public health impacts of particular concern expressed by residents at community meetings include impeded mobility and access to communities located east and west of the McGrath Highway; lack of access to goods and services; and lack of green space. Examples of health outcomes that are relevant to these health determinants are presented in Table 5-1.
TABLE 5-1: EXAMPLES OF HEALTH OUTCOMES ASSOCIATED WITH HEALTH DETERMINANTS FOR PILOT HIAHealth Determinants Examples of Health Outcomes
Air pollution Respiratory disease/illness (e.g., asthma), cardiovascular disease (e.g., heart attack)
Noise High blood pressure, annoyance, and sleep deprivationMobility Obesity, Type II diabetes
Connectivity Obesity from reduced access to goods and services and to green space
Public safety Injuries/fatalities, inactivity due to fear of crime
Social cohesion Indirect effects on broad range of physical and mental conditions
Mental health Indirect effects on broad range of physical and mental conditions
Land use and economic development Access to medical services and public transit to services that support health
5.3.3. Literature Review: Potential Impacts on Health from Built Environment
11

HEALTH IMPACT ASSESSMENT OF THE MASSACHUSETTS DEPARTMENT OF TRANSPORTATION (MassDOT) GROUNDING McGRATH STUDY
The HIA process is driven by evidence published in the scientific and medical literature that links the transportation design and operations to direct, indirect, or cumulative health impacts/benefits.
A growing body of scientific evidence has shown that the built environment can have significant effects on both physical and mental health, particularly among minority and low-income populations already burdened with disproportionate rates of illness and morbidity. Lack of infrastructure (e.g., sidewalks, bike paths, and parks), affordable well-designed housing, and lack of supermarkets with access to healthy food combine to increase the risks of both physical and mental illnesses (Hood, 2005). Aspects of the built environment also contribute to air quality, noise, and public safety.
5.3.3.1. PHYSICAL ACTIVITY
The link between physical activity and health is well-known. The U.S. Surgeon General recommends at least 30 minutes of exercise each day to reduce the risks of coronary heart disease, hypertension, colon cancer, and diabetes (CDC, 1996). In a literature review of the relationships between land use and transportation for CDC, Frank and Engelke (2009) agree that regular physical activity decreases the risks of cardiovascular disease, colon cancer, and diabetes mellitus; they add that it can help maintain muscle and joint strength, may relieve depression, anxiety and other mental illnesses, and, along with appropriate diets, may lower obesity levels.
The built environment can impact physical activity in a number of ways. For example, Singh et al. (2010) report that children living in unsafe and socioeconomically disadvantaged neighborhoods or in neighborhoods that lack access to sidewalks, walking paths, parks, playgrounds, and recreation centers have a 30–60 percent higher likelihood of being obese or overweight than children living in neighborhoods with these amenities. Studies have also found that low-income urban communities have inadequate opportunities to participate in physical activity, which can contribute to stress, depression, anxiety, and reduced ability to perform daily tasks (PolicyLink, 2002).
Existing literature highlights the importance of walking, in particular, as a form of physical activity that can be promoted by key aspects of the built environment such as distance to destinations (walkability), mixed land use, presence of sidewalks, and the connectivity of routes. Street connectivity improves the efficiency with which one can arrive at destinations and expands choices for routes to access goods and services. Access to goods and services (e.g., schools, healthy foods, medical services, public transport) within walking or biking distance promotes physical activity, reduces vehicle trips and vehicle miles traveled, and increases neighborhood cohesion and safety (CDC, 2009).
Increasing the availability of public transit can also impact walking rates. Analysis of the 2001 National Household Travel Survey by Besser et al. (2005) found that walking to and from public transportation can help promote and maintain active lifestyles, especially among low-income and minority groups. A study by Edwards et al. (2007) estimates that an individual
12

HEALTH IMPACT ASSESSMENT OF THE MASSACHUSETTS DEPARTMENT OF TRANSPORTATION (MassDOT) GROUNDING McGRATH STUDY
walks an additional 8.3 minutes per day when they change from driving to transit. Frank et al. (2004) report that each additional hour spent in a car per day is associated with a 6 percent increase in the likelihood of obesity, and each additional hour walked per day is associated with a 4.8 percent reduction in the likelihood of obesity. According to Lachapelle and Frank (2009), transit users average 1.05 daily miles of walking per day — ten times more than the 175 yards of walking averaged by non-transit users.
13

HEALTH IMPACT ASSESSMENT OF THE MASSACHUSETTS DEPARTMENT OF TRANSPORTATION (MassDOT) GROUNDING McGRATH STUDY
5.3.3.2. MENTAL HEALTH
Another important benefit of urban connectivity, green space, and public transit is alleviation of mental illness, particularly depression (Sacher et al., 2012). In a review of literature on the built environment and mental health, Sacher et al. (2012) report that physical environmental conditions that provide a sense of identity, safety, security, and social connection help people living with mental illness improve their recovery in the community. They also report that access to goods and services by active transportation, and increasing social interactions in neighborhoods reduces social isolation and depression, which is beneficial in promoting optimal mental health. Finally, research findings suggest that positive neighborhood environments, such as parks for walking, are related to positive determinants of mental health, while negative neighborhood environments, such as stressors from chronic exposure to motor vehicle traffic and noise, are related to negative determinants of mental health.
5.3.3.3. AIR QUALITY
Regional ambient air pollution is linked to an increase in lower respiratory symptoms; reduction in lung function in children and adults; increase in chronic obstructive pulmonary disease; lung cancer; bronchitis; chronic cough; respiratory illness; asthma exacerbation; and premature mortality. Both long-term (Dockery et al., 1993; Pope et al., 1995; Hoek et al., 2002) and short-term (Dominici et al., 2003; Atkinson et al., 2010) population-based health effect studies have reported associations between high levels of ambient air pollutants and cardiovascular mortality. Several studies have reported an association between ambient air pollution and nonfatal cardiac events, including myocardial infarction (Peters et al., 2004; Pope et al., 2008; Miller et al., 2007; von Klot et al., 2008), angina/other ischemic heart disease (Schwartz et al., 1995; Miller at al., 2007; von Klot et al., 2008), and dysrhythmias (Schwartz et al., 1995; Rosenlund et al., 2008). Short-term and long-term exposure to PM2.5 is associated with hospitalizations for cardiovascular disease (CVD), all respiratory diseases, stroke and diabetes (Kloog et al., 2012). A significant body of evidence exists on acute exposure to fine particulate matter and daily cardiovascular hospital admissions after adjusting for season, weather, and day of week (US EPA, 2006). Peters et al. (2001) reported on a study of 772 patients in Boston in which elevated ambient fine particles triggered acute myocardial infarctions during two separate exposure periods (within 2 hours and 1 day after exposure).
In the past decade, epidemiological studies have demonstrated associations between adverse health effects and exposure to traffic-related air pollutants near major roadways. Factors that influence the spatial and temporal distribution of traffic-related pollutant concentrations include chemical reaction/transformation/deposition, meteorological conditions, traffic volume, traffic type, driving conditions, and related emission rates. Monitoring studies have found that concentrations of traffic-related air pollutants decrease rapidly with distance from major roadways and typically approach background within 300-500 meters. For example, studies that have measured traffic-related air pollutants near major roadways have found steep gradients with impacts between 100-500 meters for NO2, 50-250 meters for elemental carbon, 100-500 meters for PM2.5, and 50-200 meters for ultrafine particle counts (Zhou et al., 2009). A mobile monitoring study of emissions associated with Interstate 93 in Somerville, MA observed
14

HEALTH IMPACT ASSESSMENT OF THE MASSACHUSETTS DEPARTMENT OF TRANSPORTATION (MassDOT) GROUNDING McGRATH STUDY
an annual median concentration of particle number two-fold higher within 0-50 meters of the roadway compared to background (Padro-Martinez et al., 2012). Pollutants associated with mobile source emissions include particulate matter (PM2.5 and ultrafine particles), carbon monoxide (CO), nitrogen oxides, diesel exhaust, and volatile organic compounds, many of which are classified as hazardous air pollutants (e.g., benzene, formaldehyde).
Older adults, children, people with pre-existing cardiovascular and respiratory disease, pregnant women, and low socioeconomic status predispose individuals to greater health impacts from exposure to air pollution (US EPA, 2009). In addition, research suggests that the chronic stressors related to socioeconomic status and poverty may increase susceptibility to pollutants, particularly in young children. For example, studies have found associations between traffic-related air pollution and pediatric asthma solely among urban children exposed to violence (Clougherty et al., 2007) and chronic family stress (Chen et al., 2008).
5.3.3.4. NOISE
The Federal Highway Administration (FHWA) defines noise as unwanted or excessive sound that can be annoying, and can interfere with sleep, work, or recreation. Walker (2012) explored the relationship between road traffic noise and sleep patterns, high blood pressure, and annoyance in Somerville, MA and found a significant and positive correlation between the modeled noise levels and resident annoyance towards road traffic noise. An evaluation of noise studies in England found that there were no statistically significant associations between road traffic noise and ischemic heart disease incidence in two studies, but there was a suggestion of effects when modifying factors such as length of residence, room orientation, and window opening were taken into account. In a study by Stansfeld et al., men with pre-existing disease had an increased odds of incident ischemic heart disease for the highest annoyance category compared to men without pre-existing disease in the lowest category (OR = 2.45, 95% 1.13 - 5.31) (Stansfeld et al., 2011). A recent study by Dratva et al. (2012) found that traffic noise was associated with higher blood pressure only in diabetics, possibly due to low exposure levels (during the day and night of 51 dB(A) and 39 dB(A), respectively). A study by Babisch (2006) presented evidence that transportation noise levels above 60 dB(A) have been associated with high blood pressure, hypertension, and ischemic heart disease. A study of potential health effects of modeled road traffic noise in Somerville, MA found that residents living closest to major roadways were exposed to noise levels above the WHO guideline value (Walker, 2012).
5.3.3.5. PUBLIC SAFETY
Several studies have confirmed that there is a statistically significant relationship between traffic volume and the number of vehicle collisions involving a pedestrian (Levine et al. 1995, Roberts et al. 1995, Jackson and Kochtitzky 2001, CA Dept. of Transportation, 2012). Studies by Ewing et al. (2006) and Penden et al. (2009) document that higher traffic volume increases the risk of pedestrian, cyclist, and motorist injury and death, with pedestrians, cyclists, and motorized two-wheeled vehicle users bearing a disproportionate share of road injury burden. A study by LaScala et al. (2000) reports that “pedestrian collisions are more common in low-
15
HEALTH IMPACT ASSESSMENT OF THE MASSACHUSETTS DEPARTMENT OF TRANSPORTATION (MassDOT) GROUNDING McGRATH STUDY
income areas, potentially reflecting greater residential density, greater traffic volume, and lower automobile ownership among residents of these neighborhoods.” Racial disparities in risks associated with pedestrian crashes are reported by Roberts et al. (1994). African American and Hispanic race/ethnicity as well as uninsured status are linked to increased risk of mortality from collisions according to a study by Maybury et al. (2010).
Frumkin et al. (2004) report that areas with high levels of vehicle miles traveled per capita tend to have higher collision and injury rates and that more time in a car means higher exposure to the perils of driving, including collisions. For the state of Massachusetts, the National Highway Traffic Safety Administration estimates 0.58 fatalities per 100 million VMT (NHSA, 2012).
The CDC (2012) has compiled statistics showing that motor vehicle crashes are the leading cause of death among those ages 5-34 in the U.S. A study by Beck et al. (2007) using national transportation and injury statistics, determined the risk of fatal injury per person-trip by bus in the U.S. is 23 times less than by car (0.4 versus 9.2 fatalities per 100 million person-trips) and the risk of non-fatal injury is five times less for bus trips compared to automobile trips (161 versus 803 per 100 million person-trips). The National Safety Council (2009) has determined that the lifetime odds of dying as a car driver or passenger are 1 in 261, compared to 1 in 64,596 as a bus occupant or 1 in 115,489 on a train.
5.3.4. Pathway Diagrams and Research Questions
In order to inform the decision-making process, pathway diagrams were discussed during the October 2011 HIA training and further developed for the HIA to link the evaluation criteria of the MassDOT GM Study with health determinants. Pathway diagrams describe effects directly related to the study and link these effects to health determinants and then health outcomes. The MassDOT GM Study identified evaluation criteria to objectively evaluate the impacts and benefits associated with alternative designs to the existing McGrath Highway such as improved access and mobility, maintenance of regional travel capacity, and support of economic development in the vicinity of McGrath Highway. The MassDOT GM Study does not explicitly address the health implications of the alternatives. Thus, to address the goal of using the HIA to inform the MassDOT GM Study decision-making process, MassDOT’s evaluation criteria was incorporated into the pathway diagrams in order to link the MassDOT GM Study criteria with health data. In other words, the pathway diagrams begin with MassDOT evaluation criteria and are then linked to health determinants and outcomes.
The health determinants originally identified were consolidated in the HIA and carried through into the assessment phase: (1) air quality; (2) noise; (3) mobility and connectivity; (4) public safety; and (5) land use and economic development. The pathway diagrams formed the basis of research questions to be addressed in the assessment phase. To illustrate those criteria from the MassDOT GM Study that were incorporated into the pathway diagrams, the criteria are highlighted in red lettering. The research questions were presented to the MassDOT GM Working Group for discussion and feedback. One of the major concerns expressed by members of the MassDOT GM Working Group related to limitations of the CTPS Travel Demand Model for estimating traffic emissions for use in health risk assessment and the need
16

HEALTH IMPACT ASSESSMENT OF THE MASSACHUSETTS DEPARTMENT OF TRANSPORTATION (MassDOT) GROUNDING McGRATH STUDY
to consider near-road exposures. To address these concerns, air dispersion modeling was conducted as part of the HIA to identify areas that are predicted to experience relatively higher exposure to traffic emissions. Near-roadway exposures to vehicle emissions (e.g., ultrafine particles) were evaluated based on proximity of households within 200 meters around McGrath Highway.
Figure 5-E to Figure 5-J (pages 35-40) show the pathway diagrams for each of the five selected health determinants and a summary of research questions to be addressed in this pilot HIA.
5.3.5. Geographic and Temporal Boundaries and Demographics for HIA
5.3.5.1. GEOGRAPHIC BOUNDARIES
The geographical scope of the study area for the GM HIA is illustrated in Figure 5-K to Figure 5-O (pages 41-45). The HIA study area was determined by extending the study area defined in the MassDOT GM Study to the boundaries of zip code areas adjacent to the McGrath Highway. Zip code areas represent the smallest geographical area that some health data (in this case, hospitalization data) are available. This area represents approximately 4 square miles and encompasses Inner Belt/Brickbottom, Union Square, and East Somerville neighborhoods in Somerville as well as zip codes 02141, 02142, 02143, and 02145 (including a small section of Cambridge) and census tracts 350103, 350104, 350200, 351300, 351402, 351404, and 351500.
5.3.5.2. TEMPORAL BOUNDARIES
It is important to note that the MassDOT GM Study defines the 2035 highway conditions with no structural changes as the 2035 No-Build case, and compares alternatives to this baseline. The 2035 No-Build case, for example, takes into account the significant emission reductions that are predicted from the implementation of federal requirements to significantly reduce motor vehicle fleet emissions by 2035. In addition, the 2035 No-Build case also assumes that the Green Line Extension is operational and the development of the Inner Belt and Brickbottom neighborhood is completed. Given the need to consider the long-term potential impacts on health of alternative designs, the HIA supplements the MassDOT GM Study by considering 2010 existing conditions compared to the 2035 No-Build case, and to alternative designs. Thus, the pilot HIA compares existing conditions in 2010 to future 2035 No-Build, and future 2035 alternative designs.
5.3.5.3. DEMOGRAPHICS
The demographic data are based on 2010 Census data for Somerville, MA by census tracts. General population data characteristics that will be provided include: population estimates based on 2010 Census and projected changes in population in 2035 from the CTPS Travel Demand Model; median age; race/ethnicity; high school graduate percentages; measures of socioeconomic status (e.g., poverty rate, median household income, unemployment); and average assessed value of property parcels.
17

HEALTH IMPACT ASSESSMENT OF THE MASSACHUSETTS DEPARTMENT OF TRANSPORTATION (MassDOT) GROUNDING McGRATH STUDY
5.3.6. Identity of Affected Populations Including Vulnerable Groups
The community surrounding McGrath Highway is designated as an Environmental Justice community according to criteria established by EOEEA. These criteria include the following:
The median annual household income is at or below 65 percent of the statewide median income for Massachusetts; or
25 percent of the residents are minority; or 25 percent of the residents are foreign born, or 25 percent of the residents are lacking English language proficiency.
Hence, socioeconomic factors including income, housing availability/costs, and access to medical care are important factors that need to be considered in the baseline health assessment of public health and vulnerable populations. This HIA characterizes vulnerable populations in the study area by considering EJ factors (e.g., income), elderly and senior living, special needs (e.g., disabled, elderly disabled), and public housing. Supplemental data characterizing vulnerable populations was provided by City of Somerville officials.
5.3.7. Roles for Experts and Key Informants
The pilot HIA involves many partners and stakeholders.
5.3.7.1. THE HEALTH IMPACT PROJECT AND HUMAN IMPACT PARTNERS
Dr. Aaron Wernham, Ms. Bethany Rogerson, and Ms. Kim Gilhuly have provided invaluable technical assistance throughout the HIA planning and development process to the MDPH HIA team. They also conducted the HIA training focused on this HIA in October 2011.
5.3.7.2. CITY OF SOMERVILLE
MDPH/BEH met with representatives from the City of Somerville to discuss city-specific information available for inclusion in the HIA. Mr. Brad Rawson, Economic Development Planner for the City of Somerville, provided information on Inner Belt and Brickbottom development and an extensive GIS dataset, including locations of businesses operating in Somerville. This information was used to evaluate availability and access of goods and services, special housing, and public housing data. Ms. Paulette Renault-Caragianes, Somerville Health Director, provided health data information available to assess baseline health conditions in Somerville. Ms. Renault-Caragianes also participated in the HIA training.
5.3.7.3. GROUNDING MCGRATH WORKING GROUP/COMMUNITY INPUT
On March 7, 2012, the MassDOT GM Study Working Group met in Somerville, MA to discuss the development of alternative designs to the McGrath Highway. At this meeting, Suzanne Condon, MDPH Associate Commissioner and the PI for the GM HIA, presented an update on the HIA including draft research questions for the HIA and discussed establishing an HIA Subteam to obtain additional community input on the HIA from stakeholders. Three members
18

HEALTH IMPACT ASSESSMENT OF THE MASSACHUSETTS DEPARTMENT OF TRANSPORTATION (MassDOT) GROUNDING McGRATH STUDY
of the MassDOT GM Study Working Group indicated they were interested in participating in the HIA Subteam. A status update report on the HIA was also provided by MDPH/BEH Senior Environmental Analyst, Margaret Round, at the September 27, 2012 MassDOT GM Study Working Group meeting. Finally, MDPH/BEH met with Mr. Wig Zamore, member of the MassDOT GM Study Working Group, to review scientific literature related to exposure to air pollution in and around highways. MDPH/BEH also received resident input relative to concerns about the safety of the existing highway structure and advocating for the de-elevation of the McGrath viaduct instead of repairing it.
5.3.7.4. COMMUNITY ASSESSMENT OF FREEWAY EXPOSURE AND HEALTH
MDPH/BEH has been closely following the progress of the Community Assessment of Freeway Exposure and Health (CAFEH) study and participates as a member of the advisory board. The CAFEH study is being conducted at Tufts University through funding by the National Institute of Health and research affiliates who also participate on the MassDOT GM Study Working Group. The aim of CAFEH is to assess the association between exposure to air pollutants from highway traffic and cardiac health in communities located near highways. An important component of the CAFEH study is real-time monitoring of ultrafine particulates (UFP) emissions near roadways. Margaret Round has represented MDPH on the Advisory Committee for this study.
5.3.7.5. MASSDOT AND CONTRACTORS
MDPH/BEH met regularly with MassDOT and their contractors throughout 2012 in order to keep apprised of the MassDOT GM Study analysis.
5.3.7.6. CENTRAL TRANSPORTATION PLANNING STAFF (CTPS):
MDPH/BEH has worked closely with CTPS staff who have provided extensive input and output data from the Travel Demand Model for incorporation into the HIA assessment. CTPS is the technical support staff to the Boston Regional Metropolitan Planning Organization. CTPS staff also provided technical support regarding the appropriate application of modeling data.
5.3.8. Analytical Plan for Assessing Distribution of Impacts
The following section provides (1) definition of the study area; (2) identification and methods for identifying baseline health data; and (3) a summary of the methods to assess each of the health determinants identified above: air quality, noise, mobility and connectivity, public safety, and land use and economic development. For each health determinant, the purpose, source of data and analytical method are presented.
19

HEALTH IMPACT ASSESSMENT OF THE MASSACHUSETTS DEPARTMENT OF TRANSPORTATION (MassDOT) GROUNDING McGRATH STUDY
5.3.8.1. DEFINITION OF THE STUDY AREA
The study area for the pilot HIA was based on superimposing the census tracts, zip code boundaries, and neighborhood boundaries above the study area defined in the MassDOT GM Study. These maps are illustrated in Figure 5-K through Figure 5-O (pages 41-45).
5.3.8.2. BASELINE HEALTH DATA
Health surveillance data are available at a variety of geographic levels (e.g., census tract, zip code). A comprehensive baseline health assessment was conducted as part of the HIA based on existing health surveillance data at the finest geographical resolution possible (see Table 5-2).
Table 5-2: Health Data, Geography, Data Sources and Methods Used in GM HIA
Health Data Geography Data Sources Methods (3)Hospitalization (inpatient) data Asthma (inpatient and ED) Myocardial infarction
By zip code and Community
MDPH/ BEH EPHT Portal (2)
Rate of health outcomes in study area by zip code for 2010
Hospitalization (inpatient) data Congestive heart failure Stroke Hypertension
By zip code andCommunity
Center for Health Information and Analysis
Rate of health outcomes in study area by zip code for 2010
Pediatric obesity Pediatric overweight Pediatric depression
Community School Health Services, DPH Bureau of Community Health and Prevention
2009-2011 for grades 1, 4, 7 and 10
Adult obesity data Adult hypertension Adult diabetes No exercise Eats 5 fruits and vegetables/day
Community BRFSS (5) Outcomes for 2009 in Somerville
Low birth weight By census tract and statewide
Registry of Vital Records and Statistics
Calculated birth weight statistics
Pediatric asthma (Grades K-8) Elementary schools in pilot HIA study area and community
MDPH/BEHEPHT Portal (2)
Prevalence rates in 2008-2009
Pediatric diabetes (Grades K-8) Community MDPH/BEHEPHT Portal (2)
Prevalence rates in 2008-2009
Lung and bronchus cancer By census tract andcommunity
MDPH/ BEH EPHT Portal and MA Cancer Registry
SIR (4)
Injury and fatality related to traffic accidents
McGrath Highway MassDOT 2010
(1) Formerly Massachusetts Division of Health Care Finance and Policy(2) Environmental Public Health Tracking portal is a web-based portal housed at MPDH/BEH that contains a variety of data
including health data, environmental data, and health promotion information (e.g., bike trails, walking trails)(3) Methods described in Analytical Plan section of GM HIA
20

HEALTH IMPACT ASSESSMENT OF THE MASSACHUSETTS DEPARTMENT OF TRANSPORTATION (MassDOT) GROUNDING McGRATH STUDY
(4) Standardized Incidence Ratio. SIR is the ratio of observed cancer diagnoses in an area to the expected multiplied by 100.(5) Behavioral Risk Factor Surveillance System is an annual survey of health issues, health conditions, risk factors, and behaviors
Hospitalization Data
The MDPH/BEH obtains inpatient, emergency department (ED), and outpatient observation hospitalization data annually from all 74 acute care hospitals in Massachusetts from the Center for Health Information and Analysis (formerly the Massachusetts Division of Health Care Finance and Policy). This division collects emergency department data and inpatient hospital admissions data for all visits to Massachusetts acute care hospitals and satellite emergency facilities. A data suppression rule is imposed when case counts are less than 7 in order to protect patient confidentiality for smaller geographic levels (e.g., zip code) or sparsely populated areas. Disease hospitalization rates are based on the residential location of the cases and not necessarily the location of the incident.
The data are based on primary discharge diagnosis codes (ICD9-CM) only. Cases are not included if the condition is listed only as a secondary diagnosis. The data used for this HIA are the most recent hospitalizations data available among Massachusetts residents with an admission date in the year 2010.
Using residential address information, hospitalization rates were calculated separately for the city of Somerville and each of four zip code areas within the pilot HIA study area. Due to the instability of rates associated with individual zip codes and the lack of a statistically significant difference in rates across the four zip codes, hospitalization rates are presented for the combined four-zip-code portion of the study area.
Population data used in the calculation of incidence rates are from the 2010 US Census. The 2010 US Census provides age-stratified population estimates at the state, city, and zip code tabulation area (ZCTA) level. ZCTAs are statistical geographic entities that approximate the delivery area for US Postal Service zip codes. ZCTAs are aggregations of census blocks having the same predominant zip code associated with the residential mailing addresses in the Census Bureau’s master address file. Incidence rates at the zip code level were calculated using population data for the matching ZCTAs. Rates were age-standardized to the 2010 population distributions of MA and the US into the following 10 age groups (years): 0-4, 5-9, 10-14, 15-24, 25-34, 35-44, 45-54, 55-64, 65-74, and 75+.
Crude and standardized rates are based on the age groups most affected by a particular disease. For example, data are restricted to ages 35 and above for rates of myocardial infarction, congestive heart failure, stroke, and hypertension. Data are restricted to ages 15 and above for rates of adult onset diabetes. For asthma, all ages are included.
School Health Data on Obesity, Overweight, and Depression
21

HEALTH IMPACT ASSESSMENT OF THE MASSACHUSETTS DEPARTMENT OF TRANSPORTATION (MassDOT) GROUNDING McGRATH STUDY
Schools are required by Massachusetts General Law to provide health screenings for students (M.G.L. Chapter 71, Section 57 and 105 CMR 200.00) and follow up with the results of these screenings with families and referrals to primary health care providers as necessary. In February 2009, Massachusetts promulgated amendments to the regulations on Physical Examination of School Children, 105 CMR 200.000, to improve the screening and monitoring of the health assessment of children across the Commonwealth. Among other changes, the amended regulations require screening for height and weight and the recording and reporting of the BMI for all students in grades 1, 4, 7, and 10 (or of comparable age).
Overweight and underweight children are at risk for a variety of health problems, making early identification of weight status important. Eating disorders such as anorexia, bulimia, and binge eating can result in serious long-term health problems and poor school performance. Overweight and obesity in children and adolescents are risk factors for a variety of serious health conditions such as Type 2 Diabetes and cardiovascular disease (Comprehensive School Health Manual, 2007). Data reported to MDPH School Health Unit Bureau of Community Health and Prevention for Somerville on obesity/overweight children for 2009-2011 were summarized for this HIA (MDPH 2012). Some data were also available on depression and school students.
Behavioral Risk Factor Surveillance System (BRFSS) Data
Behavioral Risk Factor Surveillance System (BRFSS) is an annual telephone survey that collects data on emerging public health issues, health conditions, risk factors, and behaviors. The BRFSS was established in 1984 by the U.S. Centers for Disease Control and Prevention (CDC) and is the largest, ongoing telephone health survey system, tracking health conditions and risk behaviors in the United States. Currently, data are collected monthly in all 50 states, the District of Columbia, Puerto Rico, the U.S. Virgin Islands, and Guam. In Massachusetts, the BRFSS is coordinated by the MDPH Bureau of Health Information Research Statistics and Evaluation (BHIRSE).
The BRFSS data are not readily available at the community level because the survey is designed to provide health information statewide or by larger metropolitan areas and because a majority of communities surveyed do not have adequate sample sizes for directly calculating prevalence rates with reasonable precision (Li et al., 2009). Therefore, BRFSS data are presented at the county level (Middlesex).
For the GM HIA, MDPH/BHIRSE provided health outcome data for prevalence of Type II diabetes, obesity, and hypertension in Somerville, as well as data on exercise and eating fruits/vegetables.
Pediatric Asthma and Pediatric Diabetes Data
MDPH/BEH conducts pediatric asthma and diabetes surveillance in children who are enrolled in approximately 2,200 public and private schools, grades kindergarten through 8, to monitor the prevalence of pediatric asthma and diabetes statewide and to evaluate which communities
22
HEALTH IMPACT ASSESSMENT OF THE MASSACHUSETTS DEPARTMENT OF TRANSPORTATION (MassDOT) GROUNDING McGRATH STUDY
may have higher rates pediatric asthma or diabetes than the state as a whole. These data are readily available on the MDPH/BEH Environmental Public Health Tracking Portal. Information collected as part of this surveillance effort includes name and address of the school and the number of children with asthma or diabetes by gender and by grade. The city or town of residence for each child is also collected. Collection of these surveillance data enables MDPH/BEH to estimate asthma and diabetes prevalence by school as well as by city/town of residence. No child-specific information that could identify a particular student is collected. Pediatric asthma and diabetes data for school year 2008–2009 were summarized for the 14 schools located in the MassDOT GM Study area (asthma) or by community (diabetes). These data were compared to the statewide rate.
Injury Surveillance Data
MDPH/BEH obtained traffic fatality data for McGrath Highway from 2010 Top Crash Locations Report, September 2012, MassDOT.(http://www.mhd.state.ma.us/downloads/trafficMgmt/10TopCrashLocationsRpt.pdf)
Cancer Incidence
In response to public comments on the draft HIA, MDPH/BEH evaluated lung and bronchus cancer incidence data from 2004–2008 for the city of Somerville as a whole and for the five census tracts comprising the study area. These data are readily available on the Environmental Public Health Tracking Portal. Cancer incidence data are obtained from the Massachusetts Cancer Registry (MCR) within the MDPH Bureau of Health Information, Statistics, Research, and Evaluation and available on the MA Environmental Public Health Tracking Portal (http://matracking.ehs.state.ma.us/).
Low Birth Weight
Birth weight statistics (low weight <2,500 grams and very low weight <1,500 grams) for selected census tracts were calculated from data obtained from the Massachusetts Standard Certificate of Live Birth, which is filed with the Registry of Vital Records and Statistics.
5.3.8.3. METHODS TO ASSESS HEALTH DETERMINANTS IN THE HIA
Air Quality
Two approaches for evaluating potential air quality impacts have been developed for consideration in this HIA as well as for methodological approaches in transportation HIAs to be conducted in response to MGL c. 6 § 33(v) and (x). The first approach utilized traffic density data contained in the CTPS Travel Demand Model. The second approach used screening level air dispersion modeling to estimate air pollutant concentrations in the study area based on the CTPS Travel Demand Model air pollution emissions data. For both approaches, MDPH/BEH qualitatively evaluated possible differences in air pollution impacts on health
23
HEALTH IMPACT ASSESSMENT OF THE MASSACHUSETTS DEPARTMENT OF TRANSPORTATION (MassDOT) GROUNDING McGRATH STUDY
considering the proximity of sidewalks, bike paths, and community paths to roadways under the various alternative designs. The predicted air pollution impacts also included consideration of elevation (No-Build) versus de-elevation (all alternatives) on predicted concentrations in the study area. Air quality emissions based on traffic density
Purpose: Use traffic density data as a surrogate for exposure to traffic-related pollutant emissions (e.g., PM2.5, NOx) for 2010 existing conditions, 2035 No-Build, and alternative designs
Source of Data: CTPS Travel Demand Model for 2010 existing conditions, 2035 No-Build, and four alternative designs. The CTPS Travel Demand Model data represent emissions during 3-hour morning and evening peak traffic periods.
Analytical Method: Traffic density is a measure of the rate of traffic flow per unit time along lengths of road within a specified area and is expressed as vehicle miles (or kilometers) traveled (VMT) per square mile (or kilometer), i.e., daily VMT/mi2. The traffic density was expressed as 3-hour morning and afternoon peak periods by Transportation Analysis Zones (TAZs) within the GM HIA study area from the CTPS Travel Demand Model (Rioux et al., 2010). Results: Model output was spatially interpolated by MDPH/BEH using ArcGIS Inverse Distance Weighted tool to create spatial traffic density contours in the study area and compare 2010 existing conditions to 2035 No-Build, and alternative designs. In general, the lower the traffic density, the lower the potential air pollution impact on health.
Predicting air pollutant concentrations using air dispersion modeling
Purpose: Estimate ambient air concentrations of traffic-related pollutants (e.g., PM2.5, NOx) by conducting air dispersion modeling.
Source of Data: Air quality emissions (PM2.5, NOx) data from US EPA’s Mobile 6.2 used in the CTPS Travel Demand Model for 2010 existing conditions, 2035 No-Build, and alternative designs. Scaling factors of 0.40 and 0.36 were applied to the 3-hour volumes to determine 1-hour peak AM and PM traffic volumes.
Analytical method: MDPH/BEH contracted with Dr. Bruce Egan of Egan Environmental, Inc. to conduct screening level air dispersion modeling using CAL3QHC. This is an EPA-approved dispersion model that estimates pollutant concentrations from vehicular traffic. Emissions data from the Travel Demand Model were applied to this analysis. A special version (CAL3QHCi) that allows inclusion of all links for which emissions data were generated from the CTPS Travel Demand Model to allow for better air concentration estimates was obtained by MDPH/BEH from Michael Claggett of Federal Highway Administration (FHWA) specifically for this HIA.
24

HEALTH IMPACT ASSESSMENT OF THE MASSACHUSETTS DEPARTMENT OF TRANSPORTATION (MassDOT) GROUNDING McGRATH STUDY
The dispersion component used in CAL3QHC is CALINE-3, a line source dispersion model developed by the California Department of Transportation. CALINE-3 estimates air pollutant concentrations resulting from moving vehicles on a roadway based on the assumptions that pollutants emitted from motor vehicles traveling along a segment of roadway can be represented as a "line source" of emissions, and that pollutants will disperse in a Gaussian distribution from a defined "mixing zone" over the roadway being modeled. For each planned roadway configuration alternative as well as the 2010 existing conditions and 2035 No-Build for the McGrath Highway, emissions information on NOx and, PM2.5 was obtained from the CTPS Travel Demand Model output.
Modeling parameters included:
Model Options
Surface roughness length = 175 cm (urban) Settling velocity = 0 cm/sec Deposition velocity = 0 cm/sec
Receptor Inputs
Concentration estimates were calculated at 986 receptor locations. These locations were based on a rectangular grid with 100-meter spacing encompassing the traffic links. Receptor heights were set to 1.8 meters above ground, assuming flat terrain.
Link Inputs
Roadway link data was provided by CTPS Travel Demand Model. These data were derived from the Travel Demand Model, and included the starting and ending link node UTM locations, 3-hour AM and PM traffic volumes, pollutant emissions, link length and the number of lanes for each link, for six scenarios: 2010 existing conditions, 2035 No-Build, Boulevard, Access Road, Hybrid U-Turn/Rotary, and Boulevard with Inner Belt Connection alternatives.
The existing McGrath Highway is elevated above grade for portions of the study area. The source height for these links was determined from building plans obtained from MassDOT. All side streets and build case links were modeled ‘at grade’.
CAL3QHCi was applied to determine peak 1-hour NOx and PM2.5 concentrations to correlate with meteorological data. The model uses an emission factor input in grams per vehicle-mile. These values were calculated using the provided link length, 3-hour traffic volume and 3-hour emissions. Scaling factors of 0.40 and 0.36 were applied to the 3-hour volumes to determine peak morning and evening traffic volumes (CTPS, 2012).
The mixing zone width was calculated as the width of the link plus 20 feet (extending 10 feet on each side), assuming 10-foot lanes.
25

HEALTH IMPACT ASSESSMENT OF THE MASSACHUSETTS DEPARTMENT OF TRANSPORTATION (MassDOT) GROUNDING McGRATH STUDY
Meteorological Inputs
CAL3QHCi was applied using the following 54 stability class/wind speed conditions: Stability Class A: 1, 1.5, 2, 2.5 and 3 m/sec Stability Class B: 1, 1.5, 2, 2.5, 3, 3.5, 4, 4.5 and 5 m/sec Stability Class C: 1, 1.5, 2, 2.5, 3, 3.5, 4, 4.5, 5, 8 and 10 m/sec Stability Class D: 1, 1.5, 2, 2.5, 3, 3.5, 4, 4.5, 5, 8, 10, 15 and 20 m/sec Stability Class E: 1, 1.5, 2, 2.5, 3, 3.5, 4, 4.5 and 5 m/sec Stability Class F: 1, 1.5, 2, 2.5, 3, 3.5, and 4 m/sec
The wind direction varied in 10-degree increments from 10 through 360 degrees. The mixing height was set to 1,000 meters. No background concentration values were added to the model calculations.
Results: Model output was spatially interpolated using ArcGIS Inverse Distance Weighted tool to create air pollution concentration contours in the study area for 2010 existing conditions, 2035 No-Build, and alternative designs. The air pollution concentration contour maps also provide predicted air pollution concentrations 200 meters from the center of the highway for each of the 2010 existing conditions, 2035 No-Build, and alternative designs. This allowed for evaluation of possible differences within the study area, including the analysis of potential exposure to ultrafine particles within 200 meters of McGrath Highway.
Noise
Purpose: Estimate noise level (dBA) at the peak traffic volume location along McGrath Highway for 2010 existing conditions, 2035 No-Build and alternative designs.
Source of Data: Peak period volume in typical workweek day morning predicted from the CTPS Travel Demand Model for 2010 existing conditions, 2035 No-Build, and alternative designs.
Analytical Methods: Traffic noise was modeled by MDPH/BEH for a representative section of the roadway with the peak traffic volumes to conservatively calculate maximum noise levels for 2010 existing conditions, 2035 No-Build, and alternative designs using the Federal Highway Administration (FHWA) Traffic Noise Model (TNM) Version 2.5. Five different types of vehicles types of fleet mix from the motor vehicle module (MOBILE 6.2) were obtained from the CTPS Travel Demand Model for 2010 existing conditions, 2035 No-Build, and alternative designs. As described above, scaling factors of 0.40 and 0.36 were applied to the 3-hour volumes to determine 1-hour peak morning and evening traffic volumes.
Two scenarios were modeled: the current speed limit of 35 mph on McGrath Highway and a speed limit of 45 mph. The 2010 existing conditions and 2035 No-Build were assumed to be elevated, as is the current structure. A 20-foot elevation was assumed. The four alternatives were assumed to not be elevated (consistent with design assumptions). The terrain was
26

HEALTH IMPACT ASSESSMENT OF THE MASSACHUSETTS DEPARTMENT OF TRANSPORTATION (MassDOT) GROUNDING McGRATH STUDY
assumed to be flat. One building row was assumed to exist adjacent to the highway. Sound levels were calculated at intervals of 50 feet from the highway up to 1,300 feet. Results: Comparison tables were generated to compare how noise levels varied with distance from the highway for 2010 existing conditions, 2035 No-Build, and alternative designs. These data also address questions related to impacts that may be associated with changes in traffic volume on the highway and adjacent nearby streets.
Mobility and Connectivity
For mobility, the HIA assessed the capacity of existing conditions and alternative designs to encourage walking and biking. For connectivity, the potential for increased physical activity from mode shifts and increased connectivity to nearby neighborhoods and public transit were assessed. In addition, qualitative assessment of the shift in vehicle use from McGrath Highway to nearby neighborhoods predicted from analysis of alternative designs was evaluated.
Mobility
Purpose: Evaluate the capacity of alternative designs to encourage walking and biking in and around the McGrath Highway area compared to 2010 existing conditions, 2035 No-Build, and alternative designs.
Source of Data: To evaluate the potential for increased physical activity through increased walkability and bikeability, MDPH/BEH used the Pedestrian Environmental Quality Index (PEQI) and the Bicycle Environmental Quality Index (BEQI) developed by the San Francisco Department of Public Health (SFDPH).
Pedestrian Environmental Quality Index (PEQI)
SFDPH developed the PEQI as a practical method to evaluate existing barriers to walking and prioritize future investments for increasing pedestrian activity and safety in land use and urban planning processes. SFDPH consulted national experts including city planners, independent planning consultants, and pedestrian advocates to develop the indicator weights and scores for each indicator category.
The study area for the HIA includes McGrath Highway and streets located about two blocks east and west of the highway. Physical attributes of the sidewalks, location of public transit, and roadway conditions associated with 2010 existing conditions, 2035 No-Build and alternative designs were evaluated. The SFDPH worked with MDPH/BEH to adapt software for conducting the survey of sidewalks and bike paths in the McGrath Highway study area. MDPH/BEH used this newer version of PEQI provided by SFDPH that allowed for adaptation for use in cities outside of San Francisco.
27

HEALTH IMPACT ASSESSMENT OF THE MASSACHUSETTS DEPARTMENT OF TRANSPORTATION (MassDOT) GROUNDING McGRATH STUDY
Analytical method: The PEQI is an observational survey that quantifies street and intersection factors empirically known to affect people’s travel behaviors and is organized into five categories: intersection safety, traffic, street design, land use, and perceived safety. These indicators are aggregated to create a weighted summary index, which can be reported as an overall index. A PEQI score, reflecting the quality of the pedestrian environment on a 0 to 100 scale, is created for each street segment and intersection in a defined area. Below is the list of indicators for assessing pedestrian ease and security. Many of these indicators are included in the MassDOT GM Study evaluation criteria.
Intersection Safety: Crosswalks, Intersection lighting, Traffic control, Pedestrian signal, Countdown signal, Wait time, Crossing speed, Pedestrian refuge island, Curb ramps, Intersection traffic calming features, Pedestrian engineering countermeasuresTraffic Volume: Number of vehicle lanes, Posted speed limit, Traffic volume, Street traffic calming featuresStreet Design: Continuous sidewalk, Width of sidewalk, Width of throughway, Large sidewalk obstructions, Sidewalk impediments, Trees, Driveway cuts, Presence of a buffer, Planters/ gardensLand use: Public seating, Retail use and public places, Public art/historic sitesPerceived safety: Pedestrian scale lighting, Illegal graffiti, Litter, Empty lots
Bicycle Environmental Quality Index (BEQI)
The BEQI is similar in many respects to PEQI. It has 22 empirically-based indicators, each of which has been shown to promote or discourage bicycle riding and connectivity to other modes of transport. SFDPH identified five main categories which are considered important physical environmental factors for bicyclists: Intersection Safety, Vehicle Traffic, Street Design, Safety, and Land Use. The indicators summarized below can be aggregated to create the final index (the BEQI), which can be reported as an overall index score, and/or deconstructed by the bicycle environmental categories.
Intersection Safety: Dashed intersection bicycle lane, No turn on red signs, Bicycle pavement treatment, AmenitiesVehicle Traffic: Number of vehicle lanes, Vehicle speed, Traffic calming features, Parallel parking adjacent to bicycle lane/route and street, Traffic volume, Percentage of heavy vehiclesSafety/Other: Presence of street lighting, Presence of bicycle lane or share roadway signsLand Use: Line of site, Bicycle parking, Retail use
Results of PEQI and BEQI Analyses
For the GM HIA, Google Maps Street Views were generated to assist MDPH/BEH in completion of the BEQI and PEQI surveys. Once the data entry is complete, the information is mapped using ESRI ArcGIS software. Streets are color coded depending upon PEQI scores, ranging from less than 20: Unsuitable for Pedestrians (red color), to 81-100, Ideal pedestrian conditions exist (green color). For BEQI, streets are color-coded ranging from <20,
28
HEALTH IMPACT ASSESSMENT OF THE MASSACHUSETTS DEPARTMENT OF TRANSPORTATION (MassDOT) GROUNDING McGRATH STUDY
Environment not suitable for bicycles to >80, ideal bicycling conditions. MDPH/BEH evaluated the PEQI and BEQI color-coded maps for 2010 existing conditions, 2035 No-Build, and alternative designs to assess potential differences that would enhance walkability and bikeability and hence physical activity and health. In addition, overall BEQI and PEQI scores for each design were calculated for comparison. Although the detailed designs of the alternatives have not been developed at this stage of the MassDOT GM Study, it is MDPH/BEH’s understanding that the future pedestrian and bicycling networks for each of the four alternatives will conform to Complete Streets guidelines, which require the incorporation of the highest quality design elements associated with active transportation. Both PEQI and BEQI are also useful in identifying the capacity of the roadway network in the vicinity of McGrath Highway to encourage walking and biking.
Connectivity
Purpose: Evaluate the potential for increased physical activity through shifts in travel mode (e.g., from auto to walking) and increased connectivity to nearby areas (e.g., Union Square).
Source of Data: Mode share and travel time data generated from the CTPS Travel Demand Model was used to evaluate changes from in mode share (e.g., auto to transit and walk/bike) across neighborhoods. Pathways were selected from the MassDOT GM Study evaluation criteria (e.g., from Sullivan Square across McGrath Highway to Union Square and travel along McGrath Highway).
Analytical Methods: Access by auto, walk/bike, and public transit on specific roadways was evaluated using mode share data from 2010 existing conditions, 2035 No-Build, and alternative design analysis. Two paths evaluated in the MassDOT GM Study were selected for analysis — Washington Street from Maffa Way to Union Square (eastbound and westbound) and Medford Street and McGrath Highway from School Street to Rufo Street (northbound and southbound). These were selected to assess east-west (Washington Street) and north-south (Medford Street to McGrath Highway) directions across McGrath Highway including the areas that are proposed to be de-evaluated. These are graphically displayed in Figure 5-P (page 48).
Results: The potential for increased physical activity by shifting from auto to walk/bike along the two routes described above (i.e., along Washington Street and Medford Street to McGrath Highway) has been estimated using the following factors:
20 minute/mile brisk walking is associated with moderate intensity aerobic exercise (Warburton et al., 2006)
The physical inactivity index for Massachusetts is defined as less than 30 minutes of moderate physical activity most, if not all, days of the week (Chenoweth et al., 2006).
Vehicle Diversion from McGrath Highway to Adjacent Neighborhoods
Purpose: There is considerable concern about the potential for an increase in traffic in adjacent neighborhoods as a result of vehicle diversions from McGrath Highway associated with the
29

HEALTH IMPACT ASSESSMENT OF THE MASSACHUSETTS DEPARTMENT OF TRANSPORTATION (MassDOT) GROUNDING McGRATH STUDY
alternative designs because increased traffic in neighborhoods could result in increased health impacts. A qualitative evaluation of the potential health impacts of the diversion of vehicles from McGrath Highway to nearby neighborhoods was conducted.
Source of Data: To evaluate vehicle diversion, MDPH/BEH used the MassDOT GM Study analysis of the diversion of traffic from McGrath Highway onto three neighboring streets (Pearl Street, Medford Street, and Cross Street).Analytical Methods: MDPH/BEH presents the data on estimate of diversion of traffic from McGrath Highway to adjacent neighborhoods and qualitatively evaluate these trends in terms of potential health impacts (e.g., on respiratory conditions, noise nuisance) in the assessment section of this report.
Results: Table of change in number of vehicles diverted to neighborhoods adjacent to McGrath Highway.
Public Safety
Purpose: Evaluate the potential for injuries or fatalities associated with 2010 existing conditions, 2035 No-Build, and alternative designs. Alternative designs may result in the potential for a safer roadway and lower traffic speeds, which may reduce injuries and fatalities. Conversely, increased access by pedestrians and bicyclists to the corridor may result in an increased risk to pedestrians and bicyclists. Evaluate travel times for public safety vehicles across subject designs.
Source of Data: (1) Because injuries and fatalities are related to higher traffic volume or vehicle miles traveled per capita, data on vehicle miles traveled (VMT) from the CTPS Travel Demand Model were evaluated; (2) The Travel Demand Model also provided information to calculate expected travel time on the McGrath Highway under the different designs to address whether public safety vehicle travel may be different.
Analytical Methods: (1) Areas with high levels of vehicle miles traveled per capita tend to have higher collision and injury rates. For Massachusetts, the National Highway Traffic Safety Administration estimates 0.58 fatalities per 100 million VMT and 75 injuries per 100 million VMT (NHSA 2009). The VMT data for the 2010 existing conditions, 2035 No-Build, and alternative designs will be evaluated for estimated rates of fatalities based on the NHSA estimate. (2) The Travel Demand Model provides vehicles speeds during average travel conditions, as well as during congested conditions. Average and congested travel times along a southbound section of McGrath Highway were calculated as follows:
Travel time during average travel conditions = link length/ average uncongested speedTravel time during congested conditions = link length/ average congested speed
Travel times for links that constitute McGrath Highway southbound were summed to determine total average travel time and total congested travel time. Travel times were calculated for the 2010 existing conditions, the 2035 No-Build, and the four alternatives.
30

HEALTH IMPACT ASSESSMENT OF THE MASSACHUSETTS DEPARTMENT OF TRANSPORTATION (MassDOT) GROUNDING McGRATH STUDY
Results: (1) Results are reported on comparisons of predicted injuries and fatalities based on NHSA statistics. (2) Develop table of average and congested travel time along McGrath Highway for 2010 existing conditions, 2035 No-Build, and alternative designs.
Land Use and Development
Purpose: Assess access to multiple goods and services and green space as a surrogate for comparing land use and economic development for 2010 existing conditions, 2035 No-Build and alternative designs. The MassDOT GM Study predicts substantial changes to land use and economic development in 2035. One of the major problems with 2010 existing conditions on McGrath Highway is access to goods and services on and across neighborhoods abutting McGrath Highway.
Source of Data: The City of Somerville provided maps of existing goods and services and green space (e.g., parks) in the McGrath Highway area. MDPH/BEH staff prepared GIS data layers of these goods and services.
Analytical Methods: Inventory of existing goods/services and planned new open space in the vicinity of McGrath Highway (one-quarter mile) for 2010 existing conditions, 2035 No-Build, and alternative designs were evaluated. Access to multiple destinations for goods and services will be assessed by quantifying the number of households within one-half mile or walking distance to six areas with multiple goods and services under 2010 existing conditions, 2035 No-Build, and alternative designs. Goods and services included schools, new goods and services in the Inner Belt and Brickbottom neighborhoods, and new public transit via Green Line Extension.
Results: Map of key features (e.g., number of crosswalks, block length, pedestrian walking width) comparing access of existing conditions, 2035 No-Build, and alternatives.
31

HEALTH IMPACT ASSESSMENT OF THE MASSACHUSETTS DEPARTMENT OF TRANSPORTATION (MassDOT) GROUNDING McGRATH STUDY
5.4. FiguresFIGURE 5-A: BOULEVARD ALTERNATIVE
32

HEALTH IMPACT ASSESSMENT OF THE MASSACHUSETTS DEPARTMENT OF TRANSPORTATION (MassDOT) GROUNDING McGRATH STUDY
FIGURE 5-B: ACCESS ROAD ALTERNATIVE
33

HEALTH IMPACT ASSESSMENT OF THE MASSACHUSETTS DEPARTMENT OF TRANSPORTATION (MassDOT) GROUNDING McGRATH STUDY
FIGURE 5-C: HYBRID U-TURN/ROTARY ALTERNATIVE
34

HEALTH IMPACT ASSESSMENT OF THE MASSACHUSETTS DEPARTMENT OF TRANSPORTATION (MassDOT) GROUNDING McGRATH STUDY
FIGURE 5-D: BOULEVARD WITH INNER BELT CONNECTION ALTERNATIVE
35

HEALTH IMPACT ASSESSMENT OF THE MASSACHUSETTS DEPARTMENT OF TRANSPORTATION (MassDOT) GROUNDING McGRATH STUDY
FIGURE 5-E: AIR QUALITY PATHWAY
36
HEALTH IMPACT ASSESSMENT OF THE MASSACHUSETTS DEPARTMENT OF TRANSPORTATION (MassDOT) GROUNDING McGRATH STUDY
37
Change in McGrath Highway Structure
Change in the number and
type of vehicles on
corridor (e.g., VMT)
Change in traffic
management on corridor
(e.g., congestion)
Change in elevation of
highway structure
Change in
mode share (e.g., vehicle vs. bike vs.
walk vs. transit)
Change in air pollution
concentrations (PM2.5, PM10, UFPs, VOC,
NOx, CO and CO2)
Change in emissions
from improved vehicle
emission control
technologies
Change in proximity to
mobile source emissions
Change in type of mode
Change in travel time
along corridor
Change in exposure of
population to mobile source air pollutants
Changes in air quality-related diseases:
- Asthma/ other respiratory disease
- Cardio-vascular diseases and heart attack
- Low birth weight
Climate Change
(change in rainfall, sea-
level rise, marine life)
Change in heat-related illness, water-, food-,
vector-, or rodent-borne
disease
HEALTH IMPACT ASSESSMENT OF THE MASSACHUSETTS DEPARTMENT OF TRANSPORTATION (MassDOT) GROUNDING McGRATH STUDY
FIGURE 5-F: NOISE PATHWAY
38
Change in
McGrath Highway Structure
Change in traffic
management on corridor
(e.g., congestion)
Change in number of
vehicles on corridor
Change in elevation of
highway structure
Change in noise/
vibration levels on
corridor and in adjacent
areas
Change in vehicle noise levels due to technology
Change in exposure to
noise
Change in health outcomes:
Hypertension
Annoyance
Sleep disturbance
Cardiovascular disease
Educational outcomes
Adverse effects on mental health

HEALTH IMPACT ASSESSMENT OF THE MASSACHUSETTS DEPARTMENT OF TRANSPORTATION (MassDOT) GROUNDING McGRATH STUDY
FIGURE 5-G: MOBILITY AND CONNECTIVITY PATHWAY
39
Change in
McGrath Highway Structure
Change in vehicle
mobility/ congestion
Change in access to
public transit
Change in active
transportation: physical activity from walking to
biking
Change in sidewalk
space
Change in number of
intersections/crosswalks on corridor
Change in pedestrian and bicycle
network
Changes in parking
availability
Change in mobility and connectivity
along corridor and
adjacent communities
Change in access to
open space, parks,
recreation
Changes in access/ usability of public
resources (schools, libraries)
Change in access to
local goods and services
Increase in
physical activity
Change in cardio-
vascular disease
Change in mental
health (e.g., stress,
depression)
Change in obesity, Type II
diabetes
Change in injuries and
fatalities (See Public
Safety)

HEALTH IMPACT ASSESSMENT OF THE MASSACHUSETTS DEPARTMENT OF TRANSPORTATION (MassDOT) GROUNDING McGRATH STUDY
FIGURE 5-H: PUBLIC SAFETY PATHWAY
40
Change in
McGrath Highway Structure
Change in access to goods and services
Change in access to open space, parks, and recreation
Change in access of public resources (e.g.,
libraries)
Change in traffic
management corridor
Change in traffic along the corridor and adjacent communities
Change in pedestrian and bicycle
network
Change in number and location of
accidents and crashes
Change in emergency response
Change in crime and
public safety
Change in perceived
safety
Change in social
cohesion
Change in traffic-related
injuries and fatalities
Change in non-traffic-
related injuries and
fatalities
Change in stress and
related mental health
outcomes

HEALTH IMPACT ASSESSMENT OF THE MASSACHUSETTS DEPARTMENT OF TRANSPORTATION (MassDOT) GROUNDING McGRATH STUDY
FIGURE 5-I: LAND USE AND ECONOMIC DEVELOPMENT PATHWAY
41
Change in McGrath Highway Structure
Change in environmental
impacts
(See: air quality, climate change
and noise)
Change in physical activity
(see Mobility)
Change in injuries and
fatalities (See: Public Safety)
Change in social determinants
Change in mental health
Change in ability to care for basic
needs
Change in educational
achievements
Change in social cohesion and
shared benefits/burdens
Change in adequacy of
wages, income, and benefits
Change in property value
Change in local business
investment
Change in availability of
affordable housing
Change in access to goods
and services
Change in employment opportunities
Change in environmental
quality

HEALTH IMPACT ASSESSMENT OF THE MASSACHUSETTS DEPARTMENT OF TRANSPORTATION (MassDOT) GROUNDING McGRATH STUDY
FIGURE 5-J: RESEARCH QUESTIONS
Air QualityWhat are the public health impacts/benefits associated with changes in:
Air pollution from vehicles including technology changes; Proximity within 200 meters of roadway (for indirect measure of ultrafine particles and
higher gradient of vehicle emissions); Elevation of corridor.
NoiseWhat are the public health impacts/benefits associated with changes in:
Noise along corridor and adjacent streets from increases in vehicles in intersections, proximity, and technology changes;
Elevation of corridor.
Mobility and connectivity via traffic, transit, pedestrian/bicycling network:What are the public health impacts/benefits associated with changes in:
Vehicle use on corridor; Vehicle use in adjacent areas; Pedestrian/bicycle use; Access and use of public transportation (e.g., transit buses, Green Line Extension); Regional and local linkages via mode of transport (e.g., Union Square, Inner Belt, and
Brickbottom).
Public SafetyWhat are the public health impacts/benefits associated with changes in:
Injuries and fatalities associated with vehicle collisions; Crime and fear of crime.
Land Use and Economic DevelopmentWhat are the public health impacts/benefits associated with changes in:
Local business investment; Access to goods (e.g., grocery store, pharmacy) and services (e.g., health care
providers, schools, libraries); Housing and affordable housing (including possibility of gentrification and
displacement); Land use (e.g., Inner Belt and Brickbottom); Availability and access to parks, open space, and community path; Transportation costs; Preservation of historical and cultural resources.
42

HEALTH IMPACT ASSESSMENT OF THE MASSACHUSETTS DEPARTMENT OF TRANSPORTATION (MassDOT) GROUNDING McGRATH STUDY
FIGURE 5-K: STUDY AREA FOR THE MASSDOT GROUNDING MCGRATH STUDY
43
HEALTH IMPACT ASSESSMENT OF THE MASSACHUSETTS DEPARTMENT OF TRANSPORTATION (MassDOT) GROUNDING McGRATH STUDY
FIGURE 5-L: PILOT HIA STUDY AREA ACCORDING TO CENSUS TRACTS IN SOMERVILLE, MA
44

HEALTH IMPACT ASSESSMENT OF THE MASSACHUSETTS DEPARTMENT OF TRANSPORTATION (MassDOT) GROUNDING McGRATH STUDY
FIGURE 5-M: PILOT HIA STUDY AREA ACCORDING TO ZIP CODES IN SOMERVILLE, MA
45

HEALTH IMPACT ASSESSMENT OF THE MASSACHUSETTS DEPARTMENT OF TRANSPORTATION (MassDOT) GROUNDING McGRATH STUDY
FIGURE 5-N: PILOT HIA STUDY AREA ACCORDING TO NEIGHBORHOODS IN SOMERVILLE, MA
46
HEALTH IMPACT ASSESSMENT OF THE MASSACHUSETTS DEPARTMENT OF TRANSPORTATION (MassDOT) GROUNDING McGRATH STUDY
FIGURE 5-O: PILOT HIA STUDY AREA ACCORDING TO TRANSPORTATION ANALYSIS ZONES IN SOMERVILLE, MA
47
HEALTH IMPACT ASSESSMENT OF THE MASSACHUSETTS DEPARTMENT OF TRANSPORTATION (MassDOT) GROUNDING McGRATH STUDY
FIGURE 5-P: PATHWAYS EVALUATED IN MASSDOT GM STUDY
48
HEALTH IMPACT ASSESSMENT OF THE MASSACHUSETTS DEPARTMENT OF TRANSPORTATION (MassDOT) GROUNDING McGRATH STUDY
6. ASSESSMENT
6.1. Introduction
The assessment phase of the pilot HIA consists of the following:
Summary of existing conditions of the study area including demographic and socioeconomic information, determination of vulnerable populations in the study area, and review of baseline health information in the study area;
Assessment of the health impacts according to the analytical plan presented in the scoping section and determination of the significance of these impacts (e.g., direction, magnitude, distribution); and
Limitations and uncertainties in the assessment.
6.2. Summary of 2010 Existing Conditions
6.2.1. Demographics and Socioeconomic Factors
Table 6-3 presents the total population in Somerville based on the 2010 Census and the total population projected by the CTPS Travel Demand Model for 2035. The population is expected to increase by approximately 14%.
TABLE 6-3: POPULATION ESTIMATES AND PROJECTED CHANGE FROM 2010 TO 2035 IN SOMERVILLE, MA
Year 2010 2035
Total 75,754 88,045
Seven census tracts are located within one-quarter mile of the McGrath Highway. The 2010 Census provided information on median age, median household income, and percent of population of high school graduates, families below poverty level, and unemployment. This information is provided in Table 6-4.
49

HEALTH IMPACT ASSESSMENT OF THE MASSACHUSETTS DEPARTMENT OF TRANSPORTATION (MassDOT) GROUNDING McGRATH STUDY
TABLE 6-4: SELECTED DEMOGRAPHIC AND SOCIOECONOMIC CHARACTERISTICS
Census Tracts
Population 2010
Median Age
Median household
income (dollars)
Percent of high school
graduate (includes
equivalency) or higher
Percent families
with income below
poverty level
Percent unemploymen
t rate, ages 16+
350103 1210 36.6 67,500 87.5% 24.8% 17.0%
350104 7275 31.8 47,231 79.4% 22.7% 6.4%
350200 6567 33.6 59,978 91.7% 5.5% 5.2%
351300 4233 36.2 56,658 91.0% 4.1% 13.4%
351403 4028 33.1 35,453 92.2% 13.2% 3.9%
351404 4289 33.2 40,783 75.5% 16.3% 5.2%
351500 2310 34.5 39,343 66.8% 18.1% 3.5%
Somerville 75,754 31.4 61,731 88.8% 14.7% 6.3%
State 6,547,629 39.1 64,509 88.7% 10.5% 7.4%
Table 6-5 presents the percent of the Somerville population under 5 years of age, less than 18 years of age, and 65 years of age and older.
TABLE 6-5: AGE OF SOMERVILLE POPULATION
Area Persons under 5 Years
Persons under 18 years
Persons 65 years and over
350103 6.70% 14.90% 14.50%
350104 6.60% 22.30% 8.10%
350200 5.10% 14.90% 9.20%
351300 5.10% 12.00% 13.20%
351403 5.80% 16.40% 9.70%
351404 6.00% 17.90% 8.40%
351500 4.80% 12.90% 13.70%
Somerville 4.60% 12.10% 9.10%
50

HEALTH IMPACT ASSESSMENT OF THE MASSACHUSETTS DEPARTMENT OF TRANSPORTATION (MassDOT) GROUNDING McGRATH STUDY
Area Persons under 5 Years
Persons under 18 years
Persons 65 years and over
State 5.60% 21.70% 13.80%
51

HEALTH IMPACT ASSESSMENT OF THE MASSACHUSETTS DEPARTMENT OF TRANSPORTATION (MassDOT) GROUNDING McGRATH STUDY
Table 6-6 presents the percentage of population by race and ethnicity.
TABLE 6-6: RACE AND ETHNICITY OF THE SOMERVILLE RESIDENTS
Race and Ethnicity Percentage
Caucasian 73.92%
African American 6.81%
American Indian and Alaskan Native 0.26%
Asian 8.72%
Pacific Islander 0.04%
Other* 10.25%
Latino or Hispanic 10.58%
*Classified as “some other race” and “two or more races”
Table 6-5 and Table 6-6 present additional socioeconomic factors for Somerville reported in the 2010 Census. There is a 12% higher rate of Somerville residents who were foreign-born or have a language other than English spoken at home compared to the state as a whole. There is a 43% higher rate of multiple housing structures compared to the state as a whole.
TABLE 6-7: SELECTED SOCIOECONOMIC FACTORS
2006-2010 Somerville State
Foreign-born persons 26.80% 14.50%
Language other than English spoken at home, percentage age 5+
32.60% 21.00%
52

HEALTH IMPACT ASSESSMENT OF THE MASSACHUSETTS DEPARTMENT OF TRANSPORTATION (MassDOT) GROUNDING McGRATH STUDY
TABLE 6-8: SELECTED HOUSING CHARACTERISTICS AND POPULATION DENSITY
Somerville State
Homeownership rate 33.40% 64.00%
Housing units in multi-unit structures 85.10% 41.70%
Median value of owner-occupied housing units $453,800 $352,300
Households 31,918 2,512,552
Persons per household 2.26 2.48
Persons per square mile (2010) 18,404.80 839.4
Based on data provided by the City of Somerville, there are approximately 18 special needs and five public housing facilities, as well as several public schools located within one-half mile of the McGrath Highway.
Another important socioeconomic factor is employment (See Table 6-9). The CTPS Travel Demand Model also projects a significant increase in employment opportunities in 2035 future scenario.
TABLE 6-9: FUTURE EMPLOYMENT PROJECTIONS IN SOMVERVILLE FROM 2010 TO 2035
Year Total Base Retail Service
2010 20,435 4,684 4,276 11,475
2035 35,564 6,951 7,294 21,320
6.2.2. Environmental Justice Populations in Somerville, MA
Figure 6-Q (page 78) shows census tracts in Somerville meeting one or more of the EEOEA Environmental Justice criteria. The census tracts include:
350104 350200
350300 351204
351300 351403 351404 351500
53

Three of the Environmental Justice census tracts cover the immediate McGrath Highway study area (351300, 351404, and 351500). Census tracts 351404 and 351500 meet all four criteria.
6.2.3. Baseline Health Data
6.2.3.1. HOSPITALIZATION DATA
Table 6-10 presents 2010 rates of hospitalization for primary diagnoses of asthma, myocardial infarction, congestive heart failure, stroke, hypertension, and diabetes for Massachusetts, the city of Somerville, and the four-zip-code area that surrounds the McGrath Highway. (As noted above, a portion of the zip code area includes Cambridge.) Rates are age-standardized to the age distribution of the state of Massachusetts based on data from the 2010 US Census. For asthma hospitalizations, rates of both inpatient stays and emergency department (ED) visits are presented. Inpatient hospitalizations for asthma can primarily be thought of as the subset of asthma ED visits that resulted in an overnight admission since the large majority of hospital admissions for asthma originated in the ED and are included in the ED rate, as well. The rates of both inpatient and ED asthma hospitalizations among residents of the four-zip-code area under study were slightly lower than those of Massachusetts as a whole. Rates of myocardial infarction, stroke, and diabetes hospitalizations were also somewhat lower for the four-zip-code study area compared to Massachusetts. Congestive heart failure and hypertension hospitalizations are similar in the study area compared to the state.
TABLE 6-10: INPATIENT HOSPITALIZATIONS AND EMERGENCY ROOM VISITS IN MA, SOMERVILLE, AND ZIP CODES ABUTTING MCGRATH HIGHWAY (2010)
RegionINPATIENT HOSPITALIZATIONSa
EMERGENCY DEPARTMENT
VISITSd
Asthma Myocardial Infarctionc
Congestive Heart
Failurec
Strokec Hypertensionc Diabetesc Asthma
Massachusetts
(cases/100,000) 155 358 594 292 121 175 670
Somerville, city
(cases/100,000)b 123 335 686 234 169 179 567
4-ZIP code area (cases/100,000)b 128 293 608 216 138 159 602
aRates are for primary diagnoses of hospitalizations with an admission date in 2010 for patients with a residential address in MA, Somerville, or select zip codes (02141, 02142, 02143, 02145) within the study area. Base population figures for rate calculations came from the 2010 US Census; for zip code areas, US Census data for matching zip code tabulation areas (ZCTA) was used.bAge-standardized rates were calculated using 2010 US Census data and were adjusted to the 2010 age distribution of MA in 10 age groups (yrs): 0-4, 5-9, 10-14, 15-24, 25-34, 35-44, 45-54, 55-64, 65-74, 75+.cCrude and standardized rates of myocardial infarction, congestive heart failure, stroke, and hypertension are restricted to ages 35 and above; rates of diabetes are restricted to ages 15.dIncludes outpatient observation stays and inpatient hospitalizations that originated in the ED.
6.2.3.2. LOW BIRTH WEIGHT
54
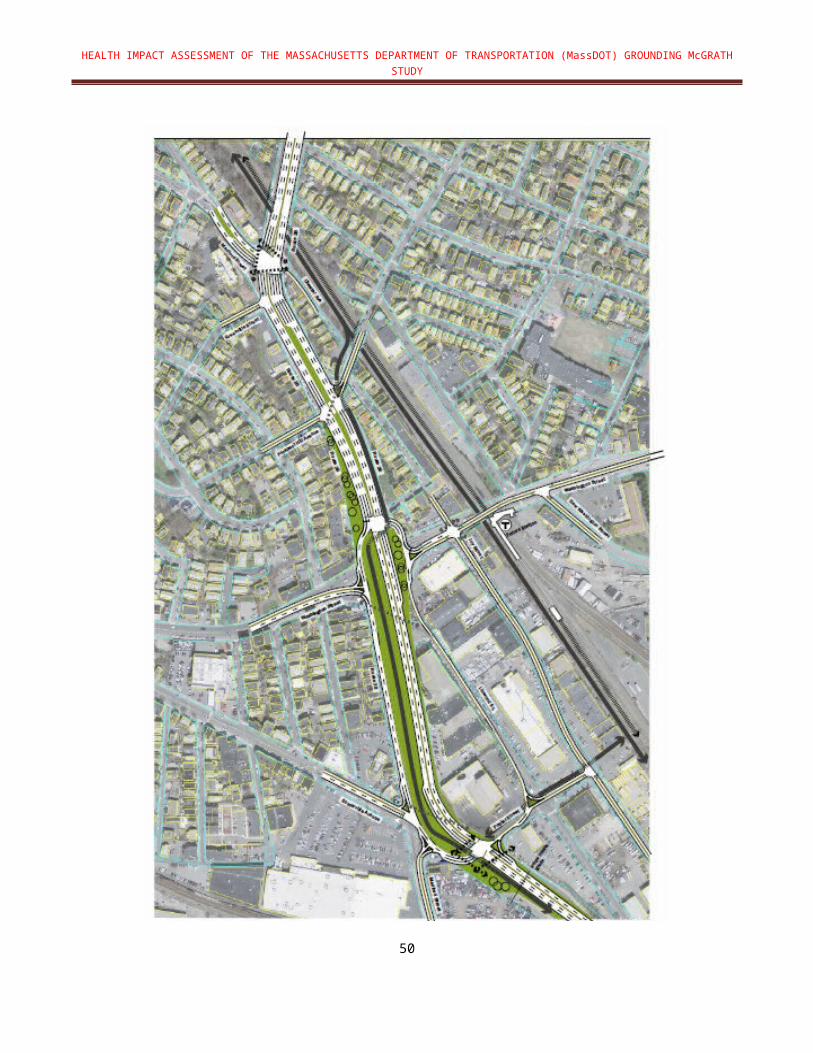
Based on information from the Massachusetts Standard Certificate of Live Birth, which is filed with the Registry of Vital Records and Statistics, MDPH calculated birth weight statistics for births to residents of the 7-census tract area surrounding the McGrath Highway study area as well as births to all Massachusetts residents (Table 6-11). In 2007, the area surrounding McGrath Highway had a marginally smaller percentage of low birth weight babies (7.4%), but a slightly higher percentage of very low birth weight babies (1.9%) compared to the state as a whole.
TABLE 6-11: BIRTH CHARACTERISTICS FOR SELECT CENSUS TRACTS IN SOMERVILLE, MA (2007)
Low Birth Weight(<2500 g)
Very Low Birth Weight(<1500 g)
McGrath Highway Areaa 7.4% 1.9%
Massachusetts 7.9% 1.4%aIncludes the following census tracts: 350103, 350104, 350200, 351300, 351403, 351404, 351500.
6.2.3.3. PEDIATRIC ASTHMA
In addition to evaluating available hospital-based data, MDPH/BEH routinely conducts statewide pediatric asthma surveillance as reported by school nurses and/or administrative staff at public and private schools serving any of grades K-8. These pediatric asthma data were examined for the GM HIA study area. School-based asthma data have been shown to closely reflect doctor-diagnosed asthma, as demonstrated in a study carried out by MDPH/BEH in the Merrimack Valley region of the state which showed 96 percent agreement between the two sources. Data reported by school nurses includes the city or town of residence for each child with asthma, which also enables MDPH/BEH to estimate accurate pediatric asthma prevalence by city/town of residence.
Table 6-12 lists eleven Somerville schools and their 2008–2009 total enrollments, as well as the numbers of students reported to have asthma and the prevalence of asthma in each school. Prevalence data for pediatric asthma are not age-adjusted. Therefore, when comparing prevalence estimates across schools, it is important to note that some of the observed differences in prevalence estimates may partly be due to differences in age distributions at different schools. For the 2008–2009 school year, no school had an asthma prevalence that was statistically significantly higher than the community of Somerville as a whole and one school, John F. Kennedy Elementary, had an asthma prevalence rate that was statistically significantly lower than that of Somerville as a whole. Compared to the state of Massachusetts, the prevalence of pediatric asthma was statistically significantly lower in Somerville as a whole. The prevalence of pediatric asthma was also lower in each of the individual schools compared to the statewide rate, though not all differences were statistically significant.TABLE 6-12: PEDIATRIC ASTHMA RATES FOR K-8TH GRADE STUDENTS IN SOMERVILLE, MA (2008–2009)
55

School Name Grades Served
Total Asthma Count
Total Enrollment
Prevalence %
Confidence Interval
Low High
Capuano Early Childhood Center PreK-K 16 172 9.3 5.0 13.6
Benjamin G. Brown K-6 20 255 7.8 4.5 11.1
Arthur D. Healey K-8 47 562 8.4 6.1 10.7
John F. Kennedy Elementary PreK-8 17 460 3.7 2.0 5.4
Albert F. Argenziano School at Lincoln Park K-8 34 497 6.8 4.6 9.1
East Somerville Community 1-8 36 546 6.6 4.5 8.7
West Somerville Neighborhood PreK-8 20 323 6.2 3.6 8.8
Winter Hill Community K-8 20 427 4.7 2.7 6.7
Next Wave Junior High 6-8 NR 20 NR NR NR
St. Catherine of Genoa Elementary K-8 20 200 10.0 5.8 14.2
Tufts Educational Day Care Center PreK-K NR 14 NR NR NR
SOMERVILLE 286 3,849 7.4 6.6 8.3
STATEWIDE MA 77,353 696,456 11.1 11.0 11.2
*NR=Not Reported. Due to small numbers, these data are suppressed to protect confidentiality.
6.2.3.4. OBESITY, OVERWEIGHT, AND DEPRESSION IN SOMERVILLE CHILDREN
Data were available for school years 2009–2011 for Somerville students in grades 1, 4, 7, and 10 on rates of obesity and overweight children. For Somerville as a whole, 43.6% of children were overweight or obese. This compares to 32.4% statewide for the same year (MDPH 2012).
The BCHAP School Health Services had some information on depression rates in students in Somerville. The data indicated that approximately 8 in 1,000 Somerville students reported depression versus the state rate of 11.6 per 1,000 students. The fact that significantly more Somerville children are currently obese compared to the statewide average indicates that alternatives that promote healthy behaviors are paramount. Since underlying obesity rates vary greatly by race/ethnicity and economic status among the general public, it is important that the alternatives consider the fact that rates of obesity will change within a community to reflect demographic shifts.
6.2.3.5. BRFSS
Using data from the Behavioral Risk Factor Surveillance System (BRFSS), a national telephone survey conducted each year by CDC, the MDPH Bureau of Health Information Research Statistics and Evaluation estimated the prevalence of obesity, Type II diabetes,
56

hypertension, and associated risk factors for Middlesex County residents in 2009 (Middlesex County includes the City of Somerville). As presented in Table 6-11, it is estimated that 20% of Middlesex County adults were obese in 2009, 22% reported ever having hypertension, and 7.5% reported ever having diabetes. With respect to healthy behaviors in 2009, 16% of Middlesex County adults reported no daily physical activity, but 27% reported eating fruit or vegetables at least five times per day.
TABLE 6-13: ESTIMATED PREVALENCE OF ADULT OBESITY, HYPERTENSION, TYPE II DIABETES, EXERCISE, AND FRUIT/VEGETABLE INTAKE IN SOMERVILLE, MA (2009)
Adult Obesity
Adult Ever Hypertension
Adult Ever Diabetes
Adult No Exercise
Adult Five-A-Day
Middlesex County, MA 20.4% 22.4% 7.5% 16.4% 27.2%
State 21.8% 25.7% 7.9% 20.9% 26.2%Source: MDPH
6.2.3.6. LUNG AND BRONCHIS CANCER INCIDENCE
In response to public comments, MDPH/BEH’s Community Assessment Program evaluated lung and bronchus cancer incidence data for the city of Somerville as a whole and for the five census tracts (CTs) comprising the study area for the GM HIA. The findings of the evaluation are presented in Appendix A. In summary, the incidence of lung and bronchus cancer in Somerville females during 2004–2008 is about as expected based on a comparison to statewide rates. For males, the incidence is statistically significantly elevated during this time period city-wide and in the combined five census tracts comprising the MassDOT GM Study area. The distribution of cases in the study area does not seem to follow any unusual pattern with respect to McGrath Highway. A higher percentage of current and former smokers were found in Somerville residents with lung and bronchus cancer compared to data for the state of Massachusetts as a whole.
6.2.3.7. INJURIES ASSOCIATED WITH VEHICLE ACCIDENTS IN STUDY AREA
MassDOT indicates that in 2010, 170 motor vehicle accidents occurred in this area, with 24 injuries and one fatality. According to the MassDOT GM Study, approximately 17% of crashes from 2006-2008 in the study area involved pedestrians or bicyclists.
6.3. Assessment of Health Determinants
6.3.1. Air Quality
6.3.1.1. AIR QUALITY IMPACTS BASED ON TRAFFIC DENSITY
Available data from the CTPS Travel Demand Model on predicted traffic density during peak periods were evaluated as a surrogate for exposure to traffic-related air pollutant emissions for 2010 existing conditions, 2035 No-Build, and the four alternatives. Specifically, MDPH/BEH
57

used ArcGIS Inverse Distance Weighting to create traffic density contours based on the 3-hour morning peak periods by Transportation Analysis Zones (TAZs) expressed as (VMT)/km2 provided by the CTPS Travel Demand Model. Predicted traffic density along Interstate 93 was excluded from the traffic density analysis in order to isolate differences in the vicinity of McGrath Highway.
As shown in Figure 6-R (page 79), locations with higher predicted traffic density are consistently located in the area southwest of the McGrath Highway, representing higher traffic during peak periods near Union Square in Somerville. Another consistently high traffic density area with steep gradient is shown in the area where Route 28 intersects other major roadways (e.g., Route 16 in Medford). Small differences in predicted traffic density can be seen in the vicinity of Route 28/McGrath Highway from 2010 existing conditions to future years. Although little to no difference in predicted traffic density is apparent among the four future alternatives, predicted traffic density appears highest under the future year 2035 No-Build scenario. Thus, based on a review of predicted traffic density in the vicinity of the McGrath Highway during peak periods, the future year 2035 No-Build scenario is expected to have a higher air pollution impact than would all four alternatives. No discernible difference between the four alternatives is apparent.
6.3.1.2. PREDICTING AIR POLLUTANT CONCENTRATIONS USING AIR DISPERSION MODELING
Ambient Air Pollution
As described previously, air dispersion modeling was used to predict concentrations of NOx and PM2.5 in the vicinity of McGrath Highway. Modeling was conducted for the highest morning 1-hour peak period for the 2010 existing conditions and 2035 No-Build and the four alternatives. The modeling predicts concentrations of NOx and PM2.5 resulting from emissions of vehicles traveling on McGrath Highway as well as roadways in the immediate vicinity. Air pollution impacts due to other major roadways, such as Interstate 93, were not considered, in order to be able to isolate the effects of McGrath Highway currently and in future alternative scenarios. The GM Study did not evaluate factors that may mitigate emissions, including improved signalization to decrease congestion and associated idling, so these factors could not be considered in the analysis. Figure 6-S (page 80) shows the results of air quality dispersion modeling for NOx in the study area for 2010 existing conditions, and 2035 No-Build, and the four alternatives. Under all scenarios, predicted concentrations of NOx appear to be highest along McGrath Highway, and intersecting major streets such as Washington Street, Medford Street, and Somerville Avenue. Predicted NOx concentrations are significantly greater in the 2010 existing conditions. While modest increases in traffic volume are projected in the future, predicted air concentrations of NOx are much lower under the 2035 No-Build and all four alternatives due to lower vehicle emissions anticipated with improved technology. Small differences were observed, however, between the future 2035 No-Build and the four alternatives, with the Hybrid/U-Turn Rotary alternative appearing to show the lowest predicted NOx impacts. It is important to note that in all scenarios, predicted NOx concentrations drop rapidly with distance from roadways.
Similar to the map of predicted NOx concentrations, modeled concentrations for PM2.5 are highest under 2010 existing conditions (Figure 6-T, page 81, for PM2.5 concentrations). Under
58
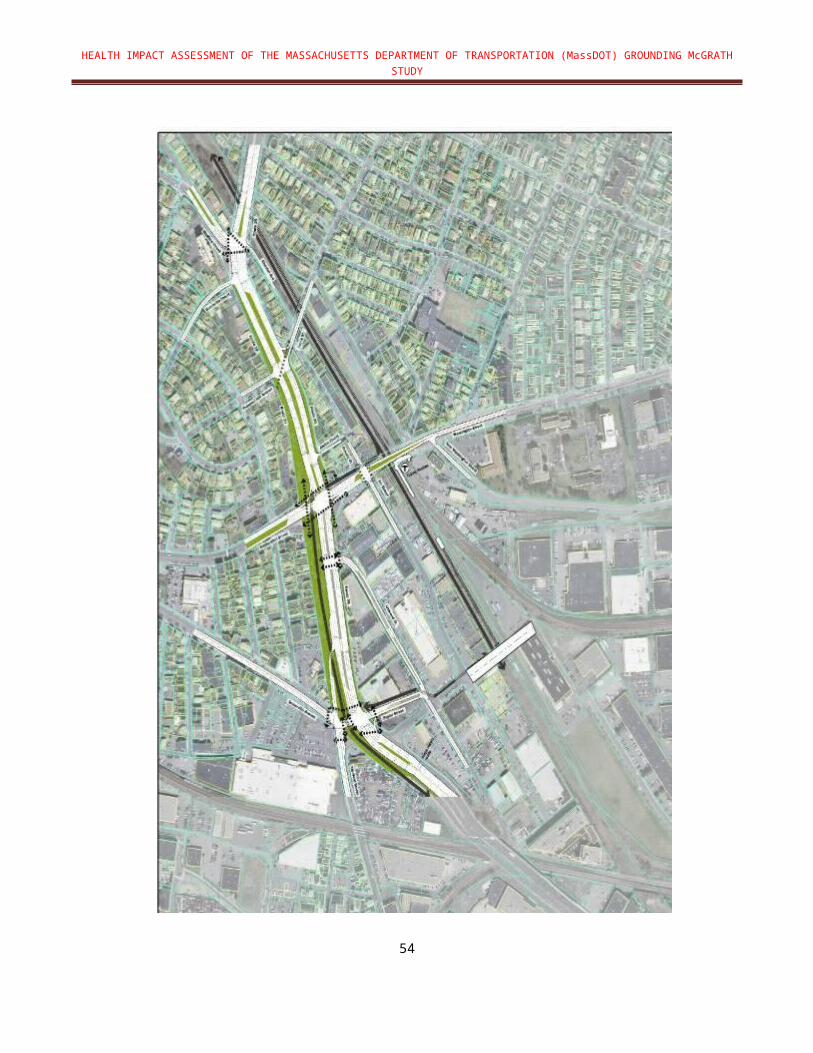
all scenarios, the highest predicted air concentrations are located at intersections with high volumes on the cross streets, such as McGrath Highway and Broadway. Small differences are observed for future years (2035 No-Build and the four alternatives. Again, as with NOx concentrations, the least PM2.5 impacts are predicted for the Hybrid U-Turn/Rotary alternative. In all situations, predicted PM2.5 concentrations appear to drop rapidly with distance from the roadways.
For illustrative purposes, Figure 6-U (page 82) provides two sets of maps showing modeled NOx and PM2.5 concentrations predicted from air dispersion modeling together with maps of predicted traffic density based on vehicle miles traveled per square kilometer, for the 2010 existing conditions and for one of the future alternatives (Access Road). Although traffic density data were not available for the entire aerial extent covered by the modeled air pollution maps, areas with higher predicted traffic density are similar to areas showing higher NOx and PM2.5 impacts. Thus, based on this example, it seems feasible that traffic density maps may be used as a screening tool to identify areas that may be more impacted by air pollution for purposes of conducting a transportation-related HIA.
Spatial Evaluation of Predicted Air Pollution Concentrations along McGrath Highway
Near-roadway air quality impacts
In order to evaluate potential near-roadway exposures, air dispersion modeling results (presented in section 6.3.1.1) of both 1-hour peak NOx and PM2.5 concentrations were evaluated at major intersections and locations 200 meters east and west from each intersection along the McGrath Highway for the 2010 existing conditions, No-Build 2035, and the four alternatives. There are approximately 1,600 households within the 200-meter buffer along McGrath Highway Study area. In addition, spatial evaluation of air dispersion concentrations proposed in the 2035 No-Build case and four alternatives were also evaluated. In considering potential exposures and health effects associated with the proposed bike path, sidewalk, and community path it is important to note the likelihood of increased exposure due to elevated inhalation rates of those utilizing the paths. According to the EPA’s Exposure Factors Handbook (U.S. EPA, 2011), the inhalation rate of an average person performing high intensity exercise is four times greater than during light intensity exercise. Exposure to those
biking or running along the proposed paths is predicted to be considerably higher than exposure associated with less intensive activity (e.g., walking).
With respect to pollutant exposure on and near McGrath Highway, the comparison of overall air pollution concentration data (see Table 6-14) indicates the following:
For NOx, 2010 existing conditions, the overall average concentrations at intersections along McGrath Highway are about three times higher than the concentrations 200 meters east and west of the highway. The concentration for 2035 No-Build and alternatives are more than 80% lower than concentrations associated with 2010 existing conditions, reflecting significant improvements in motor vehicle emission control technology over the next decade.
59

Predicted air pollutant concentrations for NOx at 200 meters east and west of the McGrath Highway for the 2035 No-Build and alternatives are about 50% less than concentrations at intersections.
The PM2.5 air modeling concentrations for the 2035 No-Build and alternatives were 30% less than concentrations for the 2010 existing conditions; however, the reduction in concentrations at 200 meters east and west of the highway are similar to those predicted for NOx.
The average predicted concentrations of NOx and PM2.5 along the sidewalks, bike path, and community path show little variability between the four alternative designs. The predicted NOx concentrations range from 30-33 µg/m3 for the bike path, 23-30 µg/m3 for the sidewalk. Relatively lower concentrations (17-20 µg/m3) are predicted along the community path, which is located about one-quarter mile from the sidewalks and bike paths that abut the McGrath Highway. The predicted PM2.5 concentrations range from 5.6-6.4 µg/m3 for the bike path, 3.2-3.6 µg/m3 for the sidewalk, and 4.2-5.7 µg/m3 for the community path.
The concentrations predicted for each of the scenarios are best estimates that the model can produce for comparative purposes. The values are similar across alternatives because motor vehicle emissions do not vary across alternatives and the same modeling parameters (e.g., meteorological data) were used in each run.
60
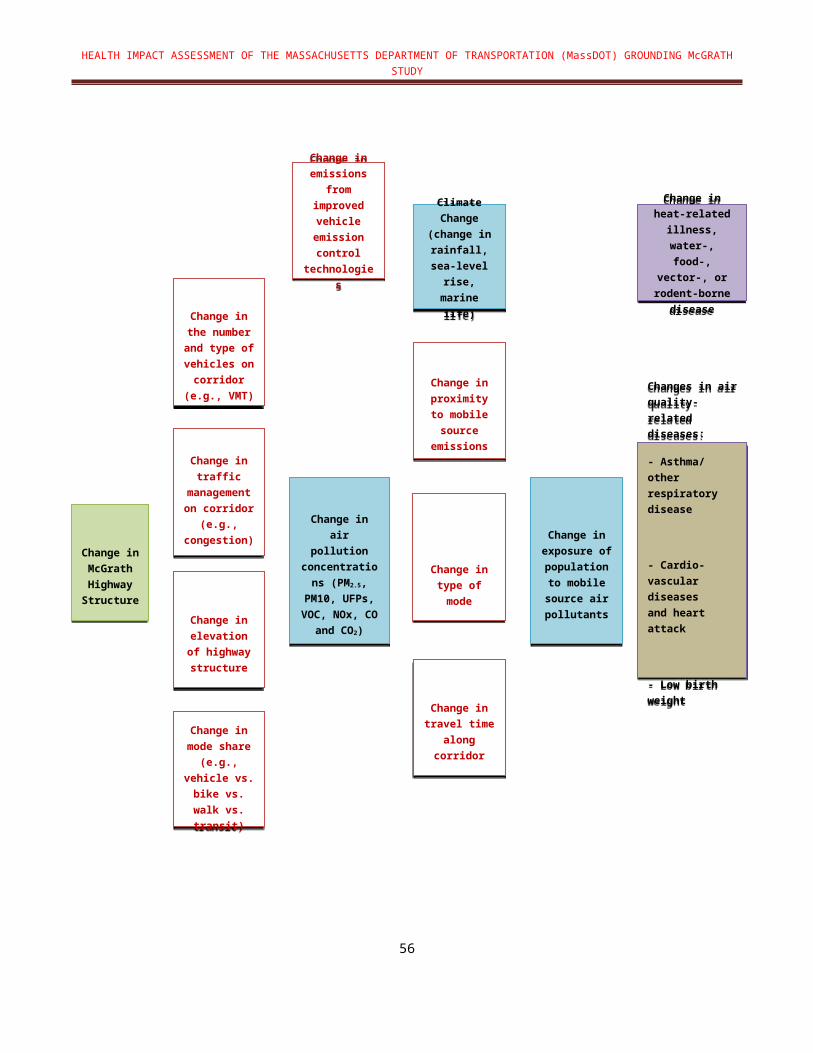
TABLE 6-14: NOx AND PM2.5 CONCENTRATIONS AT MCGRATH HIGHWAY INTERSECTIONS
2010 Existing
ConditionsNo-Build Boulevard Access
RoadU-Turn/Rotary
Boulevard/Inner Belt
NOx Concentrations (1-hour peak µg/m3)
Average Intersection 306.1 50.6 44.2 44.6 44.1 43.1
Average 200M West 138.4 22.9 19.8 20.1 18.9 19.7
Average 200M East 110.7 18.7 17.9 17.0 17.8 17.0
PM2.5 Concentrations (1-hour peak µg/m3)
Average Intersection 11.5 7.9 6.6 6.8 6.8 6.4
Average 200M West 5.2 3.6 3.0 3.0 2.9 3.0
Average 200M East 3.9 2.8 2.6 2.5 2.6 2.5
Review of traffic density and air quality dispersion modeling results indicate that traffic density information can be a feasible source of information to screen possible impacts of changes in traffic on air quality as a result of transportation projects. Available information indicates that air quality conditions will be improved under any 2035 scenario versus 2010 existing conditions, suggesting that health outcomes associated with poor air quality will also improve. Although air quality does not appear to be very different under any of the future alternatives, the Hybrid U-Turn/Rotary Alternative indicates a greater improvement than the other alternatives or No-Build, and thus, may result in the greatest health benefit (e.g., lower respiratory disease outcome/impact). It would also be important to note that by de-elevating the highway and increasing near-roadway walking and biking, exercising individuals would be expected to be exposed to more air pollution than non-exercising individuals, and hence, mitigation steps should be taken to consider reducing opportunities for future exposures to exercising individuals along the new sidewalks and bike path.
Greenhouse Gases
As part of the air quality assessment, CO2 emissions for the 2010 existing conditions, 2035 No-Build, and the four alternatives were evaluated. CO2 emissions are an important consideration with respect to climate variability with possible changes in temperature, sea level, and rainfall. Potential health-related impacts include heat-related illness, and water-borne, food-borne, vector-borne illnesses.
The CO2 emissions were provided by the CTPS Travel Demand Model. Results showed that CO2 emissions under 2010 existing conditions were lower than future conditions (e.g., 2035
61

No-Build 24,011 kg vs. 22,775 kg in 2010 existing conditions). Overall CO2 emissions in future scenarios are not expected to significantly decrease.
6.3.2. Noise
MDPH/BEH conducted a screening analysis to determine the spatial extent of traffic noise in the study area under 2010 existing conditions, 2035 No-Build and alternative designs using the Federal Highway Administration (FHWA) Traffic Noise Model (TNM) Version 2.51. Traffic noise was modeled using 1-hour peak traffic volumes at a location that is predicted by the CTPS Travel Demand Model to have the peak traffic volumes. The modeling domain included a residential area location from Medford Street to Washington Street along the McGrath Highway.
The model considered the effects of the elevated structure and the effects of increased speed across alternatives. Assuming the same traffic volume, the model predicted that noise levels associated with a de-elevated structure are about 2 dB(A) higher compared to noise levels from the elevated structure up to a distance of 450 feet. There were no significant changes in noise levels across the alternative designs.
MDPH/BEH mapped the location of modeled hourly noise levels that exceed the Federal Highway Administration (FHWA) hourly traffic noise guideline of 57 dB(A). Table 6-15 below demonstrates that there is little expected difference in traffic noise levels among the four alternatives. The highest levels of noise (72 dB(A) are expected to occur at distances of 100 feet or less from the highway.
Modeling of noise for the 2035 No-Build and alternatives indicates that de-elevation of the highway would result in small noise increases, with declining levels as distance from the highway increases. Noise differences between existing versus future alternatives appear to be small (about 2 dB(A) or less), but noise levels remain slightly higher than current recommended federal guidelines for all future alternatives closer to the highway. As a result, we would not expect a notable difference with respect to health outcomes associated with noise, such as fatigue associated with sleep disturbance, mental health aspects (e.g., annoyance), or effects on educational learning when considering 2010 existing conditions, 2035 No-Build, or any of the alternatives.
1 Predictive noise modeling with TNM is required for highway projects receiving federal funds on or after May 2, 2005.
62

TABLE 6-15: NOISE LEVELS (LAEQ1H) ASSOCIATED WITH PEAK 1-HOUR MORNING TRAFFIC VOLUME FOR 2010 EXISTING CONDITIONS, 2035 NO-BUILD, AND THE ALTERNATIVES
2010Existing
Conditions
2035No-
Build Boulevard Access
Road U-Turn/Rotary
Boulevard/Inner Belt
AM or PM Peak Hour AM PM AM AM AM AM AM
Elevated or at Grade Elevated Elevated Elevated Not
ElevatedNot
ElevatedNot
ElevatedNot
ElevatedSpeed (mph) 35 45 35 35 35 35 35
Distance (feet)
50 69.2 68.2 69.6 73.1 73.1 73.5 73.2
100 66.7 67.3 67.1 68.8 68.9 69.2 68.9
150 65.0 65.7 65.4 66.7 66.7 67.0 66.7
200 63.9 64.9 64.3 65.1 65.1 65.5 65.2
250 63.0 64.0 63.4 63.8 63.8 64.2 63.9
300 62.2 63.2 62.6 62.8 62.7 63.1 62.9
350 61.5 62.5 61.9 61.8 61.7 62.2 61.9
400 60.8 61.8 61.2 60.9 60.8 61.3 61.0
450 60.2 61.2 60.5 60.1 60.0 60.5 60.2
500 59.5 60.6 59.9 59.3 59.3 59.7 59.4
550 58.9 60.0 59.3 58.6 58.6 59.0 58.7
600 58.6 59.6 59.0 57.9 57.9 58.3 58.0
650 58.0 59.1 58.4 57.3 57.2 57.7 57.4
700 57.5 58.5 57.8 56.7 56.6 57.1 56.8
750 56.9 58.0 57.3 56.1 56.1 56.5 56.2
800 56.4 57.5 56.8 55.6 55.5 56.0 55.7
850 55.9 57.0 56.3 55.0 55.0 55.4 55.1
900 55.4 56.5 55.8 54.5 54.5 54.9 54.6
6.3.3. Mobility and Connectivity 63

6.3.3.1. ASSESSMENT OF WALKING AND BIKING CAPACITY
The Pedestrian Environmental Quality Index (PEQI) and Bicycle Environmental Quality Index (BEQI) tools were used to evaluate the capacity of 2010 existing conditions and alternative designs to encourage walking and biking in the McGrath Highway study area. These observational survey tools were developed by the San Francisco Department of Public Health (SFDPH). The PEQI and BEQI assess the quality of the physical pedestrian and bicycling environment using a formula for scoring each road and intersection based on their features.
The PEQI and BEQI features are grouped into five main categories known to affect people’s travel behaviors: intersection safety, traffic, street design, land use, and perceived safety. There are many features evaluated in the PEQI and BEQI including: traffic calming features (chicanes, medians, speed hump/bump), marked crosswalks, sidewalk impediments, driveway cuts, tree coverage, and pedestrian scale lighting. It should be noted that many of these factors are included as indicators in the MassDOT GM Study evaluation criteria. The study area for this assessment includes McGrath Highway and streets located approximately two blocks east and west of the highway. The total PEQI and BEQI score is created for each roadway, intersection, sidewalk, or path in the study area. The PEQI or BEQI score reflects the quality of the pedestrian/bicycling environment on a 0 to 100 scale. For both BEQI and PEQI the categories of scores developed by SFDPH are:
0-20 Environment not suitable to pedestrians/bicyclists 21-40 Poor pedestrian/bicyclist conditions exist 41-60 Basic pedestrian/bicyclist conditions exist 61-80 Reasonable pedestrian/bicyclist conditions exist, and 81-100 Ideal pedestrian/bicyclist conditions exist
The detailed designs of the alternatives have not been developed at this stage of the MassDOT GM Study and only general information is available (e.g., number of streets that will cross the highway at grade, proposed open space, roadway widths, and multimodal connections). As the study moves forward, additional analysis will be conducted on the alternative(s) selected including detailed analysis of specific design elements (e.g., pedestrian access in rotaries, if appropriate, use of traffic signalization to mitigate congestion, and crosswalk safety). For the purposes of the current conceptual design study of McGrath Highway, it is MDPH/BEH’s understanding that the future pedestrian and bicycling networks for each of the four alternatives will conform to Complete Streets guidelines, which require the incorporation of the highest quality design elements associated with land use patterns, network structure, safe and attractive sidewalks and bike lanes, and natural features (e.g., trees). The elements include roadway design based on multimodal level of service for pedestrians, bicyclists, transit and vehicles, green design elements that promote an environmentally sensitive, sustainable use of the public right-of-way, and improved traffic signalization. Thus, the PEQI and BEQI scores for each of the four alternative designs are assumed to fall within the highest category indicating ideal conditions for walking and biking.
PEQI Scores for 2010 Existing Condition and Alternatives
64

The PEQI score quantifies street and intersection factors empirically known to affect pedestrians’ travel behaviors. Factors include presence of sidewalk, width of sidewalk, public seating, public art, illegal graffiti and litter, empty spaces (vacant lots, abandoned lots, parking lots), pedestrian refuge islands, curb cuts at crossings, and pedestrian signals. Figure 6-V (page 83) presents the PEQI scores for streets and intersections in the study area according to 2010 existing conditions. The map also identified the locations of the future sidewalks and community path. Under 2010 existing conditions, the McGrath Highway receives a PEQI score between 0 and 40, which indicates that it is not suitable for pedestrians or that poor pedestrian conditions exist. The streets within a two-block area of the McGrath Highway score between 21 and 60, indicating poor to basic pedestrian conditions.
FIGURE 6-W (page 84) provides the aggregate PEQI scores for the future sidewalks and intersections proposed in the alternative designs. As shown, based on the information currently available, all four designs are anticipated to conform to Complete Streets guidelines and therefore all four alternatives fall within the highest PEQI category.
BEQI Scores of Existing Features
The BEQI provides scores for 22 empirically-based indicators, each of which has been shown to promote or discourage bicycle riding and connectivity to other modes of transport. Factors considered in BEQI are: left turn bike lane, no turn on red signal, presence of marked bike route, width of bike route, bike route adjacent to parallel parking, bike route adjacent to sidewalk/curb, connectivity of bike lane, presence of bike lane signs, bike parking, and dashed intersection bike lane.
Figure 6-X (page 85) presents the BEQI score for McGrath Highway and nearby streets under 2010 existing conditions and alternatives (Figure 6-Y; page 86). The McGrath Highway BEQI score is in the range of 0 and 20, indicating that it is not suitable for bicyclists. The streets located within the two-block area of the McGrath Highway fall within the range of 0 and 40. Thus, the quality of the streets in the study area ranges from being unsuitable for bicyclists to poor bicycling conditions.
All four alternative designs were scored based on the understanding that they feature a bike path along the eastern border of the McGrath Highway, and biking along the community path. As discussed above, it is MDPH/BEH’s understanding that the highest level of design will be incorporated into the bike path and community path to ensure safe bicycling conditions. Thus, under all four alternatives, the bike path and community path are given the highest scoring category in the BEQI.
6.3.3.2. POTENTIAL FOR INCREASED PHYSICAL ACTIVITY THROUGH SHIFTS IN TRAVEL MODE
The HIA evaluated the potential for increased physical activity through predicted shifts in travel mode (e.g., from auto to walking/biking) and increased connectivity to public transit and nearby areas (e.g., Union Square). The evaluation required the following data: (1) routes to assess mode shift (from auto to walk/bike) in 2010 existing conditions and 2035 No-Build and alternatives and (2) mode shift data from CTPS Travel Demand Model.
65

Two paths in the study area that were evaluated in the MassDOT GM Study were selected for assessing potential increase in physical activity: Washington Street from Maffa Way to Union Square and Medford Street, and McGrath Highway from School Street to Rufo Street (see Figure 6-Z; page 87).
Mode share for auto, transit, and walk/bike for Washington Street is based on mode shift data from aggregated TAZs for the Inner Belt/Brickbottom neighborhood. Medford Street is assigned mode share data from East Somerville. The CTPS Travel Demand Modeling data for the Inner Belt/Brickbottom area predicts that on a typical morning in 2035 about 31% of the people leaving the Inner Belt/Brickbottom neighborhood will choose to walk/bike whereas most of the people (74%) going to Inner Belt/Brickbottom neighborhood will be arriving by auto. During the evening commute, 19% of people are predicted to be leaving Inner Belt by walk/bike whereas 38% of the commuters are arriving to this neighborhood by walking/biking. In East Somerville, the number of people who walk/bike is similar to Inner Belt/Brickbottom except that 18% of the evening commuters to East Somerville are predicted to choose to walk/bike.
The potential for increased physical activity by shifting from auto to walk/bike along the two routes described above (i.e., along Washington Street and Medford Street) has been estimated using the following factors:
20 minute/mile brisk walking is associated with moderate intensity aerobic exercise (Warburton et al., 2006)
The physical inactivity index for Massachusetts is defined as less than 30 minutes of moderate physical activity most, if not all, days of the week (Chenoweth et al., 2006).
The evaluation of physical activity (Table 6-14) associated with mode shift from auto to walk/bike along two routes evaluated in the MassDOT GM Study indicates that the physical activity recommendation of 30 minutes of moderate exercise per day would be achieved.
TABLE 6-16: DATA USED TO EVALUATE SHIFT IN TRAVEL MODE
ROUTES Washington Street Medford Street and McGrath Highway
CTPS TDM mode shift data Boulevard/Inner Belt East Somerville
Length miles 1.1 1.3
Estimated minutes of walking along route based on 20 min/mile
22 minutes/2 times day =44 minutes
26 minutes/2 times day =52 minutes
Meets with physical activity recommendation of 30 min of moderate exercise
Yes Yes
Based on future plans to significantly enhance the walkability and bikeability of the McGrath Highway area, along with the planned Green Line Extension, we would expect significant improvements in health measures associated with increasing exercise, such as obesity, Type II diabetes, and cardiovascular disease outcomes. We would also expect improved mental health indicators with improved access to other regional destinations and associated activities.
66
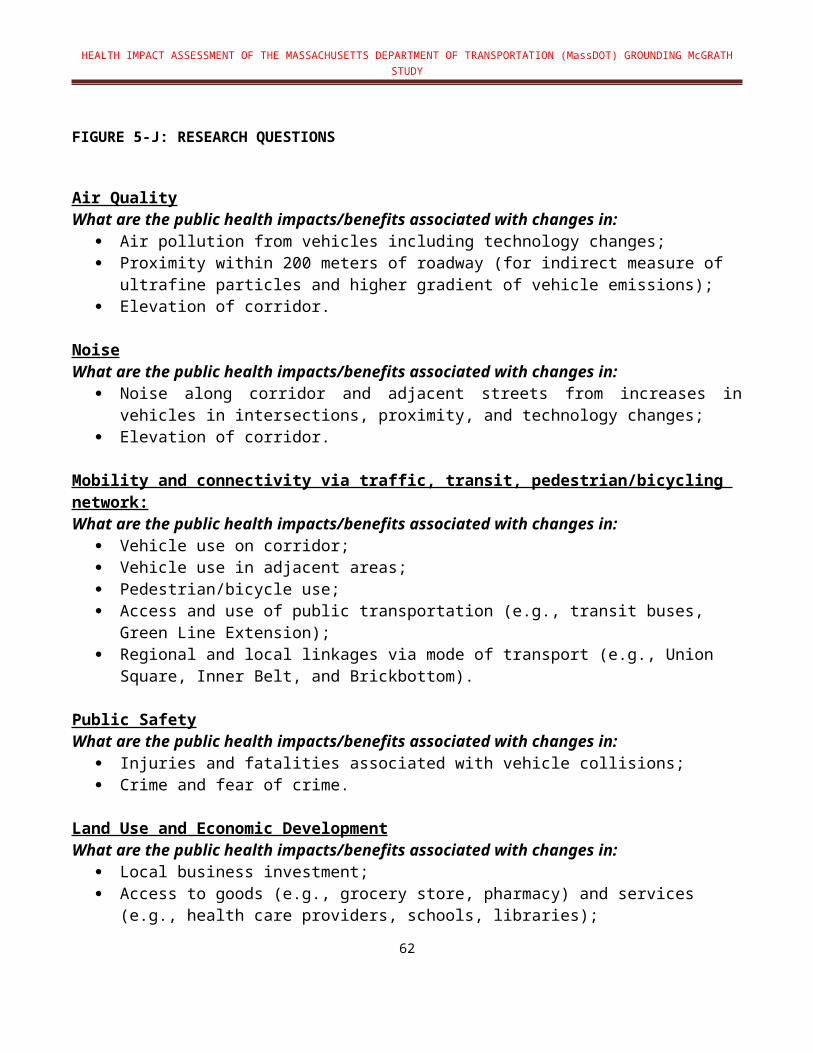
Review of available information suggests little difference between the four alternative designs in mobility and connectivity determinants, but all alternatives are more optimal than the 2035 No-Build.
6.3.3.3. VEHICLE DIVERSION FROM MCGRATH HIGHWAY TO ADJACENT NEIGHBORHOODS
The HIA evaluated the potential for an increase in traffic in adjacent neighborhoods from vehicle diversions predicted by CTPS modeling of alternative designs. Below is a table (Table 6-15) summarizing the volume change for the 2035 No-Build compared to the Boulevard Alternative for a peak 3-hour period during a weekday morning. Residents living on streets with the higher volume of diversionary traffic may experience higher impacts associated with increased emissions, noise, and congestion.
TABLE 6-17: VOLUME CHANGE FOR 2035 NO-BUILD COMPARED TO BOULEVARD ALTERNATIVE FOR A PEAK 3-HOUR PERIOD DURING A WEEKDAY MORNING
Street No Build Boulevard Change
Pearl St EB 28 145 +117
Medford St SB 1,362 1,558 +196
Medford St NB 578 805 +196
Cross St WB 94 420 +326
6.3.4. Public Safety
6.3.4.1. CURRENT CRASH RATES AND ACCIDENT STATISTICS
The Massachusetts fatality rate (0.58 fatalities per 100 million miles driven) is 53% of the national average of 1.10 (NHTSA, 2012). According to MassDOT, there were approximately 170 auto accidents along the McGrath corridor in 2010, 24 injuries associated with these crashes and one fatal crash. The accident data is a compilation of accident reports submitted to the Registry of Motor Vehicles (RMV) from local, state, and public transportation police departments as well as from residents. According to analysis reported in the MassDOT GM Study, intersections with Broadway, Washington, and Somerville Avenue/Poplar Street exceed average crash rates. In addition, approximately 17% of the reported crashes from 2006–2008 involved pedestrians or cyclists. The remaining study area intersections experienced crash rates below the statewide and regional averages, indicating no significant safety deficiencies at the study area intersections.
6.3.4.2. FUTURE INJURIES AND FATALITIES
Public safety is assessed by evaluating injuries and fatalities that are related to higher traffic volume. Traffic volume is quantified for a given area by vehicle miles traveled (VMT), VMT per capita, and travel volume. For the analysis of public safety conditions associated with 2010
67

existing conditions, 2035 No-Build, and alternative designs, VMT and travel time data from the CTPS Travel Demand Model were used to estimate conditions in the future.
As noted above, the average Massachusetts fatality rate is 0.58 fatalities per 100 million miles driven. According to US DOT, the US average injury rate is 75 injuries per 100 million miles driven. The table below (Table 6-16) summarizes predicted fatalities and injuries in the immediate McGrath Highway area for an annualized 3-hour morning peak period using US DOT fatality and injury rates for 2010 existing conditions, 2035 No-Build, and the four alternatives.
TABLE 6-18: VMT AND PREDICTED FATALITIES AND INJURIES ASSOCIATED WITH 2010 EXISTING CONDITIONS, 2035 NO-BUILD, AND ALTERNATIVES
AlternativeVMT-Peak Hour
VMT 3-Hour AM
RushAnnualized 3-Hour AM
Fatalities-0.58 per 100 Million Miles
Injuries-75 per 100
Million Miles
2010 Existing Conditions 16,366 40,915 12,274,500 0.07 9.21
2035 No-Build 18,526 46,315 13,894,500 0.08 10.42
Boulevard 16,868 42,170 12,651,000 0.07 9.49
Access Road 17,005 42,513 12,753,750 0.07 9.57
U-Turn/Rotary 16,977 42,443 12,732,750 0.07 9.55
Boulevard/Inner Belt 16,871 42,178 12,653,250 0.07 9.49
These data indicate that there will be an increase in traffic from 2010 existing conditions to 2035 due to population and economic growth. However, VMT is expected to be lower for all alternatives compared to 2035 No-Build. Based solely on average fatality and injury rates, small increases in fatalities and injuries could be expected given the increased access expected by pedestrians and bicyclists along the de-elevated roadway. However, other factors such as safer roadway design, lower speeds, Complete Street design factors, and a separate bicycle path, which have been considered in the alternative designs, would likely mitigate possible increases in fatalities and injuries.
6.3.4.3. SAFETY CONSIDERATIONS BASED UPON TRAVEL TIMES
McGrath Highway is an important regional link to Boston and area hospitals. Travel time during both average and congested conditions is an important consideration, particularly in regard to travel times for public safety vehicles.
The CTPS Travel Demand Model provided travel times during average conditions, as well as during congested conditions. Table 6-17 summarizes the average and congested travel times along a southbound section of McGrath Highway in the study area for existing, 2035 No-Build, and the four alternatives. It should be noted that these data do not include delays at
68

intersections because the data were not available from the MassDOT GM Study. The travel time for public safety vehicles for all alternatives could result in delay of more than one minute over 2010 existing conditions on the McGrath Highway.
TABLE 6-19: TRAVEL TIME ALONG MCGRATH HIGHWAY FOR 2010 EXISTING CONDITIONS, 2035 NO-BUILD, AND EACH ALTERNATIVE
Average Travel Time Congested Travel Time Distance (miles)
2010 Existing Conditions 3.06 4.47 1.66
2035 No-Build 3.09 4.91 1.66
Boulevard 4.39 5.65 1.65
Access Road 4.23 5.56 1.65
U-Turn/Rotary
4.23 5.49 1.65
Boulevard/Inner Belt 4.39 5.58 1.65
Review of available data suggests that future alternatives would not have a significant impact on injuries or fatalities associated with accidents in the McGrath Highway area; however, given the increased access by pedestrians and bicyclists, additional analysis is needed to better understand these potential impacts. It would be important to consider this information for possible mitigation strategies in the alternative designs to address public safety issues. De-elevation might cause slight delays in public safety vehicles moving through the area, another factor to consider in final design considerations.
6.3.5. Land Use and Economic Development
6.3.5.1. ACCESS TO GOODS AND SERVICES
Due to limited data on land use and economic development associated with the alternative designs at this stage of MassDOT’s GM Study, the HIA assessed access to multiple goods and services and green space by determining the number of people living within one-half mile of goods and services in the study area and the potential increase in connectivity across McGrath Highway that may be associated with alternative design features.
A map of the location of goods and services in the study area is presented in Figure 6-AA (page 88). Of the total of 832 goods and services located throughout Somerville, approximately 101 are located within one-quarter mile of McGrath Highway. Figure 6-AA (page 88) illustrates the wide range of goods and services. Of the three neighborhoods within the one-quarter mile area in the HIA analysis (i.e., Union Square, Inner Belt/Brickbottom, and East Somerville) about 70% of existing goods and services are located in Union Square.
Figure 6-BB (page 86) shows the location of several “clusters” of goods and services within the one-quarter mile of HIA analysis area. The number of households within one-half mile of each
69
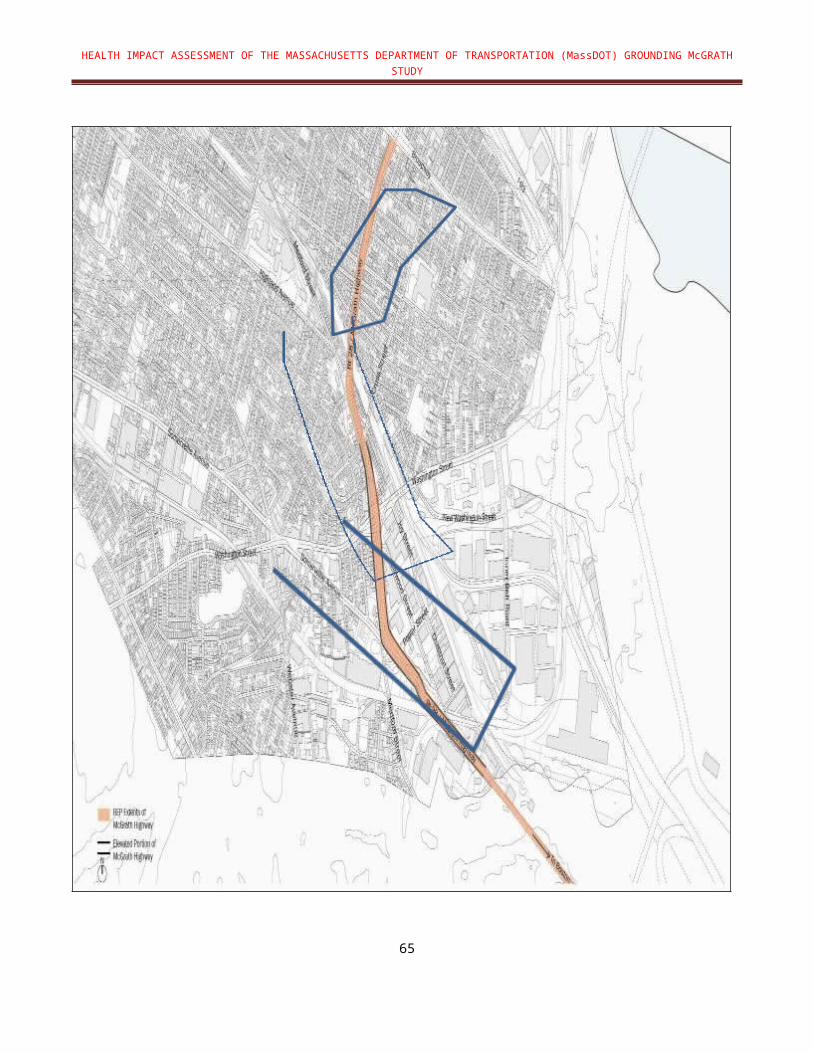
cluster is shown. Spatial analysis of the proximity of households to existing goods and services indicates that there are approximately 8,000 households within one-half mile of walking distance of more than 5 goods and services. The Union Square neighborhood has the greatest proximity to goods and services.
There are also currently a number of parks within the “access” study area Figure 6-AA (page 88). Access to goods and services and green space, including parks, from one side of McGrath Highway to the other is dependent upon ease of crossing, either by foot, bike, or motor vehicle. Currently access from one side of McGrath Highway to the other is poor due to limited crosswalks and few streets that cross from one side to the other. Table 6-18, extracted from MassDOT GM Study, summarizes some key features that illustrate how access will generally improve with all of the alternatives over 2010 existing conditions, with one or two alternatives providing better access than the others (i.e., Boulevard Alternative and Boulevard with Inner Belt Connection Alternative). Based on the available data (number of crosswalks and walks at grade), ease of crossing McGrath Highway either by foot, bike, or motor vehicle, particularly for those who live in East Somerville with fewer available goods and services, will be enhanced most by the Boulevard Alternative and Boulevard with Inner Belt Connection Alternative. In addition, given that this is an Environmental Justice area, consideration to promoting culturally appealing goods and services should be given.
Table 6-18 also shows average distance to open space. Approximately two acres of new green space will be added in this alternative. All four alternatives show significantly better access to green space compared to existing or 2035 No-Build conditions. Of the four alternatives, the Hybrid U-Turn/Rotary Alternative has the greatest distance to green space.
An evaluation of access to goods and services also needs to consider planned development of the Inner Belt/Brickbottom area, and that the MBTA Green Line Extension will be operational. There are approximately 14,000 households within a half-mile of the new transit stop. In addition, the community path will be extended east of McGrath Highway. When these three initiatives are completed and fully operational it will be even more important that the future McGrath Highway enhance mobility in and around the highway.
An example of improved access to goods and services is to evaluate the ability to walk to school by crossing McGrath Highway. Living near schools promotes increased physical activity (see Figure 6-M; page 87). McDonald (2008) reported that living within a half-mile of a school greatly increases the likelihood of walking or biking to that school across all racial groups. Various studies report the benefits of active commuting to school in that it can provide a substantial portion of children’s physical activity and has been associated with increasing levels of independence, social interaction, and communication (Tudor-Locke et al. 2002, Davison et al. 2008, Merom et al. 2006, Leyden 2003, and Poortinga 2006).
TABLE 6-20: KEY FEATURES AND ATTRIBUTES OF THE 2010 EXISTING CONDITIONS, 2035 NO-BUILD, AND THE FOUR ALTERNATIVES
70

2010Existing
Conditions
2035 No-
Build Boulevard Access
Road U-Turn/ Rotary
Boulevard/Inner Belt
Number of Crosswalks That Cross Corridor 7 7 9 6 7 9
Average Block Length 505 505 497 516 478 497
Count of Streets That Cross McGrath at Grade 4 4 6 4 4 6
Average Pedestrian McGrath Crossing Width 85 85 77 77 91 77
Average Distance to Open Space 965 965 156 162 323 156
Average Number of Travel or Turn Lanes in 2 Sections 4.0 4.0 6.0 6.5 7.0 6.0
50th Percentile Traffic Queue Length N/A 195.6 212.4 94.0 108.4 136.3
90th Percentile Traffic Queue Length N/A 261.7 270.9 158.9 161.4 182.1
Average of AM and PM Peak Period Speeds on Major Roads
N/A 19.5 17.9 18.0 18.0 18.0
Total AM VMT in the Study Area 16,366 18,526 16,868 17,005 16,977 16,871
Total NOx Emissions in Immediate Study Area (grams)
48,198 8,153 7,629 7,693 7,659 7,586
Total PM2.5 Emissions (grams) 1,125 583 531 536 535 531
The MassDOT GM Study and this HIA assume that future development of the area around the McGrath Highway, along with the operation of the Green Line Extension, will greatly increase the availability and accessibility of goods and services in the area. This, in turn, will likely increase employment rates presumably for local residents, as projected in the MassDOT GM Study. In addition, access to green space will increase. All of these improvements should result in better overall health, social cohesion, and mental health indicators, with a greater sense of connection to the neighborhood and its goods and services. While these efforts will likely have a significant benefit to this neighborhood, the potential for gentrification is high. For that reason, future plans should consider significant community involvement such that current residents might best benefit.
6.4. Overall Assessment
71
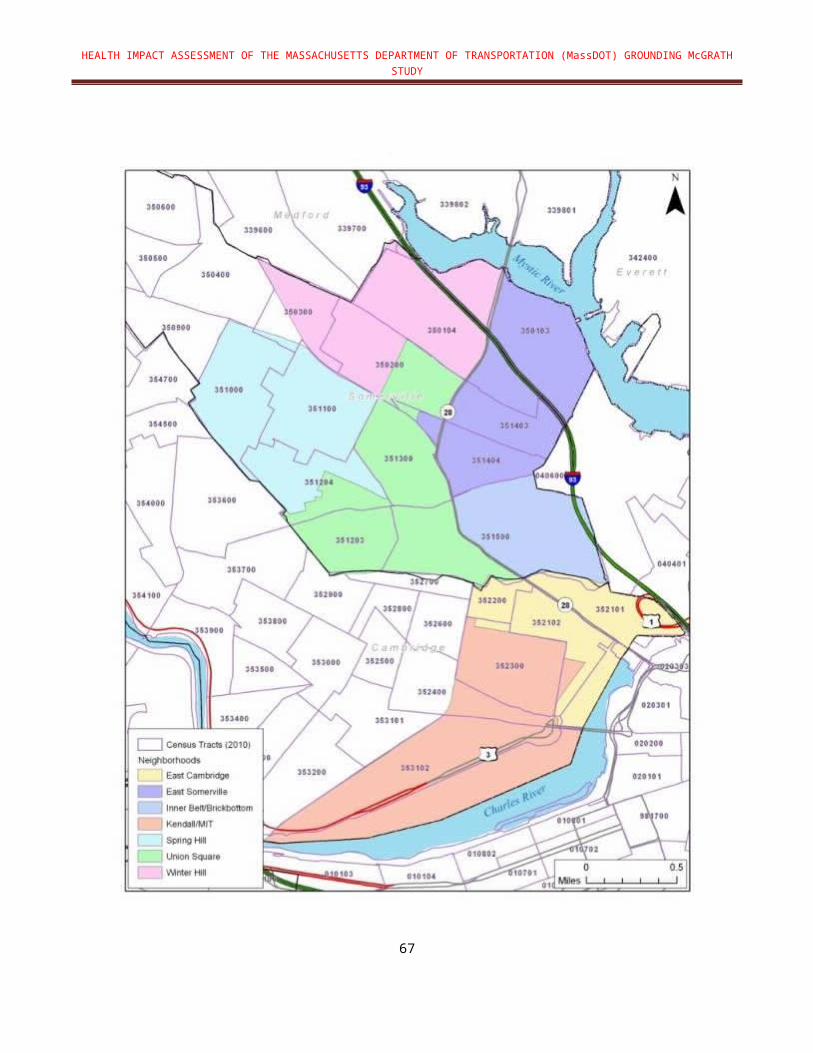
Table 6-21 to Table 6-25 summarize the overall impacts of the 2010 existing conditions, 2035 No-Build, and four alternatives for each health determinant. While four alternatives would likely result in improvements for all factors considered in the HIA, the Boulevard Alternative and Boulevard with Inner Belt Connection Alternative offer the greatest opportunities for mobility and access. The Hybrid/U-Turn Rotary Alternative appears most optimal in terms of air quality but is limited in terms of promoting active transportation and related health benefits. In reducing impacts and terms of health care costs, the benefits associated with each alternative should be considered.
The following provides a key describing the qualitative criteria to assess impacts:
Abbreviations: Boulevard Alternative = Boulevard; Access Road = Access Road; Hybrid U-Turn/Rotary = U-Turn/Rotary; Boulevard with Inner Belt Connection = Boulevard/Inner Belt
Impact refers to whether the alternative will improve (+), harm (-), or not impact health (~).
Magnitude reflects a qualitative judgment of the size of the anticipated change in health effect (e.g., the increase in the number of cases of disease, injury, adverse events): Negligible, Minor, Moderate, Major.
Severity reflects the nature of the effect on function and life-expectancy and its permanence: High = Intense/severe; Mod = Moderate; Low = Not intense or severe.
Strength of Causal Evidence refers to the strength of the research/evidence showing causal relationship between mobility and the health outcome: = plausible but insufficient evidence; = likely but more evidence needed; = high degree of confidence in causal relationship. A causal effect means that the effect is likely to occur, irrespective of the magnitude and severity.
Reference: Human Impact Partners, 2011
72

TABLE 6-21: OVERALL HEALTH ASSESSMENT OF AIR QUALITY
AIR QUALITY2010 Existing
Conditions, 2035 No-Build and Alternatives
Impacts of Alternatives Health OutcomeLimitations / UncertaintiesImpact Magnitude Severity Strength of Causal
Evidence
Chronic and acute impacts including asthma/other respiratory diseases and cardiovascular impacts (heart attack, CVD) 2010 Existing - Major High Substantial reductions
in emissions from 2010 to 2035 for all alternatives; however, near-roadway exposures need to be considered. Risks cannot be quantified based on current data.
2035 No-Build + Major High
Boulevard + Major High
Access Road + Major High
U-Turn/Rotary + Major High
Boulevard/Inner Belt + Major High
Impacts from greenhouse gas emissions on air quality 2010 Existing - Minor Moderate
Indirect impact on health by contributing to overall CO2 emissions that are not expected to change from current baseline.
2035 No-Build - Minor Moderate
Boulevard +/- Minor Moderate
Access Road +/- Minor Moderate
U-Turn/Rotary +/- Minor Moderate
Boulevard/Inner Belt
+/- Minor Moderate
Mental health (e.g., interference with cognitive abilities and well-being)2010 Existing - Moderate Moderate
Research indicates that air pollution may damage children’s cognitive abilities, increase adults’ risk of cognitive decline, and possibly contribute to depression.
2035 No-Build - Moderate Moderate
Boulevard + Moderate Moderate
Access Road + Moderate Moderate
U-Turn/Rotary + Moderate Moderate
Boulevard/Inner Belt + Moderate Moderate
73
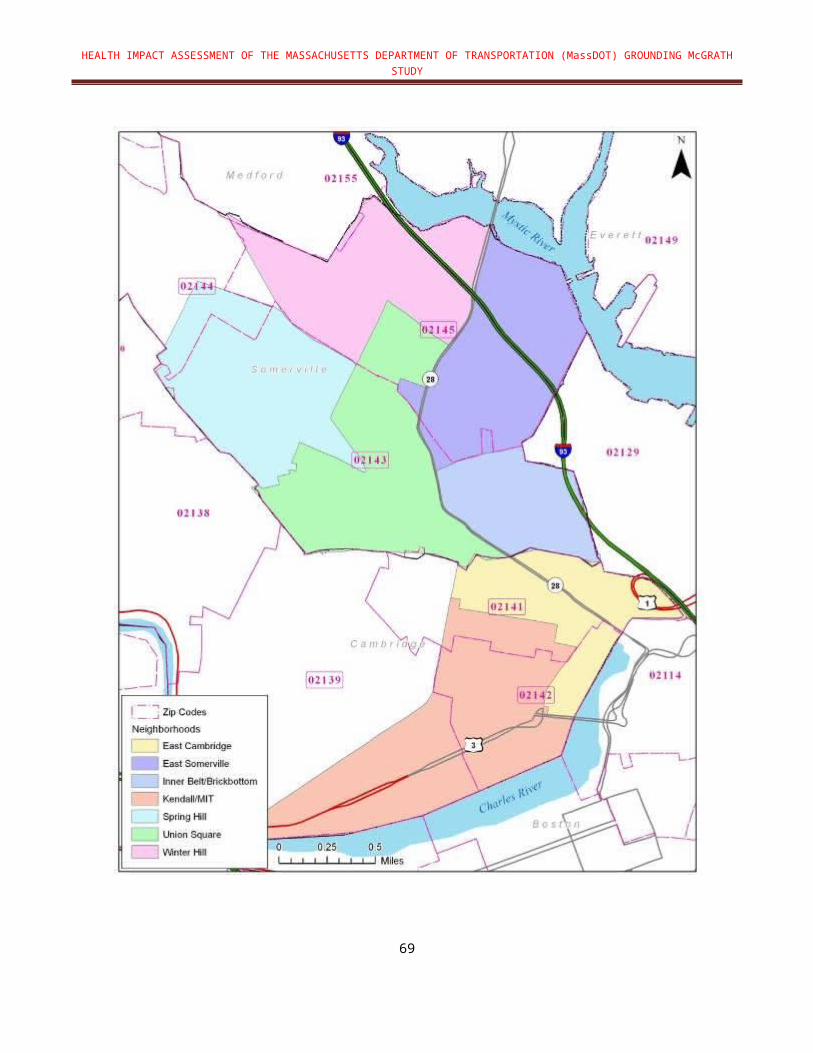
TABLE 6-22: OVERALL HEALTH ASSESSMENT FOR NOISE
NOISE2010 Existing Conditions, 2035 No-Build and Alternatives
Impacts of Alternatives Health OutcomeLimitations/
UncertaintiesImpact Magnitude Severity Strength of Causal Evidence
Impacts include hypertension, cardiovascular disease2010 Existing - Moderate Moderate Given the high density
of residences and de-elevation of the highway, additional analysis of noise impacts is necessary.
2035 No-Build - Moderate Moderate
Boulevard - Moderate Moderate
Access Road - Moderate Moderate
U-Turn/Rotary - Moderate Moderate
Boulevard/Inner Belt - Moderate Moderate
Mental health (e.g., interference with cognitive abilities, well-being due to sleep disturbance)2010 Existing - Moderate Moderate
2035 No-Build - Moderate Moderate
Boulevard - Moderate Moderate
Access Road - Moderate Moderate
U-Turn/Rotary - Moderate Moderate
Boulevard/Inner Belt - Moderate Moderate
74

TABLE 6-23: OVERALL HEALTH ASSESSMENT FOR MOBILITY AND CONNECTIVITY
MOBILITY AND CONNECTIVITY2010 Existing Conditions, 2035 No-Build and Alternatives
Impacts of Alternatives Health Outcome Limitations / Uncertainties
Impact Magnitude Severity Strength of Causal Evidence
All-cause and cardiovascular-related deaths2010 Existing - Major High Compared to existing
conditions and 2035 No-Build, all alternatives provide significant opportunities to increase physical exercise; however, near-road air quality impact needs to be mitigated.
2035 No-Build - Major High
Boulevard + Major High
Access Road + Major High
U-Turn/Rotary + Major High
Boulevard/Inner Belt + Major High
Cardiovascular diseases (e.g., coronary artery disease, hypertension)2010 Existing - Major High
2035 No-Build - Major High
Boulevard + Major High
Access Road + Major High
U-Turn/Rotary + Major High
Boulevard/Inner Belt + Major High
Mental health (e.g., depression, well-being)2010 Existing - Major High
2035 No-Build - Major High
Boulevard + Major High
Access Road + Major High
U-Turn/Rotary + Major High
Boulevard/Inner Belt + Major High
Obesity and Type II Diabetes2010 Existing - Major High
2035 No-Build - Major High
Boulevard + Major High
Access Road + Major High
U-Turn/Rotary + Major High
Boulevard/Inner Belt + Major High
75

TABLE 6-24: OVERALL HEALTH ASSESSMENT FOR PUBLIC SAFETY
PUBLIC SAFETY2010 Existing Conditions, 2035 No-Build and Alternatives
Impacts of Alternatives Health OutcomeLimitations/
UncertaintiesImpact Magnitude Severity Strength of Causal Evidence
Traffic-related injuries and fatalities2010 Existing - Moderate Moderate Improvements predicted
from lower speeds and safer roadway designs will decrease risk of injuries/fatalities; however, impacts due to increase in number of people at risk of collisions needs to be further analyzed.
2035 No-Build - Moderate Moderate
Boulevard + Moderate Moderate
Access Road + Moderate Moderate
U-Turn/Rotary + Moderate Moderate
Boulevard/Inner Belt + Moderate Moderate
Travel time affecting public safety vehicles2010 Existing + Moderate Moderate Reduced travel time from
potential congestion. Analysis of congestion at intersections is needed.
2035 No-Build - Moderate Moderate
Boulevard - Moderate Moderate
Access Road - Moderate Moderate
U-Turn/Rotary - Moderate Moderate
Boulevard/Inner Belt - Moderate Moderate
Mental health (e.g., stress and well-being)2010 Existing - Moderate Moderate
2035 No-Build - Moderate Moderate
Boulevard + Moderate Moderate
Access Road + Moderate Moderate
U-Turn/Rotary + Moderate Moderate
Boulevard/Inner Belt + Moderate Moderate
76

TABLE 6-25: OVERALL HEALTH ASSESSMENT FOR LAND USE AND ECONOMIC DEVELOPMENT
LAND USE AND ECONOMIC DEVELOPMENT2010 Existing Conditions, 2035 No-Build and Alternatives
Impacts of Alternatives Health OutcomeLimitations/
UncertaintiesImpact Magnitude Severity Strength of Causal Evidence
Chronic diseases2010 Existing - Major Moderate There is insufficient data on
land use and economic development associated with alternative designs. Increased access to goods and services is likely; however, displacement of current residents from gentrification is high and needs to be addressed.
2035 No-Build - Major Moderate
Boulevard + Major Moderate
Access Road + Major Moderate
U-Turn/Rotary + Major Moderate
Boulevard/Inner Belt + Major Moderate
Social determinants of health (e.g., income, education) and social cohesion 2010 Existing - Moderate Moderate
2035 No-Build - Moderate Moderate
Boulevard + Moderate Moderate
Access Road + Moderate Moderate
U-Turn/Rotary + Moderate Moderate
Boulevard/Inner Belt + Moderate Moderate
Mental health (e.g., interference with cognitive abilities and well-being)2010 Existing - Moderate Moderate
2035 No-Build - Moderate Moderate
Boulevard + Moderate Moderate
Access Road + Moderate Moderate
U-Turn/Rotary + Moderate Moderate
Boulevard/Inner Belt + Moderate Moderate
77

6.5. Figures
FIGURE 6-Q: CENSUS TRACTS IN SOMERVILLE MEETING EOEEA’S ENVIRONMENTAL JUSTICE CRITERIA
78

FIGURE 6-R: PREDICTED TRAFFIC DENSITY DURING MORNING PEAK TRAFFIC PERIOD
79
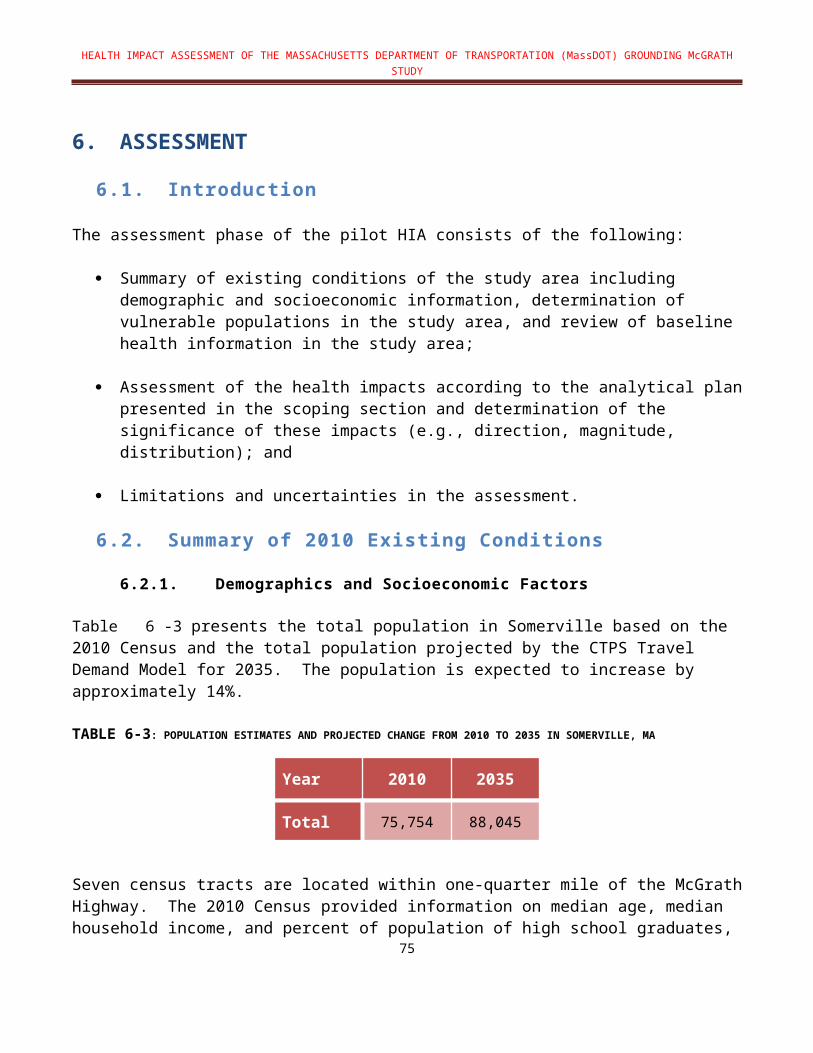
FIGURE 6-S: PREDICTED NOx CONCENTRATIONS (MORNING PEAK)
80

FIGURE 6-T: PREDICTED PM2.5 CONCENTRATIONS (MORNING PEAK)
81

FIGURE 6-U: COMPARISON OF PREDICTED NOx AND PM2.5 CONCENTRATIONS AND TRAFFIC DENSITY
82

FIGURE 6-V: PEQI SCORES OF EXISTING MCGRATH HIGHWAY AND NEARBY ROADWAYS
83

FIGURE 6-W: PEQI SCORES OF PROPOSED MASSDOT ALTERNATIVES FOR MCGRATH HIGHWAY
84

FIGURE 6-X: BEQI SCORES OF EXISTING MCGRATH HIGHWAY AND NEARBY ROADWAYS
85

FIGURE 6-Y: BEQI SCORES OF PROPOSED MASSDOT ALTERNATIVES FOR MCGRATH HIGHWAY
86

FIGURE 6-Z: TWO ROUTES EVALUATED FOR MODE SHIFT IN GM HIA
87

FIGURE 6-AA: GOODS AND SERVICES IN GM HIA STUDY AREA
88

FIGURE 6-BB: HOUSEHOLDS WITHIN 0.5 MILES OF SELECTED POINTS
89

FIGURE 6-CC: K-8 SCHOOLS IN SOMERVILLE
90
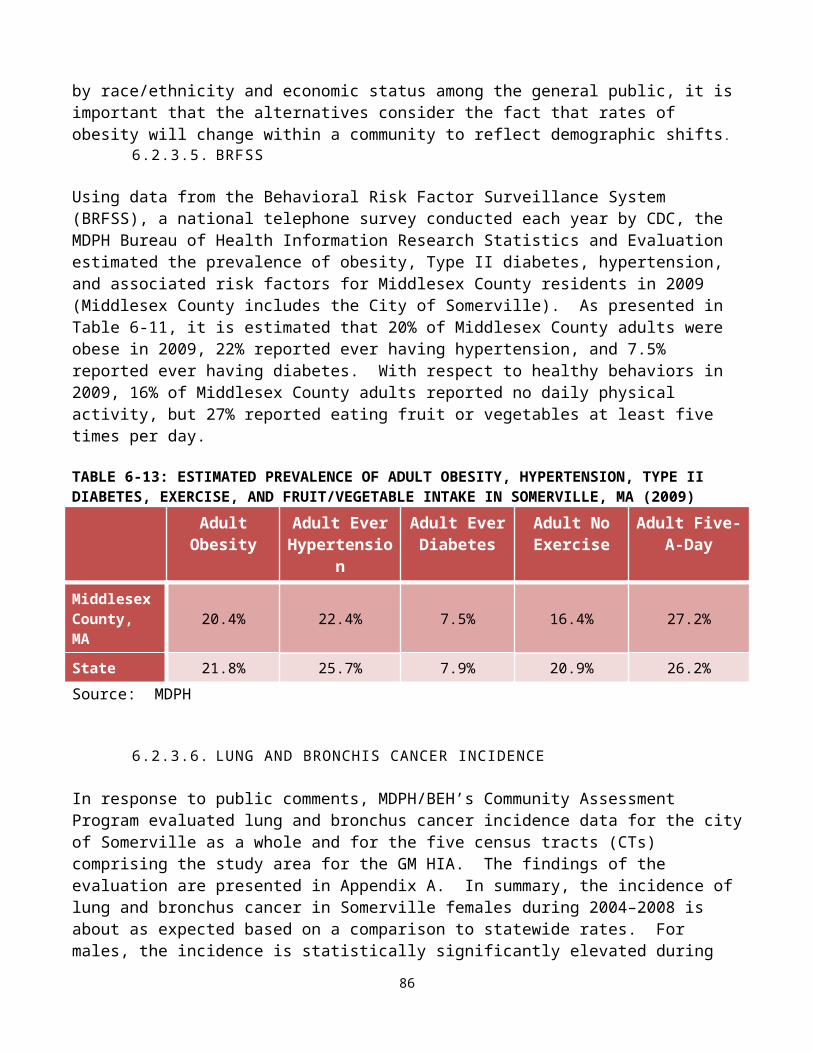
7. LIMITATIONS
The following limitations were identified:
The HIA is focused on the future of the McGrath Highway, and thus, does not address the current structure of the McGrath Highway.
Only alternatives proposed in the MassDOT GM Study were evaluated.
Most health outcome data were limited to zip code level to evaluate impacts in the study area.
Air quality impacts are based on analysis of two criteria pollutants as surrogate for the complex mixture of traffic-related air pollutants.
The air quality dispersion analysis was limited to the 1-hour morning peak emissions data derived from CTPS Travel Demand Model.
The CTPS Travel Demand Model limitations include: Travel preferences were from a 1991 survey; 2010 census data was not fully incorporated into the TDM-projections; Population and economic projections to 2035 are subject may change; Emissions data are based on EPA’s Mobile 6.2 and may change significantly;
when this model is replaced by the Motor Vehicle Emissions Simulator model (MOVES);
Data on the assumptions regarding transportation modes, demographics, economics, etc. that drive the model were not specified;
The impact of Green Line Extension and Inner Belt/Brickbottom development plan in the CTPS model were not specified.
Noise modeling was not conducted by MassDOT as part of the MassDOT GM Study. Screening modeling conducted by MDPH/BEH was limited in scope and simplified to reflect “worst case” conditions, including peak 1-hour traffic volumes. In addition, the impact of noise levels associated with congestion was not considered.
Assessing Mobility and Connectivity was limited to general identification of design elements associated with MassDOT guidelines (e.g., Complete Streets).
Travel time and congested time calculations were based upon the CTPS Travel Demand Model scenarios for the MassDOT alternative analysis, which did not include delays at intersections along McGrath Highway. Thus, the travel time is underestimated.
Predicted injuries/fatalities were based only on vehicle miles traveled because there was insufficient data to quantify the impact of alternative designs on injuries/fatalities.
91

Final drawings for the alternative designs from the MassDOT GM Study were incomplete at the time this HIA was prepared, and could not be fully incorporated into the HIA analysis.
Assessment of land use and economic development was significantly limited due to limited data at this stage of the transportation planning study.
8. FINDINGS AND RECOMMENDATIONS MDPH/BEH makes the following recommendations regarding the development of a framework and methods for conducting HIAs for transportation planning projects:
The study area is one of the most densely populated communities in Massachusetts. There is a 12% higher rate of Somerville residents who were foreign born or have a language other than English spoken in the home compared to the state as a whole. The fact that significantly more children are currently obese compared to the statewide average indicated that alternatives that promote healthy behaviors are paramount.
Based upon data reviewed for the GM HIA and the cumulative health impacts from multiple factors in the study area, the two optimal alternatives are the Boulevard Alternative and Boulevard with Inner Belt Connection Alternative because they offer the greatest opportunities for mobility and access.
Given that the study area is classified as an Environmental Justice community, it is critical that long-term plans that involve current residents are developed to ensure affordability of goods and services, stabilization of the cost of rental apartments, and employment opportunities are made available.
Future assessment of health impacts and benefits of proposed alternatives should be conducted once more robust project-specific information and transportation data become available.
Conducting an HIA in tandem with the first phase of a transportation planning study can provide good preliminary information on health impacts at an early stage of project development. However, a more detailed and precise assessment of health impacts and benefits of proposed alternatives would be possible at a later stage of project development, once more robust project-specific information and transportation data become available.
The alternatives assume significant trip diversions from McGrath Highway that will impact roadways outside of the corridor. As a result, significant mode shift is needed to reduce volumes without adding capacity. Additional analysis is needed to better understand and characterize the delays along the de-elevated roadway due to congestion and the potential for diversionary traffic from the de-elevated roadway into surrounding neighborhoods.
92
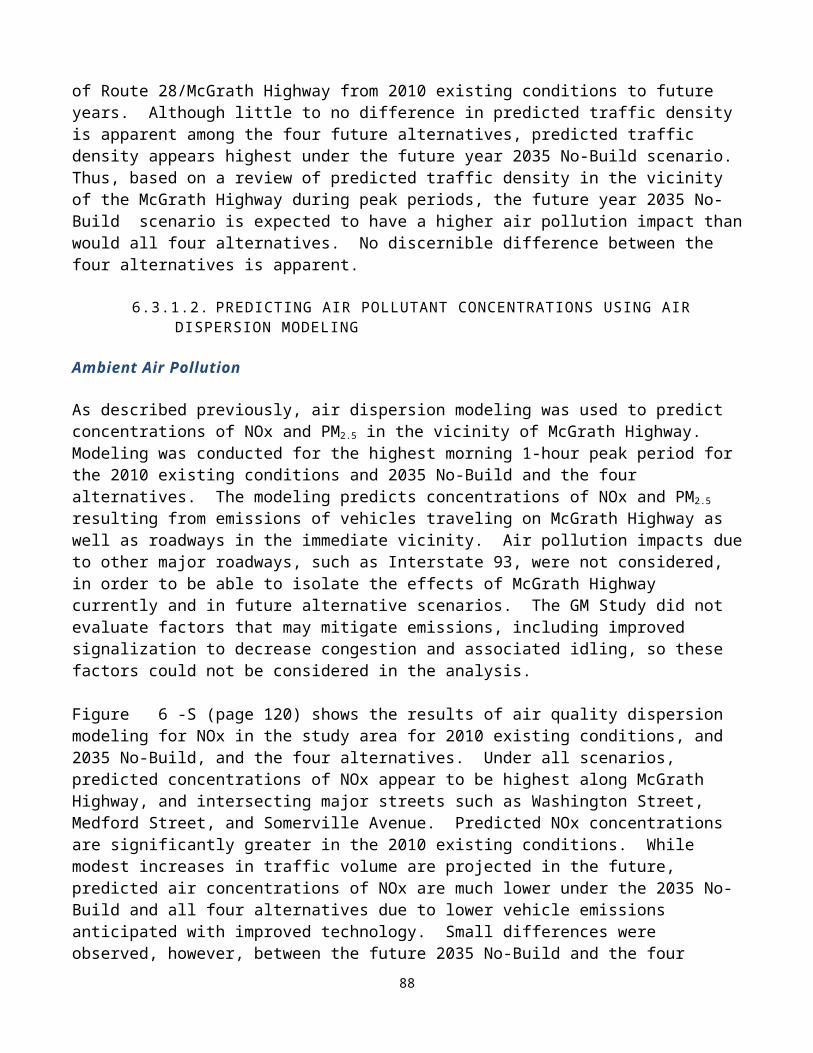
Existing health data resources such as the MDPH Environmental Public Health Tracking portal provide publicly available information on a variety of health outcomes and environmental data that can be readily incorporated into future assessments of existing health conditions and potential health impacts associated with transportation projects.
The following study-specific recommendations were generated based on the assessment of public health impacts/benefits associated with the pilot GM HIA:
Air Quality All future study alternatives, including the 2035 No-Build, will result in significant
reductions in traffic-related air pollution largely attributed to advancements in vehicle emissions standards and technologies. Continued support for the implementation of MassDEP efforts to reduce motor-vehicle related emissions including the Low Emissions Vehicle (LEV) program, emission control retrofits on diesel buses and construction equipment, and vehicle inspection programs may further improve both local and regional air quality.
De-elevation of the highway structure is anticipated to result in an increase in ground-level exposure to traffic-related air pollutant emissions (i.e., criteria pollutants, hazardous air pollutants, ultrafine particles). Thus, implementation of mitigation measures (e.g., locating sidewalks and bike paths further away from the roadway, installation of barriers, planting of trees) based on more comprehensive assessment of air pollution impacts should be explored where possible to reduce exposure to traffic- related air pollutants.
When available, traffic density information can provide a reasonable surrogate for exposure to traffic-related pollutant emissions, and should be considered as a viable screening tool in the early phases of the transportation planning process. Thus, traffic density information may be a potential alternative to more resource-intensive air quality modeling efforts.
CTPS is expected to update the Travel Demand Model with more recent travel survey data. As a result, a sensitivity analysis to determine if major changes to the model output will occur when the Travel Demand Model is updated should be considered.
Noise A screening-level analysis of noise impacts in an area with the highest predicted traffic
volumes indicated higher noise impacts would be expected with a de-elevated highway structure. A more comprehensive analysis of noise impacts to sensitive receptors from de-elevating the highway within the buffer area is recommended in order to identify areas where noise mitigation may be warranted.
Mobil ity and Connectivity Although detailed designs of all four future alternatives have not been developed at this
stage of the MassDOT GM Study, it is anticipated that all future pedestrian and bicycling networks will conform to the Complete Streets guidelines by incorporating high quality design elements that encourage active transportation. Efforts to support and maintain
93
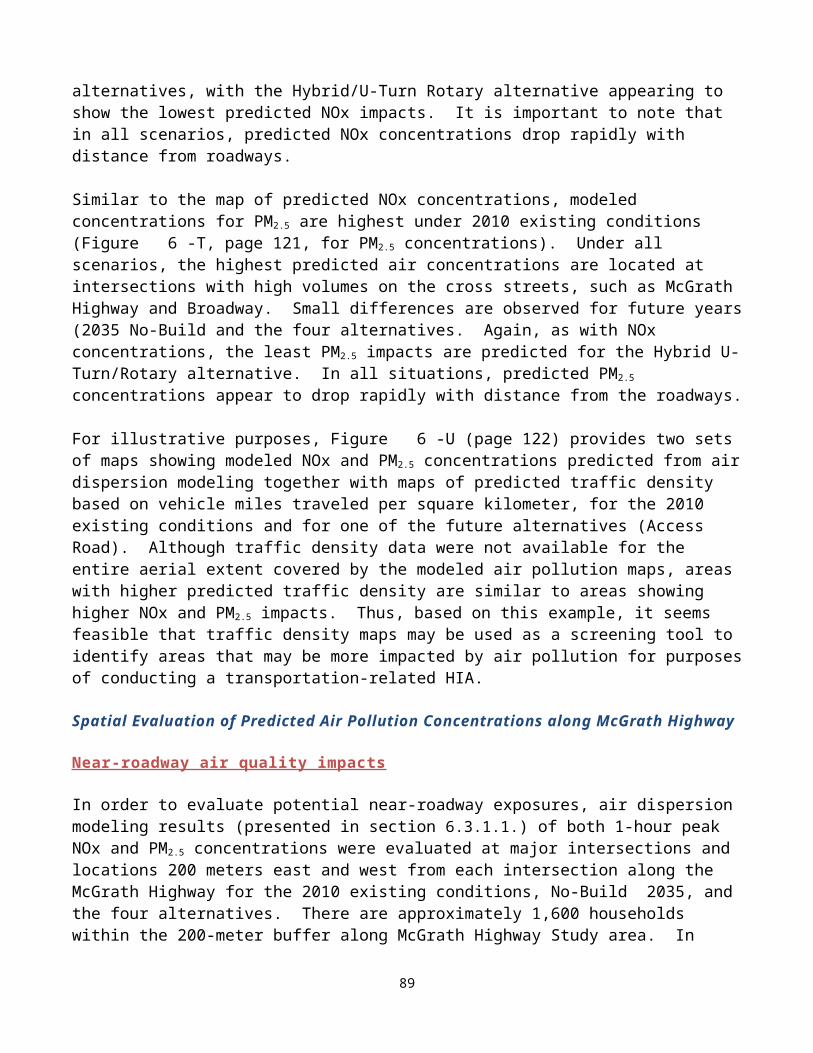
improvements to the pedestrian and bicycling network, including providing accessibility to disabled residents, are critical. In addition, support for a multifaceted approach to increase active transportation choices within the neighborhoods is vital, including consideration of cultural preferences and demographic diversity in Somerville, as well as socioeconomic status of residents.
The significant improvements in mobility and connectivity associated with alternative designs demonstrate the need for continued support of local efforts to reduce childhood obesity in Somerville. Since 2002, the City of Somerville and academic partners at Tufts University have implemented initiatives to promote healthy eating, active living, and healthy weight collectively referred to as Shape-Up Somerville (SUS) in partnership with the community. These efforts, along with infrastructure improvements with transportation design, are critical given that the current rate of childhood obesity in this area is 10% higher than the statewide average as documented in the GM HIA.
Public Safety Recommendations by DPH in the Highway Safety Plan to reduce injuries and fatalities
should be incorporated into alternative designs.
Efforts to support reduced travel speeds and volumes both on the de-elevated highway and in nearby neighborhoods will decrease injuries and fatalities.
Developing and promoting plans with local law enforcement to ensure safety along sidewalks, the bike path, and green space will increase likelihood of selecting active transportation options.
Land Use and Economic Development The MassDOT GM Study and this HIA assume that future development of the area
around the McGrath Highway, along with the operation of the Green Line Extension, will greatly increase the availability and accessibility of goods and services in the area. This, in turn, is likely to enhance employment opportunities presumably for local residents, as projected in the MassDOT GM Study. In addition, access to green space will increase. All of these improvements should result in better physical and mental health and social cohesion due to a greater sense of connection to the neighborhood and its goods and services. While these efforts will likely have a significant benefit to this neighborhood, the potential for gentrification is high. For that reason, future plans should consider significant community involvement in future housing plans such that current residents might best benefit.
9. REPORTING, EVALUATION AND MONITORINGReporting
As discussed in Chapter 4, after internal review, the findings and initial recommendations of the GM HIA will be presented to the GM Working Group in early 2013 before the final draft HIA undergoes a 30-day public comment period. Additional reporting will occur at MassDOT GM
94

Study public meetings, a briefing to Healthy Transportation Compact, and others. Plans for disseminating the results of the HIA will be determined in consultation with MassDOT and stakeholders.
Monitoring
Monitoring is intended to track the impacts of the HIA on the decision-making process and decision, the implementation of the decision, and impacts of the decision on health determinants. Given that the projected implementation of the MassDOT GM Study recommendations is 2035, initial monitoring will address incorporation of the HIA recommendations into the MassDOT GM Study, and the success in reporting the findings of the HIA to stakeholders and the public. This includes the comments and responses from the review of the final draft GM HIA during public comment period.
Evaluation
The following evaluation criteria have been proposed: Success in training of Massachusetts DOT and DPH leadership and staff. Survey
decision-makers on how useful the information was in their deliberations.
Success at selecting a pilot study that demonstrates the usefulness of HIAs for transportation and health planners will use in future projects.
Incorporation of HIA recommendations into the MassDOT GM Study.
Stakeholder-driven approach for incorporating HIA methods into transportation projects that would benefit from an HIA.
Number of future transportation-related projects that consider the HIAs in their decision-making process
95

10. REFERENCESAtkinson RW, Fuller GW, Anderson HR, Harrison RM, Armstrong B. 2010. Urban Ambient Particle Metrics and Health: A Time-Series Analysis. Epidemiology. 2010 Jul;21(4):501-11
Babisch W. 2006. Transportation Noise And Cardiovascular Risk: Updated Review And Synthesis Of Epidemiological Studies Indicate That The Evidence Has Increased. Noise Health 2006;8:1-29 FHWA TNM Version 2.5 Look-Up Tables: http://www.fhwa.dot.gov/environment/noise/traffic_noise_model/tnm_v25_lookup/
Beck LF, Dellinger AM, O’Neil ME. 2007. Motor Vehicle Crash Injury Rates By Mode Of Travel, United States: Using Exposure-Based Methods To Quantify Differences. Am J Epidemiology 166(2):212-218
Besser LM, Dannenberg AL. 2005. Walking to Public Transit Steps to Help Meet Physical Activity Recommendations Am J Prev Med 2005;29(4)
Cambridge Systematics, Inc., 2011. Crashes vs. Congestion – What’s the Cost to Society? Report prepared for the American Automobile Association (AAA). www.camsys.com/pubs/2011_AAA_CrashvCongUpd.pdf
CDC (Centers for Disease Control and Prevention). 2001. Task Force on Community Preventive Services. (2001). Increasing Physical Activity: A Report on Recommendations of the Task Force on Community Preventive Services. Morbidity and Mortality Weekly Report. Available at: http://www.cdc.gov/mmwr/preview/mmwrhtml/rr5018a1.htm
CDC (Centers for Disease Control and Prevention). 2009. Morbidity and Mortality Weekly Report (MMWR) Recommended Community Strategies and Measurements to Prevent Obesity in the United States. July 24, 2009 / 58(RR07);1-26
CDC (Centers for Disease Control and Prevention). 2012. Web-based Injury Statistics Query and Reporting System. Atlanta, GA: U.S. Department of Health and Human Services, CDC. Available at http://www.cdc.gov/injury/wisqars
Chen E, Schreier HM, Strunk RC, Brauer M. 2008. Chronic Traffic-Related Air Pollution And Stress Interact To Predict Biologic And Clinical Outcomes In Asthma. Environ Health Perspect. 2008 Jul;116(7):970-5
Clougherty JE, Levy JI, Kubzansky LD, Ryan PB, Suglia SF, Canner MJ, Wright RJ. 2007. Synergistic Effects Of Traffic-Related Air Pollution And Exposure To Violence On Urban Asthma Etiology. Environ Health Perspect. 2007 Aug;115(8):1140-6
Cohen D, Sehgal A, Williamson S, Sturm R, McKenzie TL, Lara R, Lurie N. Park Use and Physical Activity in a Sample of Public Parks in the City of Los Angeles. 2006.RAND Corporation. http://www.rand.org/pubs/technical_reports/2006/RAND_TR357.sum.pdf
96

Davison KK, Werder JL, Lawson CT. 2008. Children's Active Commuting To School: Current Knowledge And Future Directions. Preventing Chronic Dis, 5(3): A100
Dockery DW. 1993. Epidemiologic Study Design for Investigating Respiratory Health Effects of Complex Air Pollution Mixtures. Environ Health Perspect 1993;101 (Suppl 4):187-191
Dominici F, McDermott A, Zeger SL, Samet JM. 2003. Airborne Particulate Matter and Mortality: Timescale Effects in Four U.S. Cities. Am J Epidemiol. 2003 Jun 15; 157(12): 1055-1065
Dratva J, Phuleria HC, Foraster M, Gaspoz JM, Keidel D, Künzli N, Liu LJ, Pons M, Zemp E, Gerbase MW, Schindler C. 2011. Transportation Noise and Blood Pressure In A Population-Based Sample Of Adults. Environ Health Perspect. 2012 Jan;120(1):50-5. Epub 2011 Sep 1
Edwards R. 2007. Public Transit, Obesity, and Medical Costs: Assessing the MagnitudesOctober 10, 2007 http://qcpages.qc.cuny.edu/~redwards/Papers/edwards-ot-complete.pdf
Ewing R, Frank L, Kreutzer R. 2006. Understanding the Relationship Between Public Health And The Built Environment: A Report To The LEED-ND Core Committee. 2006. Available at: https://www.usgbc.org/ShowFile.aspx?DocumentID=1480
Frank LD, Sallis JF, Conway TL., Chapman JE., Saelens B. Bachman W. 2006. Many Pathways from Land Use to Health: Associations between Neighborhood Walkability and Active Transportation, Body Mass Index, and Air Quality. Journal of the American Planning Association Volume 72, Issue 1, 2006 pages 75-87
Frank LD, Engelke P. 2009. How Land Use and Transportation Systems Impact Public Health: A Literature Review of the Relationship Between Physical Activity and Built Form. Georgia Institute of Technology for Division of Nutrition and Physical ActivityPhysical Activity and Health Branch CDC ACES: Active Community Environments Initiative Working Paper #1
Frumkin H, Frank L, Jackson R. Urban Sprawl and Public Health. Washington, DC:Island Press, 2004
Gan WQ, Tamburic L, Davies HW, Demers PA, Koehoorn M, Brauer M. 2010. Changes In Residential Proximity To Road Traffic And The Risk Of Death From Coronary Heart Disease. Epidemiology • Volume 21, Number 5, September 2010
Gan WQ, Koehoorn M, Davies HW, Demers PA, Tamburic L, Brauer M. 2011. Long-Term Exposure To Traffic-Related Air Pollution And The Risk Of Coronary Heart Disease Hospitalization And Mortality. Environ Health Perspect. 2011 Apr;119(4):501-7. Epub 2010 Nov 16
Gauderman WJ, Avol E, Lurmann F, Kuenzli N, Gilliland F, Peters J, McConnell R.2005. Childhood Asthma And Exposure To Traffic And Nitrogen Dioxide. Epidemiology. 2005 Nov;16(6):737-43.\
97

Gauderman WJ, Vora H, McConnell R, Berhane K, Gilliland F, Thomas D, Lurmann F, Avol E, Kunzli N, Jerrett M, Peters J. 2007. Effect Of Exposure To Traffic On Lung Development From 10 To 18 Years Of Age: A Cohort Study. Lancet. 2007 Feb 17;369(9561):571-7Heinrich J, Wichmann HE. 2004. Traffic Related Pollutants In Europc And Their Effect On Allergic Disease. Curr Opin Allergy Immunol. 2004:4:342-8
Moudon AV, Hess PM. 2004. Pedestrian Safety And Transit Corridors. Research ReportAgreement T2695, Task 10 Pedestrian Safety. Prepared for Washington State Transportation Commission and Transportation Northwest (TransNow) http://depts.washington.edu/trac/bulkdisk/pdf/556.1.pdf
Hoek G, Brunekreef B, Goldbohm S, Fischer P, van den Brandt PA. 2002. Association Between Mortality And Indicators Of Traffic-Related Air Pollution In The Netherlands: A Cohort Study. Lancet. 2002 Oct 19; 360(9341):1203-1209
Hood E. 2005. Dwelling Disparities: How Poor Housing Leads to Poor Health.Environ Health Perspect. 2005 May; 113(5): A310–A317
Jackson, R. and Kochtitzky. 2001. Creating A Healthy Environment. Sprawl Watch Clearinghouse Monograph, Washington, D.C. (http://www.sprawlwatch.org)
Jackson RJ. 2003. The Impact of the Built Environment on Health: An Emerging Field. American Journal of Public Health: September 2003, Vol. 93, No. 9, pp. 1382-1384
Jerrett M, Finkelstein MM, Brook JR, Arain MA, Kanaroglou P. Stieb DM., Gilbert NL., Verma D, Finkelstein N, Chapman KR., Sears MR. 2009. A Cohort Study of Traffic-Related Air Pollution and Mortality in Toronto, Ontario, Canada. Environ Health Perspect. 2009 May;117(5):772-7. Epub 2009 Jan 5
Kloog I, Coull BA, Zanobetti A, Koutrakis P, Schwartz JD. 2012. Acute And Chronic Effects Of Particles On Hospital Admissions In New-England. PLoS One. 2012;7(4):e34664. Epub 2012 Apr 17
Lachapelle U, Frank LD. 2009. Transit and Health: Mode of Transport, Employer-Sponsored Public Transit Pass Programs, and Physical Activity Journal of Public Health Policy (2009) 30, S73–S94
LaScala EA, Gerber D, Gruenewald PJ. Demographic And Environmental Correlates Of Pedestrian Injury Collisions: A Spatial Analysis. Accid Anal Prev. 2000;32:651-658
Leyden KM. 2003. Social Capital And The Built Environment: The Importance Of Walkable Neighborhoods, Am J Public Health, 93: 1546–1551
Levine, N, Kim, K, and Nitz, L. 1995a. Spatial Analysis Of Honolulu Motor Vehicle Crashes: I. Spatial Patterns. Accident Analysis & Prevention, 27 (5): 663
Litman T. 2009. Introduction to Multi-Modal Transportation PlanningPrinciples and Practices. 17 September 2009By Victoria Transport Policy Institutehttp://www.vtpi.org/multimodal_planning.pdf
98

Litman T. 2011. Economic Value of Walkability. 2011. Victoria Transport Policy Institute. February 2011. http://www.vtpi.org/walkability.pdf
Maybury R, Bolorunduro O, Villegas C, Haut E, Stevens K, Cornwell E, Efron D, and Haider A. Pedestrians Struck By Motor Vehicles Further Worsen Race- And Insurance-Based Disparities In Trauma Outcomes: The Case For Inner-City Pedestrian Injury Prevention Programs. Surgery, August 2010, 148: 202-208 testing 1, 2
McConnell R, Islam T, Shankardass K, Jerrett M, Lurmann F, Gilliland F, Gauderman J, Avol E, Künzli N, Yao L, Peters J, Berhane K. 2010. Childhood Incident Asthma and Traffic-Related Air Pollution At Home And School. Environ Health Perspect. 2010 Jul;118(7):1021-6. Epub 2010 Mar 22
McDonald NC. (2008). Critical Factors For Active Transportation To School Among Low Income And Minority Students. Evidence from the 2001 National Household Travel Survey. Am J Prev Med, 34(4): 341-40
MBTA HIA. 2012. Healthy T for a Healthy Region: Health Impact Assessment of Proposed MBTA Service Cuts and Fare Increases. Metropolitan Area Planning Council. 2012 http://www.healthimpactproject.org/resources/body/Healthy-T-for-a-Healthy-Region.pdf
MDPH. 2012. The Status of Childhood Weight in Massachusetts, 2011: Preliminary Results from Body Mass Index Screening in Massachusetts Public School Districts in 2009-2011. School Health Unit, Bureau of Community Health and Prevention, Massachusetts Department of Public Health, Boston, MA.
Merom D, Tudor-Locke C, Bauman A, Rissel C. (2006). Active Commuting To School Among NSW Primary School Children: Implications For Public Health. Health Place, 12(4): 678-87
Miller KA, Siscovick DS, Sheppard L, Shepherd K, Sullivan JH, Anderson GL, Kaufman JD. Long-Term Exposure To Air Pollution And Incidence Of Cardiovascular Events In Women. N Engl J Med. 2007 Feb 1; 356(5): 447-58
Moore DK, Jerrett M, Mack WJ, Kunzli N. 2007. A Land Use Regression Model For Predicting Ambient Fine Particulate Matter Across Los Angeles, CA. Journal of Environmental Monitoring. 9: 246-52
O'Neill MS, Jerrett M, Kawachi I, Levy JI, Cohen AJ, Gouveia N, Wilkinson P, Fletcher T, Cifuentes L, Schwartz J. 2003. Health, Wealth, and Air Pollution: Advancing Theory and Methods. Workshop on Air Pollution and Socioeconomic Conditions. Environ Health Perspect. 2003 Dec;111(16):1861-70
Padró-Martínez LT, Patton AP, Trull JB, Zamore W, Brugge D, Durant JLMobile monitoring of particle number concentration and other traffic-related air pollutants in a near-highway neighborhood over the course of a year. Atmos Environ. 2012 Dec;61:253-264
99

Penden M, Scurfield R, Sleet D, et al. World Report On Road Traffic Injury Prevention, 2004. World Health Organization. Accessed at: http://whqlibdoc.who.int/publications/2004/9241562609.pdf. Accessed August 29, 2009
Peters A, von Klot S, Heier M, Trentinaglia I, Hörmann A, Wichmann HE, Löwel H. 2004. Exposure to Traffic and the Onset of Myocardial Infarction. N Engl J Med 2004; 351:1721-1730
PolicyLink. 2002. Regional Development and Physical Activity: Issues and Strategies for Promoting Health Equity. Principal Author Rebecca http://www.policylink.org/atf/cf/%7B97c6d565-bb43-406d-a6d5-eca3bbf35af0%7D/REGIONALDEVELOPMENT-PHYSICALACTIVITY_FINAL.PDF
PolicyLink. 2008. Designed for Disease: The Link Between Local Food Environments and Obesity and Diabetes.California Center for Public Health Advocacy, PolicyLink, and the UCLA Center for HealthPolicy Research. April 2008
PolicyLink, 2012. The Grocery Gap: Who Has Access to Healthy Food and Why it Matters. Sarah Treuhaft, PolicyLink and Allison Karpyn. The Food Trust. http://www.policylink.org/atf/cf/%7B97C6D565-BB43-406D-A6D5-ECA3BBF35AF0%7D/FINALGroceryGap.pdf
Poortinga W. (2006). Perceptions of the environment, physical activity, and obesity, Soc Sci Med, 63: 2835–2846
Pope CA 3rd, Muhlestein JB, May HT, Renlund DG, Anderson JL, Horne BD. 2006. Ischemic heart disease events triggered by short-term exposure to fine particulate air pollution.: Circulation. 2006 Dec 5;114(23):2443-2448. Epub 2006 Nov 13
Pope CA 3rd, Renlund DG, Kfoury AG, May HT, Horne BD. 2008. Relation of heart failure hospitalization to exposure to fine particulate air pollution. Am J Cardiol. 2008 Nov 1;102(9):1230-4. Epub 2008 Aug 27
Roberts, I, Marshall, R, Lee-Joe, T. (1994). The Urban Traffic Environment and the Risk of Child Pedestrian Injury: A Case-Crossover Approach. Epidemiology 1995;6:169-171
Roberts, I et al. 1995. Effect of Environmental factors on risk of injury of child pedestrians by motor vehicles: A case-control study. British Medical Journal. 310: 91
Rosenlund M, Picciotto S, Forastiere F, Stafoggia M, Perucci CA. 2008. Traffic-Related Air Pollution In Relation To Incidence And Prognosis Of Coronary Heart Disease. Epidemiology. 2008 Jan; 19(1):121-128
Schikowski T, Sugiri D, Ranft U, Gehring U, Heinrich J, Wichmann HE, Krämer U. 2005. Long-Term Air Pollution Exposure And Living Close To Busy Roads Are Associated With COPD In Women. Respir Res. 2005 Dec 22;6:152
Singh GK, Siahpush M, Kogan MD. 2010. Neighborhood Socioeconomic Conditions, Built Environments, And Childhood Obesity. Health Affairs, 29, no.3 (2010):503-512
100
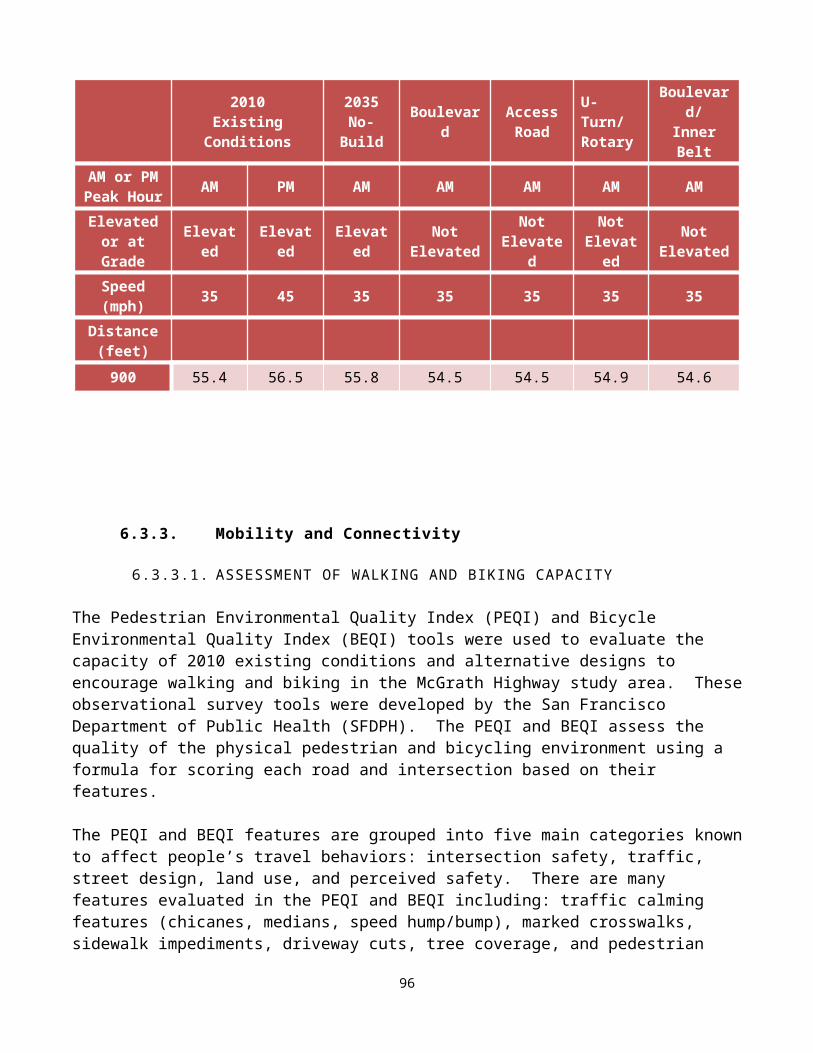
Stansfeld S, Crombie R. 2011. Cardiovascular Effects Of Environmental Noise: Research In The United Kingdom. Noise Health. 2011 May-Jun;13(52):229-33
Tibbetts J. 2002. Buildings Awareness of The Built Environment. Environ Health Perspect. 2002 Nov;110(11):A670-3
Tudor-Locke C, Neff LJ, Ainsworth BE Addy CL, Popkin BM. 2002. Omission Of Active Commuting To School And The Prevalence Of Children’s Health-Related Physical Activity Levels: The Russian Longitudinal Monitoring Study, Child Care Health Development, 28: 507–512
Von Klot S, Peters A, Aalto P, Bellander T, Berglind N, D'Ippoliti D, Elosua R, Hörmann A, Kulmala M, Lanki T, Löwel H, Pekkanen J, Picciotto S, Sunyer J, Forastiere F. 2005. Health Effects of Particles on Susceptible Subpopulations (HEAPSS) Study Group. Ambient Air Pollution Is Associated With Increased Risk Of Hospital Cardiac Readmissions Of Myocardial Infarction Survivors In Five European Cities. Circulation. 2005 Nov 15; 112(20): 3073-3079
Walker, E. 2012. Constructing a Noise Propagation Model to Assess Community Noise Levels Stemming From Road Traffic: the Case of Somerville, MA. A thesis submitted by Erica Walker in partial fulfillment of requirements for the degree of Master in Economics and Urban and Environmental Policy and Planning, Tufts University, April 27, 2012
Weinstein A, Schimek P. 2005. How Much Do Americans Walk? An Analysis Of The 2001 NHTS. Presented at: Transportation Research Board Annual Meeting; January 9-13, 2005; Washington, DC.
Wilhelm M, Ghosh JK, Su J, Cockburn M, Jerrett M, Ritz B. 2011. Traffic-Related Air Toxics And Term Low Birth Weight In Los Angeles County, California. Environ Health Perspect. 2012 Jan;120(1):132-8. Epub 2011 Aug 11
Woolf SH, Braveman P. 2011. Where Health Disparities Begin: The Role Of Social And Economic Determinants--And Why Current Policies May Make Matters Worse. Health Aff (Millwood). 2011 Oct;30(10):1852-9
Zhou Y, Levy JI. 2007. Factors Influencing the Spatial Extent of Mobile Source Air Pollution Impacts: A Meta-Analysis. BMC Public Health. 2007 May 22;7:89
101
APPENDIX A
102