health homes program annual report - maryland … homes... · 2017-08-02 · health homes program...
TRANSCRIPT

Health Homes Program Annual Report
October 31, 2014

Health Homes Program Annual Report
Table of Contents
Introduction ......................................................................................................................................1
Background .................................................................................................................................1
Overview of the Maryland Medicaid Health Homes Program .................................................2
Purpose of this Report .....................................................................................................................3
Monthly Enrollment ..........................................................................................................................4
Overall Enrollment ......................................................................................................................4
Monthly Enrollment by Diagnosis ..............................................................................................6
Monthly Enrollment by Provider ................................................................................................7
Participant Demographics ................................................................................................................8
Health Care Utilization and Access ..................................................................................................10
Inpatient Hospital Admissions ...................................................................................................11
ED Utilization ...............................................................................................................................12
Ambulatory Care Utilization .......................................................................................................12
Quality Measures ..............................................................................................................................13
Potentially Avoidable Hospitalizations ......................................................................................13
Appropriateness of ED Care .......................................................................................................15
30-Day-All-Cause-Readmissions ..................................................................................................16
Conclusion .........................................................................................................................................17
References ........................................................................................................................................18
Appendix 1: Health Home Services ..................................................................................................20
1
Health Homes Program Annual Report
Introduction
Health Homes are intended to improve health outcomes for individuals with chronic conditions
by providing patients with an enhanced level of care management and care coordination. Section
2703 of the Patient Protection and Affordable Care Act of 2010, “State Option to Provide Health
Homes for Enrollees with Chronic Conditions,” created the option for state Medicaid programs
to establish Health Homes. 1
Health Homes provide an integrated model of care that coordinate
primary, acute, behavioral health, and long-term services and supports for Medicaid enrollees
who have: two or more chronic conditions, one chronic condition and risk for developing a
second chronic condition, or a serious and persistent mental health condition.2 In response to this
initiative, the Maryland Office of Health Services submitted a Medicaid state plan amendment
(SPA) that was approved by the Centers for Medicare & Medicaid Services (CMS) on September
29, 2013.
Background
The concept of the Health Home evolved from the Medical Home model, introduced by the
American Academy of Pediatrics in 1967 to provide more centralized care for children with
special health care needs. While a “Medical Home” initially denoted a single source for all of a
patient’s medical information, it came to refer more broadly to an approach to primary care that
is comprehensive, coordinated, and patient- and family-centered.3 In 2007, four primary care
specialty societies (the American Academy of Physicians, the American Academy of Family
Physicians, the American College of Physicians, and the American Osteopathic Association)
agreed upon Joint Principles of the Patient-Centered Medical Home (PCMH).4 The PCMH was
to include a personal physician, a whole-person orientation, coordination across providers and
specialties, safe and high-quality care, enhanced access to care, and payment that recognized the
added value provided to patients who have a patient-centered medical home.
1United States Congress. (2010, March). Patient Protection and Affordable Care Act, 42 U.S.C. § 18001. Retrieved
from http://www.gpo.gov/fdsys/pkg/PLAW-111publ148/html/PLAW-111publ148.htm 2 The Centers for Medicare & Medicaid Services. (2010, November). Letter to State Medicaid Director and State
Health Official, SMDL#10-024, ACA#12. Retrieved from http://downloads.cms.gov/cmsgov/archived-
downloads/SMDL/downloads/SMD10024.pdf 3 Sia, C., Tonniges, T. F., Osterhus, E., & Taba, S. (2004). History of the medical home concept. Pediatrics,
113(Supplement 4), 1473-1478. Retrieved from
http://tennesseemedicalhome.com/tnaap/generalinfo/files/hxmedicalhomePediatrics-2004-Sia-1473-8.pdf 4 Higgins, S., Chawla, R., Colombo, C., Snyder, R., & Nigam, S. (2013). Medical homes and cost and utilization
among high-risk patients. The American Journal of Managed Care, 20(3), e61-71. Retrieved from
http://www.ajmc.com/publications/issue/2014/2014-vol20-n3/Medical-Homes-and-Cost-and-Utilization-Among-
High-Risk-Patients

2
There has been growing recognition of the fragmentation between behavioral health and primary
care faced by individuals with mental health and/or substance use disorders (SUDs), who are
more likely to die prematurely from untreated and preventable chronic illnesses.5 According to
CMS, Medicaid is “the single largest payer for mental health services in the United States and is
increasingly playing a larger role in the reimbursement of substance use disorder services.”6
Additionally, Medicaid beneficiaries with severe mental illnesses and SUDs are more likely to
have co-occurring chronic conditions than similar Medicaid beneficiaries.7 These issues provide
the motivation to examine the impact of additional care coordination and care management
services on the health outcomes of vulnerable populations.
Overview of the Maryland Medicaid Health Homes Program
The Maryland Health Homes program builds on statewide efforts to integrate somatic and
behavioral health services, with the aim of improving health outcomes and reducing avoidable
hospital utilization. The program targets populations with behavioral health needs who are at
high risk for additional chronic conditions, offering them enhanced care coordination and
support services from providers from whom they regularly receive care. The program is focused
on Medicaid enrollees with either a serious and persistent mental illness (SPMI), or an opioid
SUD and risk of additional chronic conditions due to tobacco, alcohol, or other non-opioid
substance use.8 Details of the program are provided below.
Eligible Populations. Medicaid enrollees can participate in Health Homes if they are eligible for
and engaged with a psychiatric rehabilitation program (PRP), mobile treatment service (MTS), or
an opioid treatment program (OTP) that has been approved by the Maryland Department of
Health and Mental Hygiene (DHMH) to function as a Health Home provider. Individuals are
excluded from Health Home participation if they are currently receiving other Medicaid-funded
services that may duplicate those provided by Health Homes, such as targeted mental health care
management.
5 Scott, D., & Happell, B. (2011). The high prevalence of poor physical health and unhealthy lifestyle behaviours in
individuals with severe mental illness. Issues in Mental Health Nursing, 32(9), 589-597 6 The Centers for Medicare and Medicaid Services. (2014, October). Medicaid-CHIP Program Information:
Behavioral Health Services. Retrieved from http://www.medicaid.gov/medicaid-chip-program-information/by-
topics/benefits/mental-health-services.html 7 Dickey, B., Normand, S. L. T., Weiss, R. D., Drake, R. E., & Azeni, H. (2002). Medical morbidity, mental illness,
and substance use disorders. Psychiatric Services, 53(7), 861-867. Retrieved from
http://journals.psychiatryonline.org/data/Journals/PSS/4349/861.pdf 8 The Centers for Medicare & Medicaid Services. (2013, September). Maryland Health Home State Plan
Amendment. Retrieved from http://www.medicaid.gov/state-resource-center/medicaid-state-technical-
assistance/health-homes-technical-assistance/downloads/maryland-spa-13-15.pdf
3
Provider Requirements. The providers must be enrolled as a Maryland Medicaid provider and
accreditated as a Health Home. A dedicated care manager must be assigned to each participant,
and providers are required to maintain certain staffing levels based on the number of participants.
The Health Home staff team must include a Health Home director, physician, and nurse
practitioner. Health Homes are responsible for documenting all services delivered, participant
outcomes, and social indicators in the eMedicaid care management system. They must notify
each participant’s other providers of the participant's goals and the types of services an
individual is receiving via the Health Home, and encourage participation in care coordination
efforts.
Health Home Services. Health Homes are required to provide at least two services to a
participant in a given month. Categories of service include: (1) comprehensive care management
to assess, plan, monitor, and report on participant health care needs and outcomes; (2) care
coordination to ensure appropriate linkages, referrals, and appointment scheduling across
different providers; (3) health promotion to aid participants in implementation of their care plans;
(4) comprehensive transitional care to ease the transition when discharged from inpatient settings
and ensure appropriate follow-up; (5) individual and family support services to provide support
and information that is language, literacy, and culturally appropriate; and (6) referral to
community and social support services. The Health Home receives a capitation payment per
member per month for providing this enhanced level of care coordination in addition to payment
for its usual services. The full list of Health Home services is presented in Appendix 1.
Purpose of this Report
The goal of this report is to provide a description of Medicaid enrollees’ participation in the
Maryland Health Home program and their interactions with the health care system during the
first year of program implementation. The measures presented were selected based on the
original Maryland SPA application and quality measure recommendations published by CMS.9
They were calculated using information provided by Health Home providers entered in real time
into the eMedicaid care management data system, as well as data from the Maryland Medicaid
Information System (MMIS2). MMIS2 data are updated monthly and routinely used for
evaluating the performance of Medicaid programs.
Please note that all of the data presented in this report were extracted from their respective data
systems as of October 7, 2014. Typically, MMIS2 data are not considered complete until twelve
months have passed for all claims and encounters to be resolved. Therefore, while the monthly
enrollment data can be considered up-to-date, all utilization measures based on MMIS2 data
9 The Centers for Medicare & Medicaid Services. (2014, March). Core Set of Health Care Quality Measures for
Medicaid Health Home Programs. http://www.medicaid.gov/State-Resource-Center/Medicaid-State-Technical-
Assistance/Health-Homes-Technical-Assistance/Downloads/Health-home-core-set-manual-.pdf

4
should be considered preliminary and will be revised and updated with complete data in future
reports. Because additional claims and encounters will be received, majority of the measure
estimates, particularly those summarizing utilization of care services, will increase during
subsequent revisions.
This report presents the following measures to describe the Maryland Health Home Program
from October 2013 through September 2014:
Monthly enrollment
Participant demographics
Health care utilization and access
Health care quality
Monthly Enrollment
The tables below present monthly enrollment for the first year of the program. These data
provide an overview of monthly trends and overall program participation. The measures are
calculated from data reported by Health Home providers into the eMedicaid care management
system.
Overall Enrollment
Table 1 shows the number of participants by month during the first 12 months of the Health
Home program. Over the 12-month period, 4,252 individuals participated in the program for
some duration. Enrollment increased more than fourfold during the program’s first year, from
756 participants in October 2013 to 3,846 participants in September 2014.
As expected, enrollment increased the most at program outset. November had the largest
enrollment increase (105 percent), with 796 additional individuals enrolling in the Health Home
program. December had the second highest enrollment increase of 42 percent. After December,
enrollment in the next four months increased between 8.6 and 12.6 percent. From May to
September, the increases slowed down to 2 to 4 percent. Although the rate of increase dropped in
recent months, the Health Home providers continue to identify and enroll eligible individuals
into the program.
5
Table 1. Health Home Enrollment by Month
Month Number of Participants Percentage Increase
October 2013 756 N/A
November 2013 1,552 105.3%
December 2013 2,197 41.6%
January 2014 2,474 12.6%
February 2014 2,775 12.2%
March 2014 3,013 8.6%
April 2014 3,294 9.3%
May 2014 3,423 3.9%
June 2014 3,530 3.1%
July 2014 3,660 3.7%
August 2014 3,771 3.0%
September 2014 3,846 2.0%
Total Ever Enrolled 4,252 N/A
6
Monthly Enrollment by Diagnosis
Table 2 displays the monthly number and percentage of Health Home participants by diagnosis. All participants in Maryland’s Health
Home program must be diagnosed with an SPMI or an opioid SUD, along with another chronic condition. The leading diagnosis
among Health Home participants was mental health disorder, ranging between 91.8 to 97.8 percent of participants each month. The
percentage of Health Home participants with an SUD was 24.6 percent in October 2013, but rose to 39.8 percent by September 2014.
Of the secondary chronic conditions, the leading diagnosis by far was obesity, at 75 to 79 percent each month. Another top diagnosis
was hypertension with monthly rates of 23 to nearly 27 percent. The other diagnoses, though much less prevalent, experienced
increases throughout the year.
Table 2. Monthly Health Home Enrollment by Diagnosis
Diagnosis Oct 2013 Nov 2013 Dec 2013 Jan 2014 Feb 2014 Mar 2014 Apr 2014 May 2014 Jun 2014 Jul 2014 Aug 2014 Sep 2014
Num Pct Num Pct Num Pct Num Pct Num Pct Num Pct Num Pct Num Pct Num Pct Num Pct Num Pct Num Pct
Mental Health
739 97.8% 1,425 91.8% 2,055 93.5% 2,304 93.1% 2,567 92.5% 2,783 92.4% 3,056 92.8% 3,179 92.9% 3,287 93.1% 3,416 93.3% 3,522 93.4% 3,597 93.5%
SUD 186 24.6% 509 32.8% 681 31.0% 812 32.8% 962 34.7% 1,088 36.1% 1,227 37.2 1,320 38.6% 1,382 39.2% 1,429 39.0% 1,496 39.7% 1,531 39.8%
Asthma 69 9.1% 146 9.4% 205 9.3% 249 10.1% 300 10.8% 333 11.1% 359 10.9 382 11.2% 396 11.2% 418 11.4% 439 11.6% 460 12.0%
COPD 35 4.6% 121 7.8% 161 7.3% 186 7.5% 209 7.5% 223 7.4% 237 7.2 251 7.3% 253 7.2% 259 7.1% 270 7.2% 274 7.1%
Diabetes 68 9.0% 171 11.0% 239 10.9% 253 10.2% 278 10.0% 303 10.1% 345 10.5 362 10.6% 375 10.6% 395 10.8% 425 11.3% 434 11.3%
Heart Disease
30 4.0% 75 4.8% 106 4.8% 115 4.6% 145 5.2% 173 5.7% 199 6.0 214 6.3% 218 6.2% 233 6.4% 248 6.6% 251 6.5%
Hepatitis C 31 4.1% 75 4.8% 100 4.6% 121 4.9% 151 5.4% 171 5.7% 191 5.8 213 6.2% 216 6.1% 230 6.3% 251 6.7% 253 6.6%
HIV/AIDS 13 1.7% 29 1.9% 36 1.6% 40 1.6% 46 1.7% 47 1.6% 51 1.5 61 1.8% 63 1.8% 66 1.8% 70 1.9% 72 1.9%
Hyper-tension
203 26.9% 396 25.5% 520 23.7% 570 23.0% 642 23.1% 708 23.5% 775 23.5 833 24.3% 850 24.1% 891 24.3% 922 24.4% 947 24.6%
Obesity 598 79.1% 1,213 78.2% 1,691 77.0% 1,886 76.2% 2,101 75.7% 2,274 75.5% 2,464 74.8 2,571 75.1% 2,657 75.3% 2,748 75.1% 2,840 75.3% 2,900 75.4%
Total 756 1,552 2,197 2,474 2,775 3,013 3,294 3,423 3,530 3,660 3,771 3,846
*Health Home participants can have more than one diagnosis

7
Monthly Enrollment by Provider
Table 3 displays the number of Health Home participants by provider for each month in the first
year of the program. Way Station provided services to the highest number of participants each
month. However, their rate dropped from 50 percent in October 2013 to 12.9 percent in
September 2014. Go-Getters Inc. and Mosaic Community Services also provided services to a
high number of participants. Both providers had no participants in the first month of the
program, but by September 2014, Go-Getters Inc had 299 participants, and Mosaic Community
Services had 274 participants. Please note that the provider names in the table below are all taken
directly from the eMedicaid system as reported by the providers. The data are only edited to
suppress cell sizes with less than 10 participants to protect the privacy of individually identifiable
health information.
Table 3. Monthly Health Home Enrollment by Provider
Provider Oct
2013 Nov 2013
Dec 2013
Jan 2014
Feb 2014
Mar 2014
Apr 2014
May 2014
Jun 2014
Jul 2014
Aug 2014
Sep 2014
All Walks Of Life Llc * * * 27 52 54 66 69 74 74 76 77
Alliance Inc * * * * * * * * * * 12 12
Alliance Inc-Baltimore County & City * * * * * 20 53 63 69 85 81 80
Alliance Inc - Harford County * * * * * * 17 18 35 49 56 65
Arundel Lodge Inc 65 103 103 102 103 110 118 118 117 118 121 120
Care Connection Inc 146 156 184 193 198 202 204 209 193 190 197 193
Catholic Charities Inc * * * * * * 25 30 31 35 37 36
Channel Marker Inc * 22 46 64 81 89 97 97 103 103 101 107
Cornerstone Montgomery Inc * * 24 33 53 80 103 112 121 128 147 155
Crossroads Community Inc * * * * 16 29 36 45 63 62 69 77
Eastern Avenue Health Solutions * 97 97 108 140 154 154 154 154 154 154 154
Family Serv Agency Inc 56 79 79 81 89 93 92 87 89 91 90 90
Go-Getters Inc * 45 165 218 252 281 287 282 288 286 293 299
Guide Mc Prp * 15 15 15 18 18 18 17 17 17 17 12
Guide Prp * 53 54 53 55 55 53 53 52 53 53 53
Harford-Belair Cmhc Rehab * * * * * * * 19 23 25 25 24
Hope Health Systems Inc Mobile * * 125 126 129 134 138 138 138 153 153 156
Humanim Inc * * 23 36 78 88 94 99 106 122 126 128
Ibr/Institutes For Behavior Resourc 25 41 66 89 114 134 137 150 149 152 154 159
Johns Hopkins Bayview Med Ctr * * * * * * * * * 18 23 42
Lower Shore Clinic Inc * * * * * * * * 37 37 44 48
Man Alive Inc 23 47 61 68 71 72 95 109 112 118 126 126
Montgomery Recovery Services * * * * * * * * * * * *
Mosaic Community Services * 43 87 122 165 199 235 249 252 257 265 274
Mosaic Community Services Inc * 53 62 77 79 85 89 94 100 96 94 96
Nalty & Associates Inc * * * 11 16 26 29 28 21 27 28 32
People Encouraging People * 75 186 189 187 187 187 187 186 186 186 186
Prologue Inc 14 87 88 91 92 93 97 99 99 102 104 104

8
Participant Demographics
Table 4 shows the age distribution of Health Home participants. Most participants were adults.
Sixty percent of the participants were aged 40 to 64 years, and slightly more than a quarter of
them were between the ages of 21 and 39 years. Nearly 9 percent of participants were children
up to age 20. Enrollment drops off steeply among those aged 65 and over, whose medical service
use is mainly covered by Medicare.10
Table 4. Health Home Enrollment by Age Group
Age Group (Years)
Number of Participants
Percentage of Participants
3-9 71 1.7%
10-14 187 4.4%
15 - 18 74 1.7%
19 - 20 32 0.8%
21 - 39 1,107 26.0%
40 - 64 2,552 60.0%
65 and over 229 5.4%
Total 4,252 100%
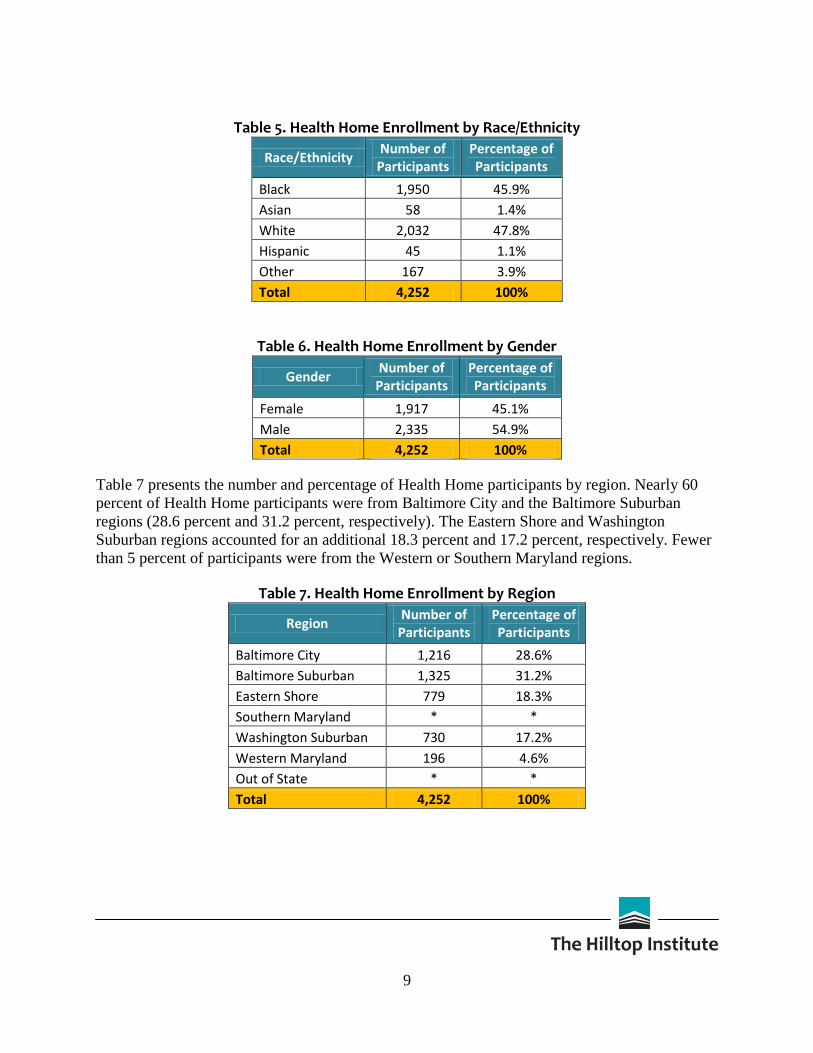
Tables 5 and 6 present the number and percentage of Health Home participants by race/ethnicity
and gender. The majority of the participants were White (47.8 percent) or Black (45.9 percent).
Less than 3 percent were Asian (1.4 percent) or Hispanic (1.1 percent). Participants of other
races/ethnicities composed 3.9 percent of the population. Table 6 shows that slightly more than
half (54.9 percent) of Health Home participants were male.
10 For those individuals over 65 enrolled in both Health Home and Medicare, we will report on their medical service
utilization that is billed to Medicaid.
Prs Day Program * 23 40 40 41 48 49 48 48 59 59 59
Psychotherapeutic Treatment Srv Inc
49 53 52 51 51 56 55 55 55 55 55 55
Ummc-Harbor City Unlimited * * * * * * 18 32 39 44 63 71
Umms Mobile Treatment Unit * * * * * * * 28 28 28 36 30
Upper Bay Css-Psych Rehab * 84 147 189 209 226 240 239 236 238 232 228
Way Station Inc 378 476 485 490 485 479 489 486 488 490 493 497
Total 756 1,552 2,197 2,474 2,775 3,013 3,294 3,423 3,530 3,660 3,771 3,846
*Suppresses cells <= 10
9
Table 5. Health Home Enrollment by Race/Ethnicity
Race/Ethnicity Number of
Participants Percentage of Participants
Black 1,950 45.9%
Asian 58 1.4%
White 2,032 47.8%
Hispanic 45 1.1%
Other 167 3.9%
Total 4,252 100%
Table 6. Health Home Enrollment by Gender
Gender Number of
Participants Percentage of Participants
Female 1,917 45.1%
Male 2,335 54.9%
Total 4,252 100%
Table 7 presents the number and percentage of Health Home participants by region. Nearly 60
percent of Health Home participants were from Baltimore City and the Baltimore Suburban
regions (28.6 percent and 31.2 percent, respectively). The Eastern Shore and Washington
Suburban regions accounted for an additional 18.3 percent and 17.2 percent, respectively. Fewer
than 5 percent of participants were from the Western or Southern Maryland regions.
Table 7. Health Home Enrollment by Region
Region Number of
Participants Percentage of Participants
Baltimore City 1,216 28.6%
Baltimore Suburban 1,325 31.2%
Eastern Shore 779 18.3%
Southern Maryland * *
Washington Suburban 730 17.2%
Western Maryland 196 4.6%
Out of State * *
Total 4,252 100%
10
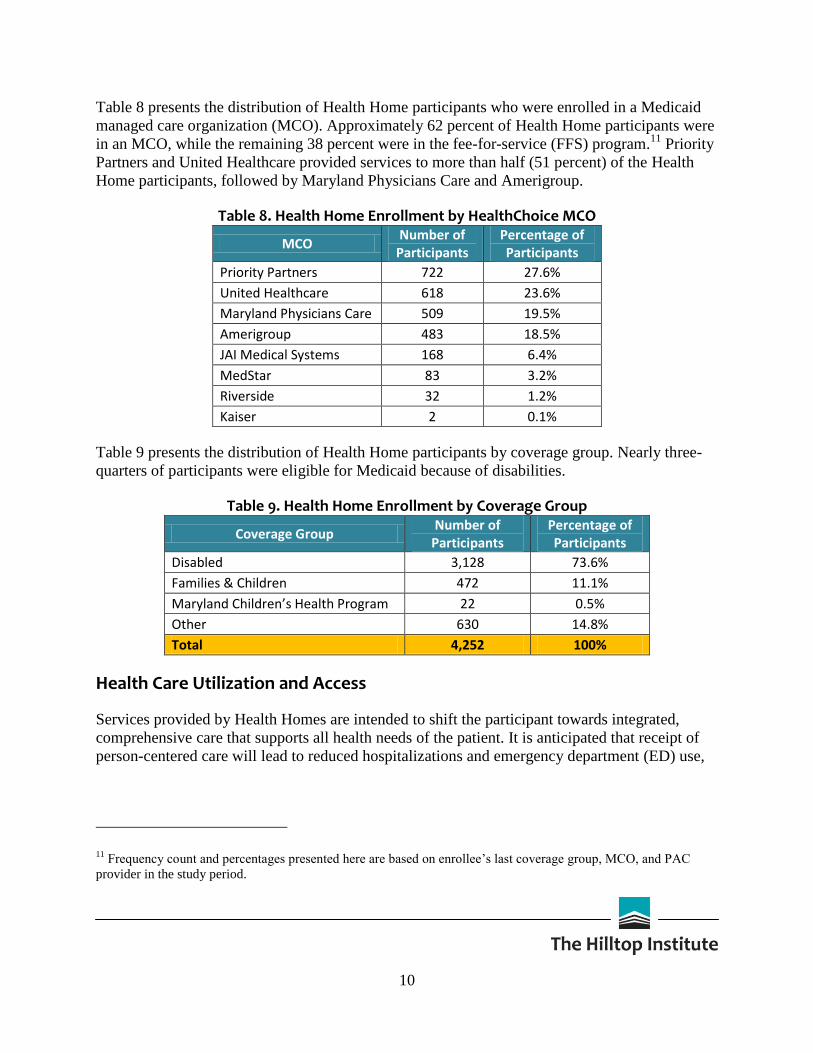
Table 8 presents the distribution of Health Home participants who were enrolled in a Medicaid
managed care organization (MCO). Approximately 62 percent of Health Home participants were
in an MCO, while the remaining 38 percent were in the fee-for-service (FFS) program.11
Priority
Partners and United Healthcare provided services to more than half (51 percent) of the Health
Home participants, followed by Maryland Physicians Care and Amerigroup.
Table 8. Health Home Enrollment by HealthChoice MCO
MCO Number of
Participants Percentage of Participants
Priority Partners 722 27.6%
United Healthcare 618 23.6%
Maryland Physicians Care 509 19.5%
Amerigroup 483 18.5%
JAI Medical Systems 168 6.4%
MedStar 83 3.2%
Riverside 32 1.2%
Kaiser 2 0.1%
Table 9 presents the distribution of Health Home participants by coverage group. Nearly three-
quarters of participants were eligible for Medicaid because of disabilities.
Table 9. Health Home Enrollment by Coverage Group
Coverage Group Number of
Participants Percentage of Participants
Disabled 3,128 73.6%
Families & Children 472 11.1%
Maryland Children’s Health Program 22 0.5%
Other 630 14.8%
Total 4,252 100%
Health Care Utilization and Access
Services provided by Health Homes are intended to shift the participant towards integrated,
comprehensive care that supports all health needs of the patient. It is anticipated that receipt of
person-centered care will lead to reduced hospitalizations and emergency department (ED) use,
11 Frequency count and percentages presented here are based on enrollee’s last coverage group, MCO, and PAC
provider in the study period.

11
and receipt of care in recommended settings, ultimately resulting in better care coordination and
lower health care costs.
Inpatient Hospital Admissions
Table 10 presents data on Health Home participant’s inpatient hospital admission rates for
October 2013 through September 2014. During this period, 22.5 percent of Health Home
participants experienced at least one inpatient admission. Health Home participants had a total of
1,854 admissions with an average of 1.9 admissions per participant among those with at least one
inpatient hospital admission.
Table 10. Inpatient Admissions by Health Home Participants
Number of Participants
Number of Admissions
Number with Any Admission
Percentage with Any Admission
4,252 1,854 957 22.5%
Figure 1 displays the frequency of admissions per participant. Over three-quarters of participants
had no hospital admission during the period. Of those that were admitted, 570 (13.4 percent) had
one hospitalization, while 387 (9.1 percent) had two or more visits.
Figure 1. Percentage of Health Home Participants with Inpatient Hospitalizations
77.5%
13.4% 9.1%
0.0%
10.0%
20.0%
30.0%
40.0%
50.0%
60.0%
70.0%
80.0%
90.0%
0 1 2+
Pe
rce
nta
ge o
f P
arti
cip
ants
Number of inpatient hospitalizations

12
ED Utilization
Table 11 presents data on Health Home participant’s ED visits from October 2013 through
September 2014. The average number of ED visits across all Health Home participants was two.
However, almost half of the Health Home participants (47.3 percent) did not have any ED visits
during this period. Of those that visited the ED, 834 participants (37 percent) had only 1 visit.
However, 379 (17 percent) of those with an ED visit had 6 or more ED visits during the year.
Table 11. Percentage of Health Home Participants with an ED Visit Number of ED
Visits Number of
Participants Percentage of All
Participants Percentage of Participants
with an ED Visit
0 2,011 47.3%
1 834 19.6% 37.2%
2 473 11.1% 21.1%
3-5 555 13.1% 24.8%
6-12 292 6.9% 13.0%
More than 12 87 2.0% 3.9%
Total 4,252 100% 100%
Table 12 presents the descriptive statistics of Health Home participants with at least one ED
visit. Of those that visited the ED, there was a wide range in the frequency of their visits
throughout the year, from 1 to 188. While the average number of ED visits across all Health
Home participants was two, the average of those that visited the ED at least once was nearly
four.
Table 12. ED Visit Statistics for Health Home Participants with at least One ED Visit Number of
Participants Sum ED
Visits Average ED
Visits Median ED Visits
Minimum ED Visits
Maximum ED Visits
2,241 8,562 3.8 2.0 1 188
Ambulatory Care Utilization
An ambulatory care visit is defined as contact with a physician or nurse practitioner in a clinic,
physician’s office, or hospital outpatient department. This definition excludes ED visits, hospital
inpatient services, SUD treatment, mental health, x-rays, and laboratory services.
Table 13 presents the number and percentage of Health Home participants with an ambulatory
care visit between October 2013 and September 2014. Approximately 82.5 percent of Health
Home participants had at least one ambulatory care visit during this period. The largest
proportion of Health Home participants had between two and six ambulatory care visits during
this period.

13
Table 13. Percentage of Health Home Participants with an Ambulatory Care Visit Number of Ambulatory
Care Visits Number of
Participants Percentage of Participants
0 742 17.5%
1 495 11.6%
2-6 1,639 38.5%
7-10 627 14.7%
More than 10 749 17.6%
Total 4,252 100%
Table 14 presents the total and average number of ambulatory care visits for Health Home
participants between October 2013 and September 2014. During this period, Health Home
participants averaged 5.9 ambulatory visits.
Table 14. Average Number of Ambulatory Care Visits for Health Home Participants
Number of Participants
Number of Ambulatory Care
Visits
Average Number of Ambulatory Care Visits
Per Participant
4,252 25,216 5.9
Quality Measures
The primary of the goal of the Health Home model is to improve the quality and coordination of
care, leading to improved health outcomes. This report presents various measures to evaluate the
quality of care received: potentially avoidable hospitalizations, appropriate use of ED visits, and
all-cause 30-day readmissions.
Potentially Avoidable Hospitalizations
The Agency for Healthcare Research and Quality’s (AHRQ’s) Prevention Quality Indicators
(PQIs) include measures of preventable or avoidable hospitalizations. These measures are
intended to indicate hospitalizations that could have been prevented if effective ambulatory care
had been completed in a timely manner. As part of this analysis, the participant’s inpatient
hospital admissions were reviewed using AHRQ’s PQI12
criteria to determine which events may
have been potentially avoidable. As specified by the AHRQ criteria, only a subset of hospital
admissions experienced by Health Home participants aged 18 through 64 years within specified
diagnosis related groups (DRGs) were taken into consideration for this portion of the analysis.
12 The Agency for Healthcare Research and Quality. (2014, September). Prevention Quality Indicators. Retrieved
from http://www.qualityindicators.ahrq.gov/

14
Table 15 presents the number and percentage of Health Home participants with a PQI admission
between October 2013 and September 2014. Among all Health Home participants aged 18
through 64 years, 482 had a qualifying hospitalization, and 52 experienced least one potentially
avoidable hospital admission. On average, participants in the program with at least one PQI
admission experienced 2.3 potentially avoidable admissions during the study period. Of those
hospitalized, 10.8 percent were classified as potentially avoidable.
Table 15. Percentage of Health Home Participants, Aged 18-64 Years, with PQI Admissions Number of PQI
Admissions Number of
Participants Percentage of Participants
0 430 89.2%
1 32 6.6%
2 10 2.1%
More than 2 10 2.1%
Total 482 100%
The most common PQI admission type was chronic obstructive pulmonary disease (COPD) or
asthma in older adults (aged 40 to 64 years), followed by bacterial pneumonia. Overall, more
PQI admissions were attributed to chronic conditions than to acute conditions.
Table 16. Percentage of Health Home Participants, Aged 18-64 Years, by Type of PQI AHRQ Prevention Quality Indicators Percentage of Participants
PQI #1: Diabetes Short-Term Complications 1.2%
PQI #2: Perforated Appendix 0.0%
PQI #3: Diabetes Long-Term Complications 1.2%
PQI #5: COPD or Asthma in Older Adults* 6.6%
PQI #7: Hypertension 0.6%
PQI #8: Heart Failure 1.0%
PQI #10: Dehydration 0.2%
PQI #11: Bacterial Pneumonia 2.3%
PQI #12: Urinary Tract Infection 0.4%
PQI #13: Angina Without Procedure 0.2%
PQI #14: Uncontrolled Diabetes 0.0%
PQI #15: Asthma in Younger Adults** 0.0%
PQI #16: Lower-Extremity Amputation In Patients With Diabetes 0.0%
PQI #90: Prevention Quality Overall Composite 10.8%
PQI #91: Prevention Quality Acute Composite 2.9%
PQI #92: Prevention Quality Chronic Composite 8.3% * Indicator only includes those ages 40 through 64 years
** Indicator only includes those ages 18 through 39 years
15
Appropriateness of ED Care
A principal aim of care coordination is the delivery of the right care at the right time in the right
setting. One widely used methodology to evaluate this goal in the ED setting is based on
classifications developed by the New York University (NYU) Center for Health and Public
Service Research. The algorithm assigns probabilities of likelihoods that the ED visit falls into
one of the following categories:
1. Non-emergent: Immediate care was not required within 12 hours based on patient’s
presenting symptoms, medical history, and vital signs
2. Emergent but primary care treatable: Treatment was required within 12 hours, but it
could have been provided effectively in a primary care setting (e.g., CAT scan or certain
lab tests)
3. Emergent but preventable/avoidable: Emergency care was required, but the condition
was potentially preventable/avoidable if timely and effective ambulatory care had been
received during the episode of illness (e.g., asthma flare-up)
4. Emergent, ED care needed, not preventable/avoidable: Ambulatory care could not have
prevented the condition (e.g., trauma or appendicitis)
5. Injury: Injury was the principal diagnosis
6. Alcohol-related: The principal diagnosis was related to alcohol
7. Drug-related: The principal diagnosis was related to drugs
8. Mental-health related: The principal diagnosis was related to mental health
9. Unclassified: The condition was not classified in one of the above categories
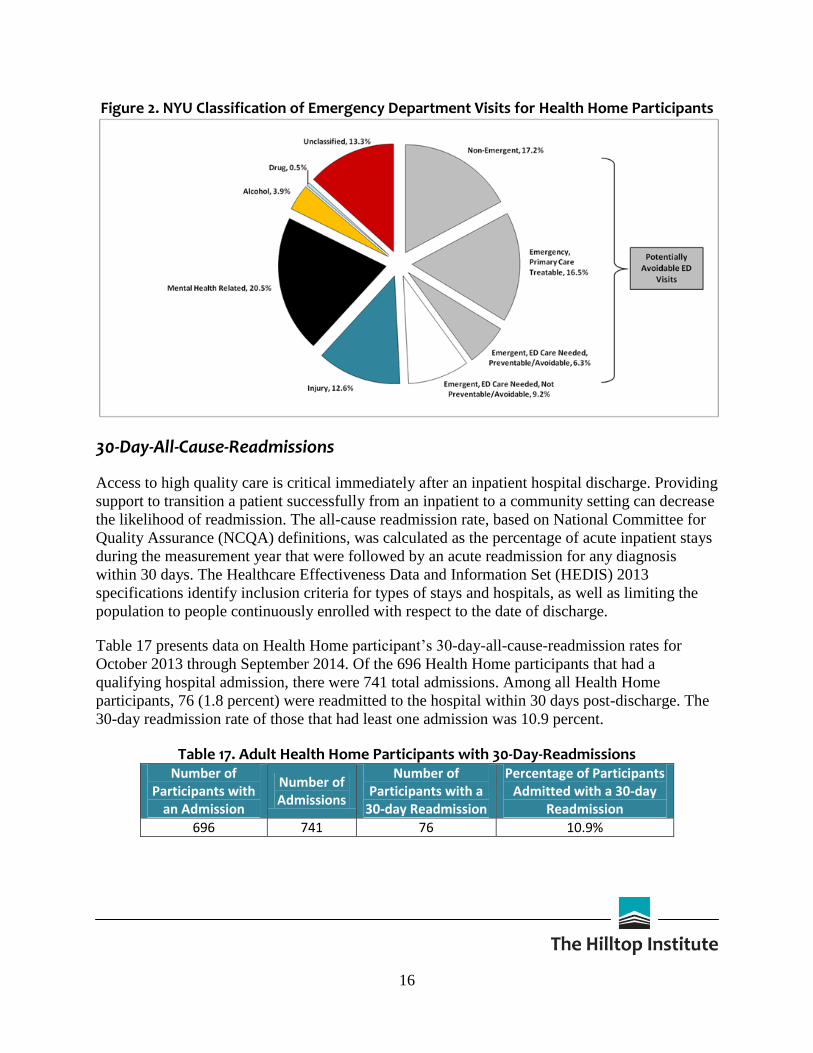
Figure 2 presents the distribution of ED visits for Health Home participants by NYU
classification between October 2013 and September 2014. ED visits that fall into categories 1
through 3 may indicate problems with access. During the first program year, 40 percent of all ED
visits were classified as likely to fall within one of these three categories, meaning that the visit
could possibly have been avoided with timely and quality primary care. ED visits in categories 4
(emergent, ED care needed, not preventable/avoidable) and 5 (injury) are the least likely to be
prevented with access to primary care. These two categories accounted for 21.8 percent of all ED
visits. The NYU algorithm classified 20.5 percent as likely to be mental-health related and only
0.5 percent as drug-related.
16
Figure 2. NYU Classification of Emergency Department Visits for Health Home Participants
30-Day-All-Cause-Readmissions
Access to high quality care is critical immediately after an inpatient hospital discharge. Providing
support to transition a patient successfully from an inpatient to a community setting can decrease
the likelihood of readmission. The all-cause readmission rate, based on National Committee for
Quality Assurance (NCQA) definitions, was calculated as the percentage of acute inpatient stays
during the measurement year that were followed by an acute readmission for any diagnosis
within 30 days. The Healthcare Effectiveness Data and Information Set (HEDIS) 2013
specifications identify inclusion criteria for types of stays and hospitals, as well as limiting the
population to people continuously enrolled with respect to the date of discharge.
Table 17 presents data on Health Home participant’s 30-day-all-cause-readmission rates for
October 2013 through September 2014. Of the 696 Health Home participants that had a
qualifying hospital admission, there were 741 total admissions. Among all Health Home
participants, 76 (1.8 percent) were readmitted to the hospital within 30 days post-discharge. The
30-day readmission rate of those that had least one admission was 10.9 percent.
Table 17. Adult Health Home Participants with 30-Day-Readmissions Number of
Participants with an Admission
Number of Admissions
Number of Participants with a
30-day Readmission
Percentage of Participants Admitted with a 30-day
Readmission
696 741 76 10.9%

17
Conclusion
Maryland's Health Home program is just beginning to provide a model of care for people with
chronic conditions, and Health Home providers have only been serving this population for a
year. The information presented in this report provides preliminary evidence that there is demand
for these comprehensive coordinated services for this population, but cannot yet tell a story about
the effectiveness of this approach as compared with regular Medicaid coverage because of the
brief program duration. This document represents a first step in monitoring the performance of
the Health Homes program. The report uses claims and encounter data, as well as data currently
available from the eMedicaid case management tracking tool, to analyze the program's
performance. The eMedicaid tool will be expanded in the coming months, which may allow for
more detailed analyses.
Moving forward, it is anticipated that: 1) the measures presented in this report will be revised to
include sufficient run-out for year one, as well as data on upcoming years; 2) new measures of
interest will be identified as more data become available; and 3) a thorough evaluation of
provider experiences will be conducted. Through a combination of these evaluation efforts,
information from training sessions, and feedback gathered from providers and participants, a
comprehensive picture of the program’s impacts will emerge. DHMH is committed to working
with CMS and other stakeholders to identify and address necessary programmatic changes by
continuing to monitor the progress of participants and their health care utilization and outcomes.

18
References
The Agency for Healthcare Research and Quality. (2014, September). Prevention Quality
Indicators. Retrieved from http://www.qualityindicators.ahrq.gov/
The Centers for Medicare & Medicaid Services. (2014, March). Core Set of Health Care Quality
Measures for Medicaid Health Home Programs. http://www.medicaid.gov/State-
Resource-Center/Medicaid-State-Technical-Assistance/Health-Homes-Technical-
Assistance/Downloads/Health-home-core-set-manual-.pdf
The Centers for Medicare & Medicaid Services. (2010, November). Letter to State Medicaid
Director and State Health Official, SMDL#10-024, ACA#12. Retrieved from
http://downloads.cms.gov/cmsgov/archived-
downloads/SMDL/downloads/SMD10024.pdf
The Centers for Medicare and Medicaid Services. (2014, October). Medicaid-CHIP Program
Information: Behavioral Health Services. Retrieved from
http://www.medicaid.gov/medicaid-chip-program-information/by-topics/benefits/mental-
health-services.html
The Centers for Medicare & Medicaid Services. (2013, September). Maryland Health Home
State Plan Amendment. Retrieved from http://www.medicaid.gov/state-resource-
center/medicaid-state-technical-assistance/health-homes-technical-
assistance/downloads/maryland-spa-13-15.pdf
Dickey, B., Normand, S. L. T., Weiss, R. D., Drake, R. E., & Azeni, H. (2002). Medical
morbidity, mental illness, and substance use disorders. Psychiatric Services, 53(7), 861-
867. Retrieved from http://journals.psychiatryonline.org/data/Journals/PSS/4349/861.pdf
National Committee for Quality Assurance. (2013). The Healthcare Effectiveness Data and
Information Set Volume 2, HEDIS® 2013.
New York University Center for Health and Public Service Research. (2014, September).
Emergency Department Algorithm. Retrieved from
http://wagner.nyu.edu/faculty/billings/nyued-download
Higgins, S., Chawla, R., Colombo, C., Snyder, R., & Nigam, S. (2013). Medical homes and cost
and utilization among high-risk patients. The American journal of managed care, 20(3),
e61-71. Retrieved from http://www.ajmc.com/publications/issue/2014/2014-vol20-
n3/Medical-Homes-and-Cost-and-Utilization-Among-High-Risk-Patients

19
Scott, D., & Happell, B. (2011). The high prevalence of poor physical health and unhealthy
lifestyle behaviours in individuals with severe mental illness. Issues in mental health
nursing, 32(9), 589-597.
Sia, C., Tonniges, T. F., Osterhus, E., & Taba, S. (2004). History of the medical home concept.
Pediatrics, 113(Supplement 4), 1473-1478. Retrieved from
http://tennesseemedicalhome.com/tnaap/generalinfo/files/hxmedicalhomePediatrics-
2004-Sia-1473-8.pdf
United States Congress. (2010, March). Patient Protection and Affordable Care Act, 42 U.S.C. §
18001. Retrieved from http://www.gpo.gov/fdsys/pkg/PLAW-111publ148/html/PLAW-
111publ148.htm
20
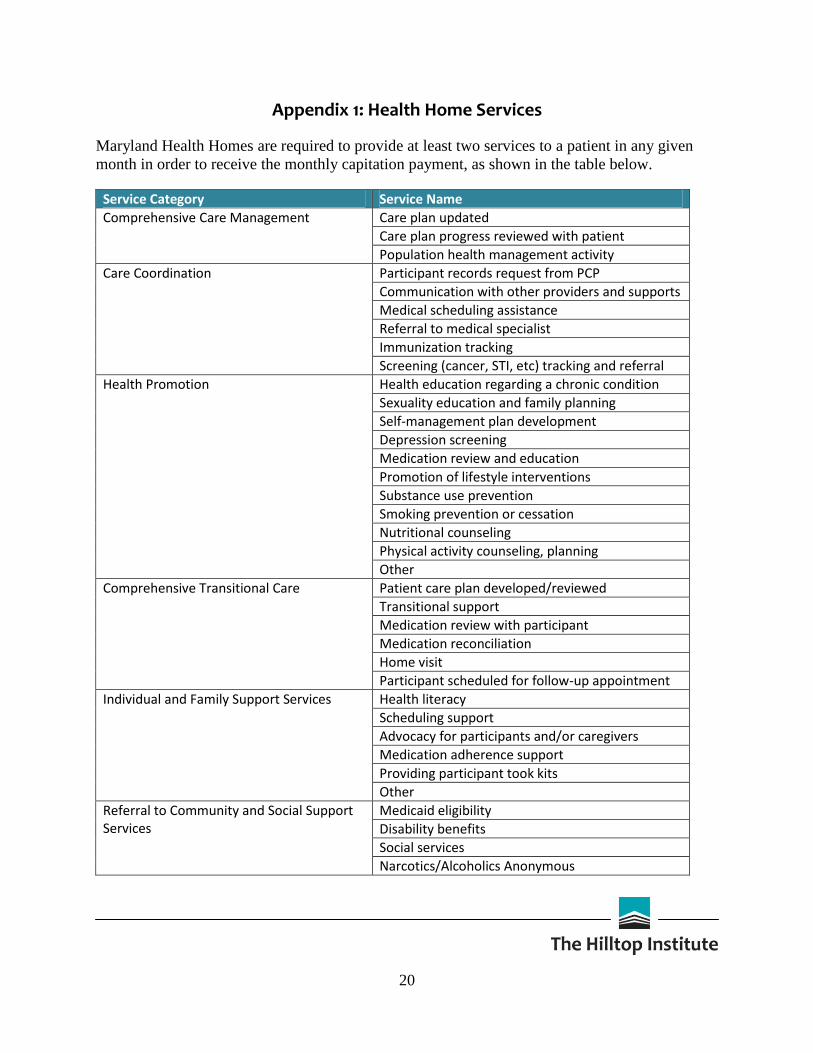
Appendix 1: Health Home Services
Maryland Health Homes are required to provide at least two services to a patient in any given
month in order to receive the monthly capitation payment, as shown in the table below.
Service Category Service Name
Comprehensive Care Management Care plan updated
Care plan progress reviewed with patient
Population health management activity
Care Coordination Participant records request from PCP
Communication with other providers and supports
Medical scheduling assistance
Referral to medical specialist
Immunization tracking
Screening (cancer, STI, etc) tracking and referral
Health Promotion Health education regarding a chronic condition
Sexuality education and family planning
Self-management plan development
Depression screening
Medication review and education
Promotion of lifestyle interventions
Substance use prevention
Smoking prevention or cessation
Nutritional counseling
Physical activity counseling, planning
Other
Comprehensive Transitional Care Patient care plan developed/reviewed
Transitional support
Medication review with participant
Medication reconciliation
Home visit
Participant scheduled for follow-up appointment
Individual and Family Support Services Health literacy
Scheduling support
Advocacy for participants and/or caregivers
Medication adherence support
Providing participant took kits
Other
Referral to Community and Social Support Services
Medicaid eligibility
Disability benefits
Social services
Narcotics/Alcoholics Anonymous

21
Service Category Service Name
Housing
Legal services
Peer support
Life skills
Educational/vocational training
Other

University of Maryland, Baltimore County Sondheim Hall, 3rd Floor
1000 Hilltop Circle Baltimore, MD 21250
410-455-6854 www.hilltopinstitute.org