health care reform: colorectal cancer screening … care reform: colorectal cancer screening...
TRANSCRIPT

PHSSR Research-In-Progress WebinarWednesday, June 18, 2014
Health Care Reform: Colorectal Cancer Screening Expansion and
Health Disparities
Conference Phone: 877-394-0659
Conference Code: 775 483 8037#
Please remember to mute your computer speakers during the presentation.
NATIONAL COORDINATING CENTER
THE UNIVERSITY OF KENTUCKY COLLEGE OF PUBLIC HEALTH
Agenda
Welcome: Anna Hoover, PhD, National Coordinating Center for PHSSR
Presenter: Michael Preston, PhD, MPH, U. of Arkansas for Medical Sciences
Commentary:Glen Mays, PhD, MPH, Professor, U. of Kentucky College of Public Health
Ronda Henry-Tillman, MD, Winthrop P. Rockefeller Cancer Institute, U. of Arkansas for Medical Sciences
Questions and Discussion

Presenter
Michael Preston, PhD, MPH
U. of Arkansas for Medical Sciences
Health Care Reform: Colorectal Cancer Screening Expansion and Health Disparities
Michael Preston, Ph.D., M.P.H.
University of Arkansas for Medical Sciences
@MDonP
PHSSR Research-in-Progress Webinar Series · Lexington, KY· 18 June 2014
No Financial Conflicts of Interest to Disclose

Background and Significance
Theoretical Framework
Objective
Methods
Results
Conclusions
Implications
Presentation Outline

Third leading cause of cancer-related deaths in men and women when counted separately
Second leading cause of cancer-related deaths in men and women when counted collectively
142K+ new cases
50K+ deaths
Over the past 20+ years, death rates have decreased
Disparities remain among medically underserved populations
Colorectal Cancer
American Cancer Society, 2013

Early detection has been a major contributor to the overall decline in new cases and deaths from CRC
Screening allows for detection and removal of precancerous polyps before they progress to cancer (Cancer Facts & Figures 2012)
Screening allows for earlier detection when disease is easier to cure
Improvement in treatment over the years
Healthy People 2020 screening goal 70.5%
Colorectal Cancer Screening

Compliance or adherence to screening guidelines reduces disparities
Higher mortality rates remain among disadvantaged and underserved that are part of racial and ethnic minorities and rural populations which tend to be low-income, under-insured, and uninsured
Racial and ethnic minorities such as AA are less likely to be screened and more likely to die
5-year survival rate in AA was 53% compared to 63% in Whites from 1992 to 1999 (Agrawal et al., 2005)
Colorectal Cancer Screening Disparities

Colorectal Cancer Screening Rates(BRFSS, 2010)
Source: CDC, 2010

Washington
Oregon
California
Nevada
Idaho
Montana
Wyoming
ColoradoUtah
New MexicoArizona
Texas
Oklahoma
Kansas
Nebraska
South Dakota
North DakotaMinnesota
Wisconsin
Illinois
Iowa
Missouri
Arkansas
Louisiana
Alabama
Tennessee
Michigan
Pennsylvania
New York
Vermont
Georgia
Florida
Mississippi
Kentucky
South Carolina
North Carolina
MarylandOhioDelaware
Indiana West Virginia
New Jersey
Connecticut
Massachutes
Maine
Rhode Island
Virginia
New Hampshire
Alaska
Insurance Coverage Mandate States in the U.S.
Hawaii Mandate State
Source: SCLD, 2012

Policy that requires insurers to cover the cost of medical services they would not otherwise if a mandate is not in place
Not all states passed mandates related to CRC
Variation in the types of mandates that were passed
Differences in the amount of cost-sharing
Mandates reduced out-of-pocket expenses
Increase CRC screenings
Insurance Coverage Mandate for CRC

The Colorectal Cancer Act of 2005
Rep Elliot; Sen Steele, Sen Critcher, Sen Whitaker
Established:
CRC Control and Research Demonstration Project
UAMS Cancer Control (PI: Henry-Tillman)
Policy that requires insurers to cover CRC screenings 2 main exemptions
Employer self-funded benefit plans (mainly large employers)
No restrictions on cost-sharing
AR Example: Act 2236

2010, Patient Protection and Affordable Care Act (ACA)
Decrease the number of uninsured Americans
Reduce the overall cost of health care
Insurance coverage mandates for preventive health services
Closed loop-holes in state mandates
Employer self-funded benefit plans
No restrictions on cost-sharing
Health Care Reform

0
10
20
30
40
50
60
199
7
199
8
199
9
200
0
200
1
200
2
200
3
200
4
200
5
200
6
200
7
200
8
200
9
2010
2011
2012
Nu
mb
er
of
Sta
tes
Policy Adoption Over Time
Mandate Non-Mandate Reform

Law of Demand
As out-of-pocket costs decrease…
…the quantity of colorectal screenings increase

Goal of Research Study
To estimate the effects of health insurance coverage expansions on overall CRC screening rates and CRC screening disparities.

Difference-in-differences (DID) Measures the difference in CRC screening before and after
policy
Measures the difference in CRC screening b/w the treatment and control groups
Treatment group: non-mandate states
Control group: mandate states
DID allows us to identify causal effects of ACA on CRC screening
Methods

Behavioral Risk Factor Surveillance System (BRFSS) Study population is a sample of U.S. adults age 50 or greater
National Cancer Institute State Cancer Legislative Database Used to determine provisions, exemptions, and enforcements of state
mandates
The dataset was used to assess state-level estimates of health behaviors and health care utilization by building a state-year longitudinal data file
This data file provided information on types of CRC screening, date latest test was performed, insurance status, race/ethnicity and SES for years studied
Analytical sample 34,017 (M:25,729; NM:8,288) Person-years
Data

Model Specification:
Difference-in-differences (DD)
= (CRCscreening reform, post - CRCscreening reform, pre) –
(CRCscreening non-reform, post - CRCscreening non-reform, pre)
Yc,s,t =α + β0 + β1*REFORMt + β2*POSTs + β3*REFORMt*POSTs + Xβ4 + δs + εs,t
Analysis

Model Specification:
Difference-in-difference-in-differences (DDD)
Yc,s,t =α + β0 + β1*REFORMt + β2*POSTs + β3RACEi,y + β4*REFORMt*POSTs + β5*REFORMt*RACEi,y + β6*POSTs*RACEi,y + β7*REFORMt*POSTs*RACEi,y + Xβ8 + δs + εs,t
Yc,s,t =α + β0 + β1*REFORMt + β2*POSTs + β3UNINSi,y + β4*REFORMt*POSTs + β5*REFORMt*UNINSi,y + β6*POSTs*UNINSi,y + β7*REFORMt*POSTs*UNINSi,y + Xβ8
+ δs + εs,t
Analysis
0
10
20
30
40
50
60
70
8019
97
199
8
199
9
200
0
200
1
200
2
200
3
200
4
200
5
200
6
200
7
200
8
200
9
2010
2011
2012
We
igh
ted
Me
ans
(%)
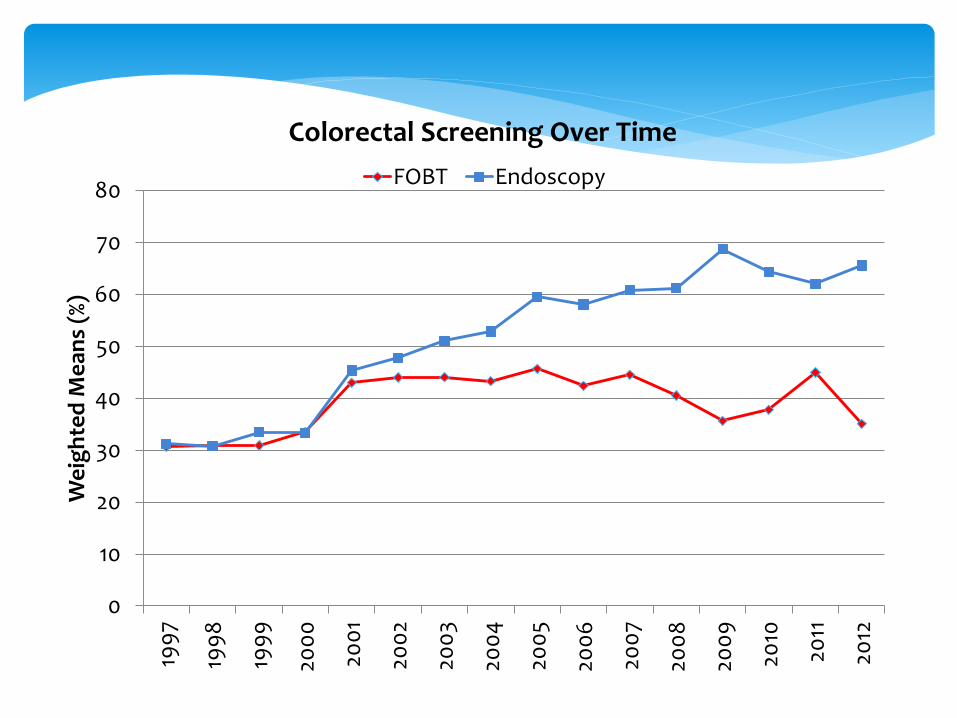
Colorectal Screening Over Time
FOBT Endoscopy
0
10
20
30
40
50
60
70
80
199
7
199
8
199
9
200
0
200
1
200
2
200
3
200
4
200
5
200
6
200
7
200
8
200
9
2010
2011
2012
Me
ans
(%)
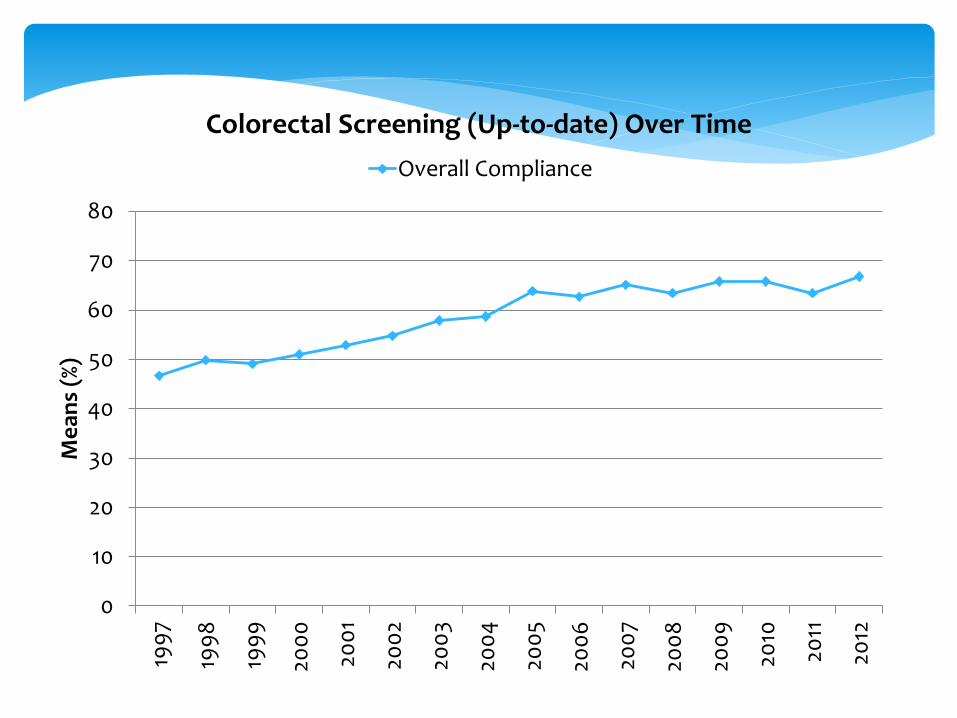
Colorectal Screening (Up-to-date) Over Time
Overall Compliance

Table 1. Descriptive statistics of the study population receiving any colorectal screening, individual characteristics only
Characteristics Received colorectal cancer screening (%)
Yes No
Overall colorectal screening
test (n=1,571,267) 61.55 38.45
Endoscopic test (n=930,547) 95.61 4.39
FOBT test (n=660,167) 35.92 64.08
Mean age +/- s.d. (in years) 66.2 +/-10 63.8+/-11
Mandate state coverage
Yes 61.78 38.22
No 61.13 38.87
Health care reform
Post 64.24 35.76
Pre 58.79 41.21

Table 2. Summary statistics
Characteristics Pre-health care reform Post-health care reform
Mean SD Mean SD
Mean age +/- s.d. (in years) 64.93 10.199 64.76 10.274
Self-reported health status (Fair/poor) 26.99 0.444 28.41 0.451
Covered by health insurance 92.92 0.256 92.02 0.271
Did not see doctor due to medical costs 9.06 0.287 12.53 0.331
Doctor visit 1.29 0.649 1.36 0.691
Presence of a personal physician 93.97 0.238 89.37 0.308
Race/ethnicity
Whites 81.99 0.384 76.67 0.425
Hispanics 3.74 0.190 8.92 0.285
Marital status 51.46 0.500 48.17 0.500
Male 38.42 0.486 39.20 0.488
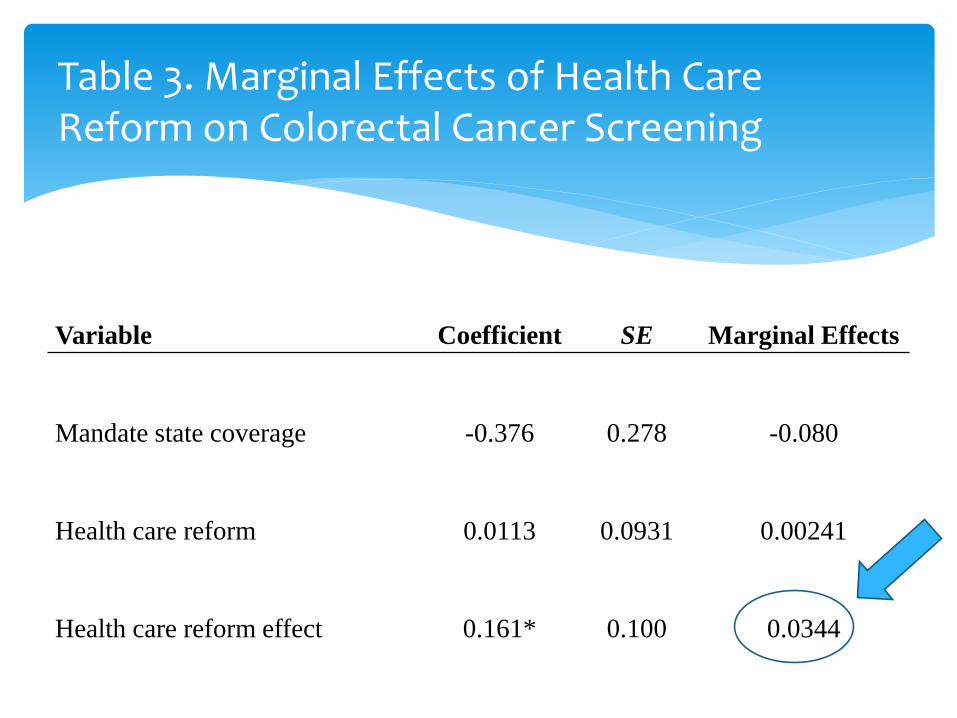
Table 3. Marginal Effects of Health Care Reform on Colorectal Cancer Screening
Variable Coefficient SE Marginal Effects
Mandate state coverage -0.376 0.278 -0.080
Health care reform 0.0113 0.0931 0.00241
Health care reform effect 0.161* 0.100 0.0344

Table 4. Marginal Effects of Health Care Reform on Screening Disparities by Race and Insurance Status
Variable Coefficient SE Marginal Effects
Mandate state coverage -0.291 0.260 -0.0621
Health care reform 0.0452 0.0685 0.00965
Health care reform effect
Nonwhites vs whites/Caucasians -0.120** 0.0594 -0.0257
African Americans vs whites -0.153* 0.0911 -0.0325
Hispanics vs whites -0.0735 0.449 -0.0156
Health care reform effect
Uninsured vs insured -0.228** 0.0963 -0.0487
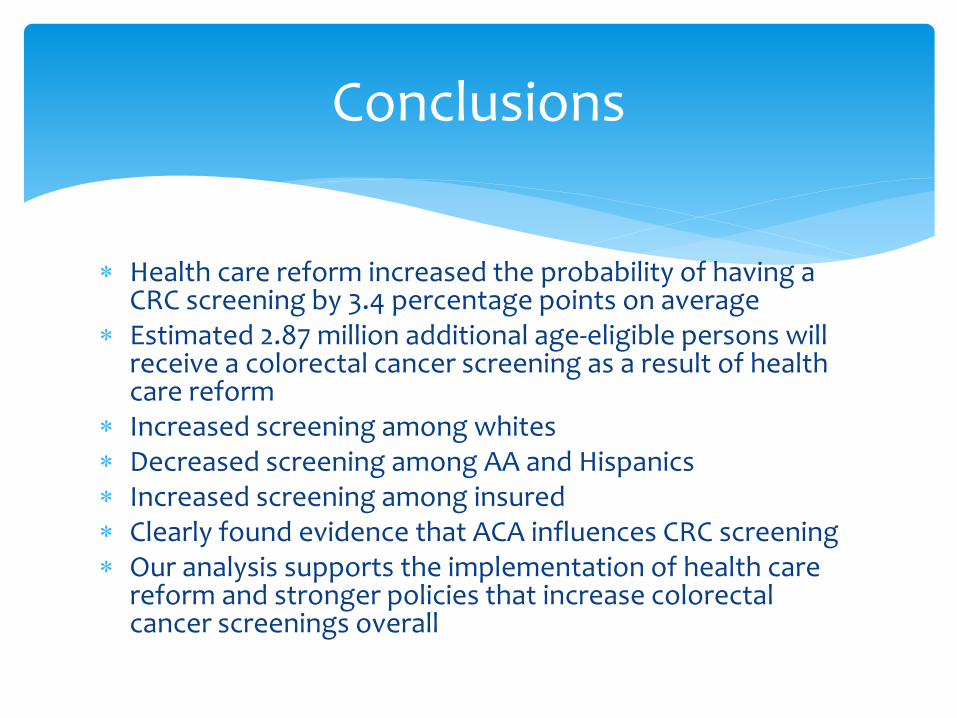
Health care reform increased the probability of having a CRC screening by 3.4 percentage points on average
Estimated 2.87 million additional age-eligible persons will receive a colorectal cancer screening as a result of health care reform
Increased screening among whites Decreased screening among AA and Hispanics Increased screening among insured Clearly found evidence that ACA influences CRC screening Our analysis supports the implementation of health care
reform and stronger policies that increase colorectal cancer screenings overall
Conclusions

This research demonstrates that insurance mandates increased colorectal cancer screenings by reducing out-of-pocket costs
Future health care reforms that increase access to preventive services, such as CRC screening, are likely with low out-of-pocket costs and will increase the number of people who are “up-to-date”
Starting 2014, all US citizens are required to have health coverage Expect demand to increase for CRC screening
Policy Implications

Identify best ways to design health systems for preventive services that target medically underserved populations
Disparities continue to increase with health policies that reduce out-of-pocket expenses. Additional measures are required to reduce disparities in screenings among nonwhites and Hispanics
Important to know if health coverage expansions decrease disparities
Policy Implications (continued)

Supported by the Robert Wood Johnson Foundation funded National Coordinating Center for Public Health Services and Systems Research
Michael A. Preston, Ph.D., [email protected]
@MDonP
Archive: http://works.bepress.com/michael_preston
University of Arkansas for Medical Sciences Cancer ControlLittle Rock, AR
For More Information

Commentary
Glen Mays, PhD, MPH, Professor, U. of Kentucky College of Public Health
Ronda Henry-Tillman, MD, Winthrop P. Rockefeller Cancer Institute, U. of Arkansas for Medical Sciences
Questions and Discussion
Future Webinars – PHSSR Research in Progress All webinars from 12-1 pm, ET
Aug 13 – Quantifying the Value of Public Health Intervention
Theresa Green, PhD, MBA, MS, Center for Community Health, Public
Health Sciences, University of Rochester Medical Center Commentary: Michael Stoto, PhD, Health Systems Administration and
Population Health, Georgetown University
Aug 27 – Priorities in rural health: Cost-effectiveness analysis of fungal
meningitis outbreak in New River Health District
Kaja Abbas, PhD, MPH, Dep’t. of Population Health Sciences, Virginia
Polytechnic Institute and State UniversityCommentary: Kerry Redican, PhD, MPH, Virginia Tech Carilion School of
Medicine and Research Institute and
Molly O'Dell, MD, MFA, Director, New River Health District, Virginia
Department of Health

Future Webinars – PHSSR Research in Progress All webinars from 12-1 pm, ET
Sept 10 – Improving HIV/STD Partner Services Performance in New York State:
A Performance Management Approach
Britney Johnson, MPH, AIDS Institute/Office of Public Health Practice, New
York State Department of HealthCommentary: Sylvia Pirani, MPH, Office of Local Health Services, NYS Dept. of Health
James Tesoriero, PhD, HIV Prevention Director, NYS Dept. of Health
Sept 24 - State Health Department Foodborne Disease Outbreak ReportingFanta Purayidathil, PhD, Health Economics and Outcomes Research, Boehringer Ingleheim
Commentary: Jennifer Ibrahim, PhD, MPH, Dept. of Public Health, Temple University
Oct 8 – Variations in the costs of delivering public health services: An analysis of local health departments in Florida
Simone Singh, PhD, University of Michigan School of Public HealthCommentary: Patrick Bernet, PhD, Florida Atlantic University

Future Webinars – PHSSR Research in Progress All webinars from 12-1 pm, ET
Oct 22 – Relationship Between Public Health Workforce Competency, Provision of Services, and Health Outcomes in Tennessee
Robin Pendley, DrPH, Health Services Management and Policy, College of Public Health, East Tennessee State University
Nov 12 – Trends and Characteristics of the State and Local Public Health Workforce
Angela J. Beck, PhD, MPH, Associate Director, Center of Excellence in Public Health Workforce Studies, University of Michigan
Dec 10 – Integrating Public Health and Healthcare: Lessons from One Urban County
Erik L. Carlton, DrPH, Health Systems Management and Policy, School of Public Health, University of Memphis
Commentary: Paul Erwin, MD, DrPH, Dept. of Public Health, University of Tennessee

For more information contact:Ann V. Kelly, Project Manager
111 Washington Avenue #212 | Lexington, KY 40536
859.218.2317
www.publichealthsystems.org