health care in sri lanka
TRANSCRIPT
H N P D i s c u s s i o N P a P e R
about this series...
This series is produced by the Health, Nutrition, and Population Family (HNP) of the World Bank’s Human Development Network. The papers in this series aim to provide a vehicle for publishing preliminary and unpolished results on HNP topics to encourage discussion and debate. The findings, interpretations, and conclusions expressed in this paper are entirely those of the author(s) and should not be attributed in any manner to the World Bank, to its affiliated organizations or to members of its Board of Executive Directors or the countries they represent. Citation and the use of material presented in this series should take into account this provisional character. For free copies of papers in this series please contact the individual authors whose name appears on the paper.
Enquiries about the series and submissions should be made directly to the Editor Martin Lutalo ([email protected]) or HNP Advisory Ser-vice ([email protected], tel 202 473-2256, fax 202 522-3234). For more information, see also www.worldbank.org/hnppublications.
THe woRlD baNk
1818 H Street, NWWashington, DC USA 20433Telephone: 202 473 1000Facsimile: 202 477 6391Internet: www.worldbank.orgE-mail: [email protected]
HEALTH CARE IN SRI LANKA:
What Can the Private Health Sector Offer?
Ramesh Govindaraj, Kumari Navaratne, Eleonora Cavagnero, and Shreelata Rao Seshadri
June 2014
Pub
lic D
iscl
osur
e A
utho
rized
Pub
lic D
iscl
osur
e A
utho
rized
Pub
lic D
iscl
osur
e A
utho
rized
Pub
lic D
iscl
osur
e A
utho
rized
Pub
lic D
iscl
osur
e A
utho
rized
Pub
lic D
iscl
osur
e A
utho
rized
Pub
lic D
iscl
osur
e A
utho
rized
Pub
lic D
iscl
osur
e A
utho
rized


Health Care in Sri Lanka: What Can the Private Health Sector Offer?
Ramesh Govindaraj, Kumari Navaratne, Eleonora Cavagnero, and Shreelata Rao Seshadri
June 2014
i
Health, Nutrition, and Population (HNP) Discussion Paper
This series is produced by the Health, Nutrition, and Population Family (HNP) of the World Bank's Human Development Network (HDN). The papers in this series aim to provide a vehicle for publishing preliminary results on HNP topics to encourage discussion and debate. The findings, interpretations, and conclusions expressed in this paper are entirely those of the author(s) and should not be attributed in any manner to the World Bank, to its affiliated organizations, or to members of its Board of Executive Directors or the countries they represent. Citation and the use of material presented in this series should take into account this provisional character. For information regarding the HNP Discussion Paper Series, please contact the Editor, Martin Lutalo at [email protected] or Erika Yanick at [email protected].

ii
Health, Nutrition, and Population (HNP) Discussion Paper
Health Care in Sri Lanka: What Can the Private Health Sector Offer?
Ramesh Govindaraj,a Kumari Navaratne,b Eleonora Cavagnero,c and Shreelata Rao Seshadrid
a SASHN, The World Bank, New Delhi, India b SASHN, The World Bank, Colombo, Sri Lanka c LCSHH, The World Bank, Washington, DC d SASHN, Azim Premji University, Bangalore, India
Abstract: This review represents an attempt to bridge — through a systematic collection and analysis of primary and secondary data on the provision, financing, and regulation of health care services — the significant knowledge gaps on the private health sector in Sri Lanka, and foster a dialogue on opportunities for collaboration between the government and the private sector. Key findings of the review are as follows: First, on health service delivery, the private sector in Sri Lanka includes a range of providers; tends to focus primarily on the provision of curative — rather than preventive — and outpatient services; is heavily dependent on the public sector for its supply of human resources; and is concentrated in urban areas. The quality of health care services in Sri Lanka in both the private and public sectors, while better than in most developing countries, still lags behind those offered in more advanced countries. There is also little systematic dialogue and collaboration between the public and private sectors in the delivery of services. Second, on financing, notwithstanding the remarkable success of the public sector in ensuring access to efficient and good quality health services in Sri Lanka, private health expenditure is more than half of total health expenditure — mostly in the form of out-of-pocket payments by households at the point of service delivery — with clear implications for Sri Lanka’s progression toward universal health coverage. Finally, on stewardship and regulation, with the growing private sector, there is a clear and urgent need to bridge the existing gaps in the legal/regulatory framework, and in the enforcement of health regulations applicable to the private sector, as well as to create an enabling environment for more effective private sector participation in the health sector. Overall, the review demonstrates that the private health sector in Sri Lanka is a growing force, due both to greater investment from private players — who recognize the prevailing gaps in the delivery of public services and the evolving demographic and epidemiological profile of Sri Lanka — as well as greater demand from the population, including the poor — for “quicker, cleaner, and more flexible” health care services (Salgado, 2012). In this context, the study highlights areas related to the provision, financing, and regulation of the health sector where a more effective engagement with the private sector could ensure that Sri Lanka is able to offer its citizens universal access to good quality health services, while also stimulating economic growth — in line with the aspirations of Mahinda Chintana, Sri Lanka’s national vision document.

iii
Keywords: Sri Lanka, private health sector, public-private partnership, provision of health services, health expenditures, service utilization, governance and regulation. Disclaimer: The findings, interpretations, and conclusions expressed in the paper are entirely those of the authors, and do not represent the views of the World Bank, its Executive Directors, or the countries they represent. Correspondence Details: Ramesh Govindaraj, Lead Health Specialist, South Asia Human Development, The World Bank, 70 Lodhi Estate, New Delhi - 110003, India; Telephone: +91-4147-9187; e-mail: [email protected].

iv
ACKNOWLEDGMENTS
This paper was authored by Ramesh Govindaraj (Team Leader, SASHN), Kumari Navaratne (SASHN), Eleonora Cavagnero (LCSHN, formerly SASHN), and Shreelata Rao Seshadri (Azim Premji University, India). It draws on field research, data, and transcripts prepared by Colvin Gunaratne (Consultant), Ravi Rannan-Eliya and team (Consultant, Institute for Health Policy, Sri Lanka), and Jinendra Kottalawala (Consultant, Nielson Company, Sri Lanka), under contract with SASHN, as well as Sandya Salgado from the EXT team. The review has benefitted greatly from the support of staff from other sectors, including PREM, FIPSI, and EXT. The assistance provided by Sundararajan S. Gopalan (formerly SASHN, Sri Lanka), Rabia Ali and Owen Smith (both SASHN) in reviewing and commenting on the document, and the support provided by Ajay Ram Dass in formatting the document, is gratefully acknowledged. The study has had consistent support from Darietou Gaye, CD for Sri Lanka and the Maldives, Julie McLaughlin, Sector Manager, South Asia Health, Nutrition, and Population Department and from Kees Kostermans, Lead Health Specialist, which is gratefully acknowledged. The useful comments provided at various stages by the three peer reviewers, April Harding, Daniel Cotlear, and Dr. Saroj Jayasinghe — Professor, Colombo Medical College — are also acknowledged. Finally, the authors are grateful to the private and public sector stakeholders who served as study respondents, and to the officials of the Ministry of Health, who were cosponsors of the study and without whose cooperation this review would not have been possible.

v
Table of Contents ACKNOWLEDGMENTS ....................................................................................................... IV ABBREVIATIONS AND ACRONYMS ............................................................................... VII
SECTION I. INTRODUCTION ............................................................................................. 1
1.1 Background .............................................................................................................. 1 1.2 Rationale .................................................................................................................. 1 1.3 Objectives and Scope ............................................................................................... 3 1.4 Sources and Methods ............................................................................................... 3 1.5 Audience ................................................................................................................... 4
SECTION II. VOICES: PATIENT AND PROVIDER PERCEPTIONS ........................... 6
SECTION III. THE PROVISION OF HEALTH SERVICES ............................................ 9
3.1 The Public and Private Sectors: How Big Are They and What Do They Do? ......... 9 3.2 Public Health Care Provision .................................................................................. 9 3.3 Private Health Care Provision .............................................................................. 10
SECTION IV. HEALTH EXPENDITURES AND UTILIZATION OF HEALTH SERVICES .............................................................................................................................. 25
4.1 Total Health Expenditure ....................................................................................... 25 4.2 Public Financing .................................................................................................... 26 4.3 Private Financing .................................................................................................. 28
SECTION V. GOVERNANCE AND REGULATION ....................................................... 36
5.1 The Law Relating to the Regulation of Private Medical Institutions..................... 36 5.2 Gaps in the Legislative Framework, Implementation, and Enforcement .............. 37 5.3 Implementation/Enforcement of Government-Mandated Reporting ..................... 38
SECTION VI. CONCLUSIONS AND THE WAY FORWARD ....................................... 40
List of Boxes Box 2.1 Health Seeking Behavior of Sri Lankans vis-à-vis Private Providers .......................... 6 Box 2.2 Private Sector Perceptions on Government Regulation and Public-Private Collaboration.................................................................................................................................................... 7

vi
List of Figures Figure 3.1 Year of Establishment of Private Health Facilities Surveyed ................................ 11 Figure 3.2 Distribution of Private Hospitals in Sri Lanka 2011 .............................................. 11 Figure 3.3 Diffusion of High-Technology Equipment in Private Hospital Sector, 1990–201115 Figure 3.4 Barriers and Obstacles Faced by Hospitals for Successful Business Operation .... 17 Figure 4.1 Total Health Expenditure in Sri Lanka by Source of Financing ............................ 25 Figure 4.2 Out-of-Pocket Health Payments (by Expenditure Quintiles), 2010 ....................... 29 Figure 4.3 Structure of Out-of-Pocket Health Payments (by Income Quintile) 2009–10 ....... 31 Figure 4.4 Distribution of Catastrophic Expenditures and Impoverishment (across Quintiles) 2010.......................................................................................................................................... 32 Figure 4.5 Trends in Premiums and Claims for Private Medical Insurance in General Insurance Portfolio (Rs. million), 2000–11 .............................................................................................. 35
List of Tables Table 3.1 Key Public and Private Sector Statistics (2011) ........................................................ 9 Table 3.2 Availability of the Types of Specialized Hospital Beds in the Private Health Sector (N=82) ...................................................................................................................................... 12 Table 3.3 Sources of Revenue to Private Health Facilities Surveyed ...................................... 13 Table 3.4 Factors Determining Private Sector Utilization ....................................................... 15 Table 3.5 Quality Indicators for Patients Admitted with Acute Asthma ................................. 19 Table 3.6 Quality Indicators for Patients Admitted with AMI ................................................ 19 Table 3.7 Quality Indicators for Patients Admitted for Childbirth .......................................... 20 Table 3.8 Process Quality Indicators from Observational Interviews, by Sector .................... 21 Table 3.9 Patient Satisfaction Quality Indicator Outcomes, by Sector.................................... 23 Table 4.1 Share of Health Expenditure for Each Function, by Source of Finance (Percent), 1990–2009.......................................................................................................................................... 27 Table 4.2 Health Expenditure as a Share of Household Total Expenditure ............................ 28 Table 4.3 Health Expenditure as a Share of Household Nonfood Expenditure by Poverty .... 29 Table 4.4 Composition of Out-of-Pocket Expenditure Capita ................................................. 30 Table 4.5 Catastrophic Payments at Different Thresholds, 2010 ............................................ 32 Table 4.6 Catastrophic Expenditures and Impoverishment due to OOPE, 2002–10 ............... 32 Table 4.7 Utilization Rates of Outpatient Services, Sri Lanka — 2006 and 2010 .................. 33 Table 4.8 Reasons for Utilization of Inpatient Services, Sri Lanka — 2006 and 2010 ........... 33 Table 4.9 General and Life Health Insurance Premiums and Claims, 2011 ............................ 34 Table 5.1 Current Practices with Regard to Data Reporting to a Government Agency .......... 38 Table 5.2 Record Systems Maintained by Private Health Facilities ........................................ 38

vii
ABBREVIATIONS AND ACRONYMS
AO Authorized Officer DDG Deputy Director General GDP Gross Domestic Product GOSL Government of Sri Lanka ICU Intensive Care Unit MoFP Ministry of Finance and Planning MoH Ministry of Health MSD Medical Supplies Department NCD Non Communicable Disease NGO Nongovernment Organization OOPE Out-of-Pocket Expenditure OPD Outpatient Department PCR Polymerase Chain Reaction PDHS Provincial Director of Health Services PHI Public Health Inspector PHNS Public Health Nursing Sisters PHSRC Private Health Services Regulatory Council PMIRA Private Medical Institutions Registration Act PPP Public-Private Partnership SLHA Sri Lankan Health Accounts SPHI Supervising Public Health Inspector SPHM Supervising Public Health Midwives THE Total Health Expenditure
1
SECTION I. INTRODUCTION
1.1 Background
Sri Lanka has made remarkable progress in improving the health status of its population. Since the 1920s (Gottret and Schieber 2009), the country has made dramatic strides on key outcome indicators such as life expectancy (75.9 years at birth in 2012 compared to 40.0 in 1930) and child mortality (17 per 1,000 in 2010, down from 175 in 1930) (CIA World Factbook and UNICEF, 2012). Sri Lanka’s achievement is even more remarkable when we consider its level of income and its low expenditure on health. It spends a total (public and private) of approximately 4.2 percent of GDP or US$57 per capita on health (Sri Lanka Health Accounts [SLHA] 2011). Yet, many of its health indicators are comparable to those found in Thailand, Malaysia, and Korea — countries with income levels two to six times higher, adjusting for purchasing power parity, which spend 1.5 to 10.0 times more on health per capita. The Sri Lankan model relies heavily on an effective public delivery system, providing both preventive and curative care with separate dedicated teams for each of these streams. Contrary to the experience of most other countries in South Asia, empirical evidence indicates that the public sector in Sri Lanka has delivered care at low cost with high levels of productivity and efficiency (Hsiao, 2000). One reason for such efficiency might be the strong focus on the inherently more cost-effective preventive and public health services, along with a reasonable level of access to curative services.
1.2 Rationale
While the public sector in Sri Lanka has been remarkably successful in ensuring access to efficient and good quality health services, gaps in the system — such as in the provision of curative care — have persisted. The private sector has stepped in to fill these gaps in curative services in a variety of ways: specialty hospitals catering to the rich, private practitioners (many of whom are also working in the public sector), and a thriving business of private pharmacies and investigative services that cater to rich and poor alike. It is estimated that the private sector in Sri Lanka accounts for 50 percent of total health expenditure. Although this is reason enough to conduct this review, there are several other important reasons, particularly with an eye on the future and given the evolving challenges in the health sector. • Greater purchasing power increases demand for private health services: Sri Lanka is now a
middle-income country. With increasing purchasing power, private health care options — with their perceived benefits of “quicker,” “cleaner,” and “more flexible” service delivery (Salgado, 2012) — are expanding. This expansion of options, combined with the gaps in service delivery and quality in the public system noted above, suggest that the demand for private options for health care may be a growing trend.
• Demographic and epidemiological transitions pose new health challenges: Sri Lanka is now at a crossroads: due to the marked increase in life expectancy and decrease in fertility rates, the country is in the advanced stages of a demographic and epidemiological transition.

2
With the share of the population age 60 years and older expected to double in the next 30 years to 24 percent, it faces the challenge of an aging population. There is also a shift in the disease profile, with non-communicable diseases (NCDs) now accounting for 85 percent of the total burden of disease (Government of Sri Lanka 2011). Servicing the needs of the elderly, as well as treating and managing NCDs, requires longer-term and more expensive services relative to maternal and child health and infectious disease interventions.
• Increasing NCD burden risks exacerbating inequalities in health care access: The poor become particularly vulnerable as the incidence of NCDs rises. This is likely to mean out-of-pocket payments for needed medicines and investigative services, which are both costlier and require sustained usage. There is a real risk that this trend could compromise Sri Lanka’s stellar record in protecting the poor against catastrophic and impoverishing health expenditures.
• The evidence-base for the private sector in health is weak: Despite the strong interrelationship between the public and private sectors, the private sector is generally not well understood by policy makers. The paucity of information is an important reason for the suboptimal participation of the private sector in the achievement of public health objectives; in fact, prior to this review, no systematic assessment of the private health sector had been undertaken in Sri Lanka.
• Both the public and private sectors now see value in engaging with each other: The Mahinda Chintana — the government’s vision document for 2011–16 — has spelled out the country’s aspirations in the health sector. In the recent past, there has been an increasing recognition within the Ministry of Health (MoH) and in the Ministry of Finance and Planning (MoFP) of the imperative of engaging with the private sector to achieve these aspirations. At the same time, there appears to be considerable interest on the part of private sector actors to partner with the government for mutual benefit. This is therefore an opportune time to foster a discussion on the joint provision of services at an affordable cost, with better regulation of quality across the sector.
In sum, even as Sri Lanka aspires to improve the quality of existing health care and transform the sector into one that caters to economic growth as well as to social inclusion, the country faces fresh challenges posed by the aging population and the growing burden of NCDs. This clearly warrants fresh thinking on how to finance and deliver health services in the future. As the public system in Sri Lanka is quite well documented, there was widespread agreement among stakeholders in the health sector and beyond, including the MoH, the MoFP, and opinion leaders in the private sector, that future reforms of the health system would benefit from analytical work that sheds light on the current functioning of the private sector and ways in which it could contribute to public sector goals. Accordingly, an agreement was reached with the government that this review of the private health sector would be undertaken by the World Bank, in close concert with the Private Sector Development Unit within the MoH.
3
1.3 Objectives and Scope
The overall objectives of this review are to better understand the private health sector in Sri Lanka, particularly its financing, provision, and regulation, and to foster a dialogue on opportunities for increased collaboration between the government and the private sector. The review seeks to achieve these objectives by engaging in the following: • Improving the evidence-base on the characteristics of private provision of health care
services and the use of medicines; • Deepening the current understanding of the nature of private expenditures in the context of
the overall utilization and financing for health; and • Clarifying certain aspects of the interaction between the public and private sectors, including
government regulation of private providers, as well as the perceptions of the public sector about the private sector and vice versa.
Conscious choices had to be made to limit the scope of this review, given data, resource, and time constraints, as well as the complexity of the private health sector. In particular, while recognizing the importance of such issues, the review does not include a comprehensive treatment of alternative health providers, medical equipment, hygiene products, and other such health-related commodities. A detailed assessment of the consumer perspective, of labor market issues, and of public-private partnership opportunities was not feasible in this review, but these are important areas for follow-up assessments. Finally, a fiscal space analysis, an analysis of costs and prices in the public/private sectors, and an in-depth assessment of the investment climate and business environment for private sector participation in the health sector are beyond the scope of this review.
1.4 Sources and Methods
The paper draws upon the existing published and grey literature, as well as the following studies that were undertaken as a part of this private sector review:1 • Quality of Healthcare Services in Public and Private Health Facilities in Sri Lanka: This
study assessed the quality of care in the public and private sectors in Sri Lanka. For assessing the quality of inpatient care, the study looked at process quality, that is, what providers actually do. The approach included a retrospective review of patient medical records and an analysis of care using tracer conditions. For outpatient care, both process quality and the quality of outcomes were assessed through observation of patient consultations, followed by an exit interview of the patient. An analysis of care using tracer conditions and general indicators was also undertaken. Criteria for selecting the three tracer conditions (acute myocardial infarction, acute asthma, and childbirth) were (i) the frequency of the conditions; (ii) the existence of viable quality indicators, with support in the literature; and (iii) their representativeness over a range of conditions and patient populations. The survey was confined to three districts for reasons of cost and time.
1. Summaries of all background studies are provided in annex 1.

4
• A Private Health Sector Facility Mapping in Selected Areas of the North Western Province was undertaken utilizing geographic information system (GIS) technology and providing a description of private health sector facilities in four Divisional Secretary areas of the North Western Province. The objective of the mapping was to better understand the existing distribution of private health facilities in relation to public facilities, to improve the inter-linkages between these facilities and expand the range of options available to people seeking health services. The exercise mapped and photographed private health service points; described the private health facility’s current registration status with the Ministry of Health or any other authority; and identified geographical relationships between private and public health facilities. This exercise also facilitated an assessment of the reliability of the information on private health facilities collected by the MoH.
• A Selected Private Health Sector Review: This study profiled selected dimensions of private health sector activity using, among other sources, information from Private Health Services Regulatory Council (PHSRC) licensing data, the IMS-Health Database, survey data from the Institute for Health Policy (IHP) Private Hospitals Database, the Sri Lanka SLPA, the MoH, the Medical Supplies Department (MSD), and the Consumer Finance Survey (CFS) 2004.
• Management Practices Survey in the Health Sector: As part of this review, an assessment of management practices in the private health sector was conducted for the first time in Sri Lanka from June to November 2011, using a globally accepted methodology developed by the World Bank Group. The objective of the structured questionnaire-based survey was to understand the private health sector in terms of its type, size, level of services, and facilities.
• Analysis of Household Health Expenditures in Sri Lanka: Impacts and Trends: This analysis examined out-of-pocket expenditures (OOPEs) and catastrophic expenditures by income quintiles and type of health care provider. The analysis drew upon the Household Income and Expenditure Surveys 2002, 2007, and 2010 (Department of Census and Statistics) and representative data at provincial and national levels. The study analyzed the burden of OOPE based on this data; catastrophic expenditures (measured as expenditures that exceed a predefined fraction of household income); as well as expenditures that impoverished households, pushing them below the national poverty line.
• Review of Regulations Governing Provision of Health Care in the Private Sector in Sri Lanka: This review examined existing legislation and regulations to identify gaps in the legislative framework, and assess how well the existing legislation and regulations were being enforced or implemented. It also recommended steps to enhance the existing regulatory framework and explored the potential for public-private partnerships in health.
1.5 Audience
The audience for this work includes the following: (i) Policy makers in the MoH and MoFP and provincial authorities responsible for formulating,
financing, and implementing Sri Lanka’s health sector strategy;

5
(ii) Domestic and international stakeholders, including development partners, with an interest in the Sri Lankan health sector; and
(iii) Private sector leaders, particularly those interested in partnerships with the public sector, as well as investors with an interest in the private health sector in Sri Lanka.
It is our hope that the review will serve as a stepping stone toward a common understanding of the issues and will foster a policy dialogue that might lead to an agreed way forward on private sector participation in the health sector. The rest of the paper is organized as follows: Section 2 provides a snapshot of patient perceptions of health care services and health-seeking behavior in the private sector; section 3 describes the provision of selected products and services in the private sector; section 4 reviews trends in the magnitude and distribution of household out-of-pocket expenditure on health, and the utilization of privately provided health care; section 5 describes the regulatory framework that governs private health sector service delivery and quality standards; and section 6 provides overarching conclusions and, as a starting point for a public-private policy dialogue, identifies options for tapping into the potential of the private sector to contribute to public sector goals.
6
SECTION II. VOICES: PATIENT AND PROVIDER PERCEPTIONS
To set the context for the analysis presented in subsequent sections of this paper, we first examine the voices of two critical stakeholders in the provision and utilization of health services: patients and private sector health care providers. 2.1. Voices of the People To get a quick sense of the issues that were of immediate concern to Sri Lankans while choosing between public and private provision of health services in Sri Lanka, responses were elicited at the beginning of this review from approximately 100 males and females belonging to different social classes and geographic locations. Overall, the respondents spoke about three broad issues: health-seeking behavior, health-related expenditure, and attitudes and perceptions toward public and private health services in the country. These responses are summarized in box 2.1 below.
Box 2.1 Health-Seeking Behavior of Sri Lankans vis-à-vis Private Providers Perceived quality of public health services: The group had a favorable view of public health services on several counts: universal access to health services for all Sri Lankans, irrespective of class or creed was primary. Its dependability, quality of doctors and nursing staff, and quality of services in most instances were applauded. Several common negatives were also identified: a shortage of medicines, equipment, and facilities for medical investigations was highlighted, which created a huge burden on the poor, by necessitating out-of-pocket expenditure in a country that purports to provide “free” health care for all. Lack of privacy during consultations and inability to access a provider of their choice and remain in their care were also mentioned. Reasons for choosing the private sector: The private sector was seen as having certain advantages: the main one was the convenience factor. In addition, the comfort of knowing the patient could select the specialist of his or her choice, and continuity with the same doctor were also considered important reasons to seek private health services. Greater confidentiality in private settings as compared to public facilities was also identified as an important factor. While people were choosing private providers for the reasons mentioned above, they did express concerns about the cost of care in the private sector. Out-of-pocket expenditure on medicines and laboratory investigations has contributed to the galloping cost of health care despite the country’s free health care policy. While patients had no idea what the public sector health services cost the government, the exorbitant medical bills charged by the private hospitals were a grave concern. There was a plea that private hospitals indicate an approximate cost for patients prior to major treatment procedures to promote greater transparency and facilitate informed decision making. Coverage of health insurance was minimal. For those with no insurance, out-of-pocket expenditure for medicines and laboratory tests has become prohibitive. Even those with personal health insurance coverage (which only covers a small proportion of the population) faced substantial hurdles in settling legitimate claims: so much so, they often abandoned the effort. A different view was expressed by those who had insurance cover as a perquisite of their employment package. While a significant proportion of the expenses were covered by the company providing the insurance policy, there were several exceptions that had to be borne by the insured. Some respondents were open to the idea of government charging a nominal fee for health services, provided that medicines and laboratory-service standards were improved. Lack of transparency and credibility of private sector services was a grave concern across the board. The
7
establishment of an independent governing body to maintain standards and provide accreditation was stated as an important step toward developing a more standardized private health sector in the country. Across all respondents there was a consensus that there were unofficial ties between certain private sector health care providers and government institutions, which gave these service providers an undue advantage over their competitors. The fact that over 95 percent of private practitioners were also working with the government (even the large private hospitals are primarily staffed by doctors – especially specialists — who are also on the government payroll) makes such a nexus easy to establish and sustain. Source: Salgado, 2012.
2.2. Voices of the Private Sector The review also sought the views of stakeholders from the private sector, including representatives of private hospitals, industry associations, private insurance companies, independent medical practitioners, and private training institutions. The views of these representatives of the private sector and key issues raised by them are summarized in box 2.2.
Box 2.2 Private Sector Perceptions on Government Regulation and Public-Private Collaboration Private Medical Institutions Registration ACT (PMIRA) and Registration/Accreditation Requirements: The private sector respondents did not highlight significant shortcomings in PMIRA except for two issues: (1) large numbers of stand-alone medical testing laboratories, pharmacies, and consulting centers (“Channeling Centers”) have not been registered and are functioning unchecked; and (2) unqualified practitioners or quacks were practicing freely as allopathic or Ayurveda doctors. Respondents were unanimous in stating that all private sector health care institutions should be registered, inspected at regular intervals, and graded and accredited — according to predefined criteria relating to the services offered by an appropriate independent authority specifically appointed for the purpose. They, however, were keen to ensure that the same principles for accreditation were applied in both the public and private sectors. They also felt that the enforcement by the regulators of the provision of the act was suboptimal and that this needed to be addressed. Compliance by the Private Sector of Government’s Standards and Reporting Requirements: Respondents noted that the private sector was not homogenous, and consisted of entities of various sizes with different functions; as such they felt that “one size could not fit all” in terms of government regulation. Respondents indicated that the larger private institutions were, by and large, complying with these requirements. In fact, some private hospitals have invested in building up their own monitoring and reporting systems. They acknowledged that smaller facilities may not be fully compliant with the government’s quality standards and reporting requirements, but insisted that the government also needed to do more to inform and educate such institutions on what data were needed and why, and also why this was also in the interest of the private sector. Services offered by private hospitals, including the training of “private” nurses: Respondents felt that, in general, the facilities and services offered in the private hospitals are satisfactory. They highlighted two constraints: (1) the training of nurses by private hospitals, which is recognized by neither the Sri Lanka Medical Council (SLMC) nor the Sri Lanka Nursing Council (SLNC) and therefore does not lead to the registration of these nurses; and (2) the private medical institutions’ (PMIs)’ inability to offer 24-hour cover by an in-house senior medical officer employed on a permanent or long-term contract basis. The respondents claimed that nurses employed in their hospitals are being trained according to “an approved curriculum.” The approval is stated to be from the Director General of Health Services (DGHS) and/or the Private Health Services Regulatory (PHSR) Council. In most cases, the training of nurses is undertaken in-house, but is sometimes outsourced to either the Aquinas University (private university) or the Open University of Sri Lanka (government university). As such, the respondents felt that these nurses should be formally recognized.

8
Contracts between private hospitals and pubic doctors using these facilities for private practice: The respondents felt strongly that the practice of public doctors being permitted to practice in the private sector should continue. Only a few private hospitals, however, could confirm that the government consultants/specialists who use their hospitals for private practice (outpatient consultations, invasive investigations, and surgical operations) during off-duty hours have signed a legally valid (and therefore enforceable) contract with the relevant hospital. Informal discussions with such doctors indicate that the vast majority of them have not signed any kind of contract with the private hospital(s) where they engage in private practice. The absence of enforceable contracts raises issues of accountability of doctors to the hospitals and, more importantly, to patients. Quality of Foreign Consultants/Specialists: The respondents defended their use of foreign consultants/specialists to run their facilities. They indicated that, as far as the quality of foreign doctors employed is concerned, there was a set procedure, wherein the SLMC and relevant colleges of specialists (for example, College of Surgeons, College of Anesthesiologists) have the final say in approval and registration. Their principal complaint was that the process took a long time. Other stakeholders have, however, raised questions about the feasibility of judging the competence of highly specialized surgeons on the sole basis of paper qualifications and curriculum vita. They also suggested that the willingness of foreign specialists to accept lower remuneration might be influencing their selection by the private hospitals. Opportunities for Development of the Private Sector and Public Private-Collaboration: The respondents made a forceful case that they were equal participants in the provision of health care services to the population at large. They felt that the private sector could be a valuable ally to the government in expanding the range and scope of health services offered to the population. They particularly highlighted the areas of diagnostics (radiological investigations, laboratory services), management of non-communicable diseases, and the diagnosis and treatment of some selected communicable diseases (for example, TB) as having the most potential for such collaboration. Some respondents felt that the government needed to do more to encourage the private sector; in particular they argued for a reduction in the 18 percent interest rate charged on loans to the private health institutions. They also suggested that health insurance could be used by the government to finance and incentivize the private sector, where and when appropriate. They also argued for a forum through which regular interactions between the private sector and the government could be sustained. Source: Focus Group with Private Sector Stakeholders, 2012.

9
SECTION III. THE PROVISION OF HEALTH SERVICES
This section provides a broad overall picture of the health service–delivery landscape in Sri Lanka, and explores further the relative roles played by the public and private sectors across several dimensions of health service provision.
3.1 The Public and Private Sectors: How Big Are They and What Do They Do?
The Annual Health Bulletins published by MoH provide important insights into the relative roles of the public and private sectors in health care provision in Sri Lanka. The 2008 bulletin shows that virtually all preventive care is provided by the public sector, with only a minimal contribution from the private sector. In the case of curative care, however, the picture is somewhat different. Outpatient care is split almost evenly between the public and private sectors, with the private sector providing marginally more. In the case of inpatient care, on the other hand, private provision is small at about 5 to 10 percent, with the remainder being provided by the public sector. The role played by nongovernment organizations (NGOs) in providing health care is marginal, except for their important role in family planning. The populations living in the plantation areas mainly receive curative health services through the Plantation Human Development Trust, and some services through the public health system. This picture has not changed significantly since 2008, as evidenced by the data presented below.
3.2 Public Health Care Provision
Sri Lanka has an extensive public health care system. There were a total of 1,067 public hospitals and outpatient facilities in 2011: 592 hospitals with inpatient facilities providing various levels of inpatient and outpatient care, and 475 central dispensaries providing only outpatient care. The government employs more than 90 percent of all practicing doctors and nurses in the country, and operates more than 90 percent of the hospital beds. The majority of the population has reasonable access to a public health care facility (with the private sector playing a supportive role). On average, Sri Lankans are within 1.4 kilometers of a basic health clinic and 4.8 kilometers from a free government-sponsored Western-type health care facility. It is also important to note that most health facilities are small; fewer than 10 percent have 100 or more beds.
Table 3.1 Key Public and Private Sector Statistics (2011) Private hospitals MoH hospitals Private share (%) Number of institutions
125 592 17
Beds 4,210 70,000 6 Inpatient admissions
0.27 million >5.5 million 5
Outpatient visits 4.70 million >49.0 million 9 Source: Rannan-Eliya, 2012.
10
The public curative health system is organized in three tiers. Public curative services are organized into three levels of care, depending on the size and the facilities offered by the institution, namely: primary, secondary, and tertiary care institutions. Primary care–level institutions include a range of institutions: central dispensaries, maternity homes, rural hospitals, peripheral units, and divisional hospitals. All of them offer non-specialist inpatient and outpatient care, except central dispensaries, which offer only outpatient care. Secondary care institutions include base hospitals, district general hospitals, and provincial hospitals. These hospitals, in addition to providing outpatient care, have general surgical and medical units, at least one obstetric or gynecology unit, and a pediatric unit. Some of these hospitals also have other special units. Tertiary care institutions — teaching hospitals and a few provincial general hospitals — have all the facilities of secondary care institutions as well as other specialties, including ultra-specialist units such as neurology and cardiology, and certain specialized hospitals such as for cancer. The public sector manages the core of the preventive health system, providing services through 310 divisional health units known as Medical Office of Health areas, which cover the entire country. Four of these units are managed by the Municipal Council and the others are managed by the provincial health authorities. A Medical Office of Health unit is a preventive and primary health care team, led by a medical officer, and comprising public health nursing sisters (PHNSs), supervising public health midwives (SPHMs), supervising public health inspectors (SPHIs), and public health inspectors (PHIs) and usually covers a defined geographic area with a population of 50,000 to 100,000. The medical officer of health also coordinates the smaller curative care institutions and other local bodies in the area. Comprehensive antenatal, natal, and postnatal care, family planning, well women services, immunization, nutrition services, communicable disease prevention, school health, and environmental and occupational preventive services are all provided free of charge. While pilot interventions to expand the services for mental health and other NCDs are in place, the package of preventive health services are yet to include NCD prevention and promotion services in a systematic and comprehensive manner.
3.3 Private Health Care Provision
The data presented below is based on the Management Practice Survey undertaken as part of this review.
3.3.1 Trends in the Establishment and Distribution of Private Facilities
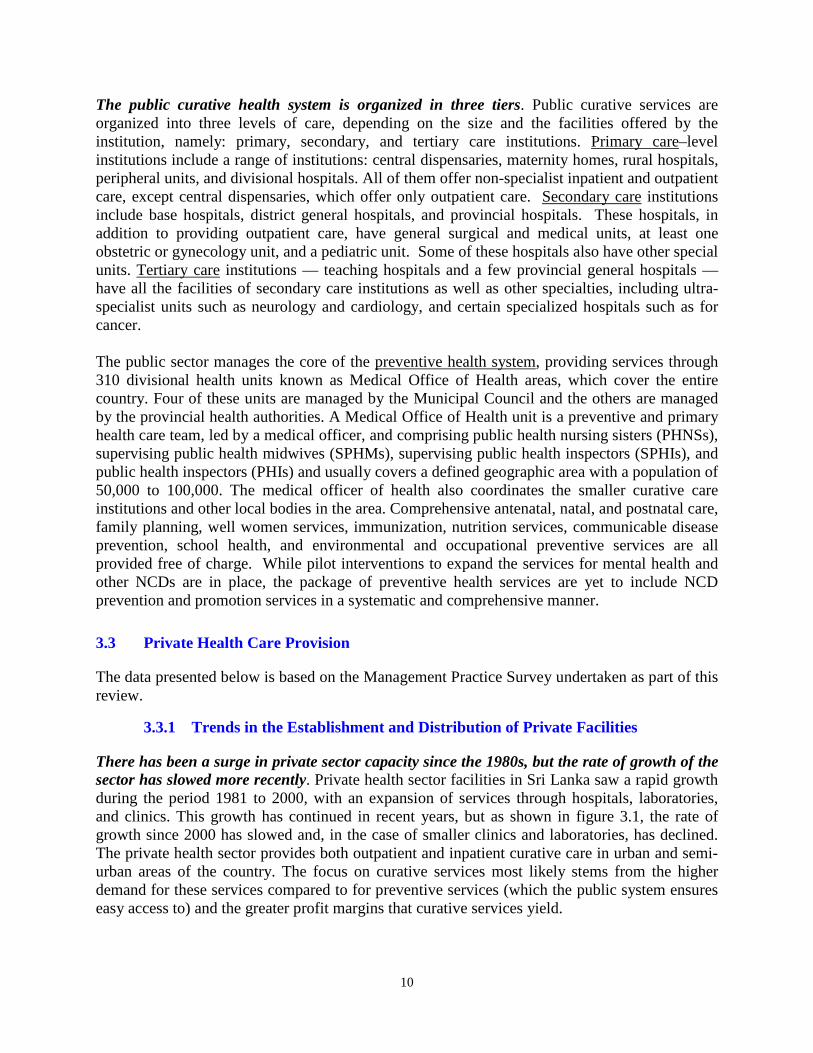
There has been a surge in private sector capacity since the 1980s, but the rate of growth of the sector has slowed more recently. Private health sector facilities in Sri Lanka saw a rapid growth during the period 1981 to 2000, with an expansion of services through hospitals, laboratories, and clinics. This growth has continued in recent years, but as shown in figure 3.1, the rate of growth since 2000 has slowed and, in the case of smaller clinics and laboratories, has declined. The private health sector provides both outpatient and inpatient curative care in urban and semi-urban areas of the country. The focus on curative services most likely stems from the higher demand for these services compared to for preventive services (which the public system ensures easy access to) and the greater profit margins that curative services yield.
11
Figure 3.1 Year of Establishment of Private Health Facilities Surveyed
Source: Navaratne et al, 2012.
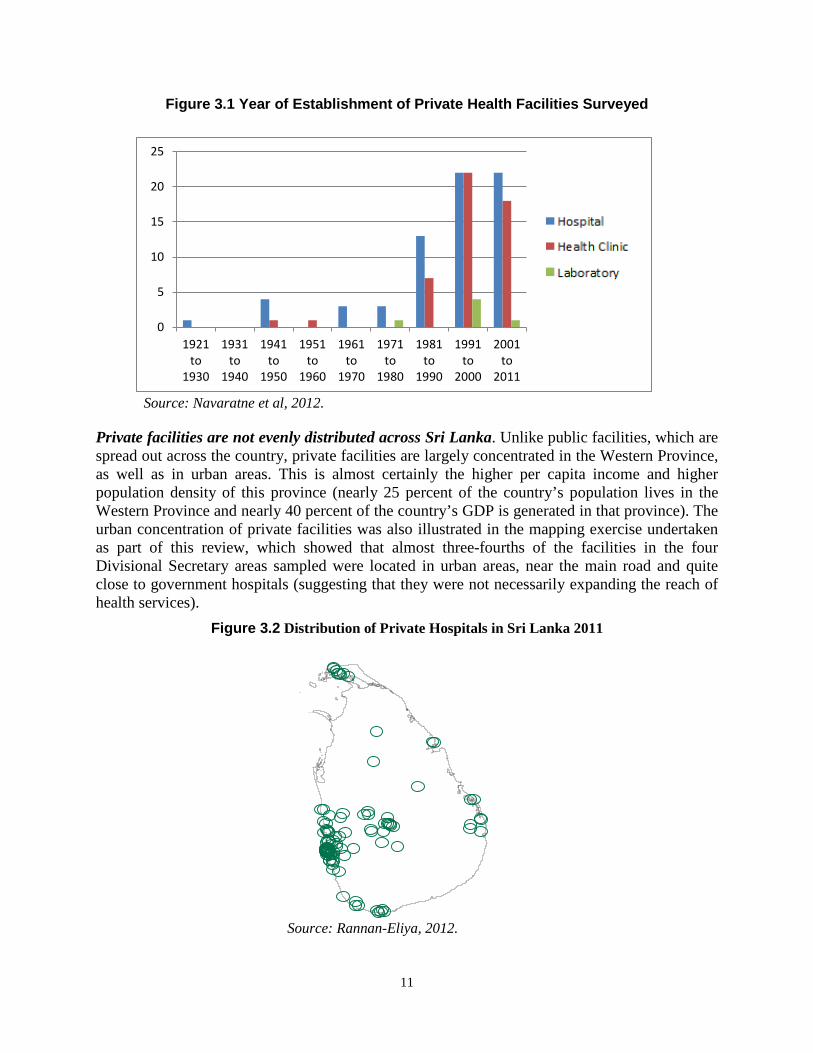
Private facilities are not evenly distributed across Sri Lanka. Unlike public facilities, which are spread out across the country, private facilities are largely concentrated in the Western Province, as well as in urban areas. This is almost certainly the higher per capita income and higher population density of this province (nearly 25 percent of the country’s population lives in the Western Province and nearly 40 percent of the country’s GDP is generated in that province). The urban concentration of private facilities was also illustrated in the mapping exercise undertaken as part of this review, which showed that almost three-fourths of the facilities in the four Divisional Secretary areas sampled were located in urban areas, near the main road and quite close to government hospitals (suggesting that they were not necessarily expanding the reach of health services).
Figure 3.2 Distribution of Private Hospitals in Sri Lanka 2011
Source: Rannan-Eliya, 2012.
0
5
10
15
20
25
1921to
1930
1931to
1940
1941to
1950
1951to
1960
1961to
1970
1971to
1980
1981to
1990
1991to
2000
2001to
2011

12
3.3.2 Health Facility Organization and Ownership
The Private sector consists of a range of providers. Private health facilities are of three types: hospitals (specialized or general), clinics (specialized or general), and laboratories. Private hospitals provide inpatient care, with an estimated 4,210 beds in the private sector (table 3.1). Of these, approximately 50 percent are in Colombo, and the rest are distributed across a few districts (for example, Kandy, Galle, Kurunegala, and Anuradhapura) in small hospitals or clinics with approximately 20 to 30 beds each. The pharmacies, laboratories, imaging facilities, and individual medical practitioners provide ambulatory care. Over half (56 percent) of the hospitals and 41 percent of the clinics surveyed had more than five employees. Among them, 66 percent provided inpatient care. 44 percent of the health facilities had 1 to 19 beds; another 44 percent had 20 to 99 beds, while 12 percent of the health facilities had more than 100 beds; Of all health facilities surveyed, 72 percent had at least one operating theater. Among the 82 inpatient facilities surveyed, 59 percent did not have any intensive care unit (ICU) beds; 74 percent did not have pediatric ICU beds; 77 percent did not have beds in the cardiology unit. Of all hospitals surveyed, 28 percent reported an increase of their hospital bed strength during the past three years.
Table 3.2 Availability of the Types of Specialized Hospital Beds in the Private Health Sector (N=82)
Type of hospital specialist bed
Number of hospitals with at least 3 specialist
hospital beds
Hospitals with at least 3 specialist
hospital beds (%)
Internal medicine 72 88 Pediatrics 55 67 Surgery 61 74 Gynecology and obstetrics 52 63 ICU adults 34 47 ICU pediatrics 21 26 Cardiology 19 23
Source: Navaratne et al, 2012. Public-Private Partnership in ownership is minimal. Nearly 98 percent of the private health sector facilities (all categories and all sizes of facilities) are owned and operated by private domestic individuals, companies, or organizations. None of these is in partnership with government; 3.5 percent of the medium-size (more than 20 but less than 99 staff strength) facilities have a foreign partnership. The largest involvement of the private foreign investment is in hospitals; none of the smaller clinics are supported by private foreign investors. Nearly 74 percent of the health facilities have single owners; 88 percent of the small clinics (less than five employees) and 60 to 65 percent of the medium and larger hospitals and laboratories were owned by a single individual. As much as 75 percent of private outpatient care was

13
provided by a sole proprietor, some of whom contract one or more practitioners as employees (Health Policy Research in South Asia, World Bank 2003). This finding was also confirmed in the mapping of private facilities in four Divisional Secretary areas undertaken as a part of this review. Government support for private participation in public health programs is limited. A review of the technical and financial support by the government to the private sector for participation in national public health programs found that, between 2007 and 2010, about 25 percent of the reviewed facilities had received technical assistance, and 10 percent had received financial assistance for their childhood vaccination program; 27 percent and 9 percent, respectively, for their family planning program; and 25 percent and 8 percent, respectively, for antenatal care. The TB program received relatively less technical and financial assistance at 14 percent and 5 percent, respectively.
3.3.3 Sources of Revenue
Most revenues are generated through out-of-pocket expenditure. In 40 percent of the private health facilities reviewed, all their revenue was directly received from patients. In 81 percent of the facilities, 75 to 100 percent of the revenue was from patients. Revenue from private health insurance played a minor role with 49 and 69 percent of the facilities not receiving payments from private insurance and employer-paid insurance schemes, respectively. The President’s Fund (a program to assist patients in defraying the costs of major surgical procedures in the private sector) had financed less than a fifth (20 percent) of the total revenue in 10 percent of the health facilities surveyed. On average, 86 percent of total revenue to private health facilities comes from direct payments by patients (table 3.3).
Table 3.3 Sources of Revenue to Private Health Facilities Surveyed Description of source of revenue to health
facilities
Mean revenue
(%) (N=124)
Mean revenue (%) in small
facilities (N=48)
Mean revenue (%) in
medium-size
facilities (N=55)
Mean revenue (%) in
large health facilities (N=21)
Direct payments by patients
86.0 95.0 85.0 68
Private health Insurance
6.0 2.0 6.0 16
Private company 3.0 0.7 4.0 7 President’s Fund 0.6 0.0 0.3 3 Other sources (Ministry of Health, other organizations)
2.4 2.3 4.7 6
Source: Navaratne et al, 2012.

14
3.3.4 Service Availability Outpatient services: 46 percent of the private health facilities in the sample provide comprehensive (24 hours, 7 days of week) outpatient services, while 29 percent provide outpatient department (OPD) services for 12 hours daily. About two-thirds (65 percent) treated more than 5,000 outpatients in 2010. Half of the health facilities reported an increase of outpatients during the years 2007 to 2010. Convenient access is noted to be a primary reason for increased utilization of OPD services through the private sector. Availability of drugs in the OPD: The survey attempted to assess the availability of selected NCD-related drugs, that is, anti-asthmatic drugs (salbutamol inhalers); anti-diabetic drugs (glibenclamide and soluble insulin); heart diseases–related drugs (streptokinase, atenolol, captopril, enalapril, simvastatin); and mental health–related drugs (amitriptaline). Of the facilities surveyed, 74 percent stocked all these drugs on their premises. Inpatient bed occupancy rates: In 2010, 70 percent of the hospitals reported an increase of more than 50 percent in bed occupancy, and 37 percent of the hospitals had more than 1,000 inpatient admissions on average. During 2007 to 2012, 43 percent reported an increase in bed occupancy rates, while the others reported that they remained at the same occupancy levels, and 26 percent reported a reduction in bed occupancy. The mean bed occupancy rate is 71 percent, with the medium-size health facilities reporting the highest occupancy rates at 74 percent, followed by the larger facilities reporting 72 percent bed occupancy, and smaller facilities reporting 61 percent bed occupancy. Laboratory testing facilities: Of the 124 private health facilities assessed, a majority (88 percent) was providing laboratory services (91 percent of the hospitals and 82 percent of the clinics). None of the facilities were providing the total spectrum of laboratory tests identified in this survey (including enzyme tests for heart diseases, total cholesterol tests, total iron binding tests, glycosylated hemoglobin test, Polymerase Chain Reaction (PCR) tests for identified diseases, blood culture and cytology, and other molecular biology tests). Overall, this review found that the availability of high-end medical equipment for testing and laboratory services has grown dramatically in the private sector. Figure 3.3 illustrates the growth in the numbers of CT scanners, MRI scanners, mammography units, and lithotripters in private hospitals in Sri Lanka between 1990 and 2010.

15
Figure 3.3 Diffusion of High-Technology Equipment in Private Hospital Sector, 1990–2011
Source: Rannan-Eliya, 2012. Perceived quality and customer relationships, rather than price, determine competiveness of private facilities: As shown below, when the owners/managers of private facilities were asked about the most important factors in determining the competitiveness of their establishment, they highlighted (1) the perceived (higher) quality of care they provided, and (2) the long-term relationships they had established with their clients. These two factors constituted over 90 percent of the total responses, while price was only mentioned as a consideration by 9 percent of the respondents. This finding suggests that if the public sector does not provide continuity of care and a full range of services (particularly those associated with the increased incidence of NCDs), patients are likely to gravitate increasingly to the private sector.
Table 3.4 Factors Determining Private Sector Utilization
Factors Percentage
Price 9
Quality 44
Long-term relationship with customers 46
Source: Rannan-Eliya, 2012.
13
6
9 3
-
5
10
15
20
25
30
35
1990 1992 1994 1996 1998 2000 2002 2004 2006 2008 2010
CT scannersMRI scannersMamography unitsLithotripters

16
Barriers to Health Facility Operation
Shortage of health-related human resources was identified as the most important barrier to the growth of the private health sector. Approximately a fifth (19 percent) of the health facilities had fewer than ten full-time staff, defined as paid employees who were contracted for a term of one or more years, and/or a guaranteed renewal of their employment contract, and who work a full shift each day. Only about 15 percent of the health facilities had more than 100 full-time employees. Of health facilities, 28 percent identified the shortage and/or restricted availability of a specialized health labor force as a major constraint to the delivery of services (figure 3.4); 15 percent of the facilities identified the unavailability of specialist doctors; 10 percent, the paucity of qualified nurses; and 2 percent, the shortage of laboratory technicians, as the most important barrier to operating a health establishment. Limited access to finance, competition from providers, and restricted access to land were identified as the other important obstacles to the development of the private health sector in the country. Government regulations were not identified as a major constraint. A majority (81 percent) of the health facilities reported that, on average, they spent less than two hours (of a total of ten management hours) dealing with requirements related to government regulations. Almost all (98 percent) of the health facilities were registered with the MoH, while only the two unregistered facilities suggested that the time required to complete the registration process constituted a barrier.

17
Figure 3.4 Barriers and Obstacles Faced by Hospitals for Successful Business Operation
Source: Navaratne et al, 2012.
3.3.5 Human Resource Situation in the Private Sector
Most private practitioners are also public sector doctors. The government of Sri Lanka (GOSL) has permitted private medical practice by public sector health staff outside of their official hours of duty since 1977. As a result, a majority of medical staff in the private sector also works in the public sector. In 2011, only about 700 medical officers worked full-time in the private health sector, of which about 450 were registered with the Independent Medical Practitioners Association of Sri Lanka. There were 16,500 medical officers in the public health sector, of whom about 4,750 worked part-time in private hospitals (Central Bank of Sri Lanka, Annual Report 2011). Furthermore, an unknown number of partially qualified or unqualified practitioners worked through pharmacies, laboratories, and directly in clinics. With the growing demand for private health services and the increased need for regulation of the sector, GOSL introduced a Private Health Medical Regulations Act in 2008, which requires private health institutions to be registered with the MoH. More information on the act and its implementation is provided in section 4 of this paper. The private sector is heavily reliant on the public sector for delivering general and specialist medical services. Of private health facilities, 70 percent have general medical officers who work on a part-time basis, and 86 percent engage specialist medical officers on a part-time basis — all of whom work with GOSL, as well. This could be one reason for the restricted growth of the private health sector in Sri Lanka. Availability of medical officers in the private sector: Of private health facilities sampled, 72 percent had fewer than five full- or part-time general medical officers; 33 percent of the health facilities had fewer than five part- or full-time specialist medical officers. While an extremely low percentage (2.5 percent) of the facilities reported that they had no general medical officers, 12.5 percent have no specialist medical officers. On average, 5 general doctors are available in a
0
5
10
15
20
25
30

18
facility (full- or part-time), while there are 17 specialist doctors available to a facility (the larger facilities have as many as 45 specialist doctors on their rosters, while an average of 19 are available in a medium-size health facility). Nursing care in the private health sector facilities is provided by nearly a 50-50 combination of qualified nurses and trainee nurses. This situation can create issues related to the quality of care. In contrast, the public facilities are generally assured of the availability of qualified nurses, with nearly 30,000 nurses available for the 70,000 public sector beds. GOSL recognizes only its own training facilities for nurses, and absorbs all the nurses produced by them. The large private hospitals have therefore created their own nurses-training programs, albeit unrecognized by GOSL. Availability of nurses: 65 percent of the private health facilities have ten or fewer qualified nurses working (full- or part-time) in the health facilities, while an extremely low percentage (3 percent) of the facilities is functioning without qualified nurses. A majority (78 percent) of the facilities utilize trainee nurses. On average, each private health facility has 16 qualified nurses and 12 trainee nurses. Pharmacists, laboratory technicians, and selected other categories of health staff are unavailable in a majority of facilities. Over two-thirds (70 percent) of the health facilities do not have even one pharmacist or a laboratory technologist working full- or part-time, while 39 percent of the health facilities had only one pharmacist and one laboratory technologist. Furthermore, 23 percent of the facilities do not have a business manager, and 30 percent do not have a medical records assistant/officer attached to the facility. According to the findings, the other categories of staff (nurses, laboratory technicians, pharmacists, medical records persons, and other staff other than medical officers) are not working on a part-time basis.
3.3.6 Quality of Health Services
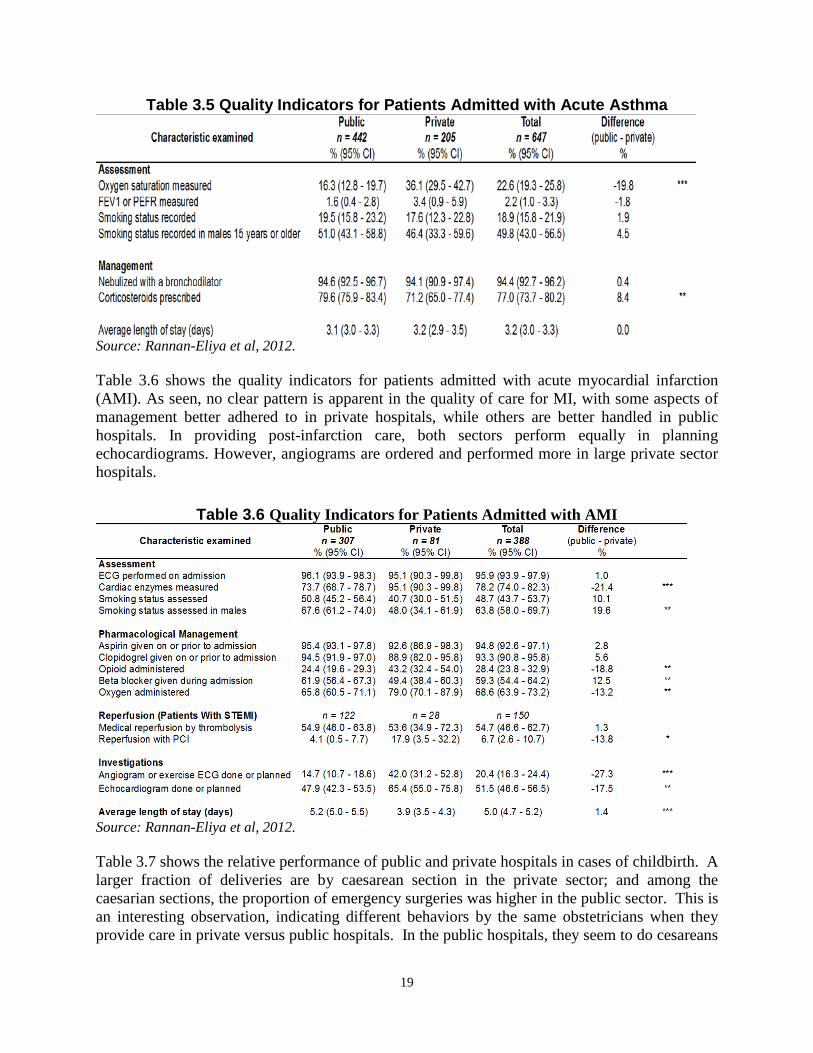
The assessment of quality of care is based on the study on the quality of health care services in public and private health facilities in Sri Lanka undertaken as part of this review. Inpatient Care Quality For assessment of quality of inpatient care, the study covered large public sector hospitals (teaching hospitals), medium public sector hospitals (base hospitals), large private sector hospitals (>50 beds), and other private sector hospitals (<50 beds). Quality of care was assessed on the management and treatment of three conditions: asthma, acute myocardial infarction, and childbirth. The results are as follows. Table 3.5 shows the comparative performance of public and private hospitals with regard to the management of acute asthma. The data show no clear pattern, with a slightly higher percentage of public hospitals administering steroids to asthmatic patients, and private hospitals doing somewhat better in terms of monitoring the patients.
19
Table 3.5 Quality Indicators for Patients Admitted with Acute Asthma
Source: Rannan-Eliya et al, 2012. Table 3.6 shows the quality indicators for patients admitted with acute myocardial infarction (AMI). As seen, no clear pattern is apparent in the quality of care for MI, with some aspects of management better adhered to in private hospitals, while others are better handled in public hospitals. In providing post-infarction care, both sectors perform equally in planning echocardiograms. However, angiograms are ordered and performed more in large private sector hospitals.
Table 3.6 Quality Indicators for Patients Admitted with AMI
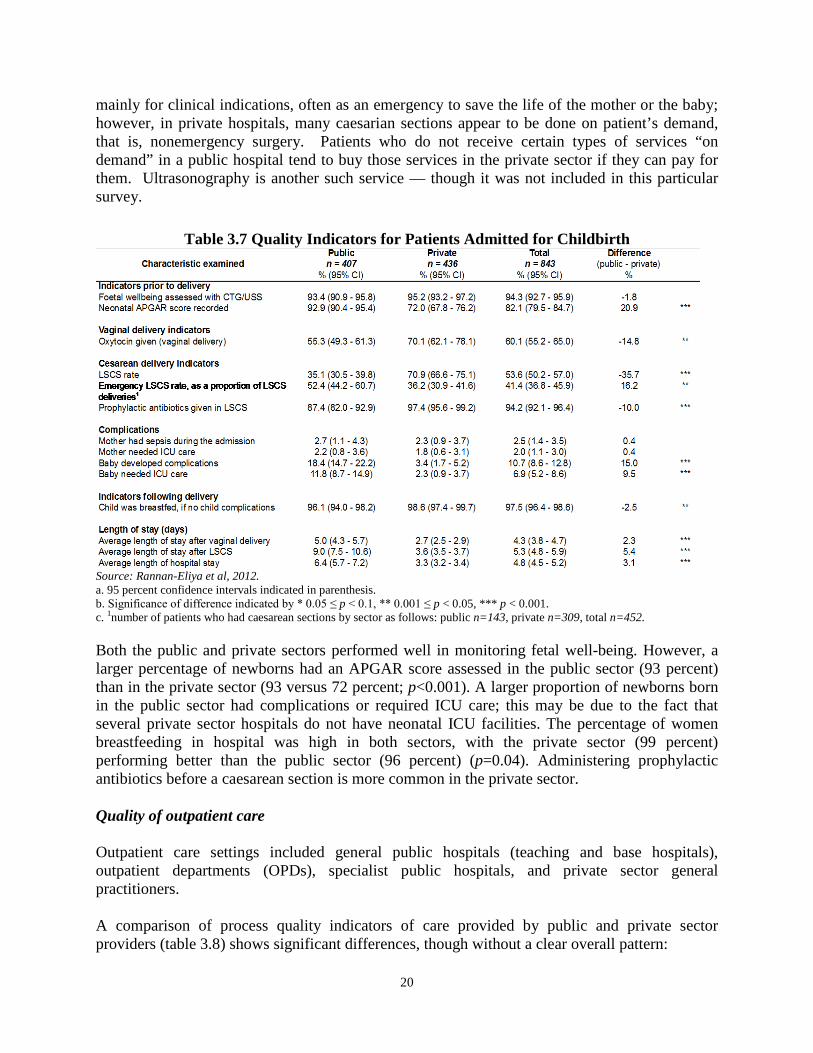
Source: Rannan-Eliya et al, 2012. Table 3.7 shows the relative performance of public and private hospitals in cases of childbirth. A larger fraction of deliveries are by caesarean section in the private sector; and among the caesarian sections, the proportion of emergency surgeries was higher in the public sector. This is an interesting observation, indicating different behaviors by the same obstetricians when they provide care in private versus public hospitals. In the public hospitals, they seem to do cesareans
20
mainly for clinical indications, often as an emergency to save the life of the mother or the baby; however, in private hospitals, many caesarian sections appear to be done on patient’s demand, that is, nonemergency surgery. Patients who do not receive certain types of services “on demand” in a public hospital tend to buy those services in the private sector if they can pay for them. Ultrasonography is another such service — though it was not included in this particular survey.
Table 3.7 Quality Indicators for Patients Admitted for Childbirth
Source: Rannan-Eliya et al, 2012. a. 95 percent confidence intervals indicated in parenthesis. b. Significance of difference indicated by * 0.05 ≤ p < 0.1, ** 0.001 ≤ p < 0.05, *** p < 0.001. c. 1number of patients who had caesarean sections by sector as follows: public n=143, private n=309, total n=452. Both the public and private sectors performed well in monitoring fetal well-being. However, a larger percentage of newborns had an APGAR score assessed in the public sector (93 percent) than in the private sector (93 versus 72 percent; p<0.001). A larger proportion of newborns born in the public sector had complications or required ICU care; this may be due to the fact that several private sector hospitals do not have neonatal ICU facilities. The percentage of women breastfeeding in hospital was high in both sectors, with the private sector (99 percent) performing better than the public sector (96 percent) (p=0.04). Administering prophylactic antibiotics before a caesarean section is more common in the private sector. Quality of outpatient care Outpatient care settings included general public hospitals (teaching and base hospitals), outpatient departments (OPDs), specialist public hospitals, and private sector general practitioners. A comparison of process quality indicators of care provided by public and private sector providers (table 3.8) shows significant differences, though without a clear overall pattern:

21
• The proportion of cases with consultation times less than five minutes was much greater in
the public sector than in the private (82 versus 9 percent; p<0.001). This could be an indication of the overcrowding in public hospital OPDs, one of the factors driving the patients’ decision to seek care in private facilities.
• The proportion of patients who were referred was slightly higher in the public sector (6.7
versus 5.2 percent). • The mean number of drugs prescribed was comparable in the two sectors (3.1 drugs per
consultation).
Table 3.8 Process Quality Indicators from Observational Interviews by Sector
Source: Rannan-Eliya et al, 2012. a. 95 percent confidence intervals indicated in parenthesis, except when standard error is 0. b. Significance of difference indicated by * 0.05 ≤ p < 0.1, ** 0.001 ≤ p < 0.05, *** p < 0.001. • The proportion of patients who underwent physical examination and received both
preventive and educational services was small in both sectors. However, higher proportions of patients in the public sector had their blood pressure (35.7 percent) and weight (8.1 percent) measured than in the private sector (p<0.001).
22
• The proportion of patients in both sectors who were offered preventative services such as immunizations and family planning was very low. The proportion of patients who received advice on their condition was higher in the private sector (47.3 percent) as compared to the public sector (23.6 percent) (p<0.001). Education about smoking cessation was low in both sectors (1.1 percent).
Assessment of patient satisfaction Table 3.9 presents the results of the exit survey, which shows very different levels of patient satisfaction among public and private sector patients on specific aspects of care. Both the sectors provide services to patient groups with a similar age structure. However, more females are seen in the government sector outpatient departments. Patients availing of private sector services are, on average, of a higher socioeconomic status, as might be expected.

23
Table 3.9 Patient Satisfaction Quality Indicator Outcomes, by Sector
Source: Rannan-Eliya et al, 2012. a. 95 percent confidence intervals indicated in parenthesis. b. Significance of difference indicated by * 0.05 ≤ p < 0.1, ** 0.001 ≤ p < 0.05, *** p < 0.001. Patient perceptions of physician technical quality were high in both public and private sectors. However, on the question of whether the doctor gave the correct treatment or action for the patient’s illness, the proportion of patients who were satisfied or very satisfied was higher in the public sector (95 percent) than in the private (92 percent) (p<0.05). For measures of interpersonal quality, the private sector performed better than the public sector overall. Compared to the public sector (50 percent), higher proportions of patients reported that private GPs answered all of their questions (81 percent) (p<0.001), and the proportion of patients who felt the doctor explained the treatment well or very well was also higher in the private sector

24
(88 percent) compared to the public sector (81 percent) (p<0.001). Respect for patient privacy was also perceived to be higher in the private sector with a higher proportion of patients (99 percent) reporting that their privacy was well or very well respected during the visit compared to 94 percent in the public sector (p<0.001). With respect to measures of system quality, although a higher proportion of public sector patients reported having an appointment to see the doctor (41 percent), overall, patients in the public sector waited longer to spend less time with doctors. The proportion of patients who waited longer than 30 minutes to consult with a doctor in the public sector was much higher (35 percent) than those in the private sector (7 percent) (p<0.001). The proportion of consultations that were less than five minutes was greater in the public sector (74 percent) compared to the private sector (11 percent) (p<0.001). In addition, a higher proportion of patients in the private sector felt that the time they spent with the doctor was the right amount of time (95 percent) compared to 90.6 percent in the public sector (p<0.001). Despite these differences, the proportion of patients who were either satisfied or very satisfied with their visit overall was similar in both the public and private sectors (97 percent). In summary, other than waiting time, cleanliness, time spent with the doctor, and advice given, the perceived quality of care on other parameters was similar in both public and private hospitals. In general, for technology-intensive and more costly treatments, the quality indicators are better in the private sector; while for low-cost and routinized procedures, the public sector does better than the private sector.

25
SECTION IV. HEALTH EXPENDITURE AND UTILIZATION OF HEALTH SERVICES
This section analyzes household health expenditure and utilization of private health services, and provides a brief comparative review of public sector health expenditure. We review trends in the magnitude and distribution of household expenditure to determine how much is being spent on health and who pays for what services (for example, drugs, lab tests); and assess equity in health financing by analyzing trends in the burden of out-of-pocket expenditure on household budgets. Since progressivity in out-of-pocket payments is not necessarily a sign of an equitable health system, we also explore the distribution of utilization of private and public health service across different demographic and socioeconomic groups.
4.1 Total Health Expenditure
Total health expenditure (THE) in Sri Lanka in 2010 was equivalent to 4.2 percent of GDP (SLHA 2011). Driven mostly by private spending, THE has increased consistently since the early 1990s. Government spending accounts for roughly 46 percent of THE, and private financing for the rest (figure 4.1). The share of private spending rose above public financing in the early 1990s, and has since shown a slowly rising trend.
Figure 4.1 Total Health Expenditure in Sri Lanka by Source of Financing
Source: Cavagnero and Govindaraj, 2012. Sri Lankan Health Accounts (SLHA) data indicate that the largest share of THE is for curative care (that is the combination of inpatient and outpatient care services). This accounted for about
50
45 47
54
-
10
20
30
40
50
60
70
Perc
enta
ge (%
)
Total expenditures on health by source of financing (%), 1990–2010
Public Private

26
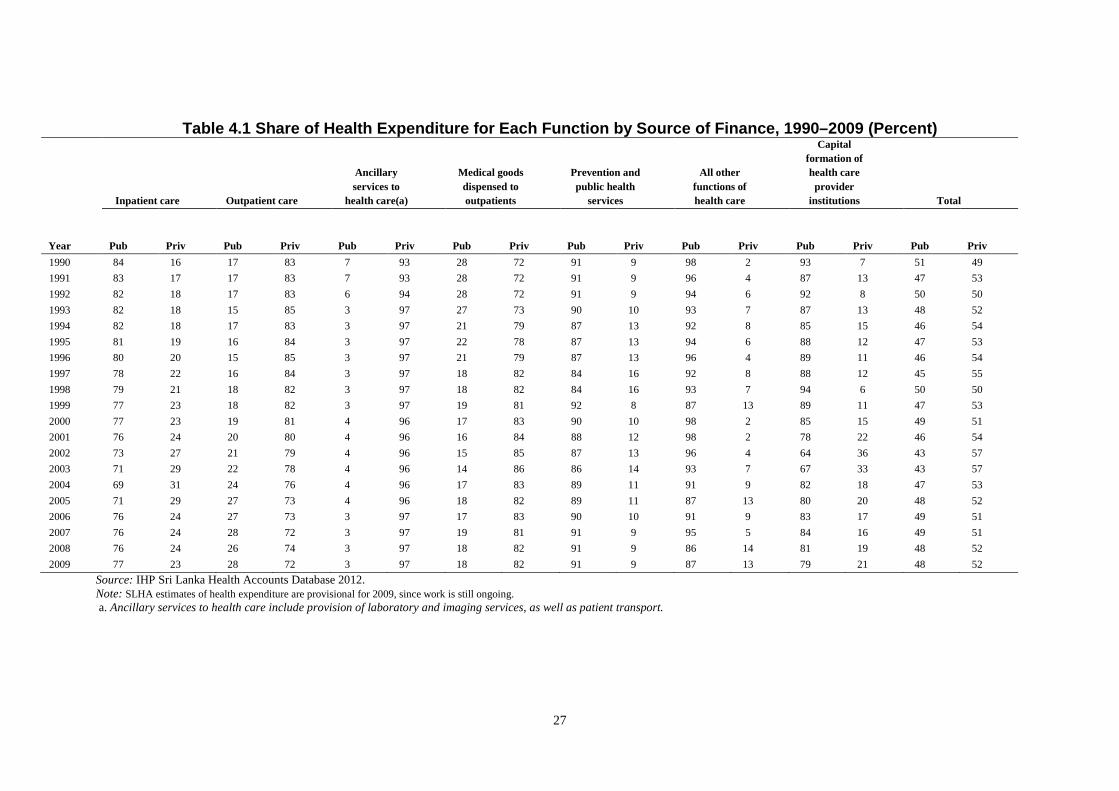
46 percent of THE in 1990, rising to over 52 percent by 2009. In 1990, 24.5 percent of curative care expenditure was for outpatient care and 21.6 percent for inpatient care. By 2009, inpatient spending accounted for 32 percent of curative care expenditure, and outpatient spending for 20 percent. The public sector still predominates in the delivery of inpatient care and public health services (table 4.1), while the rapid growth of the private sector share of THE is due to its dominant position vis-à-vis outpatient care, the provision of ancillary services, and the supply of pharmaceuticals, medical supplies, and medical equipment. About 82 percent of the expenditure on medicines and other medical goods to outpatients is privately financed, and mostly by individuals.
4.2 Public Financing
The share of public expenditure on inpatient care has declined steadily between 1990 and 2009 from 84 to 77 percent, while it has increased in outpatient care from 17 to 28 percent in the same period (table 4.1). Similarly, public expenditure on ancillary services and medical goods dispensed to outpatients has virtually halved from 7 percent to 3 percent and 28 percent to 18 percent, respectively. This decrease in public outlays has meant that increasingly patients in the public sector have to turn either to the private sector for diagnostic services and supplies of medicines, and pay out-of-pocket for these products and services, or forgo the use of these services. Public expenditure on prevention and public health services remains steady at about 90 percent, with the private sector playing a very minimal role there. Significantly, expenditure on capital formation has gradually been declining in the public sector, from 93 percent in 1990 down to 79 percent in 2009.
27
Table 4.1 Share of Health Expenditure for Each Function by Source of Finance, 1990–2009 (Percent)
Year
Inpatient care Outpatient care
Ancillary services to
health care(a)
Medical goods dispensed to outpatients
Prevention and public health
services
All other functions of health care
Capital formation of health care
provider institutions Total
Pub Priv Pub Priv Pub Priv Pub Priv Pub Priv Pub Priv Pub Priv Pub Priv 1990 84 16 17 83 7 93 28 72 91 9 98 2 93 7 51 49 1991 83 17 17 83 7 93 28 72 91 9 96 4 87 13 47 53 1992 82 18 17 83 6 94 28 72 91 9 94 6 92 8 50 50 1993 82 18 15 85 3 97 27 73 90 10 93 7 87 13 48 52 1994 82 18 17 83 3 97 21 79 87 13 92 8 85 15 46 54 1995 81 19 16 84 3 97 22 78 87 13 94 6 88 12 47 53 1996 80 20 15 85 3 97 21 79 87 13 96 4 89 11 46 54 1997 78 22 16 84 3 97 18 82 84 16 92 8 88 12 45 55 1998 79 21 18 82 3 97 18 82 84 16 93 7 94 6 50 50 1999 77 23 18 82 3 97 19 81 92 8 87 13 89 11 47 53 2000 77 23 19 81 4 96 17 83 90 10 98 2 85 15 49 51 2001 76 24 20 80 4 96 16 84 88 12 98 2 78 22 46 54 2002 73 27 21 79 4 96 15 85 87 13 96 4 64 36 43 57 2003 71 29 22 78 4 96 14 86 86 14 93 7 67 33 43 57 2004 69 31 24 76 4 96 17 83 89 11 91 9 82 18 47 53 2005 71 29 27 73 4 96 18 82 89 11 87 13 80 20 48 52 2006 76 24 27 73 3 97 17 83 90 10 91 9 83 17 49 51 2007 76 24 28 72 3 97 19 81 91 9 95 5 84 16 49 51 2008 76 24 26 74 3 97 18 82 91 9 86 14 81 19 48 52 2009 77 23 28 72 3 97 18 82 91 9 87 13 79 21 48 52
Source: IHP Sri Lanka Health Accounts Database 2012. Note: SLHA estimates of health expenditure are provisional for 2009, since work is still ongoing. a. Ancillary services to health care include provision of laboratory and imaging services, as well as patient transport.
28
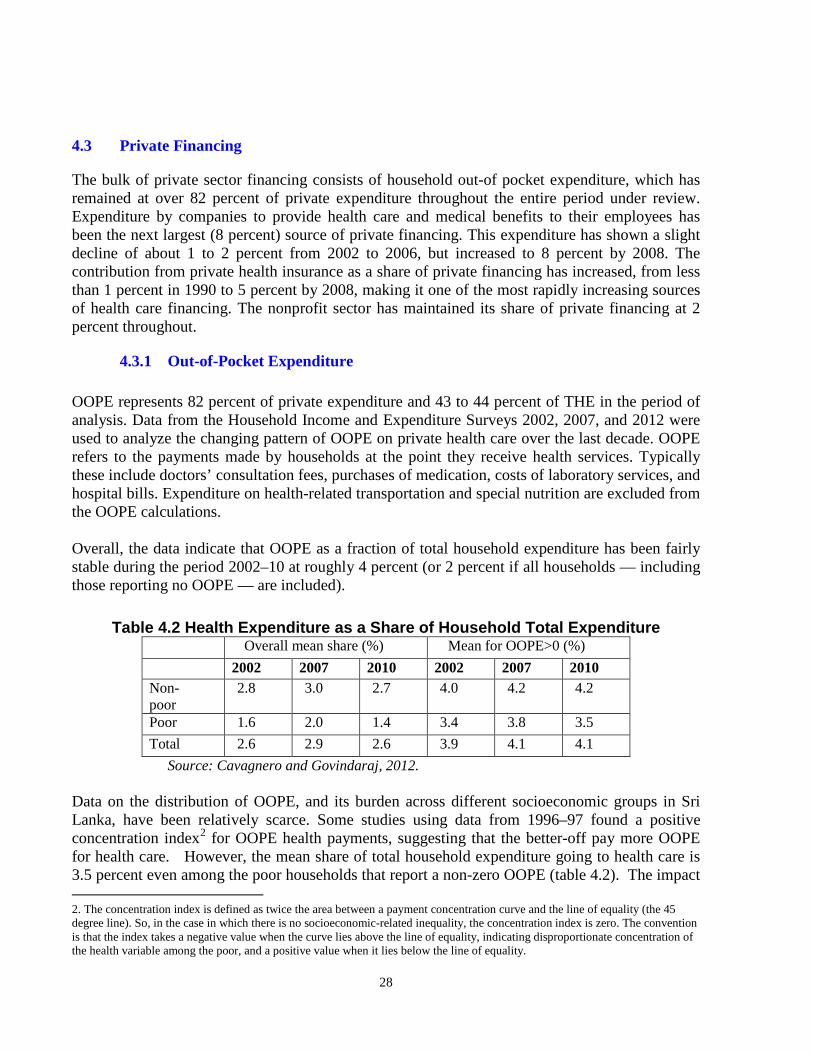
4.3 Private Financing
The bulk of private sector financing consists of household out-of pocket expenditure, which has remained at over 82 percent of private expenditure throughout the entire period under review. Expenditure by companies to provide health care and medical benefits to their employees has been the next largest (8 percent) source of private financing. This expenditure has shown a slight decline of about 1 to 2 percent from 2002 to 2006, but increased to 8 percent by 2008. The contribution from private health insurance as a share of private financing has increased, from less than 1 percent in 1990 to 5 percent by 2008, making it one of the most rapidly increasing sources of health care financing. The nonprofit sector has maintained its share of private financing at 2 percent throughout.
4.3.1 Out-of-Pocket Expenditure OOPE represents 82 percent of private expenditure and 43 to 44 percent of THE in the period of analysis. Data from the Household Income and Expenditure Surveys 2002, 2007, and 2012 were used to analyze the changing pattern of OOPE on private health care over the last decade. OOPE refers to the payments made by households at the point they receive health services. Typically these include doctors’ consultation fees, purchases of medication, costs of laboratory services, and hospital bills. Expenditure on health-related transportation and special nutrition are excluded from the OOPE calculations. Overall, the data indicate that OOPE as a fraction of total household expenditure has been fairly stable during the period 2002–10 at roughly 4 percent (or 2 percent if all households — including those reporting no OOPE — are included).
Table 4.2 Health Expenditure as a Share of Household Total Expenditure Overall mean share (%) Mean for OOPE>0 (%) 2002 2007 2010 2002 2007 2010 Non-poor
2.8 3.0 2.7 4.0 4.2 4.2
Poor 1.6 2.0 1.4 3.4 3.8 3.5 Total 2.6 2.9 2.6 3.9 4.1 4.1
Source: Cavagnero and Govindaraj, 2012. Data on the distribution of OOPE, and its burden across different socioeconomic groups in Sri Lanka, have been relatively scarce. Some studies using data from 1996–97 found a positive concentration index2 for OOPE health payments, suggesting that the better-off pay more OOPE for health care. However, the mean share of total household expenditure going to health care is 3.5 percent even among the poor households that report a non-zero OOPE (table 4.2). The impact 2. The concentration index is defined as twice the area between a payment concentration curve and the line of equality (the 45 degree line). So, in the case in which there is no socioeconomic-related inequality, the concentration index is zero. The convention is that the index takes a negative value when the curve lies above the line of equality, indicating disproportionate concentration of the health variable among the poor, and a positive value when it lies below the line of equality.
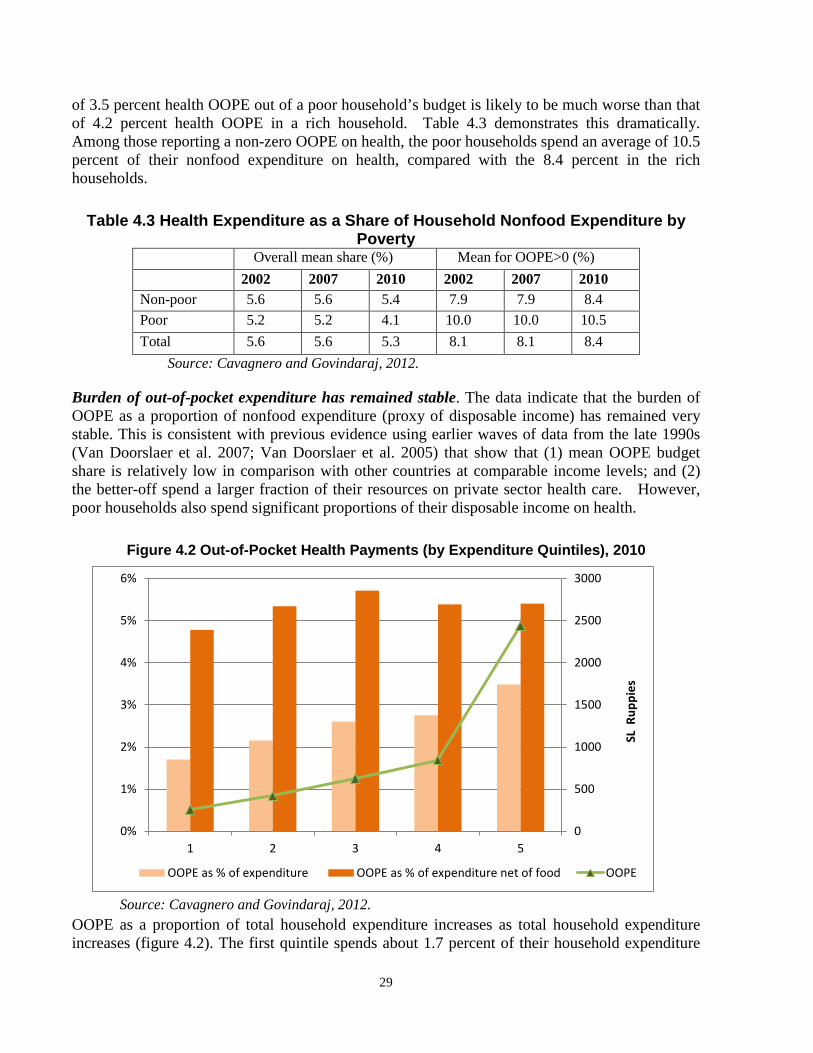
29
of 3.5 percent health OOPE out of a poor household’s budget is likely to be much worse than that of 4.2 percent health OOPE in a rich household. Table 4.3 demonstrates this dramatically. Among those reporting a non-zero OOPE on health, the poor households spend an average of 10.5 percent of their nonfood expenditure on health, compared with the 8.4 percent in the rich households.
Table 4.3 Health Expenditure as a Share of Household Nonfood Expenditure by Poverty
Overall mean share (%) Mean for OOPE>0 (%) 2002 2007 2010 2002 2007 2010 Non-poor 5.6 5.6 5.4 7.9 7.9 8.4 Poor 5.2 5.2 4.1 10.0 10.0 10.5 Total 5.6 5.6 5.3 8.1 8.1 8.4
Source: Cavagnero and Govindaraj, 2012. Burden of out-of-pocket expenditure has remained stable. The data indicate that the burden of OOPE as a proportion of nonfood expenditure (proxy of disposable income) has remained very stable. This is consistent with previous evidence using earlier waves of data from the late 1990s (Van Doorslaer et al. 2007; Van Doorslaer et al. 2005) that show that (1) mean OOPE budget share is relatively low in comparison with other countries at comparable income levels; and (2) the better-off spend a larger fraction of their resources on private sector health care. However, poor households also spend significant proportions of their disposable income on health.
Figure 4.2 Out-of-Pocket Health Payments (by Expenditure Quintiles), 2010
Source: Cavagnero and Govindaraj, 2012.
OOPE as a proportion of total household expenditure increases as total household expenditure increases (figure 4.2). The first quintile spends about 1.7 percent of their household expenditure
0
500
1000
1500
2000
2500
3000
0%
1%
2%
3%
4%
5%
6%
1 2 3 4 5
SL R
uppi
es
OOPE as % of expenditure OOPE as % of expenditure net of food OOPE
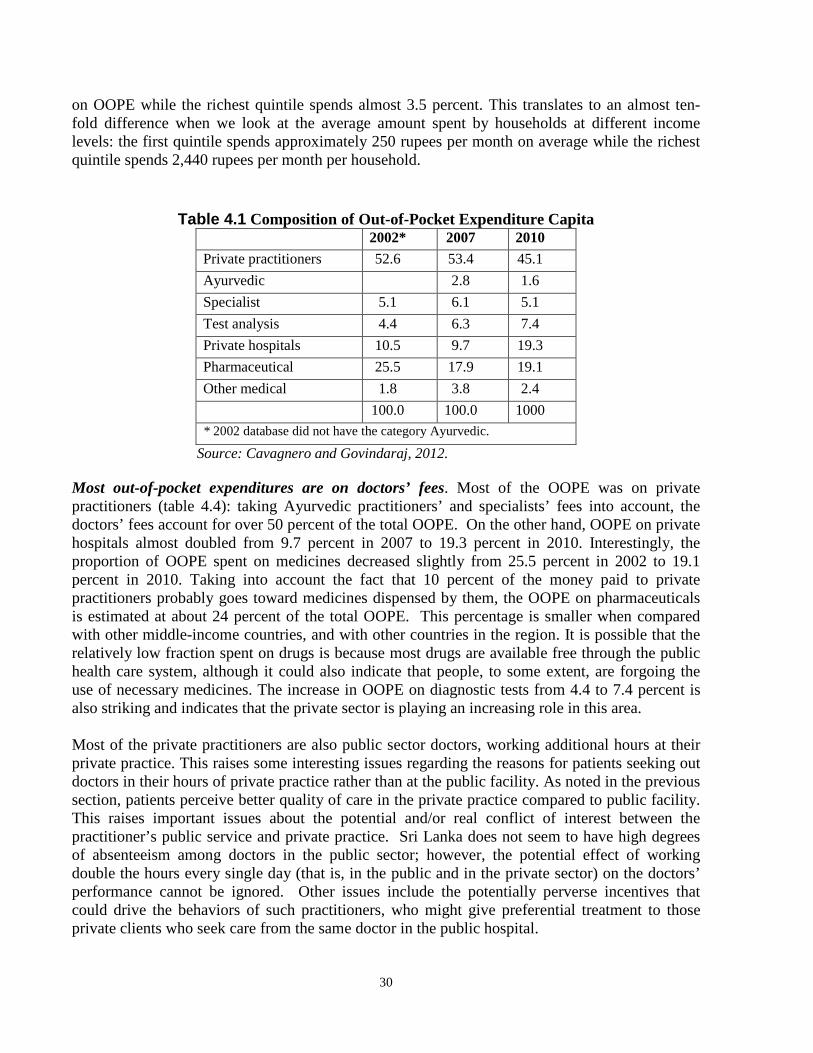
30
on OOPE while the richest quintile spends almost 3.5 percent. This translates to an almost ten-fold difference when we look at the average amount spent by households at different income levels: the first quintile spends approximately 250 rupees per month on average while the richest quintile spends 2,440 rupees per month per household.
Table 4.1 Composition of Out-of-Pocket Expenditure Capita 2002* 2007 2010 Private practitioners 52.6 53.4 45.1 Ayurvedic 2.8 1.6 Specialist 5.1 6.1 5.1 Test analysis 4.4 6.3 7.4 Private hospitals 10.5 9.7 19.3 Pharmaceutical 25.5 17.9 19.1 Other medical 1.8 3.8 2.4 100.0 100.0 1000 * 2002 database did not have the category Ayurvedic.
Source: Cavagnero and Govindaraj, 2012. Most out-of-pocket expenditures are on doctors’ fees. Most of the OOPE was on private practitioners (table 4.4): taking Ayurvedic practitioners’ and specialists’ fees into account, the doctors’ fees account for over 50 percent of the total OOPE. On the other hand, OOPE on private hospitals almost doubled from 9.7 percent in 2007 to 19.3 percent in 2010. Interestingly, the proportion of OOPE spent on medicines decreased slightly from 25.5 percent in 2002 to 19.1 percent in 2010. Taking into account the fact that 10 percent of the money paid to private practitioners probably goes toward medicines dispensed by them, the OOPE on pharmaceuticals is estimated at about 24 percent of the total OOPE. This percentage is smaller when compared with other middle-income countries, and with other countries in the region. It is possible that the relatively low fraction spent on drugs is because most drugs are available free through the public health care system, although it could also indicate that people, to some extent, are forgoing the use of necessary medicines. The increase in OOPE on diagnostic tests from 4.4 to 7.4 percent is also striking and indicates that the private sector is playing an increasing role in this area. Most of the private practitioners are also public sector doctors, working additional hours at their private practice. This raises some interesting issues regarding the reasons for patients seeking out doctors in their hours of private practice rather than at the public facility. As noted in the previous section, patients perceive better quality of care in the private practice compared to public facility. This raises important issues about the potential and/or real conflict of interest between the practitioner’s public service and private practice. Sri Lanka does not seem to have high degrees of absenteeism among doctors in the public sector; however, the potential effect of working double the hours every single day (that is, in the public and in the private sector) on the doctors’ performance cannot be ignored. Other issues include the potentially perverse incentives that could drive the behaviors of such practitioners, who might give preferential treatment to those private clients who seek care from the same doctor in the public hospital.

31
There are clear differences in the composition of OOPE across income quintiles. The richest spend roughly a third of their OOPE on private practitioners, another third on private hospital care, and 16 percent on drugs (figure 4.3). The poorest, on the other hand, spend roughly 70 percent on private practitioners, less than 1 percent on private hospitals, and about 20 percent on drugs. Clearly, private hospital visits are pro-rich, as also are laboratory investigations and specialist care. Private outpatient visits are evidently the more affordable type of care and hence constitute a bigger proportion of the OOPE by the poor.
Figure 4.3 Structure of Out-of-Pocket Health Payments by Income Quintile, 2009–10
Source: Cavagnero and Govindaraj, 2012. 4.3.1.1 Catastrophic and impoverishment effect of health expenditure
We next analyze catastrophic expenditure.3 The data show that, in 2010, OOPE on health accounted for 25 percent of total household expenditure in less than 1 percent of households; and for 40 percent of nonfood expenditure in 1.24 percent of households (table 4.5). This has remained relatively stable over the last decade.
3. Catastrophic expenditure is measured as the OOPE as a proportion of household expenditure (total and net of food expenditure) exceeding a certain threshold. There is no clear consensus about the appropriate threshold, but we have used 25 and 40 percent for OOPE as a proportion of total household expenditure and total household expenditure net of food, respectively.
0%
10%
20%
30%
40%
50%
60%
70%
80%
90%
100%
1 2 3 4 5
prvpract specialist Test Prv Hospital Pharma Other

32
Table 4.2 Catastrophic Payments at Different Thresholds, 2010 Catastrophic payments 2010
As a share of total expenditure (%) 10 15 20 25
Headcount (H) (%) 4.98 2.36 1.39 0.86 Concentration index
headcount 0.2253091 0.3088161 0.3915606 0.5255381
As a share of nonfood expenditure (%) 10 20 30 40
Headcount (H) (%) 16.54 5.69 2.50 1.24 Concentration index
headcount -0.0043276 0.0163122 0.14418 0.2415794
Source: Cavagnero and Govindaraj, 2012. The measurement of catastrophic expenditures does not account for the hardship that OOPE may actually cause in terms of poverty. Some households might spend a high proportion of their expenditure but still be very far from crossing the poverty line; whereas for others, small fractions of unexpected health expenditures may push them into poverty (or further into poverty). That is why we complement the previous measures with an impoverishment perspective, which measures the percentage of household. Impoverishment is measured as the percentage crossing the poverty line due to OOPE (table 4.6).
Table 4.3 Catastrophic Expenditure and Impoverishment due to OOPE, 2002–10 Year Catastrophic (at 40%) Impoverishment 2002 1.36 1.19 2007 1.10 0.84 2010 1.24 1.04
Source: Cavagnero and Govindaraj, 2012. Degree of Impoverishment: Impoverishment due to out-of-pocket expenditures is low, and it has remained stable in the last decade.
Figure 4.4 Distribution of Catastrophic Expenditures and Impoverishment across Quintiles, 2010
Source: Cavagnero and Govindaraj, 2012.
0.0%
1.0%
2.0%
3.0%
4.0%
1 2 3 4 5catastrophic impoverishment

33
Figure 4.4 shows the distribution across quintiles of the catastrophic expenditures at the 40 percent threshold shown in table 4.6. Catastrophic expenditures seem to be growing across quintiles in 2010: this might reflect the fact that richer population groups can afford to spend more as a proportion of their income, while poorer households are more at risk of being impoverished even though they spend significantly less on OOPE. The progressive catastrophic expenditure may be the result of poorer households either using free services in public facilities or forgoing care. This issue is explored further in the next section.
4.3.1.2 Impact of OOPE on the Utilization of Health Services Are the poor forgoing care because it is unaffordable? Even if payments are progressive, the issue of concern is the gap in services that are essential but forgone by the poor because of their inability to pay. Low levels of OOPE among the poor could indicate a lack of access to health services, rather than effective protection against impoverishment due to such expenditures. This concern is sharpened by the data on utilization rates of health services by wealth quintile in 2006/07 and 2010 (tables 4.7 and 4.8).
Table 4.4 Utilization Rates of Outpatient Services, Sri Lanka — 2006 and 2010 Quintile 2006/07 2010 1 23.8 23.7 2 27.3 27.9 3 29.6 29.3 4 33.8 32.3 5 34.8 35.4 Average 30.3 30.2
Source: Cavagnero and Govindaraj, 2012.
The utilization rate for outpatient services overall has remained stable at about 30 percent: that is, about 30 percent of the population used health services in the last month. However, there is an 11 to 12 percentage point difference in the use of outpatient services by the richest and the poorest: while more than 35 percent of those in the highest quintile used outpatient services in the last month, only about 24 percent of those in the lowest quintile did so.
Table 4.5 Reasons for Utilization of Inpatient Services, Sri Lanka — 2006 and 2010
Quintile Illness Injury Operation Child delivery Infection
2006 2010 2006 2010 2006 2010 2006 2010 2006 2010 1 62.5 63.1 9.2 8.8 7.5 7.9 11.5 12.5 1.8 1.6 2 61.1 67.9 8.5 6.4 8.9 7.1 11.1 11.1 1.4 1.2 3 61.7 62.7 7.6 8.4 8.7 8.5 10.2 9.7 1.8 1.4 4 60.1 65.2 7.7 5.8 11.9 9.8 9.5 10.2 1.0 1.3 5 56.2 61.3 7.4 6.9 16.2 15.3 9.2 8.1 1.4 1.9
Average 60.2 64.0 8.0 7.2 10.9 10.0 10.2 10.1 1.4 1.5 Source: Cavagnero and Govindaraj, 2012.
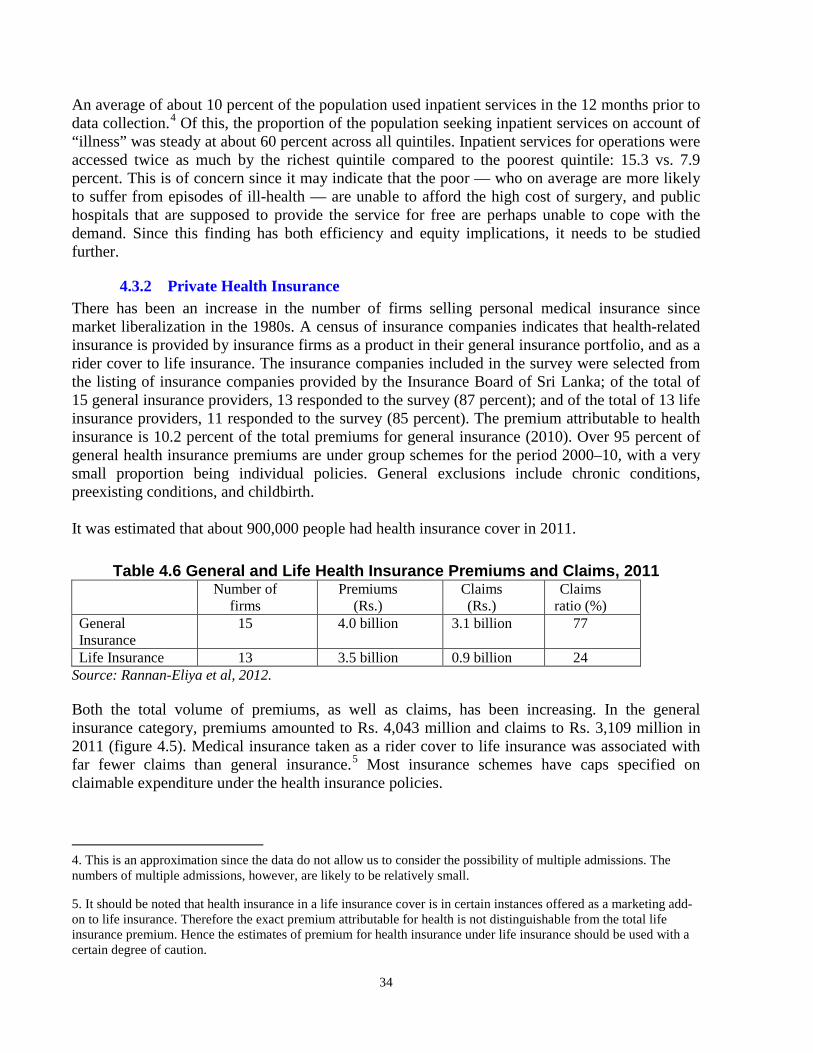
34
An average of about 10 percent of the population used inpatient services in the 12 months prior to data collection.4 Of this, the proportion of the population seeking inpatient services on account of “illness” was steady at about 60 percent across all quintiles. Inpatient services for operations were accessed twice as much by the richest quintile compared to the poorest quintile: 15.3 vs. 7.9 percent. This is of concern since it may indicate that the poor — who on average are more likely to suffer from episodes of ill-health — are unable to afford the high cost of surgery, and public hospitals that are supposed to provide the service for free are perhaps unable to cope with the demand. Since this finding has both efficiency and equity implications, it needs to be studied further.
4.3.2 Private Health Insurance There has been an increase in the number of firms selling personal medical insurance since market liberalization in the 1980s. A census of insurance companies indicates that health-related insurance is provided by insurance firms as a product in their general insurance portfolio, and as a rider cover to life insurance. The insurance companies included in the survey were selected from the listing of insurance companies provided by the Insurance Board of Sri Lanka; of the total of 15 general insurance providers, 13 responded to the survey (87 percent); and of the total of 13 life insurance providers, 11 responded to the survey (85 percent). The premium attributable to health insurance is 10.2 percent of the total premiums for general insurance (2010). Over 95 percent of general health insurance premiums are under group schemes for the period 2000–10, with a very small proportion being individual policies. General exclusions include chronic conditions, preexisting conditions, and childbirth. It was estimated that about 900,000 people had health insurance cover in 2011.
Table 4.6 General and Life Health Insurance Premiums and Claims, 2011 Number of
firms Premiums
(Rs.) Claims (Rs.)
Claims ratio (%)
General Insurance
15 4.0 billion 3.1 billion 77
Life Insurance 13 3.5 billion 0.9 billion 24 Source: Rannan-Eliya et al, 2012. Both the total volume of premiums, as well as claims, has been increasing. In the general insurance category, premiums amounted to Rs. 4,043 million and claims to Rs. 3,109 million in 2011 (figure 4.5). Medical insurance taken as a rider cover to life insurance was associated with far fewer claims than general insurance.5 Most insurance schemes have caps specified on claimable expenditure under the health insurance policies. 4. This is an approximation since the data do not allow us to consider the possibility of multiple admissions. The numbers of multiple admissions, however, are likely to be relatively small.
5. It should be noted that health insurance in a life insurance cover is in certain instances offered as a marketing add-on to life insurance. Therefore the exact premium attributable for health is not distinguishable from the total life insurance premium. Hence the estimates of premium for health insurance under life insurance should be used with a certain degree of caution.
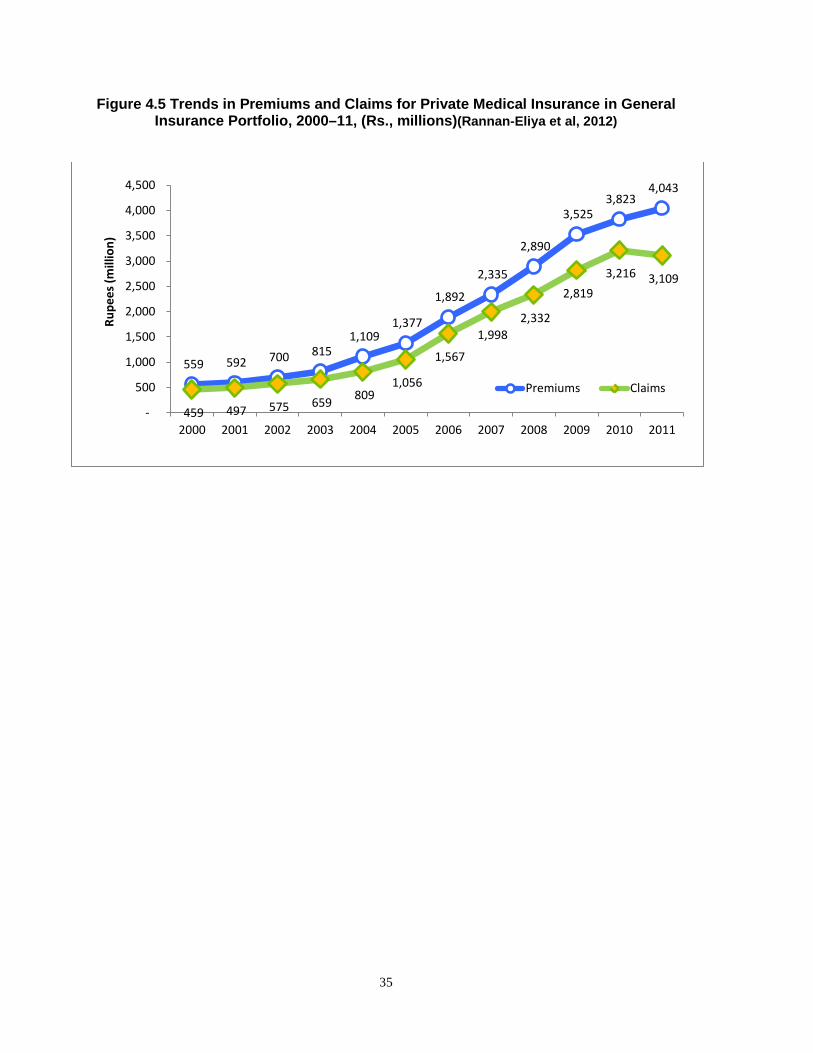
35
Figure 4.5 Trends in Premiums and Claims for Private Medical Insurance in General Insurance Portfolio, 2000–11, (Rs., millions)(Rannan-Eliya et al, 2012)
559 592 700 815 1,109
1,377
1,892
2,335
2,890
3,525 3,823
4,043
459 497 575 659 809 1,056
1,567
1,998 2,332
2,819 3,216 3,109
-
500
1,000
1,500
2,000
2,500
3,000
3,500
4,000
4,500
2000 2001 2002 2003 2004 2005 2006 2007 2008 2009 2010 2011
Rupe
es (m
illio
n)
Premiums Claims
36
SECTION V. GOVERNANCE AND REGULATION
As part of this review, the current legal framework and its enforcement; the practices with regard to the accountability of the private sector to the government; and the existing systems for monitoring/regulating the private sector were studied. In this section, we present the key findings of the study. 5.1 The Law Relating to the Regulation of Private Medical Institutions The PMIRA: The Private Medical Institutions (Registration) Act” (PMIRA), which regulates private medical institutions in Sri Lanka, became operational in December 2006. The law was enacted to ensure the provision of safe and efficient medical services to the public by private medical institutions. The law’s primary objectives are to provide for the registration, regulation, monitoring, and inspection of private medical institutions, to foster the development of private medical institutions, and to provide for relevant needs. The PMIRA requires all persons establishing or maintaining a private medical institution to obtain a Certificate of Registration. Definition of a Private Medical Institution (PMI) under the PMIRA: According to the act, a PMI is any institution or establishment used or intended to be used for the reception of and provision of medical and nursing care and treatment for persons suffering from any sickness, injury, or infirmity. This includes a hospital, nursing home, maternity home, medical laboratory, blood bank, dental surgery, dispensary and surgery, consultation room, and any establishment that provides a health screening or health promotion service. The law does not cover institutions maintained or controlled by the state, and those registered under the Ayurveda Act (1961) or the Homeopathy Act (1970); or private health research organizations, private health data banks including ante-mortem data depositories, private organ and tissue banks, and private genetics labs. The Private Health Services Regulatory Council (PHSRC): A regulatory body named the Private Health Services Regulatory Council or PHSRC has been established under PMIRA.6 The 28 member PHSRC, which has the director general of health services of the MoH as its chairman and the director of private health sector development of the MoH as the secretary, also includes (1) a representative each of the Independent Medical Practitioners Association, Sri Lanka Dental Association, and the Society of General Medical Practitioners nominated by the respective association; (2) a person each to represent the fields of accountancy, management, law, and nursing; (3) Nine representatives from the Association of Private Hospitals and Nursing Homes; (4) the Registrar of the Sri Lanka Medical Council; and (5) the provincial directors of health services of each of the nine provinces of Sri Lanka. The PHSRC develops and monitors standards to be maintained by registered PMIs; ensures that PMIs maintain minimum qualifications and standards for recruitment and training of personnel; and ensures the quality of patient services provided by these institutions. The PHSRC also formulates and implements quality assurance (QA) programs, and collects and maintains health information and statistics, based on which the performance of PMIs is graded. The PHSRC also 6. Section 6 of Act no. 21 of 2006.
37
makes rules with regard to the records to be maintained by PMIs; the reporting requirements; all matters pertaining to quality and availability of services, including the physical infrastructure, equipment, and human resources; and waste management practices. 5.2 Gaps in the Legislative Framework, Implementation, and Enforcement The Private Medical Institutions (Registration) Act is the principal legislative instrument dealing with regulation of PMIs in Sri Lanka. The evidence indicates that the PHSRC mechanism is not functioning optimally. It does not perform consistently in accordance with its declared purpose and is inadequately financed and staffed; as a result, it is failing to register/license a significant proportion of establishments and is therefore not able to enforce its other functions. For instance, in the mapping undertaken in four Divisional Secretary areas as part of this review, it was found that almost 68 percent (65 percent in urban areas and 77 percent in rural areas) of private health facilities were not registered under any relevant authority. While this might not represent the situation in the country, it highlights the need for more intensive oversight by the government. PMIRA has several important gaps: (i) It does not foster the growth and development of the private health sector; nor does it
provide a framework for developing a sound working relationship between the state and private health care sectors, including the regulatory framework to facilitate the implementation of public-private partnerships (PPP)/outsourcing in the provision of health care services or health insurance.
(ii) It does not take into account such matters as the composition of the PHSRC and its implementation procedures. Ideally, a regulatory body should be independent, impartial, neutral, and transparent. However, the PHSRC currently predominantly comprises stakeholders. Furthermore, it comprises representatives of institutions who are to be regulated by the PHSRC. The involvement of private providers in the regulatory agency poses — at least potentially — a risk of regulatory capture. There is also a conflict of interest, with licensees continuing to sit on the PHSRC, despite sometimes failing to comply with regulatory requirements themselves.
(iii) The act does not spell out the mandatory duties of PMIs (for example, submitting morbidity and mortality statistics to the MoH, notification of notifiable diseases). It is also silent on what regulatory steps the PHSRC may take if a PMI has acted in breach of a rule or a regulation. For example, there is no provision in the act for the PHSRC to hold a preliminary or formal inquiry, and to impose regulatory sanctions such as issuing a warning, naming and shaming, and suspending or cancelling a license. What the act stipulates instead is direct prosecution in a Magistrates Court, which is more in consonance with a police action, with its attendant complications. Prosecution in courts may indeed become necessary if a PMI is criminally negligent, or if regulatory sanctions have become ineffective, but it should preferably be the “last option.”
(iv) Finally, the act does not address this issue of assessment and regulation of technology and related ethical issues, for example, embryo transfer, storage of human tissue, and genetic implications of human tissues sent abroad.
38
5.3 Implementation/Enforcement of Government-Mandated Reporting Reporting by the private sector, although mandated, has been uneven. The private sector is obligated by law to report on certain vital events, notifiable diseases, physical infrastructure, and financial information. However, table 5.1 shows that data reporting by the private sector on issues of concern to the government is uneven: this includes reporting of deaths by cause, compliance with quality standards, and availability of infrastructure. The highest proportion, about 65 percent, reported deaths due to sudden deaths/injuries, maternal and child deaths, or deaths due to communicable disease. Only 50 percent of all institutions surveyed reported on other issues, including medico-legal issues.
Table 5.1 Current Practices with regard to Data Reporting to a Government Agency Description Number of facilities Percentage of
facilities Statistics on how many patients received key health services (N=122)
52
42.6
Statistics on sudden deaths/deaths due to injuries (N=120) 78 65.0 Statistics on maternal and child deaths, communicable diseases deaths (N=119)
77
64.7
Compliance with quality standards (N=121) 65 53.7 Information on equipment purchases (N=122) 47 38.5 Information on new construction or expansion existing infrastructure (N=122)
61
50.0
Financial information such as revenue (N=121) 68
56.2
Medico-legal issues (N=118) 64 54.2 Source: Gunaratne, 2012. Reporting systems are still manual and paper-based. A majority (88 percent to 95 percent) of private sector health facilities are still utilizing paper-based systems for patient records, accounting, and inventory maintenance (table 5.2). Many health facilities that have initiated electronic systems seem to be maintaining both paper-based and electronic systems. About 20 percent of the facilities were not maintaining statistics on the number of patients who receive care or the details of care provided in their respective health facilities.
Table 5.2 Record Systems Maintained by Private Health Facilities Description Number of
facilities (N=124) Percentage of
facilities Paper-based patient record systems 117 94.4 Electronic-based patient record systems 80 64.5 Paper-based accounting system 113 91.3 Electronic-based accounting system 87 70.1 Paper-based inventory system for drugs and medical supplies 109 87.9
Electronic-based inventory system for drugs and medical supplies 84 67.4
Source: Gunaratne, 2012.

39
Awareness of rules and regulations is poor among private providers. The evidence on service quality and systems to support the provision of quality services shows that there is a wide variation between private health establishments in both awareness and availability. For example, in the case of service quality, only about 14 percent of health facilities reported that the health establishment was aware of being penalized for not adhering to minimum quality standards. Only 63 percent of health facilities reported that they had been inspected by a government agency (including the provincial councils and local authorities) to monitor the safety and quality of services provided by the respective health facility during the last year. In terms of enhancing quality of care, almost half (42 percent) of the health facilities had not provided continuing education opportunities for their staff, although over 75 percent had disseminated clinical practice guidelines, and over 80 percent could produce an internal report on care provided to patients. The availability of mandated services is uneven. Similarly, service availability also shows a remarkable variation between establishments: only 44 percent of the health facilities surveyed reported that they have facilities for emergency transportation of patients. In addition, 10 percent of health facilities do not own a backup generator, an air conditioner, or computers, and have no access to electricity. The situation was better in larger facilities, where 100 percent of them had the basic facilities (electricity, backup generators, air conditioning, and computers), and 90 percent of the larger facilities also had ambulances. In terms of the physical condition of the establishments surveyed, 75 percent of the facilities were clean, and 76 percent provided adequate privacy during patient consultations. Almost all (98 percent) of the health facilities had adequate seating facilities for patients seeking care, and a large majority (90 percent) of the facilities provided access to clean drinking water for the patients.
40
SECTION VI. CONCLUSIONS AND THE WAY FORWARD
This review represents an attempt to bridge the significant knowledge gaps on the private health sector in Sri Lanka through a systematic collection and analysis of primary and secondary data on the role of the private sector in the provision, financing, and regulation of health care services. This is but a first step, and more elaborate “diagnostic” assessments will almost certainly be necessary before specific and comprehensive recommendations can be made on how best to enlist the private sector in the fulfillment of national health sector goals. Nevertheless, it is useful to examine the broad findings and conclusions of this review on each of the three aspects of the health sector — which we do in this section — so that one can at least begin to chart a way forward for providing high-quality, universal health care to the citizens of Sri Lanka. Provision of Health Services: From the data presented, it is clear that the private sector in Sri Lanka includes a range of providers; tends to focus primarily on the provision of curative — rather than preventive — and outpatient services; and is heavily concentrated in urban areas. Furthermore, these facilities tend to cluster around areas that already have government facilities, which limits their ability to expand the reach of health services to the general population. Consideration could be given to incentivizing the private sector to participate more widely and systematically in both preventive and curative services, and, further, to expand beyond urban areas to the rural and underserved regions, so that the scope and reach of health care services in Sri Lanka could be optimized. As highlighted above, public-private partnerships (PPPs) in the health sector are minimal: a majority of the health facilities function as independent institutions, and the survey revealed that only 12 percent of health facilities had agreements/contracts with the government health sector at least once in the past. Furthermore, government only provides limited support to the private sector to participate in the implementation of public health programs. In keeping with its role as steward of the health sector, the government could ensure a more efficient and equitable distribution of its scarce resources by leveraging synergies across the two sectors. For instance, diagnostics are an important and growing area within the private health sector, although relatively few private facilities currently provide a full range of diagnostic services. This is an area where both the public and the private sector could potentially stand to gain through mutual collaboration. On the other hand, the private sector is virtually totally dependent on the public sector for its supply of human resources. It would therefore be important to address the issues of human resources in the health sector, which affect both public and private facilities, including the shortage of certain types of personnel, and the potential conflict of interest issues arising from the same personnel working in both public and private sectors. One option could be to share the resources for the training of nurses, laboratory technicians, and pharmacists between the private sector and the ongoing Allied Health Professionals Training Units in the Faculties of Medicine. Such a step could potentially increase the numbers of such personnel within the system, and also ensure uniform and accredited standards in the public and private sectors. Limited access to finance is identified as a barrier to the effective operation of private health facilities. The private sector, on the whole, is heavily reliant on out-of-pocket payments, with

41
government subsidies and insurance playing only a minimal role. The design of viable risk-sharing arrangements could potentially address this issue, and promote more effective private sector participation in the health sector. The quality of care in the public and private sectors in Sri Lanka is broadly comparable; the private sector attracts patients primarily because, on average, it is cleaner, more patient-friendly, and offers greater choice, more privacy, and shorter wait times. However, the overall quality of health care services in Sri Lanka in both the private and public sectors still lags behind those offered in more advanced countries. An active partnership with the government in this area would help the private sector and the country in two ways: first, adherence to government’s norms and standards would ensure better quality of care for the consumer in the private (and public) sector; and, second, rewards and incentives offered to private establishments that make significant improvements in service quality could enhance their competitiveness in the health care market. In areas where quality indicators show marked differences between the public and private sectors, there could be cross-learning between the two (after studying the reasons for such differences, given the overlap of personnel between the two markets). The public sector can also improve its quality of services considerably by focusing on overcrowding (resulting in longer waiting times and shorter consultation times), cleanliness, advice given to patients, and effective follow-up and continuity of care. Health expenditure and utilization of health services: Notwithstanding the remarkable success of the public sector in ensuring access to efficient and good quality health services in Sri Lanka, private health expenditure is more than half of total health expenditure, mostly in the form of out-of-pocket payments by households at the point of service delivery. The largest OOPE category is doctor’s fees; the share of diagnostics and private hospitals is rising, while pharmaceuticals are declining. The evidence shows that the rich are paying more for health care than the poor by a factor of 10, but the poor spend proportionately more when OOPE is examined as a share of nonfood expenditure. The rich are also spending more proportionately on private hospitals, diagnostics, and specialists than the poor. This demonstrates possible inequalities in access to health care between different income groups; and more importantly, that the lower utilization of these services is an indication that the poor are forgoing these services, possibly due to cost considerations. Although, the burden of OOPE has remained constant across quintiles, when considering those reporting a non-zero OOPE on health, poor households spend on average more of their nonfood expenditures on health, compared with the richer households. On the positive side, only a small proportion of the population has catastrophic or impoverishing OOPE, with catastrophic expenditures being concentrated among the rich, while impoverishing expenditures occur more among the poor. There could be several policy options to address the inequities noted above and avert the likelihood that the poor are forgoing health care. These range from improving the quality, completeness, and availability of public sector services to introducing means-tested public subsidies of privately available services (so that the poor can also afford to buy those services not easily accessible in public facilities). Any such scheme, however, needs to be carefully planned and executed after considerable consultation and technical work.
42
Governance and regulation: With a growing private sector, there is a need to bridge the gaps in the legal/regulatory framework and in the enforcement of health regulations applicable to the private sector that have been noted, as well as to create an enabling environment for more effective private sector engagement in the health sector. Global evidence and experience suggests that optimal regulation entails striking the right balance between mandates and incentives. Some options that could be considered to strengthen the current legal framework for regulation of the private health sector and encourage more private participation in fulfilling public sector goals are the following: • Amendment of the PMIRA no. 21. Consideration should be given to addressing key gaps in
PMIRA, some options are highlighted above. This includes, among other things, introduction of amendments to the act that provide an appropriate framework for a sound working relationship between the state and the private health care sector, through a combination of mandates and incentives. Provisions also need to be included in the act that assess and regulate ethical issues arising from the advent of modern medical technologies. Furthermore, the act should include provisions for the effective regulation of private health insurance in a manner that balances the interests of the industry and the insured.
• Reinforcement of the regulatory effectiveness of the PHSRC. This could be done by rationalizing the size of the PHSRC and reducing, if not eliminating altogether, the representation of private medical institutions. In addition, consideration could be given to including in the composition of the PHSRC representatives from medical associations, such as the Independent Medical Practitioners Association and the Sri Lanka Medical Association, and a representative of the Attorney General’s Department appointed by the Minister to the Council. Furthermore, recognizing that PMIRA is not always well understood by central- and provincial-level officers, efforts could be made to develop detailed and systematic guidelines — supported by training and capacity building — on the implementation of the various provisions of the act.
• Strengthening the regulatory capacity of authorized officers. In terms of section 14 of the PMIRA 21, the authorized officers (AOs) who are entitled to inspect, examine, and investigate private medical institutions are the provincial directors of health services (PDHSs) or deputy PDHSs of the nine provinces. However, the PDHSs and deputy PDHSs do not wield the same authority as deputy director-generals (DDGs) of the central government, and consequently, may not have the same administrative authority. One option would be to strengthen the regulatory function at the provincial level by teaming up the AOs with high-level officers from the central government in the form of joint regulatory teams. In addition, efforts could be made to expand the knowledge and information base of the AOs, through regular training programs, on the optimal regulation of the private sector.
• Introducing a mechanism for addressing issues faced by the private sector in the
registration/approval process. A mechanism for reporting and addressing issues faced by private institution owners during the registration/approval process should be put in place at the central government level. This committee should be constituted at a high level, and should include all the relevant approval authorities of the GOSL. Such a mechanism would not only strengthen the regulatory process but also ensure that the private sector is supported in areas
43
where it requires such assistance. More broadly, consideration may be given to establish mechanisms for public-private dialogue on a routine basis, so that relevant issues can be discussed and addressed, and knowledge and experience can be shared.
• Develop technical and legal frameworks, accompanied by capacity building, for data sharing/reporting across the public and private facilities. Such frameworks could facilitate greater compliance of the private sector in reporting information to the government and ensure that the health information system of Sri Lanka has complete and accurate data that encompass the whole sector.
• Fostering a vibrant civil society, as well as greater provider and consumer awareness. An energetic civil society, and aware providers and consumers, are essential for the development, orderly functioning, and efficiency of a country’s health care system, and the proper implementation of its regulatory mechanisms. The Ministry of Health ought to be the principal promoter of consumer education regarding people’s rights to health and health care, their awareness of what constitutes good medical practice, and their knowledge of the provisions of the Private Medical Institutions Registration Act.
In sum, this review has shown that the private health sector in Sri Lanka is a growing force, due both to greater investment from private players as well as to greater demand from a population that is exercising its purchasing power to enjoy the benefits of “quicker,” “cleaner,” and “more flexible” service delivery. Should it be the case that the services offered by the private sector are only accessed by the better-off, or for optional and convenience-based needs, this increased demand for private health care services would not be an issue, and might even be desirable from an efficiency standpoint. However, the evidence shows that the poor are also seeking services in the private sector — whether because of gaps in the products and services offered by the public sector or due to perceived better quality of care. While recognizing that the private sector is not a panacea, this situation could perhaps be addressed by a more effective partnership with the private sector to fulfill public health goals and priorities of the government. Accordingly, the review has highlighted several areas related to the provision, financing, and regulation of the health sector where an effective policy response could ensure that Sri Lanka is able to leverage all available health resources in the interest of ensuring universal access to health care of a minimum acceptable quality to all citizens in an equitable and affordable manner. In addition to promoting universal access, harnessing the potential of the burgeoning private sector would also contribute to economic growth and development, in keeping with the thrust of the national health policy and the Mahinda Chintana.

44
Bibliography
Cavagnero, E. and Govindaraj, R., 2012. Household Health Expenditures and Utilization of Private Health Services, World Bank Background paper, Washington, DC. Goonaratne, C. 2012. Review of Regulations Governing Provision of Healthcare in the Private Sector in Sri Lanka. World Bank Background paper, Colombo, Sri Lanka. Gottret, P., G. Schieber, and H. Waters, ed. 2009. Good Practices in Health Financing. Washington, DC: The World Bank. Government of Sri Lanka 2002, 2007, 2010. Household Income and Expenditure Surveys. Department of Census and Statistics publication. Government of Sri Lanka 2008. Annual Health Bulletin. Department of Health publication. Government of Sri Lanka 2011. Annual Report, Central Bank of Sri Lanka. Hsiao, W. 2000. A Preliminary Assessment of Sri Lanka’s Health Sector and Steps Forward. Cambridge, MA: Harvard University Press. Kothalawala J. 2012. Mapping and Description of Private Health Sector Facilities in 4 DS Areas of the Northwestern Province. Background paper, World Bank, Colombo, Sri Lanka. Navaratne K and Kothalawala J. 2012. Management Practices Survey: Private Health Sector, Sri Lanka. Neilson Company, Lanka. O’Donnell O, van Doorslaer E, Rannan-Eliya RP, Somanathan A, Garg CC, Hanvoravongchai P, Huq MN, Karan A, Leung GM, Tin K and Chitpranee V. 2005. Explaining the Incidence of Catastrophic Expenditures on Health Care: Comparative Evidence from Asia. Equitap Project: Working Paper #5. Rannan-Eliya RP, I K Liyanage, J Jayanthan, N Wijemanne, S de Alwis, S Amarasinghe, I Siriwardana, S Dalpatadu and P Cooray. 2012. Study of Quality of Care in Public and Private Sectors. Institute for Health Policy, Sri Lanka. Rannan-Eliya RP, S Amarasinghe, S De Alwis, S Saleem and KCS Dalpatadu. 2012. Situational Analysis of the Private Health Sector. Institute for Health Policy, Sri Lanka. Salgado S. 2012. Health-seeking Behavior of Sri Lankans. The World Bank, Colombo, Sri Lanka. UNICEF 2012. Annual Report for Sri Lanka; UNICEF, New York. van Doorslaer, E., O'Donnell, O., Rannan-Eliya, R. P., Somanathan, A., Adhikari, S. R., Garg, C. C., Harbianto, D., Herrin, A. N., Huq, M. N., Ibragimova, S., Karan, A., Lee, T.-J., Leung, G. M., Lu, J.-F. R., Ng, C. W., Pande, B. R., Racelis, R., Tao, S., Tin, K., Tisayaticom, K., Trisnantoro, L., Vasavid, C. and Zhao, Y. 2007. Catastrophic payments for health care in Asia. Health Econ., 16: 1159–1184. doi: 10.1002/hec.1209. World Bank (2003). Health Policy Research in South Asia. World Bank, Washington DC.

45
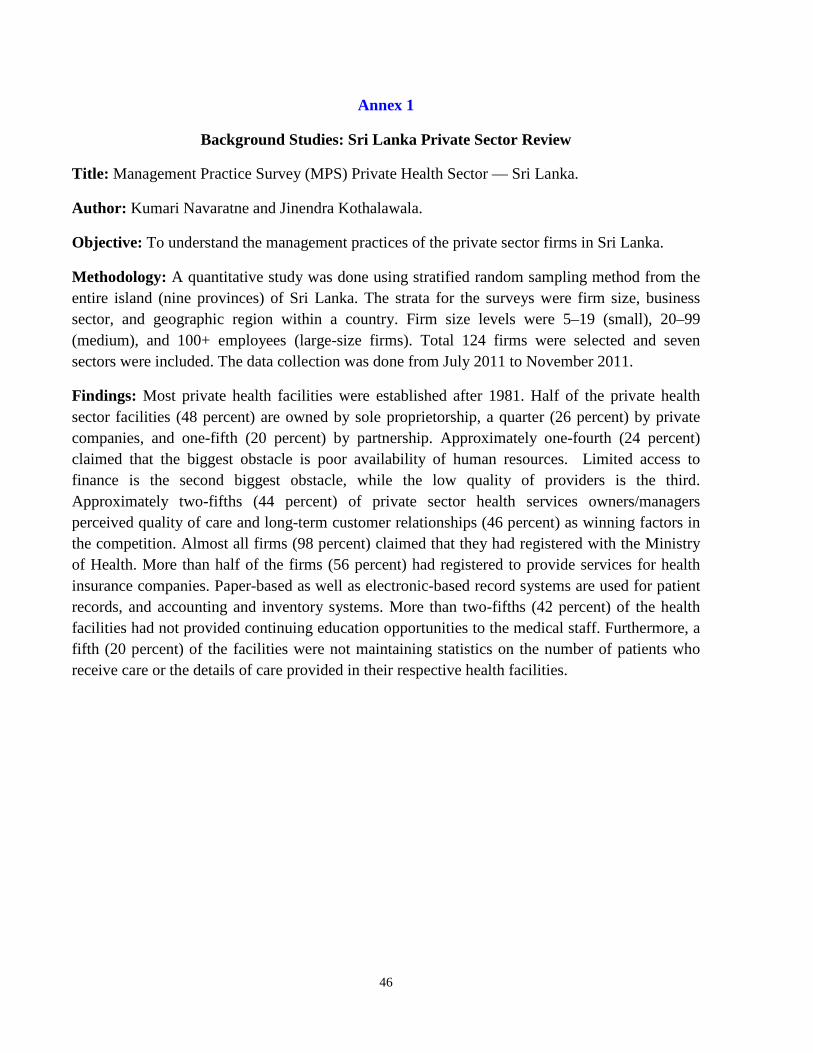
46
Annex 1
Background Studies: Sri Lanka Private Sector Review
Title: Management Practice Survey (MPS) Private Health Sector — Sri Lanka.
Author: Kumari Navaratne and Jinendra Kothalawala.
Objective: To understand the management practices of the private sector firms in Sri Lanka.
Methodology: A quantitative study was done using stratified random sampling method from the entire island (nine provinces) of Sri Lanka. The strata for the surveys were firm size, business sector, and geographic region within a country. Firm size levels were 5–19 (small), 20–99 (medium), and 100+ employees (large-size firms). Total 124 firms were selected and seven sectors were included. The data collection was done from July 2011 to November 2011.
Findings: Most private health facilities were established after 1981. Half of the private health sector facilities (48 percent) are owned by sole proprietorship, a quarter (26 percent) by private companies, and one-fifth (20 percent) by partnership. Approximately one-fourth (24 percent) claimed that the biggest obstacle is poor availability of human resources. Limited access to finance is the second biggest obstacle, while the low quality of providers is the third. Approximately two-fifths (44 percent) of private sector health services owners/managers perceived quality of care and long-term customer relationships (46 percent) as winning factors in the competition. Almost all firms (98 percent) claimed that they had registered with the Ministry of Health. More than half of the firms (56 percent) had registered to provide services for health insurance companies. Paper-based as well as electronic-based record systems are used for patient records, and accounting and inventory systems. More than two-fifths (42 percent) of the health facilities had not provided continuing education opportunities to the medical staff. Furthermore, a fifth (20 percent) of the facilities were not maintaining statistics on the number of patients who receive care or the details of care provided in their respective health facilities.

47
Title: Study of Quality of Care in Public and Private Sectors
Author: R. P. Rannan-Eliya, IK Liyanage, J Jayanthan, N Wijemanne, S de Alwis, S Amarasinghe, I Siriwardana, S Dalpatadu and P Cooray
Objectives: To assess levels and differences in quality of care in public and private medical sectors in Sri Lanka
Methodology: Ethical approval was taken from Institute for Health Policy (IHP) ethical review committee for study design and survey questionnaire. Survey was conducted in three districts (Colombo, Gampaha, and Galle) in hospitals and private GP clinics. Inpatient care was assessed using process indicators data; outpatient care was assessed using process indicator as well as outcome indicator (patient perceptions) data. Patients who had acute asthma or acute myocardial infarction (AMI) were included in the study. Data extraction and entry were done by pre-intern medical graduate using Apple iPads, and analysis was done using Stata 12.0.
Figure 1A.1 Sample Size
Inpatient
Diagnosis Public Private Acute asthma 442 295 AMI 307 81 Childbirth 407 436 Others 1,367 1,094 Total 2,523 1,816
Outpatient
Observation Exit survey Total no. approached 1,971 1,948 Participated 1,948 1,906 Refused 23 42 Source: Rannan-Eliya et al, 2012.
Findings: Overall inpatient treatment quality is mixed for asthma but good for AMI and childbirth. Treatment quality is similar in public and private sectors for asthma and AMI but many technology intensive/more costly therapy indicators are better in the private sector (oxygen saturation recording, cardiac enzymes, oxygen administration, PCI, thrombolysis in AMI), while some low-cost or routinized procedures are better in the public sector (beta-blockers, smoking assessment). Childbirth quality is also similar in both but neonatal APGAR recording is better in the public sector, and the caesarean section rate is very high in the private sector, reflecting bad incentives.
Overall outpatient quality for medical management and prescribing is relatively better than for OECD countries; furthermore, diarrhea and coughing management quality is much higher than in India and in other low-income countries.
48
Clinical quality of care is relatively high despite limited resources and high patient workloads, indicating that clinician training and norms make important contributions to good health outcomes. Interpersonal and consumer aspects of quality is worse in the public sector, again linked to fewer resources and higher workloads. Patient perceptions indicate that the private sector is chosen predominantly for better interpersonal quality than expectations of more appropriate treatment. Richer patients do obtain somewhat better clinical quality of care by using private providers, but only in some categories of care. Relatively high overall quality levels imply that free trade in medical services would damage public health.
Recommendations: Limited resources constrain clinical quality of care in the public sector. Improved resourcing is likely to improve quality, given that same doctors engage in better quality practice in the private sector.
Title: Situational Analysis of the Private Health Sector.
Author: R. P. Rannan-Eliya S Amarasinghe, S De Alwis, S Saleem and KCS Dalpatadu
Objectives: To profile selected dimensions of private health sector activity.
Methodology: The estimates have been reported for private hospitals and nursing homes providing services to the general public. They exclude the activities of the nongovernment estate hospitals that provide services to the estate population, and which are managed by the Plantation Human Development Trust. Private hospitals and nursing homes are defined as nongovernment establishments that routinely admit patients for an overnight stay, regardless of whether they are licensed or registered to provide such services. It is noted that this definition does not require an institution to have registered as a private medical institution with the Ministry of Health. The listing of private hospitals was compiled using the existing Institute for Health Policy (IHP) listing and the list of private medical institutions that had registered as private hospitals with the Ministry of Health as of January 2012, as per the requirements of the Private Medical Institutions (Registration) Act, no. 21 of 2006. All the institutions that were in this registration list were contacted and their status verified prior to conducting the survey; it was found that some of these institutions were not in fact inpatient institutions. IHP has compiled and updated, on a regular basis, a listing of private sector institutions that have provided or may have provided inpatient services in the period since 1990. This listing was initially developed in 1989, and successively expanded and updated through use in successive surveys, and by gathering information from a variety of sources. These have included listings of institutions maintained by pharmaceutical companies and other industry sources, directories of private health care institutions that are at times published by private agencies, articles published in the print and electronic media, and the telephone directory. Efforts were made to verify the listings by contacting the identified establishments by telephone, by mail, and in person, to ascertain their existence and functioning as inpatient institutions. Further, field visits have been

49
made at various times to most districts in the country to validate the listings for each area, and to check with local informants as to the accuracy and comprehensiveness of the listings. Of a total of 144 establishments surveyed, ten were found to be operating as outpatient facilities during the survey, six were not contactable and were most likely to have closed down, leaving a total of 128 establishments that potentially provide inpatient services. Of these 128 establishments, responses were obtained from 95 (75 percent). Laboratory services: Laboratory services have been estimated for private sector free-standing laboratories providing services to the general public. They exclude laboratory services provided at hospitals. The listings of free-standing laboratories were compiled using the list of private laboratories that had registered as private medical laboratories with the MoH as of January 2012, as per the requirements of the Private Medical Institutions (Registration) Act, no. 21 of 2006. A total of 496 private medical laboratories had registered as of January 2012.
A sample survey was conducted taking into consideration the laboratory size and the geographical coverage. Of a total of 149 establishments that were surveyed, 59 responded (40 percent), 11 were not able to be delivered (7 percent), and 5 had closed down their operations (3 percent). The delivery failure was usually due to laboratories discontinuing operations or to change of addresses. Subsequent analysis and production of overall estimates of spending used sample weights, and adjustments were made to reflect the response rates and non-registration of laboratories with the MoH.
Pharmaceutical sector: Results on the pharmaceutical sector are based on data provided by IMS Health and the Medical Supplies Division (MSD) of the MoH. The relative size of public and private provision of medicines can be evaluated using procurement data from the MSD of MoH, and data from IMS Health on the private pharmacy market. The MSD procurements account for over 95 percent of total public sector purchases, the remainder consists of local purchases by larger MoH hospitals using their own budget. IMS Health data cover sales by pharmacies, but exclude sales by private hospitals and dispensing doctors, who account for 10 percent of the private market. The following analysis adjusts the total MoH purchases by 5 percent to account for the non-MSD purchases and IMS wholesale audited total expenditure by 28.75 percent (retail mark-up of 16.25 percent and a 12.5 percent adjustment for non-coverage in the North and East Provinces) to take into account the total final sales.
Findings: The total expenditure on health by source of financing is more in private sector (54 percent) as compared to public (45 percent). More than three-fourth (81 percent) of the total expenditure on health comes from households and the remainder (19 percent) is shared by insurance, employers, providers’ own resources, and nonprofit institutions. There is a significant increase in private medical insurance firms since 1980s from 2 to 16.

50
The number of private hospitals has increased, but most are located in Western Province. Inpatient discharge by the private sector increased from 3.9 percent in 1990s to 4.5 percent in 2010, but public sector discharge still remains more than 95 percent. Of total beds, 65 percent are in Western Province; the remaining eight provinces have only 35 percent — some of them, in fact, even share less than 1 percent.
In 2011 private laboratories conducted 18.4 million tests and generated a revenue of Rs. 6.906 million; the prices of tests vary from laboratory to laboratory.
The distribution of medicines by value is more from private pharmacies (76 percent, 2009) than from MoH (24 percent, 2009); however, the volume of medicines supplied by MoH is more (52 percent, 2009) than by private pharmacies (48 percent, 2009).
Utilization of services by private providers differs by socioeconomic status. Poorer quintiles tend to use services from the public sector (69 percent outpatient, 94 percent inpatient, 2011), whereas the richest quintile prefers private services (77 percent outpatient, 54 percent inpatient). Inpatient services almost doubled in the private sector for the richest quintile in 2004 (28 percent) to 2011 (54 percent), whereas in the poorer quintiles it has been quite stable.
In 2006 the Private Health Services Regulatory Council (PHSRC) Act shifted MoH responsibility of regulation to PHSRC; since then private hospitals obtaining valid annual licenses has declined to 60 percent in 2011 from 92 percent in 2007. The actual revenue earned by PHSRC (4 million rupees) is six times less than the actual estimated potential (29 million rupees). This shows that PHSRC is not functioning effectively and that the involvement of private providers in a regulatory agency is contrary to best practice and unique by region.
Recommendations: Repeal the PHSRC Act and move regulatory functions back into MoH/Provincial Departments of Health with adequate funding.
Title: Household Health Expenditures and Utilization of Private Health Services.
Author: Eleonora Cavagnero and Ramesh Govindaraj
Objectives: The objectives of the study were to assess the trends in magnitude and distribution of household out-of-pocket expenditure (OOPE), to assess the fairness in health financing and to assess the health service utilization pattern across socioeconomic groups.
Methodology: The secondary data was collected from household income and expenditure survey 2002, 2007, and 2012 from the Department of Census and Statistics. The following approaches were used to measure burden of OOPE: WHO methodology using OOPE as a percent of household’s capacity to pay using nonfood expenditure (40 percent threshold); Wagstaff and van

51
Doorslaer methodology using OOPE as a percent of total household expenditure (using different thresholds); and calculating the Kakwani index (progressivity of financing).
Broad findings: OOPE is >50 percent of THE. OOPE as percent of total health expenditure is stable over time; The rich (Rs. 2,440) spend more than the poor (Rs. 250), but the poor spend proportionately more when OOPE is examined as a share of nonfood expenditure The most important OOPE category is Doctor’s Fees. The poor spend more on doctors and pharmaceuticals, while the rich spend more on doctors and private hospitals. The rich spend proportionately more on diagnostics and specialists. Lower utilization of health services by the poor may suggest that they are forgoing care because of costs. Only a small proportion of the population has catastrophic or impoverishing OOPE. Catastrophic expenditures are more concentrated among the rich, while impoverishing expenditures are more prevalent among the poor.
Title: Mapping and Description of Private Health Sector Facilities in Four Divisions Areas of the North Western Province.
Author: Jinendra Kothalawala
Objectives: Mapping of private health sector facilities utilizing GIS technology and providing a description of private health sector facilities in four Divisional Secretary areas of the North Western Province, to understand the extent to which the private sector is (or could be) included in health planning, and monitoring and evaluation, and to assess the facilities covered by the private health sector.
Methodology: Written consent was taken from the Ministry and Directorate of Health Authorities. The MoH officers informed the team to request assistance from public health inspectors (PHIs). The Divisional Secretaries also informed Grama Niladhari (GN) officers to help if needed; all the maps were collected at this time. The Nielsen field team visited and met PHI/GN officers and obtained further details before visiting the GN areas, Police stations were informed, all the visible private health facility providers were mapped by using GIS, photographed, and interviewed or observed and documented.
Findings: Private facilities in urban areas are higher (73 percent) than in rural (27 percent) areas. Private facilities like laboratories and pharmacies are concentrated in areas where government facilities are located. Health centers are also concentrated but exist in distance areas (on roads) with limited facilities like collection centers or laboratories. Health centers and clinics have been expanding from 2005 onwards. After 2008, there was a growth in the number of collecting centers and laboratories. Comparatively, pharmacies’ registration (72 percent) is higher than that of health centers (15 percent), and of collection centers/laboratories (16 percent). No major differences were apparent when identified by area or in urban versus rural areas.
52
Title: Review of Regulations Governing Provision of Health Care in the Private Sector in Sri Lanka (A Summary)
Author: Professor Colvin Goonaratne
Objectives: To review existing legislation and regulation, to assess how well those are being enforced/implemented. To identify gaps in the legislative framework, to recommend how the regulatory framework could be enhanced, and to describe perception public sector officials in the MoH have of private sector actors and vice versa; to identify potential areas of public-private collaboration; to review areas where such collaboration exists and document lessons learned therefrom.
Findings: GOSL is firmly committed as a matter of policy to encourage the development of private sector health care. Private sector health care is a fast-growing lucrative business. At least 80 percent of government sector doctors and other health care professionals are engaged in private practices mostly at “permitted” (very few legally) times, which raises questions about patients in GOSL and private sector institutions, teaching and mentoring of medical students, insurance, accountability, and ethics.
Individuals seek private sector health care for many reasons such as increased income, deficiencies in public sector health care, availability of GOSL specialist doctors in the private sector, and insurance coverage.
Regulating private sector health care is the responsibility of GOSL; thus, predominance, capability, commitment, and leadership need strengthening and are highly resource-intensive.
Private Medical Institutions (Registration) Act (PMIRA) no. 21 of 2006. PMIRA has two drawbacks: it has neither strong government predominance in the regulatory process nor regulations and control on private health insurance.
The Private Health Service Regulatory Council (PHSRC) objectives are not stated in PMIRA, and PHSRC does not include regulation on patient fees or implementation of private insurance schemes. The PHSRC has 28 members, of which only 11 are from MoH and the remaining from the private sector, which favors them on major issues.
Recommendations: Develop a new Private Medical Institutions (Registration) Act, which is comprehensive, effective, and adequately powered for strong government regulation, but also takes cognizance of public-private collaboration and future developments in health care provision.
53
Title: Health-Seeking Behavior of Sri Lanka
Author: Sandya Salgado
Objectives: To discuss health-seeking behavior, health-related expenditure, and attributes of the public and private health services in Sri Lanka.
Findings: The positive attributes figured out in Sri Lanka’s public health services were universal access to health services irrespective of class or creed, dependability on public health services, quality of doctors, nursing staff, and quality of services delivered in most instances. The not-so positives were lack of medicines, equipment, facilities for medical investigations, which leads to huge out-of-pocket expenditure for patient; lack of privacy and inability to choose the doctors and continue with him/her are additional drawbacks.
The Positive attributes of the private health sector are convenience, quality of care, freedom to choose the doctor and continue with the same, and privacy in outpatient care. The dissatisfactions were exorbitant medical bills, lack of transparency and credibility of those medical charges, lack of an independent body to maintain standards, selective government support to certain private sector health institutions which gives some providers an edge over others, poor insurance coverage and related issues.
Recommendations: Some recommendations made to private hospitals were to indicate approximate cost of treatment prior to admission and for more standardized private health sector.


H N P D i s c u s s i o N P a P e R
about this series...
This series is produced by the Health, Nutrition, and Population Family (HNP) of the World Bank’s Human Development Network. The papers in this series aim to provide a vehicle for publishing preliminary and unpolished results on HNP topics to encourage discussion and debate. The findings, interpretations, and conclusions expressed in this paper are entirely those of the author(s) and should not be attributed in any manner to the World Bank, to its affiliated organizations or to members of its Board of Executive Directors or the countries they represent. Citation and the use of material presented in this series should take into account this provisional character. For free copies of papers in this series please contact the individual authors whose name appears on the paper.
Enquiries about the series and submissions should be made directly to the Editor Martin Lutalo ([email protected]) or HNP Advisory Ser-vice ([email protected], tel 202 473-2256, fax 202 522-3234). For more information, see also www.worldbank.org/hnppublications.
THe woRlD baNk
1818 H Street, NWWashington, DC USA 20433Telephone: 202 473 1000Facsimile: 202 477 6391Internet: www.worldbank.orgE-mail: [email protected]
The Contribution of Traditional Herbal Medicine Practitioners to Kenyan Health Care Delivery
Results from Community Health-Seeking Behavior Vignettes and a Traditional Herbal Medicine Practitioner Survey
John Lambert, Kenneth Leonard with Geoffrey Mungai, Elizabeth Omindi-Ogaja, Gladys Gatheru, Tabitha Mirangi, Jennifer Owara, Christopher H. Herbst, GNV Ramana, Christophe Lemiere
September 2011