health care costs in the group - university of york · health care costs in the english nhs i...
TRANSCRIPT

CHE Research Paper 147
Health Care Costs in the English NHS: Reference Tables for Average Annual NHS Spend by Age, Sex and Deprivation Group
Miqdad Asaria


Health care costs in the English NHS: reference tables for average annual NHS spend by age, sex and deprivation group
Miqdad Asaria
Centre for Health Economics, University of York, York, UK April 2017

Background to series
CHE Discussion Papers (DPs) began publication in 1983 as a means of making current research material more widely available to health economists and other potential users. So as to speed up the dissemination process, papers were originally published by CHE and distributed by post to a worldwide readership. The CHE Research Paper series takes over that function and provides access to current research output via web-based publication, although hard copy will continue to be available (but subject to charge). Further copies
Copies of this paper are freely available to download from the CHE website www.york.ac.uk/che/publications/ Access to downloaded material is provided on the understanding that it is intended for personal use. Copies of downloaded papers may be distributed to third-parties subject to the proviso that the CHE publication source is properly acknowledged and that such distribution is not subject to any payment. Printed copies are available on request at a charge of £5.00 per copy. Please contact the CHE Publications Office, email [email protected], telephone 01904 321405 for further details. Centre for Health Economics Alcuin College University of York York, UK www.york.ac.uk/che © Miqdad Asaria

Health care costs in the English NHS i
Abstract
This paper describes how to calculate average health care costs broken down by age, sex and neighbourhood deprivation quintile group using the distribution of health care spending by the English NHS in the financial year 2011/12. The results presented here can be used by cost-effectiveness analysts to populate their extrapolation models when estimating future health care costs. The results will also be of interest to the broader community of health researchers as they illustrate how NHS spending is distributed across different subgroups within the population.

ii CHE Research Paper 147

Health care costs in the English NHS 1
1. Introduction
Economic evaluation of health technologies is routinely applied in the English NHS to assess whether new technologies represent a cost-effective use of health care resources. The current health technology assessment (HTA) process as implemented by the National Institute for Health and Care Excellence (NICE) considers in its assessment all future health benefits following treatment, whether these benefits flow directly from the treatment of the condition targeted by the technology being assessed or are incidental to this treatment. NICE’s most recent methodological guidance for HTA however, indicates that only future health care costs pertaining directly to the condition targeted should be considered in the economic evaluation of the technology rather than all future health care costs: [1]
“Costs related to the condition of interest and incurred in additional years of life gained as a result of treatment should be included in the reference-case analysis. Costs that are considered to be unrelated to the condition or technology of interest should be excluded.”
This uncomfortable asymmetry in the evaluation process has been recognised by the academic health economics community and recent literature suggests a consensus emerging amongst health economists that costs and health benefits be dealt with in a similar manner.[2] Put simply, in order to be coherent, economic evaluation should consider either all future costs and all future health benefits, or alternatively consider only disease specific future costs and disease specific future health benefits.[3] Furthermore, deciding and demarcating what should and should not count as unrelated is rarely straightforward, hence of the two options it would seem that considering all future costs and all future health benefits is to be preferred. It is well recognised that health care costs vary across the life-course with greater health care use by the very young, women during their child-bearing years and all people towards the end of their lives.[4] There is also increasing evidence that health care use varies by deprivation, with people living in more deprived neighbourhoods making greater use of health care at any given age than those living in more affluent neighbourhoods.[5] Both of these are important factors to consider when estimating future health care costs for the purpose of economic evaluation. This paper describes how to calculate average health care costs broken down by age, sex and neighbourhood deprivation quintile group using the distribution of health care spending by the English NHS in the financial year 2011/12. The results presented here can be used by cost-effectiveness analysts to populate their extrapolation models when estimating future health care costs. The results will also be of interest to the broader community of health researchers as they illustrate how NHS spending is distributed across different subgroups within the population.

2 CHE Research Paper 147
2. Methods
2.1 Data
Hospital admissions in England are recorded in the Hospital Episode Statistics (HES) dataset used to reimburse hospitals for the care they provided to patients admitted to hospital. This dataset contains details on every episode of care, and a new finished consultant episode (FCE) record is created for every new hospital admission and every time responsibility for the care of a patient passes from one consultant to another. The HES FCE records data about the patient (age, sex, and place of residence) and their hospital stay (diagnoses, procedures, length of stay). Using this information the FCE is allocated to a healthcare resource group (HRG), which collates hospital stays that use similar levels of resources. Hospitals are reimbursed by the NHS through the payments by results (PbR) system based on the HRG, adjusted for the specifics of the case – e.g. more complicated cases with longer than usual lengths of stay attract additional reimbursement. The costs that are attached to each HRG for each year and the variations in payments for more complex cases are given in the NHS national reference costs.[6] Details of how to derive costs from HES data are available in the PbR documentation [7] and their use in health economic analysis is discussed in Asaria et al.[8] We used HES inpatient data for financial year 2011/12 and associated reference costs in this study. Hospitals also provide a range of services to patients that do not require admission, these include visits to see specialists and various programmes of follow up care. These are collected in the HES outpatient dataset. Outpatient visits are not currently part of the PbR system and so cannot be as easily micro-costed in the way that inpatient admissions are. For the purpose of this analysis we therefore assume that there is no systematic variation in the costs of outpatient visits, and hence use the total NHS spend on outpatient care and the count of the total number of outpatient visits to calculate an average cost per outpatient visit. The total cost of outpatient visits was calculated using the Department of Health’s reported budget for hospital and community health services from which total inpatient admissions costs were subtracted.[9] The other key area of NHS spending is on primary care. We split primary care spending into two parts for the purpose of this analysis. The first part consisting of visits to general practitioners, prescriptions and pharmaceutical services. The second consisting of spending on dental and ophthalmology services. Detailed administrative data covering primary care are not currently collected in the same way that they are for secondary care. There are however various pieces of research looking at demographic patterns in visits to general practitioners and we used research by Q Research,[10] together with our analysis of outpatient hospital data to estimate the distribution of primary care use in the first part of the primary care budget. The second part of the primary care budget was assumed to be equally distributed across the population for the purposes of this analysis. Figures for total NHS spending on the various sub-categories of primary care were taken from the Department of Health’s published accounts.[9] The basic geographical unit of analysis used in this study was the lower layer super output area (LSOA). The country is divided into 32,482 LSOAs based on the 2001 census each containing on average 1,500 people (range 1,000 to 3,000). Population data for 2011/12 were taken from the ONS mid-year population estimates split by LSOA, sex and age (ages 0-84 in single year estimates and then 85+). Area deprivation for LSOAs is measured using the index of multiple deprivation (IMD) for 2010. We grouped LSOAs into deprivation quintiles based on their IMD overall rank ranging from Q1 (the most deprived fifth of LSOAs) to Q5 (the least deprived fifth of LSOAs).

Health care costs in the English NHS 3
2.2 Analysis
HES inpatient data was grouped into age, sex and IMD quintile categories. The total cost for each age, sex and IMD quintile group was calculated by combining the HRG associated with each admission with the relevant reference cost. This aggregated cost was then divided by the population in each age, sex and IMD quintile group using ONS population estimates to estimate average inpatient costs for each group:
𝑎𝑣𝑒𝑟𝑎𝑔𝑒_𝑖𝑛𝑝𝑎𝑡𝑖𝑒𝑛𝑡_𝑐𝑜𝑠𝑡𝑎𝑔𝑒,𝑠𝑒𝑥,𝑖𝑚𝑑 = ∑ 𝑖𝑛𝑝𝑎𝑡𝑖𝑒𝑛𝑡_𝑐𝑜𝑠𝑡𝑠𝑎𝑔𝑒,𝑠𝑒𝑥,𝑖𝑚𝑑
∑ 𝑝𝑜𝑝𝑢𝑙𝑎𝑡𝑖𝑜𝑛𝑎𝑔𝑒,𝑠𝑒𝑥,𝑖𝑚𝑑
HES outpatient data was grouped into age, sex and IMD quintile categories. The total number of outpatient visits for each age, sex and IMD quintile group were counted. These counts were multiplied by the average cost of an outpatient visit and divided by the population in each age, sex and IMD quintile group using ONS population estimates to estimate average outpatient costs for each group:
𝑎𝑣𝑒𝑟𝑎𝑔𝑒_𝑜𝑢𝑡𝑝𝑎𝑡𝑖𝑒𝑛𝑡_𝑐𝑜𝑠𝑡𝑎𝑔𝑒,𝑠𝑒𝑥,𝑖𝑚𝑑
= ∑ 𝑜𝑢𝑡𝑝𝑎𝑡𝑖𝑒𝑛𝑡_𝑣𝑖𝑠𝑖𝑡𝑠𝑎𝑔𝑒,𝑠𝑒𝑥,𝑖𝑚𝑑
∑ 𝑝𝑜𝑝𝑢𝑙𝑎𝑡𝑖𝑜𝑛𝑎𝑔𝑒,𝑠𝑒𝑥,𝑖𝑚𝑑×
𝑡𝑜𝑡𝑎𝑙_𝑜𝑢𝑡𝑝𝑎𝑡𝑖𝑒𝑛𝑡_𝑏𝑢𝑑𝑔𝑒𝑡
∑ 𝑜𝑢𝑡𝑝𝑎𝑡𝑖𝑒𝑛𝑡_𝑣𝑖𝑠𝑖𝑡𝑠
Total numbers of visits to general practitioners were calculated by combining utilisation rates by age and sex with ONS population data. The deprivation gradient from outpatient visits was applied to these totals to get the age, sex and IMD group breakdown of GP visits and these were then divided through by the overall total number of GP visits to derive primary care weights which were applied to the budget for GP, prescription and pharmaceutical services to get total NHS spend on these categories by age, sex and deprivation group. This spend was then divided by the population in each age, sex and IMD quintile group using ONS population estimates to estimate average costs for each group:
𝑎𝑣𝑒𝑟𝑎𝑔𝑒_𝑔𝑝_𝑝ℎ𝑎𝑟𝑚𝑎_𝑐𝑜𝑠𝑡𝑎𝑔𝑒,𝑠𝑒𝑥,𝑖𝑚𝑑
= 𝑔𝑝_𝑢𝑡𝑖𝑙𝑖𝑠𝑎𝑡𝑖𝑜𝑛_𝑟𝑎𝑡𝑒𝑎𝑔𝑒,𝑠𝑒𝑥 × 𝑝𝑜𝑝𝑢𝑙𝑎𝑡𝑖𝑜𝑛𝑎𝑔𝑒,𝑠𝑒𝑥
∑ ∑ 𝑔𝑝_𝑢𝑡𝑖𝑙𝑖𝑠𝑎𝑡𝑖𝑜𝑛_𝑟𝑎𝑡𝑒𝑎𝑔𝑒,𝑠𝑒𝑥 × 𝑝𝑜𝑝𝑢𝑙𝑎𝑡𝑖𝑜𝑛𝑎𝑔𝑒,𝑠𝑒𝑥
×∑ 𝑜𝑢𝑡𝑝𝑎𝑡𝑖𝑒𝑛𝑡_𝑣𝑖𝑠𝑖𝑡𝑠𝑎𝑔𝑒,𝑠𝑒𝑥,𝑖𝑚𝑑
∑ 𝑜𝑢𝑡𝑝𝑎𝑡𝑖𝑒𝑛𝑡_𝑣𝑖𝑠𝑖𝑡𝑠𝑎𝑔𝑒,𝑠𝑒𝑥×
𝑡𝑜𝑡𝑎𝑙_𝑔𝑝_𝑝ℎ𝑎𝑟𝑚𝑎_𝑏𝑢𝑑𝑔𝑒𝑡
∑ 𝑝𝑜𝑝𝑢𝑙𝑎𝑡𝑖𝑜𝑛𝑎𝑔𝑒,𝑠𝑒𝑥,𝑖𝑚𝑑
The dental and ophthalmic services budget was assumed to be equally allocated to each subgroup and so just averaged across the total population:
𝑎𝑣𝑒𝑟𝑎𝑔𝑒_𝑑𝑒𝑛𝑡𝑎𝑙_𝑜𝑝𝑡ℎ𝑎𝑙𝑚𝑖𝑐_𝑐𝑜𝑠𝑡 = 𝑡𝑜𝑡𝑎𝑙_𝑑𝑒𝑛𝑡𝑎𝑙_𝑜𝑝𝑡ℎ𝑎𝑙𝑚𝑖𝑐_𝑏𝑢𝑑𝑔𝑒𝑡
∑ 𝑝𝑜𝑝𝑢𝑙𝑎𝑡𝑖𝑜𝑛
Finally total average NHS spend by age, sex and IMD quintile group was calculated as a sum of the averages of these subcategories of NHS spend:
𝑎𝑣𝑒𝑟𝑎𝑔𝑒_𝑛ℎ𝑠_𝑐𝑜𝑠𝑡𝑎𝑔𝑒,𝑠𝑒𝑥,𝑖𝑚𝑑
= 𝑎𝑣𝑒𝑟𝑎𝑔𝑒_𝑖𝑛𝑝𝑎𝑡𝑖𝑒𝑛𝑡_𝑐𝑜𝑠𝑡𝑎𝑔𝑒,𝑠𝑒𝑥,𝑖𝑚𝑑 + 𝑎𝑣𝑒𝑟𝑎𝑔𝑒_𝑜𝑢𝑡𝑝𝑎𝑡𝑖𝑒𝑛𝑡_𝑐𝑜𝑠𝑡𝑎𝑔𝑒,𝑠𝑒𝑥,𝑖𝑚𝑑
+ 𝑎𝑣𝑒𝑟𝑎𝑔𝑒_𝑔𝑝_𝑝ℎ𝑎𝑟𝑚𝑎_𝑐𝑜𝑠𝑡𝑎𝑔𝑒,𝑠𝑒𝑥,𝑖𝑚𝑑 + 𝑎𝑣𝑒𝑟𝑎𝑔𝑒_𝑑𝑒𝑛𝑡𝑎𝑙_𝑜𝑝𝑡ℎ𝑎𝑙𝑚𝑖𝑐_𝑐𝑜𝑠𝑡
The analysis was performed using Oracle 11g, R 3.2.3 and MS Excel 2013 - the analysis code is available at https://github.com/miqdadasaria/hospital_costs
4 CHE Research Paper 147
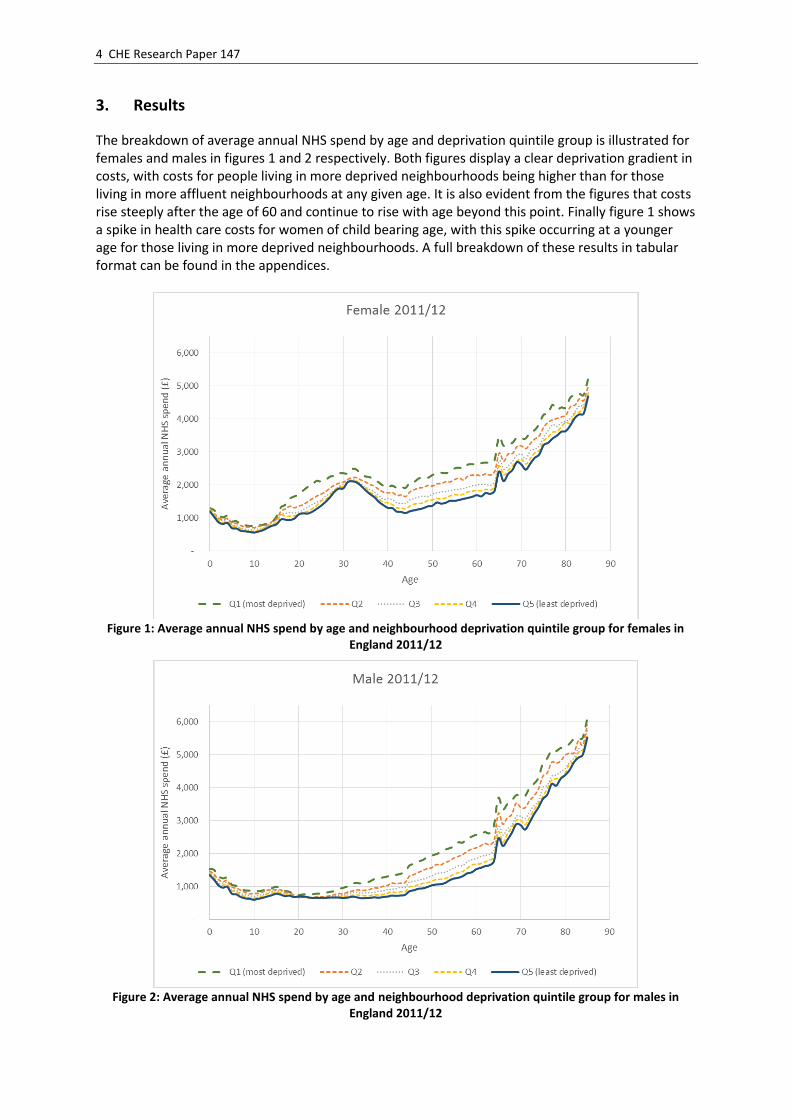
3. Results
The breakdown of average annual NHS spend by age and deprivation quintile group is illustrated for females and males in figures 1 and 2 respectively. Both figures display a clear deprivation gradient in costs, with costs for people living in more deprived neighbourhoods being higher than for those living in more affluent neighbourhoods at any given age. It is also evident from the figures that costs rise steeply after the age of 60 and continue to rise with age beyond this point. Finally figure 1 shows a spike in health care costs for women of child bearing age, with this spike occurring at a younger age for those living in more deprived neighbourhoods. A full breakdown of these results in tabular format can be found in the appendices.
Figure 1: Average annual NHS spend by age and neighbourhood deprivation quintile group for females in
England 2011/12
Figure 2: Average annual NHS spend by age and neighbourhood deprivation quintile group for males in
England 2011/12

Health care costs in the English NHS 5
We also use these results to calculate the total cost borne by the NHS associated with inequality. This is calculated as the difference between actual costs observed and the costs that we would have observed if those living in more deprived neighbourhoods had similar average costs to those living in the most affluent fifth of neighbourhoods. This total cost associated with inequality for year 2011/12 was £12.52 billion.

6 CHE Research Paper 147
4. Discussion
The analysis presented here indicates that health care costs at any given age are higher for those living in more deprived neighbourhoods than those living in more affluent neighbourhoods. Research looking at the social distribution of health has found that quality of life is also lower at any given age for those living in more deprived neighbourhoods than for those living in more affluent neighbourhoods.[11] Taken together these results when applied in health technology assessment mean than new technologies, even if equally effective across the deprivation gradient, will have less chance of being deemed cost-effective for those living in more deprived areas than for those living in more affluent areas when we take into consideration the variation in remaining lifetime health care cost and quality adjusted health gain. Health care provision is not just about maximising aggregate health in the population but also has the reduction of health inequalities as one of its key objectives and this is reflected in the high levels of health inequality aversion demonstrated by members of the public in England.[12] Standard cost-effectiveness analysis can be extended to account for these differential lifetime health care cost and quality of life trajectories as well as incorporating the notion of health inequality aversion by using novel methods such as distributional cost effectiveness analysis (DCEA).[13,14] There are a number of limitations that should be considered when using the results presented here in the context of cost-effectiveness analysis. The first is that these estimates are based on data for financial year 2011/12 – when using these results to extrapolate costs for other years care must be taken to understand how best to adjust these costs to reflect how they will change over time. This is no different to other costs used in cost-effectiveness analysis and similar approaches can be applied to deal with the extrapolation of these costs. The second is what is to be assumed about neighbourhood deprivation over time – for example are people who currently live in the most deprived fifth of neighbourhoods likely to remain living in similarly deprived neighbourhoods throughout their lives?. If deprivation specific costs are to be used then a view needs to be taken on the degree of social mobility over time. Finally the costs presented here are average costs, to reflect the uncertainty in these average costs, for example for use in probabilistic sensitivity analysis of a cost-effectiveness model, some measure of their distribution would need to be calculated.

Health care costs in the English NHS 7
References
1 NICE. Guide to the methods of technology appraisal. London: 2013. https://www.nice.org.uk/process/pmg9
2 Morton A, Adler AI, Bell D, et al. Unrelated Future Costs and Unrelated Future Benefits: Reflections on NICE Guide to the Methods of Technology Appraisal. Health Economics 2016;25:933–8. doi:10.1002/hec.3366.
3 van Baal P, Meltzer D, Brouwer W. Future Costs, Fixed Healthcare Budgets, and the Decision Rules of Cost-Effectiveness Analysis. Health Economics 2016;25:237–48. doi:10.1002/hec.3138.
4 Kelly E, Stoye G, Vera-Hernández M. Public hospital spending in England: evidence from National Health Service administrative records. Fiscal Studies 2016.
5 Asaria M, Doran T, Cookson R. The costs of inequality: whole-population modelling study of lifetime inpatient hospital costs in the English National Health Service by level of neighbourhood deprivation. Journal of Epidemiology &Community Health 2016;:jech-2016-207447. doi:10.1136/jech-2016-207447.
6 Department of Health. NHS reference costs: financial year 2011 to 2012. 2012. https://www.gov.uk/government/publications/nhs-reference-costs-financial-year-2011-to-2012
7 Department of Health Payment by Results team. A simple guide to Payment by Results. 2012. doi:10.1111/j.1478-5153.2009.00351_5.x.
8 Asaria M, Grasic K, Walker S. Using Linked Electronic Health Records to Estimate Healthcare Costs: Key Challenges and Opportunities. Pharmacoeconomics 2015;1–6. doi:10.1007/s40273-015-0358-8.
9 Department of Health. Department of Health Annual Report and Accounts 2011-12. London: 2012. https://www.gov.uk/government/uploads/system/uploads/attachment_data/file/212977/23735_HC-66-DoH.pdf
10 NHS Digital. Trends in consultation rates in General Practice. 2011.https://data.gov.uk/dataset/trends_in_consultation_rates_in_general_practice
11 Love-Koh J, Asaria M, Cookson R, et al. The Social Distribution of Health: Estimating Quality-Adjusted Life Expectancy in England. Value Health 2015;18:655–62. doi:10.1016/j.jval.2015.03.1784
12 Robson M, Asaria M, Cookson R, et al. Eliciting the level of health inequality aversion in England. Health Economics 2016.
13 Asaria M, Griffin S, Cookson R, et al. Distributional Cost-Effectiveness Analysis of Health Care Programmes - A Methodological Case Study of the UK Bowel Cancer Screening Programme. Health Economics 2015;24:742–54. doi:10.1002/hec.3058.
14 Asaria M, Griffin S, Cookson R. Distributional Cost-Effectiveness Analysis: A Tutorial. Medical
Decision Making 2016;36:8–19. doi:10.1177/0272989X15583266.

8 CHE Research Paper 147
Appendix
Table 1: Average annual NHS spend for women broken down by age and deprivation quintile group 2011/12
Age Female
Q1 (most deprived) Q2 Q3 Q4 Q5 (least deprived) Overall Female
0 1297 1,255 1,222 1,267 1,209 1,255
1 1,240 1,136 1,085 1,118 1,038 1,135
2 1,095 997 974 938 870 986
3 1,017 952 924 861 825 925
4 1,062 983 966 898 852 960
5 900 842 800 767 696 807
6 901 832 773 735 685 791
7 819 764 698 672 614 717
8 777 723 671 621 600 681
9 757 722 634 594 578 659
10 766 703 679 608 562 664
11 779 746 672 623 594 682
12 791 762 702 681 635 713
13 839 793 785 738 705 771
14 881 892 872 808 767 843
15 1,034 966 952 882 811 928
16 1,316 1,207 1,117 1,092 957 1,135
17 1,402 1,273 1,145 1,048 954 1,163
18 1,582 1,356 1,174 1,061 946 1,230
19 1,652 1,310 1,160 1,068 984 1,259
20 1,708 1,360 1,185 1,114 1,110 1,331
21 1,834 1,403 1,257 1,170 1,144 1,405
22 1,935 1,496 1,338 1,205 1,138 1,475
23 2,006 1,582 1,417 1,278 1,188 1,552

Health care costs in the English NHS 9
Age Female
Q1 (most deprived) Q2 Q3 Q4 Q5 (least deprived) Overall Female
24 2,123 1,663 1,484 1,377 1,278 1,651
25 2,108 1,725 1,544 1,513 1,373 1,714
26 2,145 1,798 1,669 1,563 1,489 1,790
27 2,252 1,906 1,749 1,676 1,628 1,895
28 2,286 1,996 1,859 1,846 1,794 1,996
29 2,365 2,053 1,964 1,929 1,895 2,075
30 2,358 2,086 2,028 1,953 1,900 2,093
31 2,354 2,173 2,125 2,066 2,092 2,176
32 2,491 2,222 2,166 2,124 2,117 2,238
33 2,468 2,223 2,131 2,118 2,080 2,215
34 2,342 2,148 2,030 1,955 1,980 2,100
35 2,261 2,091 1,931 1,913 1,843 2,016
36 2,238 2,015 1,869 1,777 1,728 1,930
37 2,164 1,962 1,787 1,703 1,632 1,850
38 2,080 1,858 1,684 1,567 1,492 1,733
39 1,979 1,785 1,574 1,479 1,394 1,638
40 1,923 1,759 1,593 1,461 1,311 1,602
41 1,986 1,774 1,560 1,405 1,305 1,597
42 1,914 1,679 1,461 1,304 1,197 1,500
43 1,953 1,698 1,460 1,302 1,187 1,505
44 1,912 1,650 1,443 1,278 1,151 1,470
45 2,071 1,799 1,561 1,372 1,209 1,578
46 2,098 1,862 1,598 1,422 1,238 1,618
47 2,203 1,909 1,646 1,436 1,268 1,661
48 2,217 1,923 1,664 1,461 1,301 1,683
49 2,219 1,985 1,651 1,534 1,356 1,722
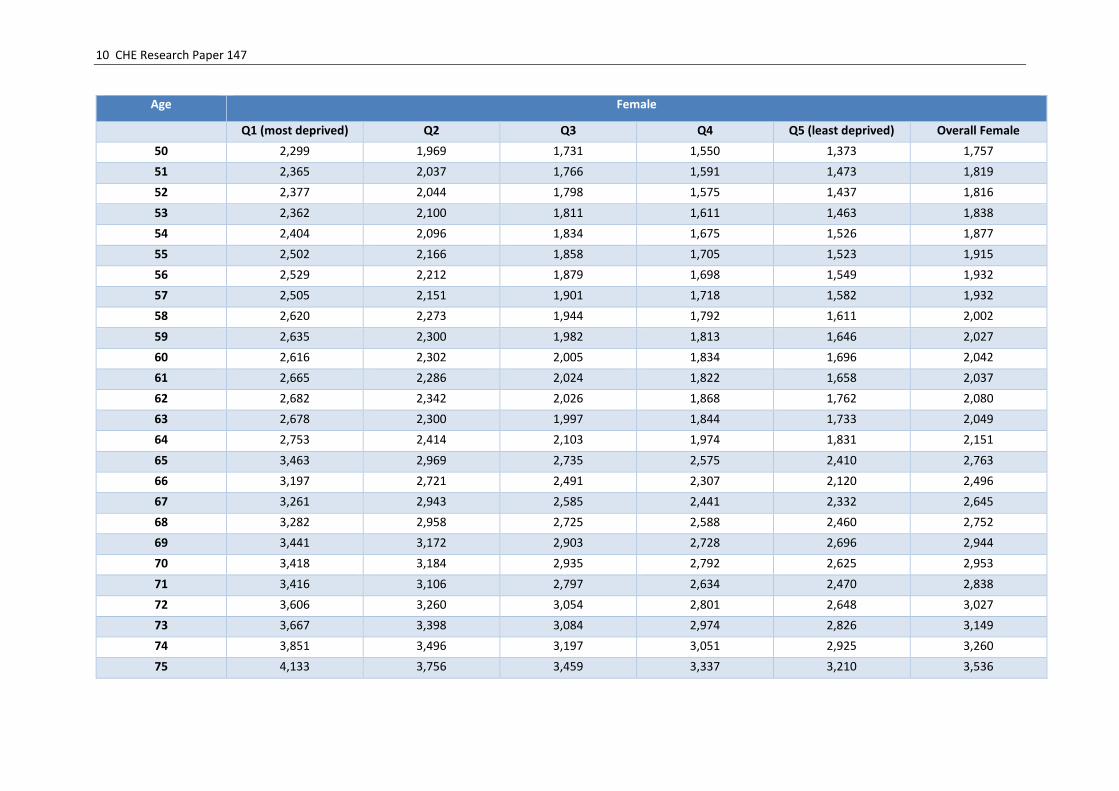
10 CHE Research Paper 147
Age Female
Q1 (most deprived) Q2 Q3 Q4 Q5 (least deprived) Overall Female
50 2,299 1,969 1,731 1,550 1,373 1,757
51 2,365 2,037 1,766 1,591 1,473 1,819
52 2,377 2,044 1,798 1,575 1,437 1,816
53 2,362 2,100 1,811 1,611 1,463 1,838
54 2,404 2,096 1,834 1,675 1,526 1,877
55 2,502 2,166 1,858 1,705 1,523 1,915
56 2,529 2,212 1,879 1,698 1,549 1,932
57 2,505 2,151 1,901 1,718 1,582 1,932
58 2,620 2,273 1,944 1,792 1,611 2,002
59 2,635 2,300 1,982 1,813 1,646 2,027
60 2,616 2,302 2,005 1,834 1,696 2,042
61 2,665 2,286 2,024 1,822 1,658 2,037
62 2,682 2,342 2,026 1,868 1,762 2,080
63 2,678 2,300 1,997 1,844 1,733 2,049
64 2,753 2,414 2,103 1,974 1,831 2,151
65 3,463 2,969 2,735 2,575 2,410 2,763
66 3,197 2,721 2,491 2,307 2,120 2,496
67 3,261 2,943 2,585 2,441 2,332 2,645
68 3,282 2,958 2,725 2,588 2,460 2,752
69 3,441 3,172 2,903 2,728 2,696 2,944
70 3,418 3,184 2,935 2,792 2,625 2,953
71 3,416 3,106 2,797 2,634 2,470 2,838
72 3,606 3,260 3,054 2,801 2,648 3,027
73 3,667 3,398 3,084 2,974 2,826 3,149
74 3,851 3,496 3,197 3,051 2,925 3,260
75 4,133 3,756 3,459 3,337 3,210 3,536

Health care costs in the English NHS 11
Age Female
Q1 (most deprived) Q2 Q3 Q4 Q5 (least deprived) Overall Female
76 4,159 3,910 3,655 3,460 3,281 3,654
77 4,434 3,980 3,831 3,603 3,411 3,807
78 4,289 4,023 3,780 3,620 3,500 3,807
79 4,359 4,071 3,894 3,776 3,620 3,914
80 4,353 4,127 3,926 3,901 3,640 3,963
81 4,653 4,382 4,025 3,870 3,807 4,108
82 4,724 4,426 4,226 4,174 4,032 4,289
83 4,780 4,617 4,401 4,207 4,142 4,403
84 4,736 4,568 4,419 4,377 4,169 4,435
85+ 5,205 5,008 4,797 4,767 4,686 4,871

12 CHE Research Paper 147
Table 2: Average annual NHS spend for men broken down by age and deprivation quintile group 2011/12
Age Male
Q1 (most deprived) Q2 Q3 Q4 Q5 (least deprived) Overall Male
0 1,530 1,464 1,431 1,409 1,347 1,448
1 1,495 1,367 1,315 1,252 1,210 1,345
2 1,300 1,208 1,111 1,068 1,037 1,160
3 1,240 1,133 1,097 1,032 962 1,105
4 1,256 1,179 1,109 1,056 991 1,128
5 1,048 978 902 868 784 924
6 1,014 943 878 841 762 894
7 939 882 792 737 682 811
8 870 814 752 691 639 756
9 864 768 716 647 624 727
10 855 783 688 643 599 714
11 853 781 722 659 627 728
12 871 827 752 702 654 760
13 922 880 794 769 696 811
14 939 887 842 792 733 837
15 989 898 873 822 778 870
16 929 890 852 804 754 844
17 860 822 802 771 706 791
18 828 798 784 737 720 774
19 756 734 705 682 678 713
20 732 657 655 665 692 681
21 749 662 665 673 692 689
22 764 667 659 634 679 684
23 755 649 663 649 649 677
24 772 683 668 663 649 693
25 777 681 668 644 648 692

Health care costs in the English NHS 13
Age Male
Q1 (most deprived) Q2 Q3 Q4 Q5 (least deprived) Overall Male
26 792 683 660 647 649 695
27 829 711 673 649 664 716
28 848 738 694 661 667 734
29 911 777 724 676 665 766
30 949 769 728 679 646 771
31 992 817 767 704 660 806
32 1,070 848 800 716 687 841
33 1,098 890 827 741 677 863
34 1,085 881 793 719 643 839
35 1,100 876 801 711 644 839
36 1,139 898 807 708 647 849
37 1,211 952 813 743 672 883
38 1,230 946 850 731 659 885
39 1,267 996 861 744 677 907
40 1,294 1,020 899 783 691 936
41 1,357 1,100 911 834 721 982
42 1,345 1,073 929 802 712 967
43 1,378 1,095 972 831 726 993
44 1,437 1,108 970 831 745 1,007
45 1,629 1,312 1,131 982 855 1,167
46 1,679 1,355 1,150 995 884 1,194
47 1,751 1,418 1,192 1,050 931 1,248
48 1,796 1,482 1,217 1,082 940 1,280
49 1,880 1,533 1,264 1,104 981 1,326
50 1,929 1,564 1,318 1,155 1,035 1,375
51 1,974 1,659 1,385 1,203 1,062 1,430
52 2,029 1,643 1,408 1,214 1,066 1,443

14 CHE Research Paper 147
Age Male
Q1 (most deprived) Q2 Q3 Q4 Q5 (least deprived) Overall Male
53 2,107 1,722 1,429 1,232 1,105 1,486
54 2,154 1,768 1,490 1,292 1,186 1,544
55 2,211 1,858 1,553 1,366 1,241 1,612
56 2,333 1,907 1,626 1,411 1,263 1,668
57 2,326 1,966 1,630 1,450 1,312 1,696
58 2,459 2,060 1,749 1,547 1,399 1,799
59 2,505 2,133 1,811 1,646 1,429 1,859
60 2,562 2,166 1,840 1,671 1,523 1,904
61 2,570 2,226 1,904 1,687 1,562 1,939
62 2,645 2,300 1,943 1,740 1,616 1,989
63 2,608 2,264 1,971 1,798 1,646 1,999
64 2,820 2,377 2,103 1,893 1,765 2,121
65 3,680 3,214 2,854 2,657 2,460 2,892
66 3,330 2,885 2,561 2,338 2,227 2,590
67 3,486 3,080 2,747 2,583 2,409 2,784
68 3,595 3,182 2,848 2,788 2,621 2,943
69 3,760 3,525 3,126 3,000 2,887 3,204
70 3,761 3,397 3,136 3,017 2,864 3,189
71 3,737 3,383 3,059 2,869 2,727 3,099
72 3,970 3,598 3,265 3,079 2,935 3,310
73 4,109 3,741 3,455 3,329 3,188 3,514
74 4,281 3,950 3,595 3,520 3,394 3,697
75 4,712 4,340 4,012 3,736 3,655 4,028
76 4,882 4,442 4,070 3,962 3,786 4,165
77 5,116 4,769 4,352 4,226 4,112 4,452
78 5,102 4,740 4,383 4,274 4,058 4,450
79 5,195 4,806 4,490 4,311 4,268 4,555

Health care costs in the English NHS 15
Age Male
Q1 (most deprived) Q1 (most deprived) Q1 (most deprived)
80 5,223 4,979 4,579 4,423 4,376 4,661
81 5,320 5,049 4,776 4,723 4,527 4,835
82 5,472 5,052 4,909 4,778 4,769 4,954
83 5,485 5,417 5,194 5,072 4,911 5,182
84 5,503 5,290 5,140 5,117 5,004 5,184
85+ 6,049 5,901 5,740 5,577 5,516 5,724

16 CHE Research Paper 147
Table 3: Average annual NHS spend overall broken down by age and deprivation quintile group 2011/12 Age Overall
Q1 (most deprived) Q2 Q3 Q4 Q5 (least deprived) Overall
0 1,416 1,362 1,330 1,340 1,280 1,354
1 1,370 1,254 1,203 1,187 1,126 1,242
2 1,200 1,105 1,044 1,005 956 1,076
3 1,131 1,045 1,012 949 896 1,017
4 1,161 1,083 1,039 979 923 1,046
5 976 912 853 819 741 867
6 959 889 826 789 724 844
7 880 824 746 705 649 765
8 825 770 712 657 620 720
9 812 746 676 621 602 694
10 811 744 684 626 581 689
11 817 764 697 641 611 705
12 832 795 728 692 645 737
13 881 838 790 754 700 791
14 911 889 857 800 749 840
15 1,011 931 912 851 794 898
16 1,117 1,044 981 943 852 985
17 1,125 1,041 969 906 825 971
18 1,198 1,070 974 893 828 995
19 1,197 1,021 927 866 822 979
20 1,221 1,004 910 876 883 995
21 1,296 1,030 950 908 899 1,037
22 1,356 1,075 986 904 892 1,068
23 1,386 1,102 1,025 944 896 1,099
24 1,448 1,158 1,057 997 934 1,153
25 1,449 1,196 1,093 1,051 982 1,189

Health care costs in the English NHS 17
Age Overall
Q1 (most deprived) Q2 Q3 Q4 Q5 (least deprived) Overall
26 1,474 1,231 1,147 1,077 1,036 1,227
27 1,537 1,296 1,190 1,132 1,108 1,286
28 1,561 1,347 1,251 1,218 1,193 1,341
29 1,644 1,404 1,330 1,279 1,258 1,409
30 1,652 1,415 1,366 1,304 1,263 1,422
31 1,672 1,484 1,435 1,380 1,373 1,485
32 1,775 1,517 1,473 1,416 1,414 1,533
33 1,775 1,538 1,470 1,435 1,392 1,535
34 1,701 1,494 1,400 1,342 1,329 1,464
35 1,668 1,464 1,355 1,315 1,257 1,421
36 1,675 1,439 1,332 1,246 1,198 1,384
37 1,681 1,444 1,296 1,230 1,164 1,366
38 1,652 1,393 1,264 1,158 1,086 1,310
39 1,626 1,390 1,219 1,117 1,046 1,276
40 1,610 1,386 1,248 1,129 1,014 1,273
41 1,670 1,434 1,237 1,125 1,022 1,292
42 1,630 1,375 1,197 1,057 961 1,236
43 1,662 1,394 1,216 1,070 961 1,250
44 1,673 1,376 1,206 1,057 953 1,239
45 1,848 1,554 1,346 1,181 1,037 1,374
46 1,888 1,607 1,375 1,211 1,064 1,407
47 1,976 1,662 1,420 1,247 1,104 1,456
48 2,008 1,703 1,442 1,276 1,125 1,485
49 2,051 1,761 1,461 1,323 1,172 1,527
50 2,116 1,768 1,528 1,356 1,207 1,568
51 2,172 1,851 1,579 1,401 1,270 1,627
52 2,204 1,846 1,606 1,397 1,254 1,631

18 CHE Research Paper 147
Age Overall
Q1 (most deprived) Q2 Q3 Q4 Q5 (least deprived) Overall
53 2,235 1,912 1,622 1,424 1,286 1,664
54 2,280 1,934 1,665 1,486 1,357 1,712
55 2,357 2,014 1,708 1,538 1,383 1,765
56 2,431 2,061 1,755 1,558 1,408 1,802
57 2,416 2,060 1,768 1,588 1,449 1,816
58 2,540 2,168 1,849 1,672 1,508 1,902
59 2,570 2,217 1,899 1,731 1,540 1,945
60 2,589 2,235 1,925 1,755 1,612 1,975
61 2,618 2,257 1,966 1,756 1,612 1,989
62 2,664 2,322 1,985 1,805 1,691 2,036
63 2,643 2,282 1,984 1,822 1,691 2,024
64 2,786 2,396 2,103 1,935 1,799 2,136
65 3,569 3,087 2,793 2,615 2,434 2,826
66 3,262 2,800 2,525 2,322 2,172 2,541
67 3,369 3,009 2,664 2,510 2,370 2,712
68 3,431 3,065 2,784 2,684 2,537 2,844
69 3,592 3,338 3,010 2,858 2,788 3,068
70 3,579 3,285 3,032 2,900 2,739 3,065
71 3,566 3,235 2,921 2,747 2,592 2,962
72 3,774 3,418 3,154 2,934 2,785 3,161
73 3,870 3,556 3,261 3,143 2,997 3,320
74 4,047 3,704 3,385 3,272 3,146 3,464
75 4,394 4,021 3,714 3,526 3,419 3,763
76 4,478 4,151 3,846 3,694 3,516 3,888
77 4,731 4,328 4,068 3,889 3,734 4,098
78 4,638 4,333 4,049 3,915 3,758 4,094
79 4,708 4,383 4,157 4,017 3,913 4,195

Health care costs in the English NHS 19
Age Overall
Q1 (most deprived) Q2 Q3 Q4 Q5 (least deprived) Overall
80 4,709 4,482 4,206 4,132 3,966 4,263
81 4,921 4,654 4,342 4,230 4,121 4,413
82 5,015 4,676 4,509 4,428 4,346 4,563
83 5,051 4,929 4,723 4,564 4,468 4,718
84 5,025 4,844 4,704 4,678 4,511 4,732
85+ 5,473 5,291 5,108 5,046 4,981 5,156