health care costs and spending in delawaredhss.delaware.gov/dhcc/files/costswalker.pdf · health...
TRANSCRIPT

HEALTH CARE COSTS AND SPENDING IN DELAWARE
A Review of the Evidence and Proposed Approach to Payment Reform
June 2017
DHSS Secretary Dr. Kara Odom Walker, Health Care Commission, 06/01/17 Subject to change
• The Impact of Rising Health Care Costs in Delaware
• Where Health Care Dollars Go
• Drivers of Spending Growth
• Variations in Spending
• Proposed Solution
• Next Step
OVERVIEW
Health Care Commission 06/01/17Subject to change

Background on Health Care Spending in Delaware
• Health care spending per capita in Delaware is higher than the national average. Historically, health care spending has outpaced inflation and the state’s economic growth. Health care costs consume 25% (or approximately 1 billion in FY 2017) of Delaware’s budget. Medicaid cost per capita and the growth in per capita spending have been above the national average. These challenges are not unique to Delaware – affordability is of equal concern to private employer sponsors of Commercial health insurance, as well as some consumer segments who have seen increases in deductibles, copays, and coinsurance.
• Delaware’s demographics and the percentage of our citizens with chronic conditions are key drivers of both spending and poor health outcomes. Delaware’s population is older and is aging faster than the national average – we will be the tenth oldest state by 2025. We are also sicker than the average state, with higher rates of chronic disease, in part driven by social determinants including poverty, food scarcity, and violence. In the most recent publication of America’s Health Rankings, Delaware ranked 31st, exceeding the national average in cancer deaths per capita, cardiovascular deaths per capita, diabetes per capita, infant mortality, and premature death.
• The hospital landscape is more concentrated in Delaware than in most other markets, with just six acute care hospital systems across the state, with most populations relying on a single hospital for their care. Our hospital systems vary widely in both scale as well as operational efficiency. Primary care and some other physician specialties remain fairly fragmented. Other physician specialties are concentrated. Behavioral health care is in short supply in some parts of the state.
• Increased demand for health care, as well as inefficiencies in the supply of health care, in combination lead to 25% greater historical spend per capita than the U.S. as a whole, which itself has among the highest cost health care systems in the world. While we spend more on care, our investments have not led to better health or outcomes for Delawareans. We spend more than average, not to get better access or higher quality care, but simply to address the challenges of an older and sicker population.
Health Care Commission 06/01/17Subject to change
THE IMPACT OF RISING HEALTH CARE COSTS IN DELAWARE
WHERE HEALTH CAREDOLLARS GO
DRIVERS OFSPENDING GROWTH
GLOBAL HEALTHCARE BENCHMARK
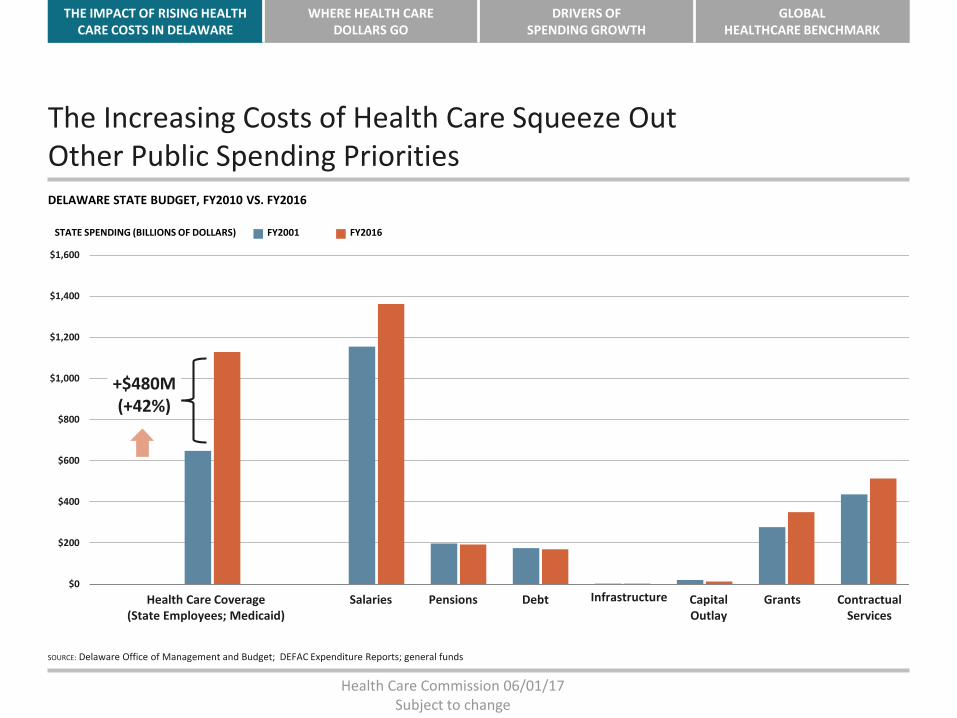
The Increasing Costs of Health Care Squeeze Out Other Public Spending PrioritiesDELAWARE STATE BUDGET, FY2010 VS. FY2016
SOURCE: Delaware Office of Management and Budget; DEFAC Expenditure Reports; general funds
$0
$200
$400
$600
$800
$1,000
$1,200
$1,400
$1,600
STATE SPENDING (BILLIONS OF DOLLARS) FY2016FY2001
+$480M(+42%)
Health Care Coverage(State Employees; Medicaid)
Salaries Pensions Debt Infrastructure Capital Outlay
Grants Contractual Services
Health Care Commission 06/01/17Subject to change

THE IMPACT OF RISING HEALTH CARE COSTS IN MASSACHUSETTS
WHERE HEALTH CAREDOLLARS GO
DRIVERS OFSPENDING GROWTH
GLOBAL HEALTHCARE BENCHMARK
Per Capita Costs in Delaware $8,480 per person
Wall Street Journal: https://www.wsj.com/news/interactive/IVCostsprintHealth Care Commission 06/01/17
Subject to change

THE IMPACT OF RISING HEALTH CARE COSTS IN DELAWARE
WHERE HEALTH CAREDOLLARS GO
DRIVERS OFSPENDING GROWTH
GLOBAL HEALTHCARE BENCHMARK
Delaware Spends More on Health Care than Most Other StatesPER CAPITA PERSONAL HEALTHCARE EXPENDITURES, 2009
NOTE: District of Columbia is not included.SOURCE: Centers for Medicare & Medicaid Services, Health Expenditures by State of Residence, CMS, 2011.
$0
$1,000
$2,000
$3,000
$4,000
$5,000
$6,000
$7,000
$8,000
$9,000
$10,000
UT AZ GA ID NV TX CO AR CA AL VA SC TN NC OK MS OR KY MI MT NM IN IL KS WA LA HI IA MO WY NE SD OH FL WI MNMD NJ VT WV PA ND NH RI NY DE ME CT AK MA
State
NATIONAL AVERAGE
Health Care Commission 06/01/17Subject to change
THE IMPACT OF RISING HEALTH CARE COSTS IN DELAWARE
WHERE HEALTH CAREDOLLARS GO
DRIVERS OFSPENDING GROWTH
GLOBAL HEALTHCARE BENCHMARK
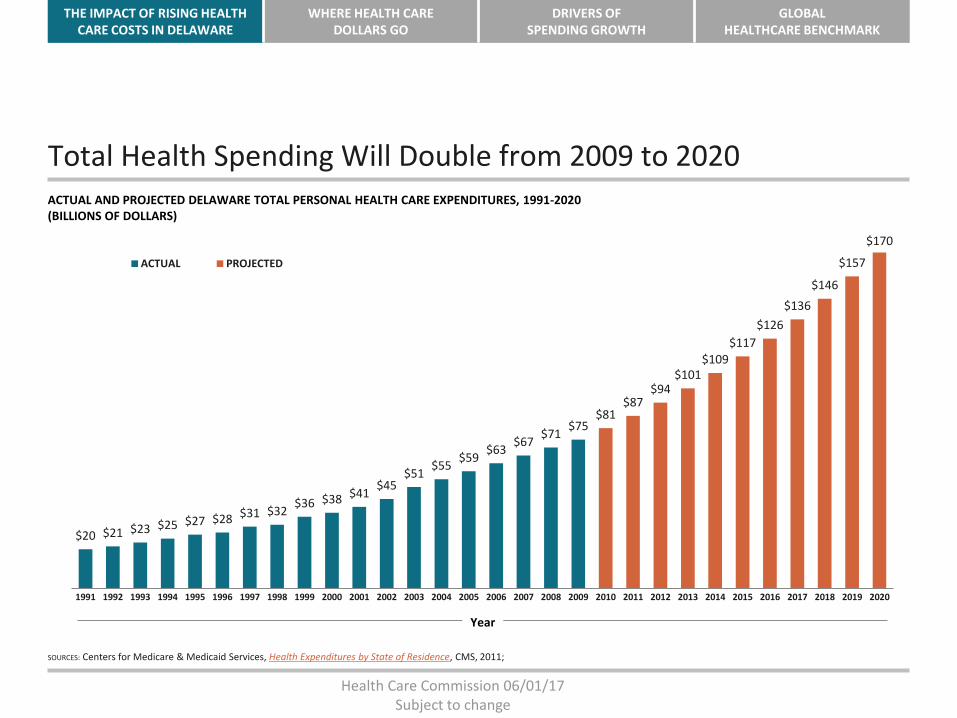
Total Health Spending Will Double from 2009 to 2020ACTUAL AND PROJECTED DELAWARE TOTAL PERSONAL HEALTH CARE EXPENDITURES, 1991-2020(BILLIONS OF DOLLARS)
SOURCES: Centers for Medicare & Medicaid Services, Health Expenditures by State of Residence, CMS, 2011;
$20 $21 $23 $25 $27 $28 $31 $32$36 $38 $41
$45$51
$55$59
$63$67
$71$75
$81$87
$94$101
$109$117
$126
$136
$146
$157
$170
1991 1992 1993 1994 1995 1996 1997 1998 1999 2000 2001 2002 2003 2004 2005 2006 2007 2008 2009 2010 2011 2012 2013 2014 2015 2016 2017 2018 2019 2020
ACTUAL PROJECTED
Year
Health Care Commission 06/01/17Subject to change

THE IMPACT OF RISING HEALTH CARE COSTS IN DELAWARE
WHERE HEALTH CAREDOLLARS GO
DRIVERS OFSPENDING GROWTH
GLOBAL HEALTHCARE BENCHMARK
Medicare and Medicaid Account for Nearly 40% of Delaware’s Health Spending
SOURCE: Centers for Medicare & Medicaid Services, Health Expenditures by State of Residence, CMS, 2011.
18%
19%63%
Private/Other$4,879
TOTAL PERSONAL HEALTH EXPENDITURES BY PAYER IN DELAWARE, 2009(MILLIONS OF DOLLARS)
Medicare$1,512
Medicaid$1,106
Health Care Commission 06/01/17Subject to change

THE IMPACT OF RISING HEALTH CARE COSTS IN DELAWARE
WHERE HEALTH CAREDOLLARS GO
DRIVERS OFSPENDING GROWTH
GLOBAL HEALTHCARE BENCHMARK
All Payers in Delaware Have Experienced Significant Spending Growth
SOURCE: Centers for Medicare & Medicaid Services, Health Expenditures by State of Residence, CMS, 2011.
TOTAL PERSONAL HEALTH EXPENDITURES BY PAYER IN DELAWARE, 1991-2009(MILLIONS OF DOLLARS)
These numbers reflect total increases in spending, resulting from both increasing enrollment, especially in Medicaid, and higher per capita spending.
$0
$1,000
$2,000
$3,000
$4,000
$5,000
$6,000
1991 1992 1993 1994 1995 1996 1997 1998 1999 2000 2001 2002 2003 2004 2005 2006 2007 2008 2009
PRIVATE/OTHER MEDICARE MEDICAID
Year
Health Care Commission 06/01/17Subject to change

THE IMPACT OF RISING HEALTH CARE COSTS IN DELAWARE
WHERE HEALTH CAREDOLLARS GO
DRIVERS OFSPENDING GROWTH
GLOBAL HEALTHCARE BENCHMARK
Total Growth Rates by Payer Have Been SimilarSince 1991
SOURCE: Centers for Medicare & Medicaid Services, Health Expenditures by State of Residence, CMS, 2011.
Though private spending accounts for the majority of health care costs in Delaware, all types of payers had similar growth rates from 1991 to 2009:
Private/Other average annual growth rate, 1991-2009: 7.7%
Medicare average annual growth rate, 1991-2009: 8.5%
Medicaid average annual growth rate, 1991-2009: 10.0%
Year
Health Care Commission 06/01/17Subject to change

THE IMPACT OF RISING HEALTH CARE COSTS IN DELAWARE
WHERE HEALTH CAREDOLLARS GO
DRIVERS OFSPENDING GROWTH
GLOBAL HEALTHCARE BENCHMARK
ACA Health Reform Did Not Escalate the Trend in Health Care Cost Growth
NOTE: Data for 2007 is inferred from the average of 2006 and 2008, as data for this year is unavailable.SOURCE: Agency for Healthcare Research and Quality, Medical Expenditure Panel Survey — Insurance Component.
FAMILY HEALTH INSURANCE PREMIUMS DELAWARE AND THE U.S., 2000-2010 Delaware health insurance premiums have long been higher than the national average. Private premiums have actually grown more slowly than the national average.
With wages stagnant, health care costs consume more of workers’ budgets
$7,713
$6,772
$8,369
$7,509
$10,589
$8,469
$12,601
$9,249
$13,386
$10,006
$14,671
$10,728
$16,015
$11,381
$15,599
$11,840
$16,102
$12,298
$17,914
$13,027
$18,920
$13,871
Delaware U.S.
DE Average AnnualGrowth Rate,
2000-2006: 13.2%U.S. Average Annual
Growth Rate, 2000-2006: 9.1%
DE Average AnnualGrowth Rate,
2007-2010: 4.4%
U.S. Average AnnualGrowth Rate,
2007-2010: 5.1%
2000 2002 2004 2006 2008 20102001 2003 2005 2007 2009 2000 2002 2004 2006 2008 20102001 2003 2005 2007 2009
Health Care Commission 06/01/17Subject to change

THE IMPACT OF RISING HEALTH CARE COSTS IN DELAWARE
WHERE HEALTH CAREDOLLARS GO
DRIVERS OFSPENDING GROWTH
GLOBAL HEALTHCARE BENCHMARK
WHERE THE HEALTH CARE DOLLARS GO — SPENDING
AND COST GROWTH BY TYPES OF HEALTH CARE SERVICES
Health Care Commission 06/01/17Subject to change

THE IMPACT OF RISING HEALTH CARE COSTS IN DELAWARE
WHERE HEALTH CAREDOLLARS GO
DRIVERS OFSPENDING GROWTH
GLOBAL HEALTHCARE BENCHMARK
The Distribution of Total Spending by Type of Service Is Similar for Delaware and the U.S. as a Whole
SOURCE: Centers for Medicare & Medicaid Services, Health Expenditures by State of Residence, CMS, 2011.
38%
22%
11%
20%
DELAWARE PER CAPITA SPENDING BY SERVICE, 2009
Hospital Care Physician andClinical Services
Drugs andOther Medical Nondurables
Nursing Home,Home Health, and Other Personal Care
Dental and OtherProfessional Services
Medical Durables
8%
1%
36%
24%
14%
16%
UNITED STATES PER CAPITA SPENDING BY SERVICE, 2009
8%
2%
Health Care Commission 06/01/17Subject to change

THE IMPACT OF RISING HEALTH CARE COSTS IN DELAWARE
WHERE HEALTH CAREDOLLARS GO
DRIVERS OFSPENDING GROWTH
GLOBAL HEALTHCARE BENCHMARK
Per Person Spending in Delaware Is Higher than the National Average in Every Category of ServiceUNITED STATES AND DELAWARE PER CAPITA SPENDING BY SERVICE, 2009
SOURCE: Centers for Medicare & Medicaid Services, Health Expenditures by State of Residence, CMS, 2011.
$2,475
$1,650
$956$1,069
$551
$114
$3,109
$2,078
$1,219$1,337
$672
$166
UNITED STATES DELAWARE
Hospital Care Physician andClinical Services
Drugs andOther Medical Nondurables
Nursing Home,Home Health, and
Other Personal Care
Dental and OtherProfessional
Services
Medical Durables
Health Care Commission 06/01/17Subject to change

THE IMPACT OF RISING HEALTH CARE COSTS IN DELAWARE
WHERE HEALTH CAREDOLLARS GO
DRIVERS OFSPENDING GROWTH
GLOBAL HEALTHCARE BENCHMARK
Spending on Hospitals and Nursing Homes Makes Up the Majority of the Difference Between Delaware and the U.S.
SOURCE: Centers for Medicare & Medicaid Services, Health Expenditures by State of Residence, CMS, 2011.
41.8%
17.4%
3.1%
31.3%
Hospital Care
Physician andClinical Services
Drugsand Other Medical
Nondurables
Nursing Home,Home Health,
and Other Personal Care
Dental and OtherProfessional
Services
Medical Durables
6.2%
0.2%
CONTRIBUTION TO DIFFERENCE IN DE AND U.S. SPENDING BY SERVICE, 2009
Health Care Commission 06/01/17Subject to change
THE IMPACT OF RISING HEALTH CARE COSTS IN DELAWARE
WHERE HEALTH CAREDOLLARS GO
DRIVERS OFSPENDING GROWTH
GLOBAL HEALTHCARE BENCHMARK
DRIVERS OF COST GROWTH IN DELAWARE
Health Care Commission 06/01/17Subject to change

THE IMPACT OF RISING HEALTH CARE COSTS IN DELAWARE
WHERE HEALTH CAREDOLLARS GO
DRIVERS OFSPENDING GROWTH
GLOBAL HEALTHCARE BENCHMARK
UTILIZATION: Delaware Residents Use the Emergency Room Slightly More than U.S. Residents Overall
SOURCES: Kaiser State Health Facts, with data from the American Hospital Association Annual Survey and U.S. Census.
491
440
Delaware U.S.
HOSPITAL EMERGENCY ROOM VISITS PER CAPITA IN DELAWARE AND IN THE U.S. OVERALL, 2009(ADMISSIONS PER 1,000 RESIDENTS)
DIFFERENCE:
11%
Health Care Commission 06/01/17Subject to change

THE IMPACT OF RISING HEALTH CARE COSTS IN DELAWARE
WHERE HEALTH CAREDOLLARS GO
DRIVERS OFSPENDING GROWTH
GLOBAL HEALTHCARE BENCHMARK
UTILIZATION: Adjusting for Age, Sex, and Race, Medicare Beneficiaries in the Last Two Years of Life Are Slightly Above Average for Use of Inpatient Hospital CareHOSPITAL CARE INDEX FOR BENEFICIARIES IN THE LAST TWO YEARS OF LIFE, BY STATE, 2003-2007
NOTE: The Hospital Care Intensity Index is computed by comparing each hospital’s utilization rate, which is based on the number of days patients spend in the hospital and the number of times they visit a physician, with the national average and adjusting for age, sex, race, and severity of illness.SOURCE: Dartmouth Atlas of Health Care.
0.0
0.2
0.4
0.6
0.8
1.0
1.2
1.4
1.6
1.8
UT ID OR WA VT WY MT ND NM AK ME MN CO WI IA NH SD NE IN NC KS AZ GA OK VA MO OH RI CT AL AR SC MA KY MI TN WVMD MS TX HI IL PA CA DE LA FL NV DC NY NJ
State
National Average
Health Care Commission 06/01/17Subject to change

THE IMPACT OF RISING HEALTH CARE COSTS IN MASSACHUSETTS
WHERE HEALTH CAREDOLLARS GO
DRIVERS OFSPENDING GROWTH
GLOBAL HEALTHCARE BENCHMARK
PROVIDER AND SERVICE MIX: Delaware is above average for all States in Total Physicians and Specialists Per CapitaSPECIALISTS AS A SHARE OF ALL PHYSICIANS BY STATE, 2006(PHYSICIANS PER 100,000)
0
50
100
150
200
250
300
NV
MS
AR TX KS
OK
UT
AL
ND
NE
AZ
SD IA ID LA KY
TN IN GA
MO FL NC SC OH CA
WV
MI
NM US
VA
MN PA
WI IL
MT
OR
CO
WY
WA
NH DE RI
HI
NJ
ME
CT
NY
AK
VT
MD
MA
SPECIALISTS NON-SPECIALISTS
State
Delaware has more
physicians per capita, and
also more specialists per
capita, than many other
states. Research finds
that regions with more
total physicians tend to
spend more on health
care than other regions,
and that states with a
higher proportion of
specialists also tend to
spend more on health
care.
NOTE: Physician counts are estimated from rates and population and are not exact. DC is excluded.SOURCES: Physicians per capita data from Dartmouth Atlas. Evidence for relationship between more physicians and higher spending from Fisher, E.S., et. al., “The Implications of Regional Variations in Medicare Spending. Part 1: The Content, Quality, and Accessibility of Care,” Annals of Internal Medicine, Feb. 18, 2003.
Health Care Commission 06/01/17Subject to change

THE IMPACT OF RISING HEALTH CARE COSTS IN MASSACHUSETTS
WHERE HEALTH CAREDOLLARS GO
DRIVERS OFSPENDING GROWTH
GLOBAL HEALTHCARE BENCHMARK
Moving forward with global health care benchmark
Health Care Commission 06/01/17Subject to change

THE IMPACT OF RISING HEALTH CARE COSTS IN MASSACHUSETTS
WHERE HEALTH CAREDOLLARS GO
DRIVERS OFSPENDING GROWTH
GLOBAL HEALTHCARE BENCHMARK
Funding base
State Medicaid funding ($788M)7
State funding for State employees ($762M)8
Total State health care spending ($8B)
8
8
80
39
38
400
23
23
240
1% 3% 5%
Savings from percent cost reduction$M
1 Health and Human Services accounted for 28.6% of expenditures in FY2015 (DE Expenditure Review Committee report); 2 Budget presentation FY 20173 MACPAC; 4 FY2013 (MACPAC); 5 2000-2011 for full benefit enrollees only (KFF)6 ASPE reports monthly funding amount, which are annualized using a factor of 11.33 average member months (2015 MLR Report)7 2015 (MACPAC); Medicaid spend breakdown by eligibility category in FY2011 is as follows: 14% aged, 32% individuals with disabilities, 35% adult, and 20% children (KFF)8 Estimated for FY2017 by multiplying average PEPY by # of enrolled employees (FY17 Q1 Quarterly Financial Report)9 Growth trend for individuals with disabilities is below national average
▪ Health care costs consume ~25%1 of DE’s state budget, with significant current year deficit
▪ Total Delaware Medicaid spending was ~$2.0B in Fiscal Year 2015, with ~$1.2B coming from federal government3
▪ DE’s average Medicaid Per Member Per Year (PMPYs) and growth trends are above the national average for most eligibility categories7,9
▪ DE State health purchasing currently accounts for nearly twice as many lives as many other states
▪ DE’s individual marketplace received ~$90M in federal support (subsidies and cost sharing reductions
Current situation Sensitivity table of potential cost savings
Health Care Commission 06/01/17Subject to change

THE IMPACT OF RISING HEALTH CARE COSTS IN DELAWARE
WHERE HEALTH CAREDOLLARS GO
DRIVERS OFSPENDING GROWTH
GLOBAL HEALTHCARE BENCHMARK
Total Health Spending Will Double from 2009 to 2020
ACTUAL AND PROJECTED DELAWARE TOTAL PERSONAL HEALTH CARE EXPENDITURES, 1991-2020(BILLIONS OF DOLLARS)
SOURCES: Centers for Medicare & Medicaid Services, Health Expenditures by State of Residence, CMS, 2011;
$25 $27 $28 $31 $32$36 $38 $41
$45$51
$55$59
$63$67
$71$75
$81$87
$94$101
$109$117
$126
$136
$146
$157
$170
1994 1995 1996 1997 1998 1999 2000 2001 2002 2003 2004 2005 2006 2007 2008 2009 2010 2011 2012 2013 2014 2015 2016 2017 2018 2019 2020
ACTUAL
PROJECTED
2%
3%
5%
5%
3%
2%
Growth target
Year
Health Care Commission 06/01/17Subject to change

THE IMPACT OF RISING HEALTH CARE COSTS IN MASSACHUSETTS
WHERE HEALTH CAREDOLLARS GO
DRIVERS OFSPENDING GROWTH
GLOBAL HEALTHCARE BENCHMARK
Considerations for level of impact across models
Total costof care
Bundled payments
Special needs
Potential impactin success case
Factors affecting level of impact
▪ 50-150 basis points of trend mitigation
▪ Level of provider commitment (e.g., level of upside and/or risk)
▪ Execution effectiveness▪ Pricing
▪ 200-400 basis points of trend mitigation for included spend
▪ Degree of provider competition▪ Execution effectiveness▪ Pricing
▪ 0-200 basis points of trend mitigation
▪ Mix of institutional care vs. home and community-based care
▪ Execution effectiveness▪ Pricing
Percent of health-care spending
▪ 60-70% of Medicaid*▪ 90-100% of Medicare
and Commercial
▪ 20-40% of spendin top 10-30 episodes of care
▪ 30-40% of Medicaid*
*Assumes that supportive care is excluded from Total Cost of Care model in initial years, and addressed through complementary model for special needs populations
Health Care Commission 06/01/17Subject to change

THE IMPACT OF RISING HEALTH CARE COSTS IN MASSACHUSETTS
WHERE HEALTH CAREDOLLARS GO
DRIVERS OFSPENDING GROWTH
GLOBAL HEALTHCARE BENCHMARK
Examples of Payment Reform Models
Description Examples
Accountability for the quality and cost of an episode of care for either a chronic condition, an acute exacerbation, or an acute procedure
Bundled payments
▪ Arkansas▪ Ohio▪ Tennessee▪ BPCI▪ CJR
Accountability for the quality and total cost of care for a broad population of patients
Total costof care
▪ Massachusetts▪ New York▪ Vermont▪ Medicare Shared Savings▪ NextGen Medicare ACO
Accountability for the quality and cost of supportive services for populations with severe mental illness, intellectual, developmental, or physical disabilities
▪ Iowa▪ Massachusetts▪ Missouri▪ Tennessee
Special needs models
Health Care Commission 06/01/17Subject to change

THE IMPACT OF RISING HEALTH CARE COSTS IN MASSACHUSETTS
WHERE HEALTH CAREDOLLARS GO
DRIVERS OFSPENDING GROWTH
GLOBAL HEALTHCARE BENCHMARK
Delaware’s Progress on Voluntary Adoption of Value Based Payment Reform
After receiving federal grant monies through the Centers for Medicare and Medicaid’s State Innovation Model (SIM) project, Delaware has made a significant investment in transitioning to value-based payment models. Value based payment models enable collaboration between providers and health systems in addition to allowing a greater focus on keeping people healthy through improving primary care. This is vastly different than the traditional Fee for Service model that aligns payment for services with volume, regardless of patient outcomes and whether the overall population of the state is getting healthier.
The State has supported these changes from a policy perspective by setting the expectation for Medicaid Managed Care Organizations (MCOs) and State Employee/Retiree Third-party administrators to offer and promote the adoption of value-based models.
Currently, nearly 40% of primary care practices have participated in primary care practice transformation funded by the federal grant. Delaware recently became the first state in the country to achieve universal participation of our adult acute care hospitals in the Medicare Shared Savings Program. Some of these hospital systems as well as other physicians-led Accountable Care Organizations have recently begun to expand their participation into the Commercial segment as well. Overall, 30% of Delawareans are attributed to providers participating in value-based payment models.
Despite this progress, many primary care providers in smaller practices have not yet chosen to participate in value-based models, and even for larger health systems the change to value based payments can be expensive requiring retraining of providers, paying for services not reimbursed under the Fee for Service model, and making investments in health IT or other infrastructure to support value. In Delaware we may already be seeing the limitations of a purely voluntary adoption model for payment reform.
Health Care Commission 06/01/17Subject to change

THE IMPACT OF RISING HEALTH CARE COSTS IN MASSACHUSETTS
WHERE HEALTH CAREDOLLARS GO
DRIVERS OFSPENDING GROWTH
GLOBAL HEALTHCARE BENCHMARK
Case study: Massachusetts payment reform (1/2)Massachusetts is restructuring its MassHealth (Medicaid) program through an 1115 waiver to support health care delivery system reforms enabled by significant federal investment
Risk model
▪ New delivery system reform features three risk models:– Model A: integrated MCO-ACO model with full insurance risk responsibility– Model B: direct State-ACO contracting model with two-sided risk sharing– Model C: MCO-ACO contracting model with two-sided risk sharing
▪ MassHealth existing 1115 waiver renewal used as an opportunity for payment reform▪ Relies heavily upon MCOs in the State to create and administer ACO models▪ State offers $1.8B in DSRIP funding for participating ACOs to invest in infrastructure, care
coordination, and BH/LTSS partnerships
Stakeholder participation
Regulatory & contractual authorities
Payers
Providers
▪ New MCO contracts (expected 2017) will require Medicaid MCOs (6 in MA) to participate in and support one or more of the three ACO models
▪ ACOs may voluntarily participate, with Delivery System Reform Incentive Program (DSRIP) funding made available only to participating providers
Patients ▪ Patients are attributed by the MCOs to participating ACOs through the patients’ selected primary care physician
Health Care Commission 06/01/17Subject to change

THE IMPACT OF RISING HEALTH CARE COSTS IN MASSACHUSETTS
WHERE HEALTH CAREDOLLARS GO
DRIVERS OFSPENDING GROWTH
GLOBAL HEALTHCARE BENCHMARK
Case study: Massachusetts payment reform (2/2)
MassHealth (Medicaid)
Model A
Integrated ACO/MCO
model
Provider
Model B
Direct to ACO model
Provider
MCO Options
Model C
ACO
Model C
ACO
Provider Provider
Model A: Integrated ACO/MCO▪ Fully integrated: an ACO
joins with an MCO to provide full range of services
▪ Risk-adjusted, prospective capitation rate
▪ ACO/MCO entity takes on full insurance risk
Model B: Direct to ACO
▪ ACO provider contracts directly with MassHealth
▪ Based on MassHealth network▪ ACO may have provider
partnerships for referrals and care coordination
▪ Advanced model with two-sided performance (not insurance) risk
Model C: MCO-Administered model
▪ ACOs contract and work with MCOs▪ MCOs play larger role to support
population health management▪ Various levels of risk; all include
two-sided performance (not insurance) risk
Health Care Commission 06/01/17Subject to change

THE IMPACT OF RISING HEALTH CARE COSTS IN MASSACHUSETTS
WHERE HEALTH CAREDOLLARS GO
DRIVERS OFSPENDING GROWTH
GLOBAL HEALTHCARE BENCHMARK
AFFORDABILITY AND QUALITY TARGETAn on-ramp to improved patient-centered care, quality and cost
Paym
ent
refo
rm
Delivery Reform
Volume driven Integrated services
Valu
eFee fo
r service
All payer claims data
Quality
Integration
Affordability
Key MeasuresAccountable Care Organizations
B
C
A
D
Traditional care
Health homes
Health Care Commission 06/01/17Subject to change

THE IMPACT OF RISING HEALTH CARE COSTS IN MASSACHUSETTS
WHERE HEALTH CAREDOLLARS GO
DRIVERS OFSPENDING GROWTH
GLOBAL HEALTHCARE BENCHMARK
Value based
payments
Bundled payments
Episodic payments
Managed Care Per Member
Per Month
(PMPM)
All-inclusive
population-based
payments
Accountable Care
Organizations
Patient Centered Medical Homes
Managed Care
organizations
Integrated Delivery Reform
Global Health Care Benchmark
Based on affordability,
quality and total cost of health
care
Payment Reform
Health Care Commission 06/01/17Subject to change

THE IMPACT OF RISING HEALTH CARE COSTS IN MASSACHUSETTS
WHERE HEALTH CAREDOLLARS GO
DRIVERS OFSPENDING GROWTH
GLOBAL HEALTHCARE BENCHMARK
Move toward global health care benchmark
Set to state revenue growth
Staged targets with year 0-3 phases
Give providers flexibility for alternative payment strategies through global budgets, bundled payments, special populations needs, unplanned care
Establish authority and regulation
Create monitoring and structure
Tie to price transparency and quality
Recalibrate state-based purchasing authority
Adjust state approach to include:
State Employee Benefits
Medicaid
Exchange/Marketplace
Correctional medicine
Bring along commercial segments
Stages to Reduce Health Care Costs in DelawareProposed approach
Health Care Commission 06/01/17Subject to change

THE IMPACT OF RISING HEALTH CARE COSTS IN MASSACHUSETTS
WHERE HEALTH CAREDOLLARS GO
DRIVERS OFSPENDING GROWTH
GLOBAL HEALTHCARE BENCHMARK
Payment Strategies
• Cost growth goal
• Implement bundled payments for all payers and global budgets
• Finalize all-payer claims database and price transparency
• Consider reference pricing/cost monitoring
Access issues
• Expand community-based strategies
• Combat addiction to prescription drugs and heroin
• Expand telehealth up and down state
• Decreased unplanned care
Quality improvement
• Publish the common scorecard with cost and health outcomes
• Fully adopt value-based payment reform
• Integrated behavioral and primary care
• Improve long-term care
• Align the scope of practice needs with community needs (community health workers, nurse practitioners, behavioral health workers)
Moving toward innovative strategies
Health Care Commission 06/01/17Subject to change

THE IMPACT OF RISING HEALTH CARE COSTS IN MASSACHUSETTS
WHERE HEALTH CAREDOLLARS GO
DRIVERS OFSPENDING GROWTH
GLOBAL HEALTHCARE BENCHMARK
IMPLEMENTATION PLAN PHASED APPROACHED TO GLOBAL HEALTH CARE BENCHMARK
Y2DEMO TEST
YEAR
FOCUS ON PLANNING YEAR TO DETERMINE MODELS ACROSS
MEDICAID, STATE EMPLOYEES/RETIREES AND
FULLY INSURED
ESTABLISH THE AUTHORITY AND PERFORMANCE MANAGEMENT
APPROACH
Y1PLANNING
YEAR
ESTABLISH LEGISLATION FOR GLOBAL HEALTH CARE
BENCHMARK
Y3IMPLEMENTATION
All ASPECTS OF THE IMPLEMENTATION ARE IN
EFFECT
Health Care Commission 06/01/17Subject to change

THE IMPACT OF RISING HEALTH CARE COSTS IN MASSACHUSETTS
WHERE HEALTH CAREDOLLARS GO
DRIVERS OFSPENDING GROWTH
GLOBAL HEALTHCARE BENCHMARK
Next steps
Work with stakeholders on initial legislation
Establish phases and infrastructure to move the conversation from what to how
Use state authority to revise 1115 and 1332 waivers (Medicaid and Exchange/Marketplace, respectively)
Health Care Commission 06/01/17Subject to change