health benefits from regular exercise. decline in deaths
TRANSCRIPT

Health Benefits from Regular Exercise

DECLINE IN DEATHS

Harvard Alumni Study (1985)
Amount of physical activity
Mortality

Exercise and Chronic Diseases
Regular exercise reduces risk of or benefits:• atherosclerosis and coronary heart disease
TC, LDL-C, HDL-C, TG, heart strength
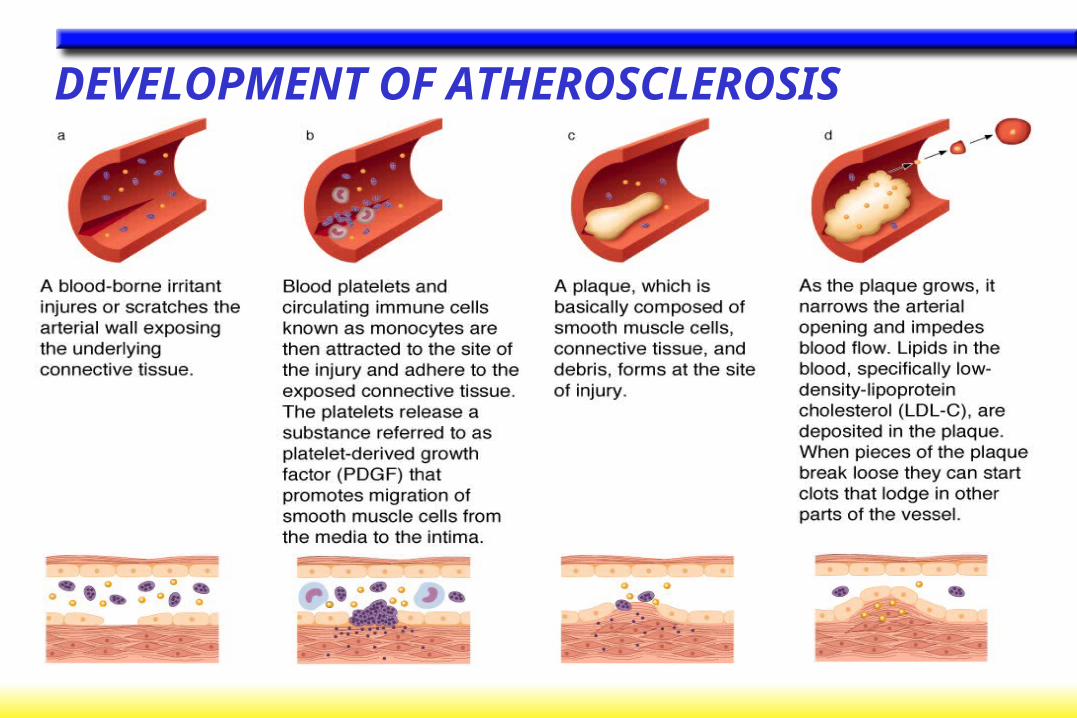
DEVELOPMENT OF ATHEROSCLEROSIS

The first step of atherosclerosis is
• Inflammation• Injury• Cancer• Diabetes• More cancer

ARTERY COMPARISONS

Coronary Artery Disease
• Atherosclerosis—progressive narrowing of arteries due to build up of plaque
• Coronary artery disease (CAD)—atherosclerosis in the coronary arteries
• Ischemia—deficiency in blood to heart caused by CAD
• Myocardial infarction—heart attack due to ischemia

AMERICANS AT INCREASED CAD RISK

Did You Know…?
Atherosclerosis begins in infancy and progresses at different rates, depending primarily on heredity and lifestyle choices such as smoking history, diet practices, physical activity, and stress.

Exercise and Chronic Diseases
Regular exercise reduces risk of or benefits:• atherosclerosis and coronary heart disease
TC, LDL-C, HDL-C, TG, heart strength
• hypertension BP

Hypertension
• chronically elevated blood pressure• causes the heart to work harder• places strain on arteries causing them to
become less elastic over time • affects ~25% of adult Americans
– half of these are unaware they have hypertension

Classification of Blood Pressure for Adults, Age 18 Years and Older
Normal < 130 < 85
High normal 130-139 85-89
Hypertension 140 90
Stage 1 (mild) 140-159 90-99
Stage 2 (moderate) 160-179 100-109
Stage 3 (severe) 180-209 110-119
Stage 4 (very severe) 210 120
Systolic DiastolicCategory (mmHg) (mmHg)

Exercise and Chronic Diseases
Regular exercise reduces risk of or benefits:• atherosclerosis and coronary heart disease
TC, LDL-C, HDL-C, TG, heart strength
• hypertension BP in hypertensive (but doesn’t normalize)
colon and breast cancer

Exercise and Chronic Diseases
Regular exercise reduces risk of or benefits:• atherosclerosis and coronary heart disease
TC, LDL-C, HDL-C, TG
• hypertension BP in hypertensive (but doesn’t normalize)
colon and breast cancer• diabetes mellitus
– exercise need for insulin

Exercise and Chronic Diseases
• obesity energy expenditure

Obesity and Overweight in the US
prevalence dramatically past 30 yprevalence in children markedly since
1980>33% of adult population is overweight average adult gains 1 lb/yr after age 25 yaverage adult loses 0.5 lb of muscle and
bone mass each year after age 25 y

Obesity Trends* Among U.S. AdultsBRFSS, 1985
(*BMI ≥30, or ~ 30 lbs overweight for 5’ 4” woman)
Source: Behavioral Risk Factor Surveillance System, CDC
No Data <10% 10%–14% 15%–19% 20%–24% ≥25%

Obesity Trends* Among U.S. AdultsBRFSS, 1986
(*BMI ≥30, or ~ 30 lbs overweight for 5’ 4” woman)
Source: Behavioral Risk Factor Surveillance System, CDC
No Data <10% 10%–14% 15%–19% 20%–24% ≥25%

Obesity Trends* Among U.S. AdultsBRFSS, 1987
(*BMI ≥30, or ~ 30 lbs overweight for 5’ 4” woman)
Source: Behavioral Risk Factor Surveillance System, CDC
No Data <10% 10%–14% 15%–19% 20%–24% ≥25%

Obesity Trends* Among U.S. AdultsBRFSS, 1988
(*BMI ≥30, or ~ 30 lbs overweight for 5’ 4” woman)
Source: Behavioral Risk Factor Surveillance System, CDC
No Data <10% 10%–14% 15%–19% 20%–24% ≥25%

Obesity Trends* Among U.S. AdultsBRFSS, 1989
(*BMI ≥30, or ~ 30 lbs overweight for 5’ 4” woman)
Source: Behavioral Risk Factor Surveillance System, CDC
No Data <10% 10%–14% 15%–19% 20%–24% ≥25%

Obesity Trends* Among U.S. AdultsBRFSS, 1990
(*BMI ≥30, or ~ 30 lbs overweight for 5’ 4” woman)
Source: Behavioral Risk Factor Surveillance System, CDC
No Data <10% 10%–14% 15%–19% 20%–24% ≥25%

Obesity Trends* Among U.S. AdultsBRFSS, 1991
(*BMI ≥30, or ~ 30 lbs overweight for 5’ 4” woman)
Source: Behavioral Risk Factor Surveillance System, CDC
No Data <10% 10%–14% 15%–19% 20%–24% ≥25%

Obesity Trends* Among U.S. AdultsBRFSS, 1992
(*BMI ≥30, or ~ 30 lbs overweight for 5’ 4” woman)
Source: Behavioral Risk Factor Surveillance System, CDC
No Data <10% 10%–14% 15%–19% 20%–24% ≥25%

Obesity Trends* Among U.S. AdultsBRFSS, 1993
(*BMI ≥30, or ~ 30 lbs overweight for 5’ 4” woman)
Source: Behavioral Risk Factor Surveillance System, CDC
No Data <10% 10%–14% 15%–19% 20%–24% ≥25%
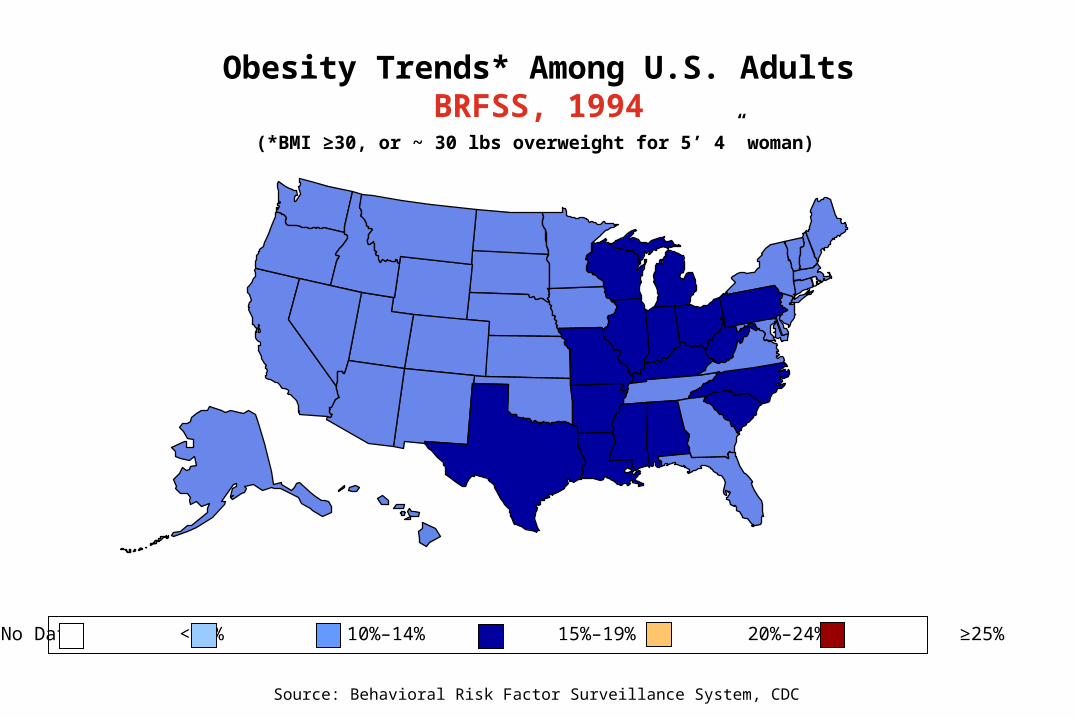
Obesity Trends* Among U.S. AdultsBRFSS, 1994
(*BMI ≥30, or ~ 30 lbs overweight for 5’ 4” woman)
Source: Behavioral Risk Factor Surveillance System, CDC
No Data <10% 10%–14% 15%–19% 20%–24% ≥25%

Obesity Trends* Among U.S. AdultsBRFSS, 1995
(*BMI ≥30, or ~ 30 lbs overweight for 5’ 4” woman)
Source: Behavioral Risk Factor Surveillance System, CDC
No Data <10% 10%–14% 15%–19% 20%–24% ≥25%

Obesity Trends* Among U.S. AdultsBRFSS, 1996
(*BMI ≥30, or ~ 30 lbs overweight for 5’ 4” woman)
Source: Behavioral Risk Factor Surveillance System, CDC
No Data <10% 10%–14% 15%–19% 20%–24% ≥25%

Obesity Trends* Among U.S. AdultsBRFSS, 1997
(*BMI ≥30, or ~ 30 lbs overweight for 5’ 4” woman)
Source: Behavioral Risk Factor Surveillance System, CDC
No Data <10% 10%–14% 15%–19% 20%–24% ≥25%
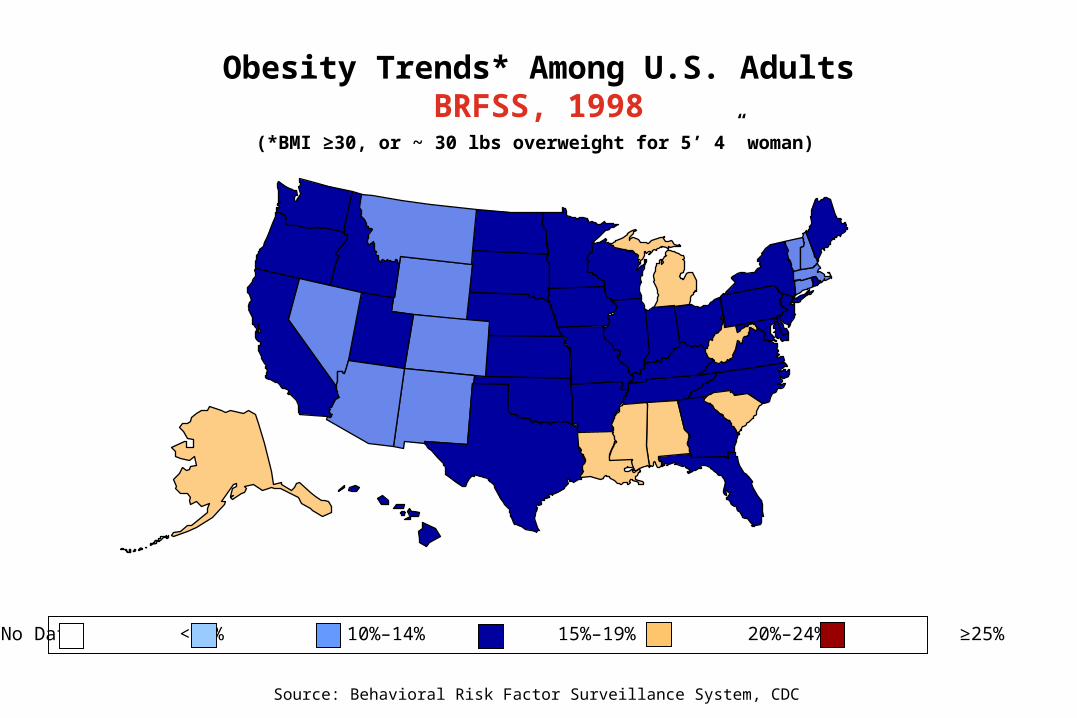
Obesity Trends* Among U.S. AdultsBRFSS, 1998
(*BMI ≥30, or ~ 30 lbs overweight for 5’ 4” woman)
Source: Behavioral Risk Factor Surveillance System, CDC
No Data <10% 10%–14% 15%–19% 20%–24% ≥25%

Obesity Trends* Among U.S. AdultsBRFSS, 1999
(*BMI ≥30, or ~ 30 lbs overweight for 5’ 4” woman)
Source: Behavioral Risk Factor Surveillance System, CDC
No Data <10% 10%–14% 15%–19% 20%–24% ≥25%

Obesity Trends* Among U.S. AdultsBRFSS, 2000
(*BMI ≥30, or ~ 30 lbs overweight for 5’ 4” woman)
Source: Behavioral Risk Factor Surveillance System, CDC
No Data <10% 10%–14% 15%–19% 20%–24% ≥25%

Obesity Trends* Among U.S. AdultsBRFSS, 2001
(*BMI ≥30, or ~ 30 lbs overweight for 5’ 4” woman)
Source: Behavioral Risk Factor Surveillance System, CDC
No Data <10% 10%–14% 15%–19% 20%–24% ≥25%
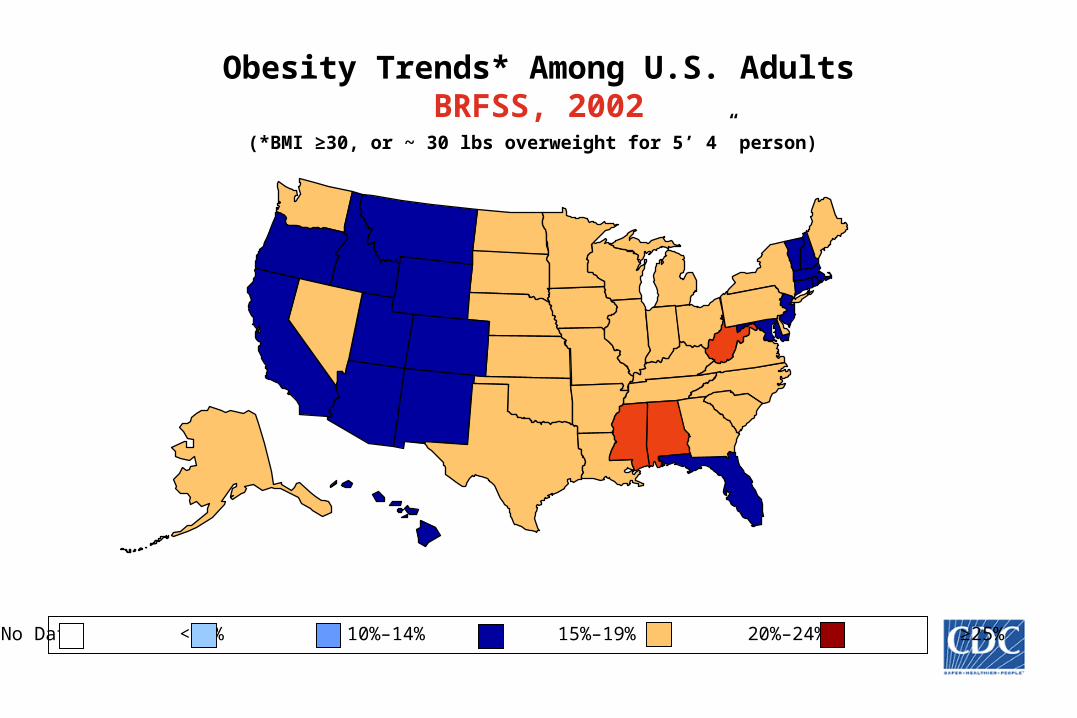
(*BMI ≥30, or ~ 30 lbs overweight for 5’ 4” person)
Obesity Trends* Among U.S. AdultsBRFSS, 2002
No Data <10% 10%–14% 15%–19% 20%–24% ≥25%

Obesity Trends* Among U.S. AdultsBRFSS, 2003
(*BMI ≥30, or ~ 30 lbs overweight for 5’ 4” person)
No Data <10% 10%–14% 15%–19% 20%–24% ≥25%

Obesity Trends* Among U.S. AdultsBRFSS, 2004
(*BMI ≥30, or ~ 30 lbs overweight for 5’ 4” person)
No Data <10% 10%–14% 15%–19% 20%–24% ≥25%

Obesity Trends* Among U.S. AdultsBRFSS, 2005
(*BMI ≥30, or ~ 30 lbs overweight for 5’ 4” person)
No Data <10% 10%–14% 15%–19% 20%–24% 25%–29% ≥30%

Prevalence of Overweight Among U.S. Children and Adolescents(Aged 2 –19 Years)
National Health and Nutrition Examination Surveys (NHANES)
1971-74 1976-80 1988-94 2003-04
20%
15%
10%
5%
0%
Non-Hispanic whitesNon-Hispanic blacksMexican Americans

Fat Distribution
Upper-body (android) obesity• Fat stored in upper body and abdominal area
(apple shaped) • Occurs more frequently in men• Carries greater risk for CAD, hypertension,
stroke, and diabetes
Lower-body (gynoid) obesity• Occurs more frequently in women• Fat stored in the lower body around the hips,
buttocks, and thighs (pear shaped)

BODY CHANGES, DIET, AND EXERCISE

Exercise and Chronic Diseases
• obesity energy expenditure
• low-back pain– a leading cause for missed work
• mental health mental well-being
• osteoporosis– weight-bearing exercise bone mineral
density

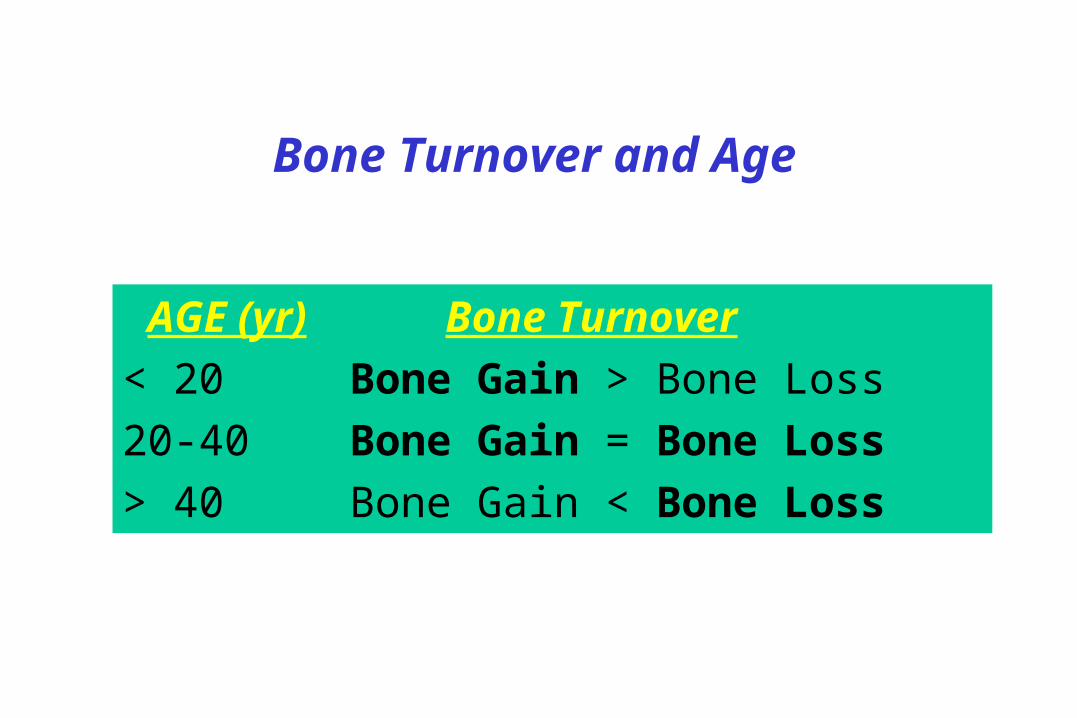
Bone Turnover and Age
AGE (yr) Bone Turnover< 20 Bone Gain > Bone Loss20-40 Bone Gain = Bone Loss> 40 Bone Gain < Bone Loss

Bone Mineral Density
osteoporosis

Mechanical loading on bone stimulates bone
absorption of Ca2+

Are you looking at a 65-year-old woman with osteoporosis?

Exercise Interventions in Pre-pubertal Children

Comparison of Impact Exercise vs. Weight Training on Changes in BMD of Postmenopausal Women
Kohrt et al., J Bone Miner Res 12:1253, 1997
• Ca2+ supplemented at 1500 mg/d
• 3 d/wk; 45 min sessions for 11 mo
• jogging / stair climbing vs. weight training

Summary
• Maintaining good bone health is a lifelong process
• Exercise (and proper nutrition) are vital in enhancing peak BMD in childhood and in maintaining or increasing BMD in adults

Exercise Prescription
Components of Fitness• cardiovascular• body composition• muscular strength and endurance• flexibility
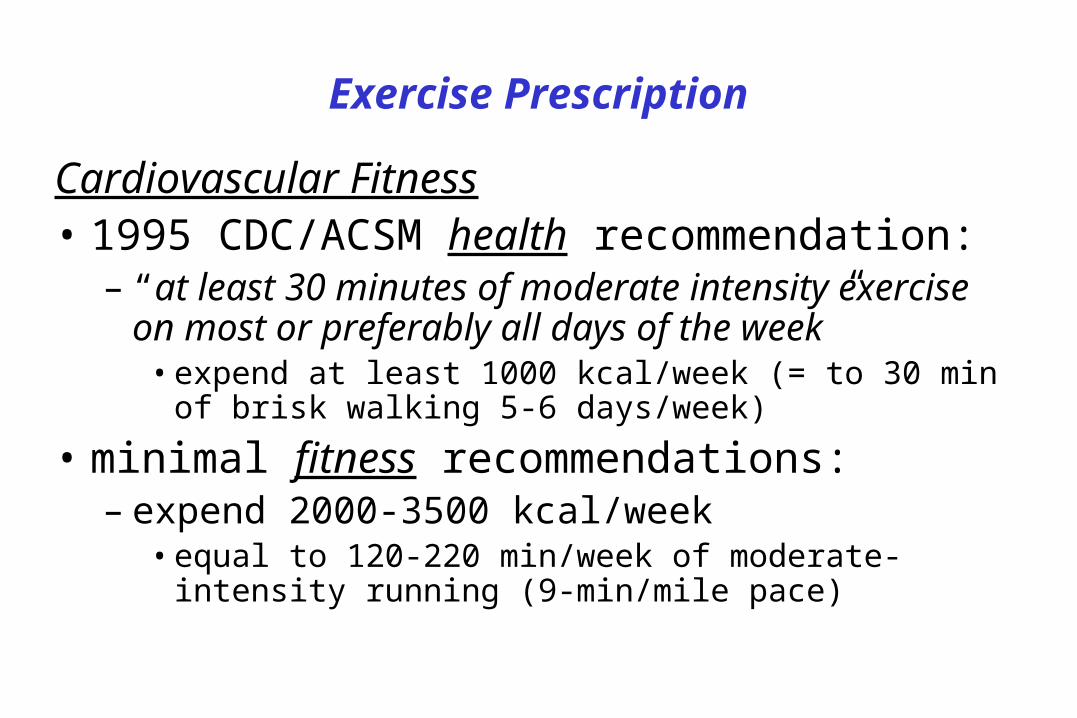
Exercise Prescription
Cardiovascular Fitness• 1995 CDC/ACSM health recommendation:
– “at least 30 minutes of moderate intensity exercise on most or preferably all days of the week”• expend at least 1000 kcal/week (= to 30 min of
brisk walking 5-6 days/week)
• minimal fitness recommendations:– expend 2000-3500 kcal/week
• equal to 120-220 min/week of moderate-intensity running (9-min/mile pace)
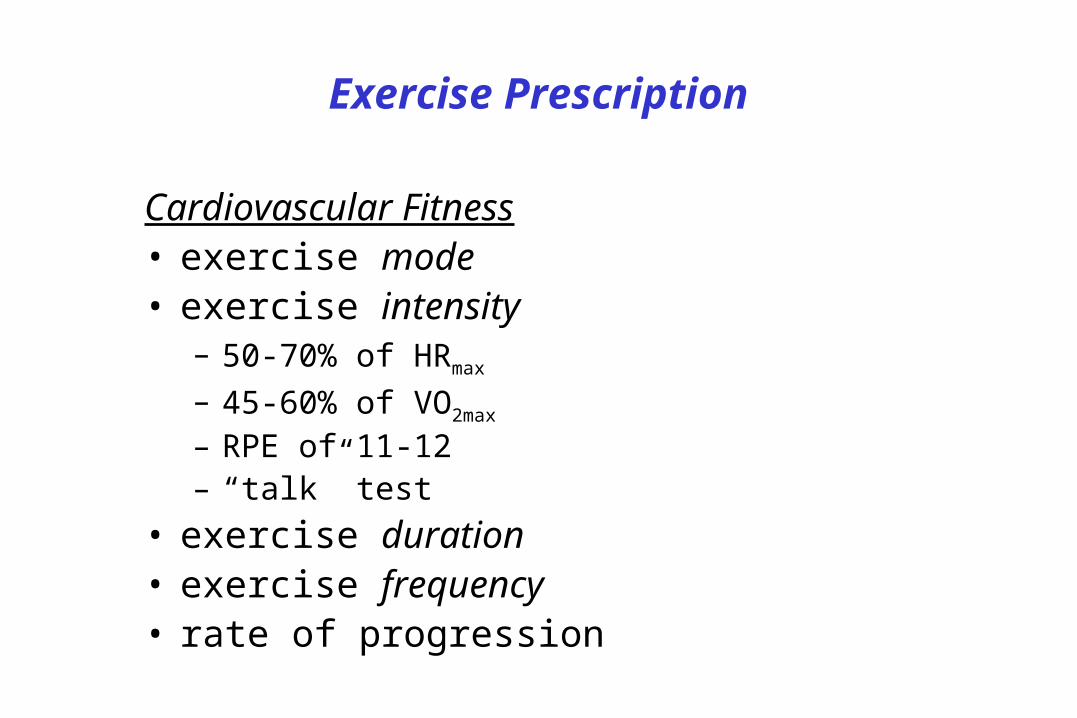
Exercise Prescription
Cardiovascular Fitness• exercise mode• exercise intensity
– 50-70% of HRmax
– 45-60% of VO2max
– RPE of 11-12– “talk” test
• exercise duration• exercise frequency• rate of progression

Classification of Exercise Intensity Based on 30-60 minutes of continuous exercise
%HRmax %VO2max RPE Classification
<30 <25 <9 Very light
30-49 25-44 9-10 Light
50-69 45-59 11-12 Moderate
70-89 60-84 13-16 Heavy
>90 >85 >16 Very hard
Exercise Prescription
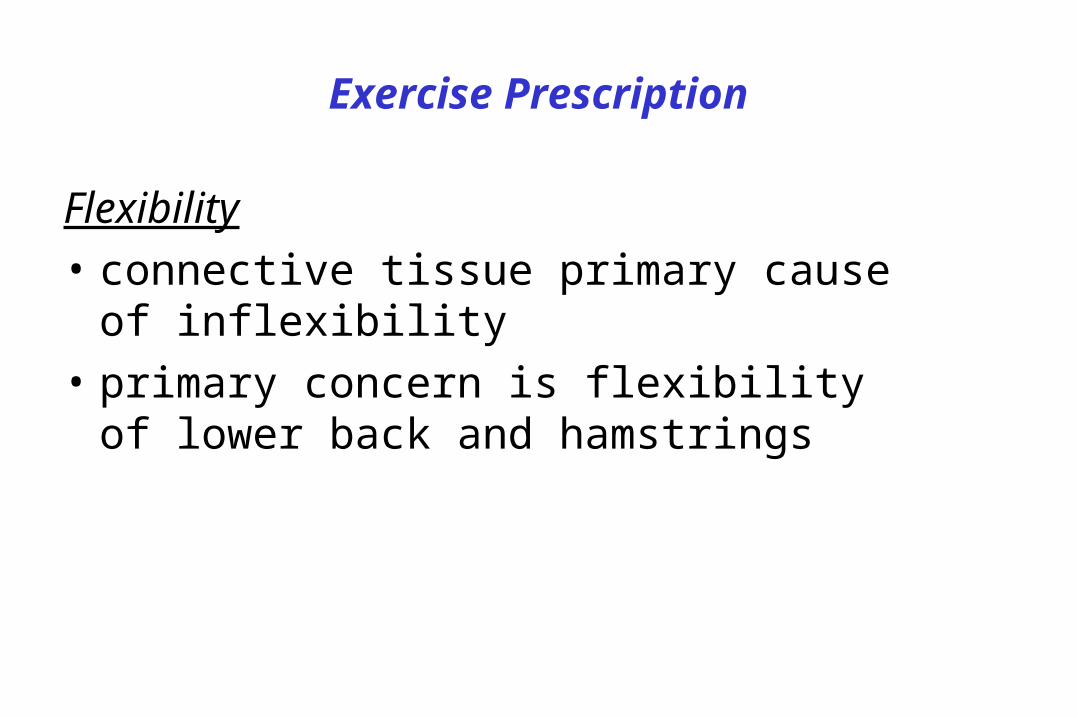
Flexibility• connective tissue primary cause of
inflexibility• primary concern is flexibility of lower
back and hamstrings

Exercise Prescription
Muscular Strength and Endurance• general recommendations
– one set of 8-12 repetitions– set resistance to reach volitional fatigue– at least 2 days/week– performed at moderate-to-slow speeds– full range of motion– do not alter normal breathing