health ar 2017-18 volume 1 covering · 662,531661,113 554,922 accumulated funds 661,113 662,531...
TRANSCRIPT

COVER PAGE 1
Central Coast Local Health District
Financial Statements for the year ended 30 June 2018


INDEPENDENT AUDITOR’S REPORT
Central Coast Local Health District
To Members of the New South Wales Parliament
Opinion
I have audited the accompanying financial statements of the Central Coast Local Health District
(the District), which comprise the Statement of Comprehensive Income for the year ended
30 June 2018, the Statement of Financial Position as at 30 June 2018, the Statement of Changes in
Equity and the Statement of Cash Flows for the year then ended, notes comprising a Statement of
Significant Accounting Policies and other explanatory information of the District and the consolidated
entity. The consolidated entity comprises the District and the entities it controlled at the year’s end or
from time to time during the financial year.
In my opinion, the financial statements:
• give a true and fair view of the financial position of the District and the consolidated entity as at
30 June 2018, and of their financial performance and cash flows for the year then ended in
accordance with Australian Accounting Standards
• are in accordance with section 45E of the Public Finance and Audit Act 1983 (PF&A Act) and
the Public Finance and Audit Regulation 2015.
My opinion should be read in conjunction with the rest of this report.
Basis for Opinion
I conducted my audit in accordance with Australian Auditing Standards. My responsibilities under the
standards are described in the ‘Auditor’s Responsibilities for the Audit of the Financial Statements’
section of my report.
I am independent of the District and the consolidated entity in accordance with the requirements of
the:
• Australian Auditing Standards
• Accounting Professional and Ethical Standards Board’s APES 110 ‘Code of Ethics for
Professional Accountants’ (APES 110).
I have fulfilled my other ethical responsibilities in accordance with APES 110.
Parliament promotes independence by ensuring the Auditor-General and the Audit Office of
New South Wales are not compromised in their roles by:
• providing that only Parliament, and not the executive government, can remove an
Auditor-General
• mandating the Auditor-General as auditor of public sector agencies
• precluding the Auditor-General from providing non-audit services.
I believe the audit evidence I have obtained is sufficient and appropriate to provide a basis for my
audit opinion.

Emphasis of Matter – Presentation of Budget Information
Without modification to the opinion expressed above, I draw attention to the basis of presenting
adjusted budget information detailed in Note 1(ac). The note states that AASB 1055 ‘Budgetary
Reporting’ is not applicable to the District. It also states that, unlike the requirement in AASB 1055
‘Budgetary Reporting’ to present original budget information, the District’s financial statements present
adjusted budget information.
The Chief Executive’s Responsibilities for the Financial Statements
The Chief Executive is responsible for the preparation and fair presentation of the financial statements
in accordance with Australian Accounting Standards and the PF&A Act, and for such internal control
as the Chief Executive determines is necessary to enable the preparation and fair presentation of the
financial statements that are free from material misstatement, whether due to fraud or error.
In preparing the financial statements, the Chief Executive is responsible for assessing the ability of the
District and the consolidated entity to continue as a going concern, disclosing as applicable, matters
related to going concern and using the going concern basis of accounting except where operations will
cease as a result of an administrative restructure.
Auditor’s Responsibilities for the Audit of the Financial Statements
My objectives are to:
• obtain reasonable assurance about whether the financial statements as a whole are free from
material misstatement, whether due to fraud or error
• issue an Independent Auditor’s Report including my opinion.
Reasonable assurance is a high level of assurance, but does not guarantee an audit conducted in
accordance with Australian Auditing Standards will always detect material misstatements.
Misstatements can arise from fraud or error. Misstatements are considered material if, individually or
in aggregate, they could reasonably be expected to influence the economic decisions users take
based on the financial statements.
A description of my responsibilities for the audit of the financial statements is located at the Auditing
and Assurance Standards Board website at: www.auasb.gov.au/auditors_responsibilities/ar3.pdf. The
description forms part of my auditor’s report.
My opinion does not provide assurance:
• that the District or the consolidated entity carried out their activities effectively, efficiently and
economically
• about the security and controls over the electronic publication of the audited financial
statements on any website where they may be presented
• about any other information which may have been hyperlinked to/from the financial statements.
Sally Bond
Director, Financial Audit Service
30 August 2018
SYDNEY


Actual AdjustedBudget
Unaudited
Actual Notes Actual AdjustedBudget
Unaudited
Actual
2018 2018 2017 2018 2018 2017$000 $000 $000 $000 $000 $000
Expenses excluding lossesOperating Expenses
----- ----- ----- Employee Related Expenses 2 579,499 579,898 539,846 558,007 558,505 526,818 Personnel Services 3 ----- ----- ----- 28,611 28,545 27,460 Visiting Medical Officers 28,611 28,545 27,460
199,606 198,986 212,106 Other Expenses 4 199,606 198,986 212,106 24,392 24,396 22,350 Depreciation and Amortisation 1(m), 5 24,392 24,396 22,350 7,964 7,885 7,246 Grants and Subsidies 6 7,964 7,885 7,246
818,580 818,317 795,980 Total Expenses excluding losses 840,072 839,710 809,008 Revenue
668,639 668,638 635,353 NSW Ministry of Health Recurrent Allocations 1(h) 668,639 668,638 635,353 142,791 141,788 123,924 NSW Ministry of Health Capital Allocations 1(h) 142,791 141,788 123,924
----- ----- ----- Acceptance by the Crown Entity of Employee Benefits 1(e)(ii),10 21,492 21,393 13,028 96,462 98,024 117,693 Sale of Goods and Services 1(h), 7 96,462 98,024 117,693
779 358 966 Investment Revenue 1(h),8 779 358 966 13,283 14,343 13,861 Grants and Other Contributions 1(h),9 13,283 14,343 13,861
3,067 1,916 12,498 Other Income 11 3,067 1,916 12,498 925,021 925,067 904,295 Total Revenue 946,513 946,460 917,323
(26) (32) (1,085) Gain / (Loss) on Disposal 12 (26) (32) (1,085) (224) (159) (248) Other Gains / (Losses) 13 (224) (159) (248)
106,191 106,559 106,982 Net Result 26 106,191 106,559 106,982
Other Comprehensive IncomeItems that will not be reclassified to net resultChanges in Revaluation Surplus of
----- ----- 9,143 Property, Plant and Equipment 18 ----- ----- 9,143 ----- ----- 9,143 Total Other Comprehensive Income ----- ----- 9,143
106,191 106,559 116,125 TOTAL COMPREHENSIVE INCOME 106,191 106,559 116,125
The accompanying notes form part of these financial statements.
Central Coast Local Health DistrictStatement of Comprehensive Income for the year ended 30 June 2018
CONSOLIDATIONPARENT

Actual AdjustedBudget
Unaudited
Actual Notes Actual AdjustedBudget
Unaudited
Actual
2018 2018 2017 2018 2018 2017$000 $000 $000 $000 $000 $000
ASSETS
Current Assets22,622 23,364 24,655 Cash and Cash Equivalents 14 22,622 23,364 24,655 16,713 15,508 14,313 Receivables 15 16,713 15,508 14,313 4,351 5,000 4,999 Inventories 16 4,351 5,000 4,999 7,865 7,409 7,409 Financial Assets at Fair Value 17 7,865 7,409 7,409
51,551 51,281 51,376 Total Current Assets 51,551 51,281 51,376
Non-Current AssetsProperty, Plant & Equipment
733,665 731,796 625,510 - Land and Buildings 18 733,665 731,796 625,510 35,803 33,195 25,520 - Plant and Equipment 18 35,803 33,195 25,520 15,270 16,781 16,782 - Infrastructure Systems 18 15,270 16,781 16,782 1,264 2,207 1,595 - Leasehold Improvements 18 1,264 2,207 1,595
786,002 783,979 669,407 Total Property, Plant & Equipment 786,002 783,979 669,407 786,002 783,979 669,407 Total Non-Current Assets 786,002 783,979 669,407 837,553 835,260 720,783 Total Assets 837,553 835,260 720,783
LIABILITIES
Current Liabilities41,067 41,641 39,998 Payables 21 41,067 41,641 39,998 83,232 79,087 74,084 Provisions 22 83,232 79,087 74,084 1,304 1,164 1,096 Other 23 1,304 1,164 1,096
125,603 121,892 115,178 Total Current Liabilities 125,603 121,892 115,178
Non-Current Liabilities943 943 789 Provisions 22 943 943 789 943 943 789 Total Non-Current Liabilities 943 943 789
126,546 122,835 115,967 Total Liabilities 126,546 122,835 115,967 711,007 712,425 604,816 Net Assets 711,007 712,425 604,816
EQUITY49,894 49,894 49,894 Reserves 49,894 49,894 49,894
661,113 662,531 554,922 Accumulated Funds 661,113 662,531 554,922
711,007 712,425 604,816 Total Equity 711,007 712,425 604,816
The accompanying notes form part of these financial statements.
CONSOLIDATIONPARENT
Central Coast Local Health DistrictStatement of Financial Position as at 30 June 2018

PARENT AND CONSOLIDATION Notes Accumulated Revaluation TotalFunds Surplus$000 $000 $000
Balance at 1 July 2017 554,922 49,894 604,816
Total Equity at 1 July 2017 554,922 49,894 604,816 Net Result for the year 106,191 ----- 106,191 Other Comprehensive Income:Total Other Comprehensive Income ----- ----- ----- Total Comprehensive Income for the year 106,191 ----- 106,191
Balance at 30 June 2018 661,113 49,894 711,007
Balance at 1 July 2016 448,670 40,021 488,691
Total Equity at 1 July 2016 448,670 40,021 488,691 Net Result for the year 106,982 ----- 106,982 Other Comprehensive Income:Net Change in Revaluation Surplus of Property, Plant and Equipment 18 ----- 9,143 9,143 Available for Sale Financial Assets:
Transfers on Disposal (730) 730 ----- Total Other Comprehensive Income (730) 9,873 9,143 Total Comprehensive Income for the year 106,252 9,873 116,125
Balance at 30 June 2017 554,922 49,894 604,816
The accompanying notes form part of these financial statements.
Central Coast Local Health DistrictStatement of Changes in Equity for the year ended 30 June 2018

Actual AdjustedBudget
Unaudited
Actual Notes Actual AdjustedBudget
Unaudited
Actual
2018 2018 2017 2018 2018 2017$000 $000 $000 $000 $000 $000
CASH FLOWS FROM OPERATING ACTIVITIESPayments
----- ----- ----- Employee Related (558,567) (561,738) (528,157) (249,234) (249,802) (270,178) Suppliers for Goods and Services (249,234) (249,802) (270,178)
(8,809) (8,730) (8,017) Grants and Subsidies (8,809) (8,730) (8,017) (558,567) (561,738) (528,157) Other ----- ----- -----
(816,610) (820,270) (806,352) Total Payments (816,610) (820,270) (806,352)
Receipts668,639 668,638 635,353 NSW Ministry of Health Recurrent Allocations 668,639 668,638 635,353 142,791 141,788 123,924 NSW Ministry of Health Capital Allocations 142,791 141,788 123,924
8,973 8,973 7,748 Reimbursements from the Crown Entity 8,973 8,973 7,748 96,210 101,456 119,605 Sale of Goods and Services 96,210 101,456 119,605
779 358 966 Interest Received 779 358 966 14,564 15,672 14,910 Grants and Other Contributions 14,564 15,672 14,910 24,040 21,095 36,920 Other 24,040 21,095 36,920
955,996 957,980 939,426 Total Receipts 955,996 957,980 939,426
139,386 137,710 133,074 NET CASH FLOWS FROM OPERATING ACTIVITIES 26 139,386 137,710 133,074
CASH FLOWS FROM INVESTING ACTIVITIES
117 ----- 144 Proceeds from Sale of Property, Plant & Equipment 117 ----- 144 (141,080) (139,001) (126,776) Purchases of Property, Plant & Equipment (141,080) (139,001) (126,776)
(456) ----- (626) Purchases of Financial Assets (456) ----- (626)
(141,419) (139,001) (127,258) NET CASH FLOWS FROM INVESTING ACTIVITIES (141,419) (139,001) (127,258)
(2,033) (1,291) 5,816 NET INCREASE / (DECREASE) IN CASH AND CASH EQUIVALENTS (2,033) (1,291) 5,816 24,655 24,655 18,839 Opening Cash and Cash Equivalents 14 24,655 24,655 18,839
22,622 23,364 24,655 CLOSING CASH AND CASH EQUIVALENTS 14 22,622 23,364 24,655
The accompanying notes form part of these financial statements.
Central Coast Local Health DistrictStatement of Cash Flows for the year ended 30 June 2018
CONSOLIDATIONPARENT
1. Statement of Significant Accounting Policies
a)
*
*
b)
*
*
*
The District has the capacity to review timing of subsidy cashflows to ensure that debts can be paid when they become due and payable.
The District has developed an Efficiency and Improvement Plan (EIP) which identifies revenue improvement and cost saving strategies. Benefitsfrom the EIP are retained by the District and assist in meeting its overall budget target. The EIP is monitored and evaluated by the NSW Ministryof Health throughout the financial year.
Allocated funds, combined with other revenues earned, are applied to pay debts as and when they become due and payable.
Property, plant and equipment, assets (or disposal groups) held for sale and financial assets at 'fair value through profit and loss' are measured at fairvalue. Other financial statement items are prepared in accordance with the historical cost convention except where specified otherwise.
Judgements, key assumptions and estimations management has made are disclosed in the relevant notes to the financial statements.
All amounts are rounded to the nearest one thousand dollars and are expressed in Australian currency.
The parent entity, comprises all the operating activities of the Hospital Facilities and the Community Health Centres under its control. It alsoencompasses the Restricted Assets (as disclosed in Note 20), which, while containing assets which are restricted for specified uses by thegrantor or the donor, are nevertheless controlled by the parent entity.
The Central Coast Local Health District Special Purpose Service Entity, which was established as a Division of the District on 1 January 2011 inaccordance with the Health Services Act 1997. This Division provides personnel services to enable the District to exercise its functions.
The District, as a reporting entity, comprises all the entities under its control, namely:
The Reporting Entity
The Central Coast Local Health District (the District) was established under the provisions of the Health Services Act 1997 with effect from 1 January2011.
Central Coast Local Health DistrictNotes to and forming part of the Financial Statements
for the year ended 30 June 2018
As a consequence the values in the financial statements presented herein consist of the parent entity and the consolidated entity which comprises theparent and special purpose service entity. In the process of preparing the consolidated financial statements consisting of the controlling and controlledentities, all inter-entity transactions and balances have been eliminated, and like transactions and other events are accounted for using uniformaccounting policies.
The District is a NSW Government entity and is controlled by the NSW Ministry of Health, which is the immediate parent. The reporting entity is alsocontrolled by the State of New South Wales (and is consolidated as part of the NSW Total State Sector Accounts), which is the ultimate parent. Thereporting entity is a not-for-profit entity (as profit is not its principal objective).
These consolidated financial statements for the year ended 30 June 2018 have been authorised for issue by the Chief Executive on 29 Aug 2018.
The financial statements of the District have been prepared on a going concern basis.
The Secretary of NSW Health, the Chair of the Central Coast Local Health District Board and the Chief Executive, through the Performance Agreementhave agreed to service and funding levels for the forward financial year. The Performance Agreement sets out the level of financial resources for publichealth services under the District's control and the source of these funds. By agreement, the Performance Agreement requires local management tocontrol its financial liquidity and in particular meet benchmarks for the payment of creditors. Where the District fails to meet Performance Agreementperformance standards, the NSW Ministry of Health as the state manager can take action in accordance with annual performance frameworkrequirements, including financial support and increased management interaction by the NSW Ministry of Health.
Other circumstances why the going concern assumption is appropriate include:
Basis of Preparation
The District's financial statements are general purpose financial statements which have been prepared on an accrual basis and in accordance withapplicable Australian Accounting Standards (which include Australian Accounting Interpretations), the requirements of the Health Services Act 1997and its regulations (including observation of the Accounts and Audit Determination for Public Health Organisations), the Public Finance and Audit Act1983 and the Public Finance and Audit Regulation 2015, and Financial Reporting Directions mandated by the Treasurer. The financial statementscomply with the NSW Treasury mandates circular for NSW General Government Sector Entities. Further information on the adjusted budget figurescan be found at Note 1(ac).

1. Statement of Significant Accounting Policies
Central Coast Local Health DistrictNotes to and forming part of the Financial Statements
for the year ended 30 June 2018
c)
d)
e)
i)
ii)
iii)
iv)
Actuarial advice obtained by NSW Treasury, a controlled entity of the ultimate parent, has confirmed that using the nominal annual leavebalance plus the annual leave entitlements accrued while taking annual leave can be used to approximate the present value of the annual leaveliability. On-costs of 17.3% are applied to the value of leave payable at 30 June 2018 (comparable on-costs for 30 June 2017 were 17.2%).TheDistrict has assessed the actuarial advice based on the District’s circumstances to both the annual leave and ADO and has determined that theeffect of discounting is immaterial. All annual leave and ADO are classified as a current liability even where the consolidated entity does notexpect to settle the liability within 12 months as the consolidated entity does not have an unconditional right to defer settlement.
Unused non-vesting sick leave does not give rise to a liability as it is not considered probable that sick leave taken in the future will be greaterthan the benefits accrued in the future.
The District's liability for Long Service Leave and defined benefit superannuation (State Authorities Superannuation Scheme and StateSuperannuation Scheme) are assumed by the Crown Entity, which is a controlled entity of the ultimate parent.
The District accounts for the liability as having been extinguished resulting in the amount assumed being shown as part of the non-monetaryrevenue item described as 'Acceptance by the Crown Entity of Employee Benefits'.
Specific on-costs relating to Long Service Leave assumed by the Crown Entity are borne by the District as shown in Note 22.
Long service leave is measured at the present value of expected future payments to be made in respect of services provided up to the reportingdate. Consideration is given to certain factors based on actuarial review, including expected future wage and salary levels, experience ofemployee departures, and periods of service. Expected future payments are discounted using Commonwealth government bond rate at thereporting date.
The superannuation expense for the financial year is determined by using the formulae specified in the Treasurer’s Directions. The expense forcertain superannuation schemes (i.e. Basic Benefit and First State Super) is calculated as a percentage of the employee's salary. For othersuperannuation schemes (i.e. State Superannuation Scheme and State Authorities Superannuation Scheme), the expense is calculated as amultiple of the employee's superannuation contributions.
Salaries and Wages, Annual Leave, Sick Leave, Allocated Days Off (ADO) and On-Costs
Comparative Information
Except when an Australian Accounting Standard permits or requires otherwise, comparative information is disclosed in respect of the previous periodfor all amounts reported in the financial statements.
Statement of Compliance
Certain comparative information has been reclassified to ensure consistency with current year presentation and classification.
Long Service Leave and Superannuation
Consequential On-Costs
Other Provisions
Other provisions exist when the District has a present legal or constructive obligation as a result of a past event; it is probable that an outflow ofresources will be required to settle the obligation; and a reliable estimate can be made of the amount of the obligation.
The financial statements and notes comply with Australian Accounting Standards which include Australian Accounting Interpretations.
Employee Benefits and Other Provisions
Salaries and wages (including non-monetary benefits) and paid sick leave that are expected to be settled wholly within 12 months after the endof the period in which the employees render the service are recognised and measured at the undiscounted amounts of the benefits.
Annual leave and ADO are not expected to be settled wholly before 12 months after the end of the annual reporting period in which theemployees render the related service. As such, it is required to be measured at present value in accordance with AASB 119 Employee Benefits(although short-cut methods are permitted).
Consequential costs to employment are recognised as liabilities and expenses where the employee benefits to which they relate have beenrecognised. This includes outstanding amounts of workers’ compensation insurance premiums and fringe benefits tax.

1. Statement of Significant Accounting Policies
Central Coast Local Health DistrictNotes to and forming part of the Financial Statements
for the year ended 30 June 2018
f)
g)
h)
Grants and Other Contributions
Motor Accident Authority Third Party
Income is measured at the fair value of the consideration or contribution received or receivable. Additional comments regarding the accounting policiesfor the recognition of revenue are discussed below.
Revenue from the sale of goods is recognised as revenue when the District transfers the significant risks and rewards of ownership of the assets.
Revenue is recognised when the service is provided or by reference to the stage of completion (based on labour hours incurred to date).
Patient fees are derived from chargeable inpatients and non-inpatients on the basis of rates specified by the NSW Ministry of Health. Revenue isrecognised on an accrual basis when the service has been provided to the patient.
Revenue for highly specialised drugs is paid by the Commonwealth in accordance with the terms of the Commonwealth agreement through Medicareand reflects the recoupment of costs incurred under Section 100 of the National Health Act 1953 for highly specialised drugs. The agreement providesfor the provision of medicines for the treatment of chronic conditions where specific criteria are met in respect of day admitted patients, non admittedpatients or patients on discharge. Revenue is recognised when the drugs have been provided to the patient.
Patient Fees
Department of Veterans' Affairs
An agreement is in place with the Commonwealth Department of Veterans' Affairs through which direct funding is provided for the provision of healthservices to entitled veterans. For inpatient services, revenue is recognised by the District on an accrual basis by reference to patient admissions. Nonadmitted patients are recognised by the NSW Ministry of Health in the form of a block grant.
Interest revenue is recognised using the effective interest method. The effective interest rate is the rate that exactly discounts the estimated future cashreceipts over the expected life of the financial instrument or a shorter period, where appropriate, to the net carrying amount of the financial asset.
The District's insurance activities are conducted through the NSW Treasury Managed Fund (TMF) Scheme of self insurance for government entities.The expense (premium) is determined by the Fund Manager based on past claims experience. The TMF is managed by Insurance and Care NSW(iCare), a controlled entity of the ultimate parent.
Highly Specialised Drugs
Insurance
Income Recognition
Sale of Goods
Rendering of Services
Investment Revenue
A bulk billing agreement exists in which motor vehicle insurers effect payment directly to NSW Health for the hospital costs for those personshospitalised or attending for inpatient treatment as a result of motor vehicle accidents. The District recognises the revenue on an accruals basis fromthe time the patient is treated or admitted into hospital.
Grants and Subsidies
Grant and subsidies expense generally comprise contributions in cash or in kind to various local government authorities and not-for-profit communityorganisations to support their health-related objectives and activities. The grant and subsidies are expensed on the transfer of the cash or assets. Thetransferred assets are measured at their fair value.
Grants and other contributions, comprising mainly cash and in-kind contributions, are recognised as revenues when control passes to the District andthe contractual obligations have been satisfied. In-kind contributions are measured at fair value on transfer date.
1. Statement of Significant Accounting Policies
Central Coast Local Health DistrictNotes to and forming part of the Financial Statements
for the year ended 30 June 2018
*
*
i)
*
*
j)
k)
Interstate Patient Flows
Land and buildings are owned by the Health Administration Corporation, an entity controlled by the immediate parent. Land and buildings which areoperated/occupied by the District are deemed to be controlled by the District and are reflected as such in the financial statements.
Property, plant and equipment acquired are initially recognised at cost and subsequently revalued at fair value less accumulated depreciation andimpairment. Cost is the amount of cash or cash equivalents paid or the fair value of the other consideration given to acquire the asset at the time of itsacquisition or construction or, where applicable, the amount attributed to that asset when initially recognised in accordance with the requirements ofother Australian Accounting Standards.
NSW Ministry of Health Allocations
Acquisition of Property, Plant and Equipment
Assets acquired at no cost, or for nominal consideration, are initially recognised at their fair value at the date of acquisition.
Fair value is the price that would be received to sell an asset in an orderly transaction between market participants at measurement date.
Where payment for an asset is deferred beyond normal credit terms, its cost is the cash price equivalent, i.e. the deferred payment amount iseffectively discounted over the period of credit.
Interstate patient flows are funded through the State Pool, based on activity and consistent with the price determined in the service level agreement.The funding is recognised as recurrent allocation received from the immediate parent.
receivables and payables are stated with the amount of GST included.
amount of GST incurred by the District as a purchaser that is not recoverable from the Australian Taxation Office is recognised as part of anasset's cost of acquisition or as part of an item of expense; and
Payments are made by the immediate parent on the basis of the allocation for the District as adjusted for approved supplementations mostly for salaryagreements and approved enhancement projects.
This allocation is included in the Statement of Comprehensive Income before arriving at the "Net Result" on the basis that the allocation is earned inreturn for the health services provided on behalf of the NSW Ministry of Health. Allocations are normally recognised upon the receipt of cash.
Income, expenses and assets are recognised net of the amount of GST, except that the:
Cash flows are included in the Statement of Cash Flows on a gross basis. However, the GST components of cash flows arising from investing andfinancing activities which are recoverable from, or payable to, the Australian Taxation Office are classified as operating cash flows.
Specialist doctors with rights of private practice are subject to an infrastructure charge including service charges where applicable for the use ofhospital facilities at rates determined by the NSW Ministry of Health. Charges consist of two components:
The District uses a number of facilities owned and maintained by the local authorities in the area to deliver community health services for which nocharges are raised by the authorities.
Use of Outside Facilities
Use of Hospital Facilities
a monthly charge raised by the District based on a percentage of receipts generated.
the residual of the Private Practice Trust Fund at the end of each financial year, such sum being credited for the District use in the advancement of the District or individuals within it.
Refer to Note 7 (b) for further details.
Accounting for the Goods & Services Tax (GST)
Where material, the cost method of accounting is used for the initial recording of all such services. Cost is determined as the fair value of the servicesgiven and is then recognised as revenue with a matching expense.

1. Statement of Significant Accounting Policies
Central Coast Local Health DistrictNotes to and forming part of the Financial Statements
for the year ended 30 June 2018
l)
m) Depreciation of Property, Plant and Equipment
2.5%2.5%
Plant and Equipment 20.0%
10.0%12.5%
5.0%12.5%20.0%10.0%10.0%
n) Revaluation of Non-Current Assets
- Motor Vehicle Sedans - Motor Vehicles, Trucks & Vans - Office Equipment - Plant and Machinery
“Infrastructure Systems” means assets that comprise public facilities and which provide essential services and enhance the productive capacity of theeconomy including roads, bridges, water infrastructure and distribution works, sewerage treatment plants, seawalls and water reticulation systems.
Property, plant and equipment costing $10,000 and above individually (or forming part of a network costing more than $10,000) are capitalised.
Depreciation is provided for on a straight-line basis for all depreciable assets so as to write off the depreciable amount of each asset as it is consumedover its useful life to the District. Land is not a depreciable asset. All material identifiable components of assets are depreciated over their useful lives.
Infrastructure Systems
To ensure that the carrying amount for each asset does not differ materially from its fair value at reporting date, indices are sourced. The indices reflectan assessment of movements made in the period between revaluations.
Non-specialised assets with short useful lives are measured at depreciated historical cost, as an approximation of fair value. The entity has assessedthat any difference between fair value and depreciated historical cost is unlikely to be material.
Capitalisation Thresholds
Details of depreciation rates initially applied for major asset categories are as follows:
Buildings
Physical non-current assets are valued in accordance with the 'Valuation of Physical Non-Current Assets at Fair Value' Policy and Guidelines Paper(TPP 14-01). This policy adopts fair value in accordance with AASB 13 Fair Value Measurement, AASB 116 Property, Plant and Equipment and AASB140 Investment Property.
- Electro Medical Equipment
Property, plant and equipment is measured at the highest and best use by market participants that is physically possible, legally permissible andfinancially feasible. The highest and best use must be available at a period that is not remote and takes into account the characteristics of the assetbeing measured, including any socio-political restrictions imposed by government. In most cases, after taking into account these considerations, thehighest and best use is the existing use. In limited circumstances, the highest and best use may be a feasible alternative use, where there are norestrictions on use or where there is a feasible higher restricted alternative use.
Fair value of property, plant and equipment is based on a market participants’ perspective, using valuation techniques (market approach, costapproach, income approach) that maximise relevant observable inputs and minimise unobservable inputs. Also refer Note 18 and Note 19 for furtherinformation regarding fair value.
Depreciation rates are subsequently varied where changes occur in the assessment of the remaining useful life of the assets reported.
* Costing less than $200,000 * Costing more than or equal to $200,000 - Furniture, Fittings and Furnishings
- Computer Equipment
When revaluing non-current assets using the cost approach, the gross amount and the related accumulated depreciation are separately restated.
For other assets valued using other valuation techniques, any balances of accumulated depreciation existing at the revaluation date in respect of thoseassets are credited to the asset accounts to which they relate. The net asset accounts are then increased or decreased by the revaluation incrementsor decrements.

1. Statement of Significant Accounting Policies
Central Coast Local Health DistrictNotes to and forming part of the Financial Statements
for the year ended 30 June 2018
o) Impairment of Property, Plant and Equipment
p) Restoration Costs
q) Investment Properties
r) Maintenance
s) Leased Assets
t) Inventories
u) Loans and Receivables
On initial recognition, the present value of the expected cost for the restoration or cost of dismantling of an asset after its use is included in the cost ofthe respective asset if the recognition criteria for a provision are met.
Revaluation increments are credited directly to the revaluation surplus, except that, to the extent that an increment reverses a revaluation decrement inrespect of that class of asset previously recognised as a loss in the net result, the increment is recognised immediately as a gain in the net result.
Revaluation decrements are recognised immediately as a loss in the net result for the year, except that, to the extent that a credit balance exists in therevaluation surplus in respect of the same class of assets, they are debited directly to the revaluation surplus.
As a not-for-profit entity, revaluation increments and decrements are offset against one another within a class of non-current assets, but not otherwise.
The District does not have any property that meets the definition of Investment Property.
Investment property is held to earn rentals or for capital appreciation, or both. However, for not-for-profit entities, property held to meet service deliveryobjectives rather than to earn rental or for capital appreciation does not meet the definition of investment property and is accounted for under AASB116, Property, Plant and Equipment.
Obsolete items are disposed of in accordance with instructions issued by the NSW Ministry of Health.
Where an asset that has previously been revalued is disposed of, any balance remaining in the revaluation surplus in respect of that asset istransferred to accumulated funds.
As a not-for-profit entity with no cash generating units, impairment under AASB 136 Impairment of Assets is unlikely to arise. As property, plant andequipment is carried at fair value or an amount that approximates fair value, impairment can only arise in the rare circumstances such as where thecosts of disposal are material. Specifically, impairment is unlikely for not-for-profit entities given that AASB 136 Impairment of Assets modifies therecoverable amount test for non-cash generating assets of not-for-profit entities to the higher of fair value less costs of disposal and depreciatedreplacement cost, where depreciated replacement cost is also fair value.
Inventories held for distribution are stated at cost, adjusted when applicable, for any loss of service potential. Inventories (other than those held fordistribution) are stated at the lower of cost and net realisable value. Cost is calculated using the weighted average cost method.
Loans and receivables are non-derivative financial assets with fixed or determinable payments that are not quoted in an active market. These financialassets are recognised initially at fair value. Subsequent measurement is at amortised cost using the effective interest method, less an allowance forany impairment of receivables. Any changes are recognised in the Net Result when impaired, derecognised or through the amortisation process.
Short-term receivables with no stated interest rate are measured at the original invoice amount where the effect of discounting is immaterial.
A distinction is made between finance leases which effectively transfer from the lessor to the lessee substantially all the risks and rewards incidental toownership of the leased assets, and operating leases under which the lessor effectively retains all such risks and rewards.
Where a non-current asset is acquired by means of a finance lease, at the commencement of the lease term, the asset is recognised at its fair value or,if lower, the present value of the minimum lease payments, at the inception of the lease. The corresponding liability is established at the same amount.Lease payments are allocated between the principal component and the interest expense.
Operating lease payments are recognised as an expense on a straight-line basis over the lease term.
Day-to-day servicing costs or maintenance are charged as expenses as incurred except where they relate to the replacement of a part or componentof an asset, in which case the costs are capitalised and depreciated.

1. Statement of Significant Accounting Policies
Central Coast Local Health DistrictNotes to and forming part of the Financial Statements
for the year ended 30 June 2018
v) Investments
*
*
*
w) Impairment of Financial Assets
For certain categories of financial assets, such as trade receivables, the entity first assesses whether impairment exists individually for financial assetsthat are individually significant, or collectively for financial assets that are not individually significant. Assets are assessed for impairment on a collectivebasis if they were assessed not to be impaired individually.
TCorpIM Funds investment facilities are managed by New South Wales Treasury Corporation, a controlled entity of the ultimate parent. Thefacilities are designated at fair value through profit or loss as the management and performance of these financial assets is undertaken on a fairvalue basis, in accordance with a documented risk management strategy. Information about these assets is provided internally to the District'skey management personnel.
The District subsequently measures investments classified as 'held for trading' or designated upon initial recognition “at fair value through profit or loss” at fair value.
Financial assets are classified as 'held for trading' if they are acquired for the purpose of selling in the near term. Derivatives are also classifiedas held for trading. Gains or losses on these assets are recognised in the net result for the year.
Purchases or sales of investments under contract that require delivery of the asset within the timeframe established by convention or regulation arerecognised on the trade date; i.e. the date the District commits to purchase or sell the asset.
The movement in the fair value of the TCorpIM Funds investment incorporates distributions received as well as unrealised movements in fairvalue and is reported in the line item ‘investment revenue’.
Held-to-maturity investments – Non-derivative financial assets with fixed or determinable payments and fixed maturity that the District has thepositive intention and ability to hold to maturity are classified as 'held-to-maturity'.
These investments are measured at amortised cost using the effective interest method. Changes are recognised in the net result for the yearwhen impaired, derecognised or through the amortisation process.
The risk management strategy of the District has been developed consistent with the investment powers granted under the provision of thePublic Authorities (Financial Arrangements) Act 1987.
TCorpIM Funds investment are made in an effort to improve interest returns on cash balances otherwise available whilst also providing secure investments.
The fair value of investments that are traded at fair value in an active market is determined by reference to quoted current bid prices at the close ofbusiness on the Statement of Financial Position date.
All financial assets, except those measured at fair value through profit and loss, are subject to an annual review for impairment. An allowance forimpairment is established when there is objective evidence that the entity will not be able to collect all amounts due.
For financial assets carried at amortised cost, the amount of the allowance is the difference between the asset’s carrying amount and the present valueof estimated future cash flows, discounted at the effective interest rate. The amount of the impairment loss is recognised in the net result for the year.
Investments are initially recognised at fair value plus, in the case of investments not at fair value through profit or loss, transaction costs. The Districtdetermines the classification of its financial assets after initial recognition and, when allowed and appropriate, re-evaluates this at each financial yearend.
Any reversals of impairment losses are reversed through the net result for the year, where there is objective evidence. Reversals of impairment lossesof financial assets carried at amortised cost cannot result in a carrying amount that exceeds what the carrying amount would have been had there notbeen an impairment loss.
Available-for-sale investments - Any investments that do not fall into any other category are accounted for as available-for-sale investments andmeasured at fair value. Gains or losses on available-for-sale investments are recognised in other comprehensive income until disposed orimpaired, at which time the cumulative gain or loss previously recognised in other comprehensive income is recognised in the net result for theyear. However, interest calculated using the effective interest method and dividends are recognised in the net result for the year.

1. Statement of Significant Accounting Policies
Central Coast Local Health DistrictNotes to and forming part of the Financial Statements
for the year ended 30 June 2018
x) De-recognition of Financial Assets and Financial Liabilities
*
*
y) Payables
z) Fair Value Hierarchy
*
*
*
aa) Equity and Reserves
(i)
(ii)
ab) Trust Funds
ac) Adjusted Budget Amounts
Accumulated FundsThe category "accumulated funds" includes all current and prior period retained funds.
Revaluation SurplusThe revaluation surplus is used to record increments and decrements on the revaluation of non-current assets. This accords with the District'spolicy on the revaluation of property, plant and equipment as discussed in Note 1(n).
The District receives monies in a trustee capacity for various trusts as set out in Note 25.
These amounts represent liabilities for goods and services provided to the District and other amounts. Payables are recognised initially at fair value.
Subsequent measurement is at amortised cost using the effective interest method. Short-term payables with no stated interest rate are measured atthe original invoice amount where the effect of discounting is immaterial.
Level 1 – quoted prices in active markets for identical assets / liabilities that the entity can access at the measurement date.
Level 2 – inputs other than quoted prices included within Level 1 that are observable, either directly or indirectly.
Level 3 – inputs that are not based on observable market data (unobservable inputs).
Payables are recognised for amounts to be paid in the future for goods and services received, whether or not billed to the District.
The District recognises transfers between levels of the fair value hierarchy at the end of the reporting period during which the change has occurred.
Refer to Note 19 and Note 31 for further disclosures regarding fair value measurements of non-financial and financial assets.
A number of the District’s accounting policies and disclosures require the measurement of fair values, for both financial and non-financial assets andliabilities. When measuring fair value, the valuation technique used maximises the use of relevant observable inputs and minimises the use ofunobservable inputs. Under AASB 13 Fair Value Measurement, the District categorises, for disclosure purposes, the valuation techniques based onthe inputs used in the valuation techniques as follows:
As the District performs only a custodial role in respect of these monies, and because the monies cannot be used for the achievement of the District'sown objectives, these funds are not recognised in the financial statements.
NSW Health's budget is shown at a consolidated level when presented in parliament each year (i.e. in the NSW Government Budget Papers). TheDistrict's budget is not presented in parliament, therefore AASB 1055 Budgetary Reporting is not applicable. Unlike the requirement in AASB 1055Budgetary Reporting to present original budget information, the District's financial statements present adjusted budget information.The adjustedbudgeted amounts are drawn from the initial Performance Agreements between the District and the NSW Ministry of Health at the beginning of thefinancial year, as well as any adjustments for the effects of additional supplementation provided in accordance with delegations to derive a final budgetat year end (i.e. adjusted budget). The budget amounts are not subject to audit and, accordingly, the relevant column entries in the financial statementsare denoted as "Unaudited".
Major variances between the original budgeted amounts and the actual amounts disclosed in the primary financial statements are explained in Note30.
Where the District has neither transferred nor retained substantially all the risks and rewards or transferred control, the asset is recognised to the extentof the District's continuing involvement in the asset.
A financial liability is derecognised when the obligation specified in the contract is discharged or cancelled or expires.
where the District has not transferred substantially all the risks and rewards, if the District has not retained control.
A financial asset is derecognised when the contractual rights to the cash flows from the financial assets expire; or if the District transfers the financialasset:
where substantially all the risks and rewards have been transferred; or
1. Statement of Significant Accounting Policies
Central Coast Local Health DistrictNotes to and forming part of the Financial Statements
for the year ended 30 June 2018
ad) Changes in Accounting Policy, including new or revised Australian Accounting Standards
(i)
(ii)
NSW public sector entities are not permitted to early adopt new Australian Accounting Standards, unless NSW Treasury determines otherwise.The following new Australian Accounting Standards, excluding standards not considered applicable or material to the District have not beenapplied and are not yet effective. The possible impact of these Accounting Standards in the period of initial application includes:
Issued but not yet effective
AASB 15 Revenue from Contracts with Customers (and associated amending standards AASB 2014-5, AASB 2015-8, AASB 2016-3, AASB2016-7 and AASB 2016-8) applies to annual periods beginning on or after 1 January 2019 for not-for-profit entities. AASB 15 Revenue fromContracts with Customers establishes a contract-based five-step analysis of transactions to determine the nature, amount and timing of revenuearising from contracts with customers. This new standard requires revenue to be recognised when control of the goods or services aretransferred to the customer at the transaction price. This may impact the timing of recognising certain revenue currently recognised by referenceto the stage of completion of the transaction.
AASB 2016-2 Amendments to Australian Accounting Standards - Disclosure Initiative: Amendments to AASB 107 Statement of Cash Flowsapplies to annual periods beginning on or after 1 January 2017. The standard amends AASB 107 Statement of Cash Flows to require additionaldisclosures for financing activities in the Statement of Cash Flows. A reconciliation of liabilities arising from financing activities has been added toNote of these financial statements.
The lease expense recognition pattern for leases will generally be accelerated as compared to today. Some key balance sheet metrics may alsobe impacted. Also, the statement of cash flows for lessees will be affected as payments for the principal portion of the lease liability will bepresented within financing activities.
Lessor accounting is substantially unchanged from today’s accounting under AASB 117 Leases. Lessors will continue to classify all leases usingthe same classification as in AASB 117 Leases and distinguish between two types of leases: operating and finance leases.
The standard permits two methods of adoption: full retrospective – by retrospectively adjusting each prior reporting period presented andrecognising the cumulative effect of initially applying the new requirements at the start of the earliest period, which would be 1 July 2018; ormodified retrospective – by recognising the cumulative effect of initially applying the new requirements at the initial application, which would be 1July 2019. NSW Treasury has mandated modified retrospective application of this accounting standard.
Effective for the first time in 2017-18
The accounting policies applied in 2017-18 are consistent with those of the previous financial year except as a result of new or revisedAustralian Accounting Standards that have been applied for the first time as follows:
AASB 1058 Income of Not-for-Profit Entities applies to not-for-profit entities and is effective for annual periods beginning on or after 1 January2019. This standard requires entities to recognise income where the consideration to acquire an asset, including cash, is significantly less thanthe fair value principally to enable the entity to further its objectives. Under this standard, the timing of income recognition may be impacteddepending on whether there is a liability or other performance obligation associated with the acquired asset, including cash. AASB 1058 Incomeof Not-for-Profit Entities also requires government agencies to recognise income for volunteer services received if the fair value of those servicescan be measured reliably and the services would have been purchased if they had not been donated. This is consistent with current practiceunder AASB 1004 Contributions and is not expected to materially impact these financial statements.
AASB 9 Financial Instruments applies to annual periods beginning on or after 1 January 2018. AASB 9 Financial Instruments will replace AASB139 Financial Instruments: Recognition and Measurement and establishes new principles for the financial reporting of financial assets, financialliabilities and hedge accounting. AASB 9 Financial Instruments also introduces a forward-looking 'expected credit losses' impairment model,which may impact the timing and amount of impairment recognition.
AASB 16 Leases replaces all existing leases requirements and applies to annual periods beginning on or after 1 January 2019. For lessees, thedistinction between operating and finance leases will no longer exist. Instead, AASB 16 Leases will require lessees to account for practically allleases under a single on-balance sheet model in a similar way to finance leases under AASB 117 Leases. The standard includes tworecognition exemptions for lessees – leases of ‘low value’ assets (e.g. personal computers below $10,000) and short term leases (i.e. leaseswith a lease term of 12 months or less). At the commencement of a lease, a lessee will recognise a liability representing its obligation to makefuture lease payments and an asset representing its right of use to the underlying asset for the lease term. Lessees will be required to separatelyrecognise interest expense on the lease liability and depreciation expense on the Right of Use asset rather than operating lease expense.
1. Statement of Significant Accounting Policies
Central Coast Local Health DistrictNotes to and forming part of the Financial Statements
for the year ended 30 June 2018
Overview of Assessment Activities
*
*
*
*
*
*
*
*
*
AASB 1059 Service Concession Arrangements is applicable to public sector entities only and requires the grantor to recognise a serviceconcession asset in a service concession arrangement where it controls the asset. A corresponding financial liability and/or grant of right liabilityis also recognised depending on the nature of the consideration exchanged. Service concession assets (including those provided by theoperator, an upgrade to or a major component replacement of an existing asset of the grantor; and existing assets of the grantor – alsoapplicable to previously unrecognised intangible assets except goodwill) are initially measured at current replacement cost based on AASB 13Fair Value Measurement principles. They are subsequently accounted for under AASB 116 Property, Plant & Equipment or AASB 138 IntangibleAssets. Service concession liabilities are initially measured at the same amount as the service concession asset and subsequently measuredusing either the “financial liability” model applying AASB 9 Financial Instruments or, the “grant of right” model under AASB 1059 ServiceConcession Arrangements. AASB 1059 Service Concession Arrangements requires retrospective application.
The new impairment model requires the recognition of impairment provisions based on expected credit losses rather than only incurredimpairment losses. This may result in earlier recognition of credit loss provisions.
Revenue and Income of Not-for-Profit Entities
The deferral of some revenues of The District.
Impact on the estimates and judgements involved in the unbilled revenue process.
Specific quantitative and qualitative disclosures may be required under AASB 15 Revenue from Contracts with Customers.
Financial Instruments
Service Concession Arrangements
No significant impact expected on The District.
The District plans to adopt the new standards on the required effective date in line with the NSW Treasury’s instructions.
NSW Health designed a project roadmap to implement the above five new accounting standards by its application date. The project consists of 4phases: Scoping, Data gathering, In Depth Analysis and Implementation. Scoping phase was completed and data gathering has begun. Anexternal project consultant and project manager will be appointed, and various steering committees and project teams will be internally formedas part of the implementation project. Central high level estimates on the impact of the new accounting standards were also calculated andreported to NSW Treasury by the central team at the NSW Ministry of Health. Further details are available in the NSW Ministry of Health’sconsolidated financial statements.
We are continuously analysing and assessing the impact of the new accounting standards. This includes changes to our accounting policies,internal and external reporting requirements, IT systems, business processes and associated internal controls with the objectives of quantifyingthe expected first time adoption impacts as well as supporting ongoing compliance with the new accounting requirements.
While the consolidated entity is yet to undertake a detailed assessment of the classification and measurement of all of the accounting standards,the following general impacts are expected from the work conducted so far:
Potential Impact on The District's Financial Report
Application Date
The total assets and liabilities on the balance sheet will increase. Net total assets are expected to decrease due to a reduction of the capitalisedasset being on a straight line basis whilst the liability reduces the principal amount of repayments. Net current assets will also show a decreasedue to an element of the liability being disclosed as a current liability.
Interest expenses will increase due to the unwinding of the effective interest rate implicit in the lease. Interest expense will be greater earlier in alease life due to the higher principal value causing profit variability over the course of the lease life. This effect may be partially mitigated due tothe number of leases held in the entity at different stages of their lease terms.
Depreciation expense will be booked on Right of Use assets, which will be on a straight-line basis.
Operating cash flows will be higher as repayment of the principal portion of all lease liabilities will be classified as financing activities.
Leases

PARENT CONSOLIDATION
2018 2017 2018 2017$000 $000 $000 $000
2. Employee Related Expenses
----- ----- Salaries and Wages (including annual leave and ADO) 502,140 475,669 ----- ----- Superannuation - Defined Benefit Plans 3,335 3,506 ----- ----- Superannuation - Defined Contribution Plans 44,020 41,616 ----- ----- Long Service Leave 20,090 9,686 ----- ----- Redundancies 508 720 ----- ----- Workers' Compensation Insurance 9,297 8,501 ----- ----- Fringe Benefits Tax 109 148
----- ----- 579,499 539,846
3. Personnel Services
502,140 475,669 Salaries and Wages ----- ----- 44,020 41,616 Superannuation - Defined Contribution Plans ----- -----
1,933 164 Long Service Leave ----- ----- 508 720 Redundancies ----- -----
9,297 8,501 Workers' Compensation Insurance ----- ----- 109 148 Fringe Benefits Tax ----- -----
558,007 526,818 ----- -----
Personnel services of Central Coast Local Health District was provided by its controlled entity, Central Coast Local Health District Special Purpose Service Entity.
Central Coast Local Health DistrictNotes to and forming part of the Financial Statements
for the year ended 30 June 2018

PARENT CONSOLIDATION
2018 2017 2018 2017$000 $000 $000 $000
Central Coast Local Health DistrictNotes to and forming part of the Financial Statements
for the year ended 30 June 2018
4. Other Expenses
160 143 Advertising 160 143 194 192 Auditor's Remuneration - Audit of Financial Statements 194 192
5,125 5,295 Blood and Blood Products 5,125 5,295 173 176 Consultancies 173 176
51 325 Contractors 51 325 8,932 8,688 Domestic Supplies and Services 8,932 8,688
35,868 58,643 Drug Supplies 35,868 58,643 15,199 15,122 Food Supplies 15,199 15,122
5,300 4,531 Fuel, Light and Power 5,300 4,531 7,330 5,221 Patient Transport Costs 7,330 5,221
11,446 10,201 Information Management Expenses 11,446 10,201 584 639 Insurance 584 639
19,269 13,815 Maintenance (See 4(b) below) 19,269 13,815 29,264 28,569 Medical and Surgical Supplies 29,264 28,569
1,214 1,243 Motor Vehicle Expenses 1,214 1,243 1,557 1,525 Postal and Telephone Costs 1,557 1,525 1,758 1,609 Printing and Stationery 1,758 1,609
771 1,087 Rates and Charges 771 1,087 1,748 1,877 Rental 1,748 1,877
8,822 7,217 Hosted Services Purchased from entities controlled by the immediate parent 8,822 7,217
27,367 27,019 Specialised Services (Dental, Radiology, Pathology, Allied Health, Dialysis, Psychology, Respite & Cancer) 27,367 27,019
1,928 2,147 Staff Related Costs 1,928 2,147 2,407 2,071 Travel Related Costs 2,407 2,071
13,139 14,751 Other (See 4(a) below) 13,139 14,751
199,606 212,106 199,606 212,106

PARENT CONSOLIDATION
2018 2017 2018 2017$000 $000 $000 $000
4. Other Expenses
a) Other Includes:341 217 Contract for Patient Services 341 217
5,535 5,917 Corporate Support Services 5,535 5,917 354 339 Courier and Freight 354 339 166 77 Isolated Patient Travel and Accommodation Assistance Scheme 166 77
24 219 Legal Services 24 219 678 625 Membership/Professional Fees 678 625
1,035 1,155 Motor Vehicle Operating Lease Expense - Minimum Lease Payments 1,035 1,155 41 1 Other Operating Lease Expense - Minimum Lease Payments 41 1 21 2 Quality Assurance/Accreditation 21 2
998 813 Security Services 998 813
3,946 5,386 Other Miscellaneous 3,946 5,386
13,139 14,751 13,139 14,751
b) Reconciliation of Total Maintenance5,471 4,725 Maintenance Contracts 5,471 4,725 9,224 4,498 New/Replacement Equipment under $10,000 9,224 4,498 4,549 4,592 Repairs Maintenance/Non Contract 4,549 4,592
25 ----- Other 25 -----
19,269 13,815 19,269 13,815
2,307 1,826 2,307 1,826
21,576 15,641 21,576 15,641
Maintenance Expense - Contracted Labour and Other (Non-Employee Related in Note 4)
Employee Related/Personnel Services Maintenance Expense included in Notes 2 and 3
Central Coast Local Health DistrictNotes to and forming part of the Financial Statements
for the year ended 30 June 2018
The majority of 'Food Supplies', were paid to Health Administration Corporation, an entity controlled by the immediate parent.
'Auditor's Remuneration' was paid to The Audit Office of New South Wales, an entity controlled by the ultimateparent.
'Patient Transport Costs' were paid to Health Administration Corporation, which is an entity controlled by the immediate parent.
The majority of 'Information Management Expenses' were paid to Health Administration Corporation, an entity controlled by the immediate parent.
The majority of 'Specialised Services' expenses were paid to the Health Administration Corporation, an entity controlled by the immediate parent.
Some 'Domestic Supplies and Services', 'Corporate Support Services' and Consultancies expenses were paid to entities controlled by the immediate parent.

PARENT CONSOLIDATION
2018 2017 2018 2017$000 $000 $000 $000
5. Depreciation and Amortisation
17,246 15,902 Depreciation - Buildings 17,246 15,902 5,282 4,887 Depreciation - Plant and Equipment 5,282 4,887 1,512 1,471 Depreciation - Infrastructure Systems 1,512 1,471
352 90 Amortisation - Leasehold Improvements 352 90
24,392 22,350 24,392 22,350
6. Grants and Subsidies
2,958 2,722 Non-Government Organisations 2,958 2,722 127 134 Grants to Research Organisations 127 134 246 218 Grants paid to entities controlled by the immediate parent 246 218
4,633 4,172 Other Grants 4,633 4,172
7,964 7,246 7,964 7,246
Central Coast Local Health DistrictNotes to and forming part of the Financial Statements
for the year ended 30 June 2018
PARENT CONSOLIDATION
2018 2017 2018 2017$000 $000 $000 $000
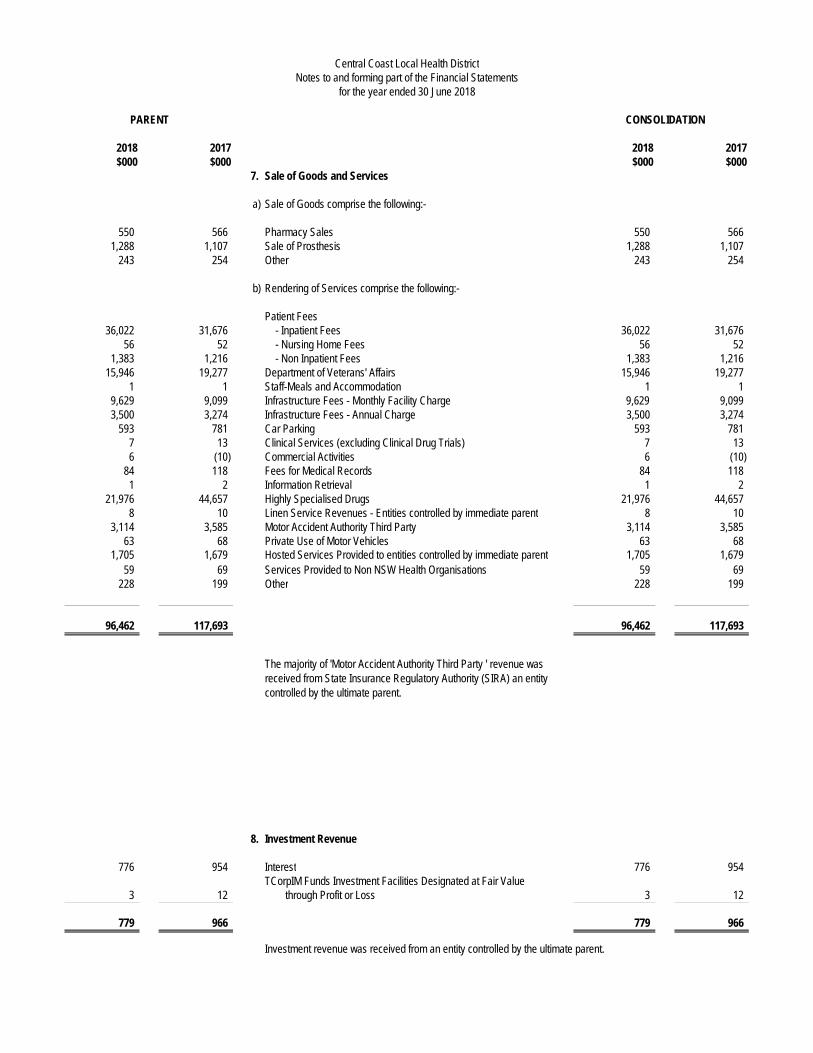
7. Sale of Goods and Services
a) Sale of Goods comprise the following:-
550 566 Pharmacy Sales 550 566 1,288 1,107 Sale of Prosthesis 1,288 1,107
243 254 Other 243 254
b) Rendering of Services comprise the following:-
Patient Fees36,022 31,676 - Inpatient Fees 36,022 31,676
56 52 - Nursing Home Fees 56 52 1,383 1,216 - Non Inpatient Fees 1,383 1,216
15,946 19,277 Department of Veterans' Affairs 15,946 19,277 1 1 Staff-Meals and Accommodation 1 1
9,629 9,099 Infrastructure Fees - Monthly Facility Charge 9,629 9,099 3,500 3,274 Infrastructure Fees - Annual Charge 3,500 3,274
593 781 Car Parking 593 781 7 13 Clinical Services (excluding Clinical Drug Trials) 7 13 6 (10) Commercial Activities 6 (10)
84 118 Fees for Medical Records 84 118 1 2 Information Retrieval 1 2
21,976 44,657 Highly Specialised Drugs 21,976 44,657 8 10 Linen Service Revenues - Entities controlled by immediate parent 8 10
3,114 3,585 Motor Accident Authority Third Party 3,114 3,585 63 68 Private Use of Motor Vehicles 63 68
1,705 1,679 Hosted Services Provided to entities controlled by immediate parent 1,705 1,679 59 69 Services Provided to Non NSW Health Organisations 59 69
228 199 Other 228 199
96,462 117,693 96,462 117,693
8. Investment Revenue
776 954 Interest 776 954 TCorpIM Funds Investment Facilities Designated at Fair Value
3 12 through Profit or Loss 3 12
779 966 779 966
Investment revenue was received from an entity controlled by the ultimate parent.
Central Coast Local Health DistrictNotes to and forming part of the Financial Statements
for the year ended 30 June 2018
The majority of 'Motor Accident Authority Third Party ' revenue was received from State Insurance Regulatory Authority (SIRA) an entity controlled by the ultimate parent.

PARENT CONSOLIDATION
2018 2017 2018 2017$000 $000 $000 $000
9. Grants and Other Contributions
986 925 Clinical Drug Trials 986 925 6,060 5,717 Commonwealth Government Grants 6,060 5,717 1,480 1,601 Industry Contributions/Donations 1,480 1,601 1,218 1,746 Cancer Institute Grants 1,218 1,746
502 892 Grants & Contributions received from entities controlled by the ultimate parent 502 892
387 258 Grants & Contributions received from entities controlled by the immediate parent 387 258
----- 3 Research Grants ----- 3 2,650 2,719 Other Grants 2,650 2,719
13,283 13,861 13,283 13,861
The Cancer Institute is an entity controlled by the immediate parent.
10. Acceptance by the Crown Entity of Employee Benefits
----- ----- Superannuation-defined benefit 3,335 3,506 ----- ----- Long Service Leave 18,157 9,522
----- ----- 21,492 13,028
11. Other Income
Other Income comprises the following:-
285 157 Commissions 285 157 332 293 Conference and Training Fees 332 293 ----- 104 Discounts received ----- 104 56 ----- Insurance Refunds 56 -----
1,024 1,076 Lease and Rental* 1,024 1,076 ----- 3,838 Property not Previously Recognised ----- 3,838 11 2 Sale of Merchandise, Old Wares and Books 11 2
1 6 Sponsorship 1 6 29 6,250 Treasury Managed Fund Hindsight Adjustment 29 6,250
6 4 Unclaimed Deposits 6 4 1,323 768 Other 1,323 768
3,067 12,498 3,067 12,498
*Some 'Lease and Rental' and 'Other' revenue was received from entities controlled by the immediate parent.
'Property not Previously Recognised' for 2016/17 contains $3.8M of land and infrastructure acquired for the Gosford Hospital redevelopment at no cost.
The majority of grants that were received from entities controlled by the immediate parent were received from eHealth.
Central Coast Local Health DistrictNotes to and forming part of the Financial Statements
for the year ended 30 June 2018
The following liabilities and expenses have been assumed by the Crown Entity:

PARENT CONSOLIDATION
2018 2017 2018 2017$000 $000 $000 $000
Central Coast Local Health DistrictNotes to and forming part of the Financial Statements
for the year ended 30 June 2018
12. Gain / (Loss) on Disposal
2,136 16,987 Property, Plant and Equipment 2,136 16,987 (1,993) (15,759) Accumulated Depreciation (1,993) (15,759)
143 1,228 Written Down Value 143 1,228 117 143 Proceeds from Disposal 117 143
Gain/(Loss) on Disposal of(26) (1,085) Property, Plant and Equipment (26) (1,085)
(26) (1,085) Total Gain/(Loss) on Disposal (26) (1,085)
13. Other Gains / (Losses)
(224) (248) Impairment of Receivables (224) (248)
(224) (248) (224) (248)

PARENT
2018 2017 2018 2017$000 $000 $000 $000
14. Cash and Cash Equivalents
22,622 24,655 Cash at Bank and On Hand 22,622 24,655
22,622 24,655 22,622 24,655
For the purposes of the Statement of Cash Flows, cash and cash equivalents include cash at bank, cash on hand, short-term deposits with a maturity of three months or less, which are subject to an insignificant risk of changes in value, and net of outstanding bank overdraft.
Cash & cash equivalent assets recognised in the Statement of Financial Position are reconciled at the end of the financial year to the Statement of Cash Flows as follows:
22,622 24,655 Cash and Cash Equivalents (per Statement of Financial Position) 22,622 24,655
22,622 24,655 Closing Cash and Cash Equivalents (per Statement of Cash Flows) 22,622 24,655
Refer to Note 31 for details regarding credit risk, liquidity risk and market risk arising from financial instruments.
CONSOLIDATION
Central Coast Local Health DistrictNotes to and forming part of the Financial Statements
for the year ended 30 June 2018

PARENT CONSOLIDATION
2018 2017 2018 2017$000 $000 $000 $000
15. Receivables
Current5,477 4,811 Sale of Goods and Services 5,477 4,811 4,905 3,181 Intra Health Receivables 4,905 3,181 3,461 3,504 Goods and Services Tax 3,461 3,504 1,653 1,803 Other Debtors 1,653 1,803
15,496 13,299 Sub Total 15,496 13,299
(258) (198) Less Allowance for Impairment (258) (198)
15,238 13,101 Sub Total 15,238 13,101 1,475 1,212 Prepayments 1,475 1,212
16,713 14,313 16,713 14,313
a) Movement in the Allowance for Impairment Sale of Goods and Services
(46) (42) Balance at Commencement of Reporting Period (46) (42) 151 120 Amounts written off during the year 151 120
(Increase)/decrease in Allowance Recognised in(234) (125) the Net Result (234) (125) (130) (47) Balance at 30 June 2018 (130) (47)
b) Movement in the Allowance for Impairment Other Debtors
(152) (29) Balance at Commencement of Reporting Period (152) (29) 14 1 Amounts written off during the year 14 1
(Increase)/decrease in Allowance Recognised in10 (123) the Net Result 10 (123)
(128) (151) Balance at 30 June 2018 (128) (151)
(258) (198) (258) (198)
c) The current sale of goods and services balances above include the following patient fee receivables:
Current include:205 158 Patient Fees - Compensable 205 158 253 102 Patient Fees - Ineligible 253 102
3,998 3,925 Patient Fees - Inpatient & Other 3,998 3,925
4,456 4,185 4,456 4,185
'Intra Health Receivables' include amounts receivable from entities controlled by the immediate parent. The majority of the balance at reporting date was receivable from Northern Sydney Local Health District and Health Infrastructure.
Central Coast Local Health DistrictNotes to and forming part of the Financial Statements
for the year ended 30 June 2018
Details regarding credit risk, liquidity risk and market risk, including financial assets that are either past due or impaired are disclosed in Note 31.

PARENT CONSOLIDATION
2018 2017 2018 2017$000 $000 $000 $000
16. Inventories
2,290 2,847 Drugs 2,290 2,847 2,061 2,038 Medical and Surgical Supplies 2,061 2,038
----- 114 Other Including Goods in Transit ----- 114
4,351 4,999 4,351 4,999
17. Financial Assets at Fair Value
Current7,865 7,409 TCorpIM Funds Investment Facilities 7,865 7,409
7,865 7,409 7,865 7,409
Refer to Note 31 for details regarding credit risk, liquidity risk and market risk arising from financial instruments.
Central Coast Local Health DistrictNotes to and forming part of the Financial Statements
for the year ended 30 June 2018

PARENT CONSOLIDATION
2018 2017 2018 2017$000 $000 $000 $000
18. Property, Plant and Equipment
Land and Buildings - Fair Value1,019,303 893,902 Gross Carrying Amount 1,019,303 893,902
285,638 268,392 Less: Accumulated Depreciation and Impairment 285,638 268,392
733,665 625,510 Net Carrying Amount 733,665 625,510
Plant and Equipment - Fair Value*77,614 64,042 Gross Carrying Amount 77,614 64,042 41,811 38,522 Less: Accumulated Depreciation and Impairment 41,811 38,522
35,803 25,520 Net Carrying Amount 35,803 25,520
Infrastructure Systems - Fair Value60,353 60,352 Gross Carrying Amount 60,353 60,352 45,083 43,570 Less: Accumulated Depreciation and Impairment 45,083 43,570
15,270 16,782 Net Carrying Amount 15,270 16,782
Leasehold Improvements - Fair Value*4,272 4,251 Gross Carrying Amount 4,272 4,251 3,008 2,656 Less: Accumulated Depreciation and Impairment 3,008 2,656
1,264 1,595 Net Carrying Amount 1,264 1,595
Total Property, Plant and Equipment786,002 669,407 At Net Carrying Amount 786,002 669,407
* For non-specialised assets with short useful lives, recognition at depreciated historical cost is regarded as an acceptable approximation of fair value, in accordance with Treasury Policy Paper 14-01.
Central Coast Local Health DistrictNotes to and forming part of the Financial Statements
for the year ended 30 June 2018

Central Coast Local Health DistrictNotes to and forming part of the Financial Statements
for the year ended 30 June 2018PARENT & CONSOLIDATION
18. Property, Plant and Equipment - Reconciliation
Land and Plant and Infrastructure Leasehold TotalBuildings Equipment Systems Improvements
$000 $000 $000 $000 $000
2018Net carrying amount at start of year 625,510 25,520 16,782 1,595 669,407 Additions 127,235 13,868 6 21 141,130 Disposals ----- (143) ----- ----- (143) Depreciation Expense (17,246) (5,282) (1,512) (352) (24,392) Reclassifications (1,834) 1,840 (6) ----- ----- Net carrying amount at end of year 733,665 35,803 15,270 1,264 786,002
Land and Plant and Infrastructure Leasehold TotalBuildings Equipment Systems Improvements
$000 $000 $000 $000 $000
2017Net carrying amount at start of year 509,344 26,441 17,326 116 553,227 Additions 125,472 5,063 80 ----- 130,615 Disposals (881) (347) ----- ----- (1,228)
8,296 ----- 847 ----- 9,143 Depreciation Expense (15,902) (4,887) (1,471) (90) (22,350) Reclassifications (819) (750) ----- 1,569 ----- Net carrying amount at end of year 625,510 25,520 16,782 1,595 669,407
Net Revaluation Increment Less Revaluation Decrements
(i) Land and Buildings include land owned by the Health Administration Corporation but controlled by the District see note 1(k).
(ii) Indices provided by Liquid Pacific Holdings Pty Ltd were not applied as they were deemed immaterial.
Further details regarding the fair value measurement of property, plant and equipment are disclosed in Note 19.
A reconciliation of the carrying amount for each class of property, plant and equipment is set out below:

PARENT & CONSOLIDATION
19. Fair Value Measurement of Non-Financial Assets
a) Fair Value Hierarchy
2018 Level 1 Level 2 Level 3 Total$000 $000 $000 $000
Property, Plant and Equipment (Note 18)
- Land and Buildings ----- 56,648 401,846 458,494
- Infrastructure Systems ----- ----- 15,270 15,270
----- 56,648 417,116 473,764
There were no transfers between level 1 and 2 during the year ended 30 June 2018.
Work in Progress and Newly Completed Projects are carried at cost, therefore excluded from figures above and as a result will not agree to Note 18.
2017 Level 1 Level 2 Level 3 Total$000 $000 $000 $000
Property, Plant and Equipment (Note 18)
- Land and Buildings ----- 56,574 416,846 473,420
- Infrastructure Systems ----- ----- 16,782 16,782
----- 56,574 433,628 490,202
There were no transfers between level 1 and 2 during the year ended 30 June 2017.
Work in Progress and Newly Completed Projects are carried at cost, therefore excluded from figures above and as a result will not agree to Note 18.
b) Valuation Techniques, Inputs and Processes
For land, buildings and infrastructure systems the District obtains external valuations by independent valuers at least every three years. The lastrevaluation was performed by Liquid Pacific Holdings Pty Ltd for the 2016/17 financial year. Liquid Pacific Holdings Pty Ltd is an independent entityand is not an associated entity of the District.
At the end of each reporting period a fair value assessment is made on any movements since the last revaluation, and a determination as to whetherany adjustments need to be made. These adjustments are made by way of application of indices, refer note 18 reconcilation.
Central Coast Local Health DistrictNotes to and forming part of the Financial Statements
for the year ended 30 June 2018
Fair value measurements recognised in the Statement of Financial Position are categorised into the following levels.
For buildings and infrastructure, many assets are of a specialised nature or use, and thus the most appropriate valuation method is depreciatedreplacement cost. These assets are included as level 3 as these assets have a high level of unobservable inputs. However, residential properties arevalued on a market approach and included in level 2.
For land, the valuation by the valuers is made on a market approach, comparing similar assets (not identical) and observable inputs. The mostsignificant input is price per square metre.
All commercial and non-restricted land is included in Level 2 as these land valuations have a high level of observable inputs although these lands arenot identical.
All of the restricted land has been classified as level 3 as, although observable inputs have been used, a significant level of professional judgement isrequired to adjust inputs in determining the land valuations. Certain parcels of land have zoning restrictions, for example hospital grounds, and valuesare adjusted accordingly.
The non-current assets categorised in a) above have been measured as either level 2 or level 3 based on the following valuation techniques andinputs:

PARENT & CONSOLIDATION
19. Fair Value Measurement of Non-Financial Assets
c) Reconciliation of Recurring Level 3 Fair Value Measurements
2018
$000 $000 $000
Fair value as at 1 July 2017 416,846 16,782 433,628
Additions 369 ----- 369
Depreciation (15,369) (1,512) (16,881)
Fair value as at 30 June 2018 401,846 15,270 417,116
2017 Land and Infrastructure Total Level 3Buildings Systems Recurring
$000 $000 $000
Fair value as at 1 July 2016 421,130 17,326 438,456
Additions 9,589 80 9,669
Revaluation increments/ decrements recognised in other comprehensive income – included in line item 'Changes in revaluation surplus of property, plant and equipment’ 1,672 847 2,519
Depreciation (15,545) (1,471) (17,016)
Fair value as at 30 June 2017 416,846 16,782 433,628
Central Coast Local Health DistrictNotes to and forming part of the Financial Statements
for the year ended 30 June 2018
Land and Buildings
Infrastructure Systems
Total Level 3 Recurring
There were no transfers between Level 2 and 3 during the year ended 30 June 2017.
There were no transfers between Level 2 and 3 during the year ended 30 June 2018.

20. Restricted Assets
Opening Equity Expense Revenue Closing Equity1 July 2017 2018 2018 30 June 2018
$000 $000 $000 $000Category
Community Welfare 105 262 426 269
Facility Improvements 5,891 1,488 1,293 5,696
Patient Welfare 2,797 2,461 2,129 2,465
Private Practice Disbursements (No.2 Accounts) 12,581 2,095 4,285 14,771
Public Contributions 549 6 43 586
Research 589 6 68 651
Staff Welfare 8 7 12 13
Training and Education incl. Conferences 4,562 673 915 4,804
27,082 6,998 9,171 29,255
Restricted assets are held for the following purpose and cannot be used for any other purpose.
Category Purpose
Community Welfare
Facility Improvements
Patient Welfare
Private Practice Disbursements (No.2 Accounts)
Public Contributions
Research
Staff Welfare
Training and Education incl. Conferences
Improvements such as medical needs, financial needs and standards forpatients’ privacy and dignity.
Staff specialists’ private practice arrangements to improve the level ofclinical services provided.
Restricted Financial Asset categories have been expanded in the 2017/18 financial year to provide more clarity to the users of the financial statements. As a result, comparative figures have been adjusted to conform to the current year's presentation.
Staff benefits such as staff recognition awards, functions and staffamenities improvements.
Research to gain knowledge, understanding and insight.
Professional training, education and conferences.
Donations or legacies received without any donor-specified conditions as toits use.
Improvements to service access, health literacy, public and preventativehealth care.
Repairs, maintenance, renovations and/or new equipment or buildingrelated expenditure.
PARENT & CONSOLIDATION
The District's financial statements include the following assets which are restricted for stipulated purposes and/or by externally imposed conditions,eg. donor requirements. The assets are only available for application in accordance with the terms of the donor restrictions.
Central Coast Local Health DistrictNotes to and forming part of the Financial Statements
for the year ended 30 June 2018

PARENT CONSOLIDATION
2018 2017 2018 2017$000 $000 $000 $000
21. Payables
Current----- ----- Accrued Salaries, Wages and On-Costs 12,611 10,794 ----- ----- Taxation and Payroll Deductions 1,601 3,287
14,212 14,081 Accrued Liability - Purchase of Personnel Services ----- ----- 12,740 12,334 Creditors 12,740 12,334
Other Creditors 9,079 7,048 - Payables to entities controlled by the immediate parent 9,079 7,048 5,036 6,535 - Other 5,036 6,535
41,067 39,998 41,067 39,998
Central Coast Local Health DistrictNotes to and forming part of the Financial Statements
for the year ended 30 June 2018
Details regarding credit risk, liquidity risk and market risk, including a maturity analysis of the above payables are disclosed in Note 31.
The majority of 'Payables to entities controlled by the immediate parent' relate to balances payable to the Health Administration Corporation and Northern Sydney Local Health District entities controlled by the immediate parent.

PARENT CONSOLIDATION
2018 2017 2018 2017$000 $000 $000 $000
22. Provisions
Current----- ----- Annual Leave - Short Term Benefit 53,954 51,748 ----- ----- Annual Leave - Long Term Benefit 16,947 12,447 ----- ----- Long Service Leave Consequential On-Costs 10,847 9,069 ----- ----- Provision for Other Employee Benefits* 1,484 820
83,232 74,084 Provision for Personnel Services Liability ----- -----
83,232 74,084 83,232 74,084
*ADO liabilities have been reclassified from 'Allocated Day Off Liability' to 'Provision for Other Employee Benefits'.
Non-Current----- ----- Long Service Leave Consequential On-Costs 943 789 943 789 Provision for Personnel Services Liability ----- -----
943 789 943 789
Aggregate Employee Benefits and Related On-Costs----- ----- Provisions - Current 83,232 74,084 ----- ----- Provisions - Non-Current 943 789 ----- ----- Accrued Salaries, Wages and On-Costs (Note 21) 14,212 14,081
98,387 88,954 Liability - Purchase of Personnel Services ----- -----
98,387 88,954 98,387 88,954
23. Other Liabilities
Current1,304 1,096 Income in Advance 1,304 1,096
1,304 1,096 1,304 1,096
Central Coast Local Health DistrictNotes to and forming part of the Financial Statements
for the year ended 30 June 2018

PARENT CONSOLIDATION
2018 2017 2018 2017$000 $000 $000 $000
24. Commitments for Expenditure
a) Capital Commitments
53,694 99,309 Within one year 53,694 99,309 4,962 50,489 Later than one year and not later than five years 4,962 50,489
----- 161 Later than five years ----- 161
58,656 149,959 Total Capital Expenditure Commitments (Including GST) 58,656 149,959
b) Operating Lease Commitments
1,839 2,286 Within one year 1,839 2,286 2,984 1,183 Later than one year and not later than five years 2,984 1,183 1,058 646 Later than five years 1,058 646
5,881 4,115 Total Operating Lease Commitments (Including GST) 5,881 4,115
c) Contingent Asset Related to Commitments for Expenditure
Aggregate capital expenditure for the acquisition of land and buildings, plant and equipment, infrastructure systems, and intangible assets, contracted for at balance date and not provided for:
The total 'Capital Expenditure Commitments' and 'OperatingLease Commitments' of $64.45M million as at 30 June 2018includes input tax credits of $5.87M that are expected to berecoverable from the Australian Taxation Office (2017$14.00M).
Future non-cancellable operating lease rentals not provided for and payable:
The operating lease commitments above are for property, motor vehicles and medical equipment.
The majority of 'capital commitments' contracted but not provided for related to capital works overseen by the Health Administration Corporation, an entity controlled by the immediate parent.
Central Coast Local Health DistrictNotes to and forming part of the Financial Statements
for the year ended 30 June 2018

PARENT & CONSOLIDATION
25. Trust Funds
2018 2017 2018 2017 2018 2017$000 $000 $000 $000 $000 $000
436 351 70 47 506 398
Revenue 24,314 23,410 27 23 24,341 23,433
Expenses (24,403) (23,325) (2) ----- (24,405) (23,325)
347 436 95 70 442 506
The following list provides a brief description of the purpose of the trust fund categories.
Category
Private Practice Trusts
Third Party Funds
Central Coast Local Health DistrictNotes to and forming part of the Financial Statements
for the year ended 30 June 2018
The District holds trust funds of $442 thousand which are held for the safe keeping of patients' monies, deposits on hired items of equipment and Private Practice Trusts.
These funds are excluded from the financial statements as the District cannot use them for the achievement of its objectives. The following is a summary of the transactions in the trust account.
Private Practice TotalTrust Funds
The revenue derived from private patient and other billable services provided by Staff Specialists.
A sum of money held in trust on behalf of external parties, e.g. external foundations, volunteer groups and auxiliaries.
Balance at the end of the financial year
Third Party
Balance at the beginning of the financial year
Trust Fund categories have been expanded in the 2017/18 financial year to provide more clarity to the users of the financial statements. As a result, comparative figures have been adjusted to conform to the current year's presentation.
Funds
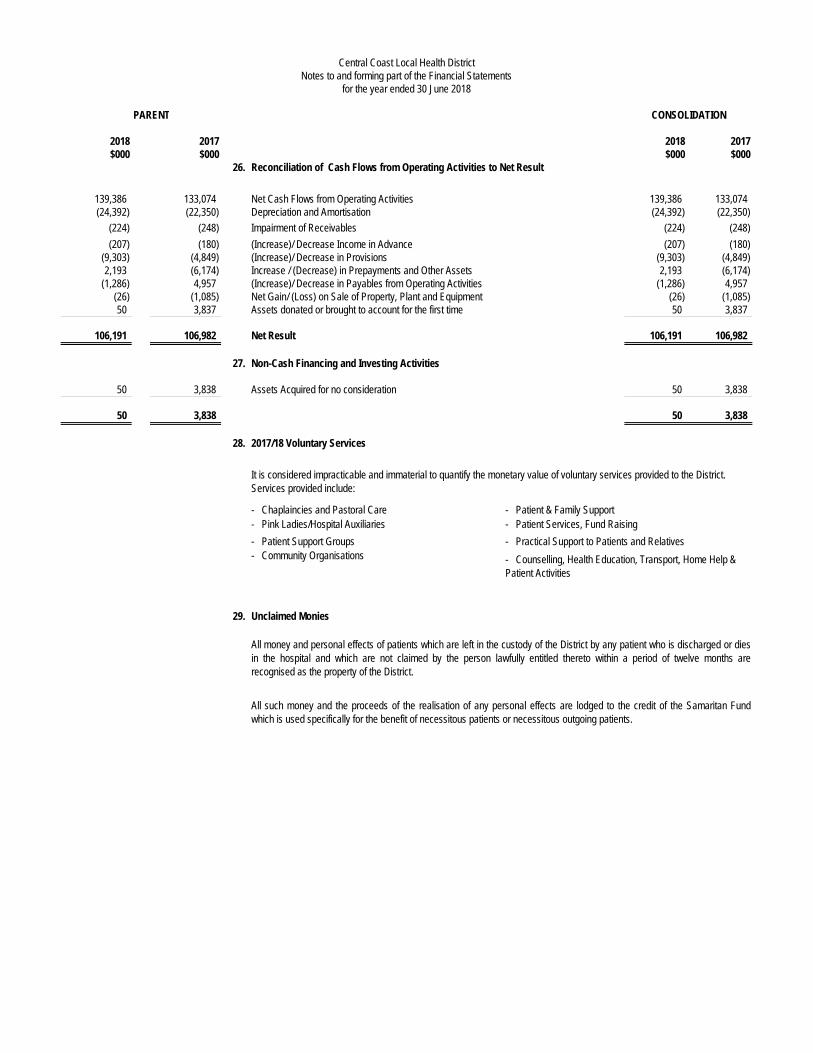
PARENT
2018 2017 2018 2017$000 $000 $000 $000
26. Reconciliation of Cash Flows from Operating Activities to Net Result
139,386 133,074 Net Cash Flows from Operating Activities 139,386 133,074 (24,392) (22,350) Depreciation and Amortisation (24,392) (22,350)
(224) (248) Impairment of Receivables (224) (248)
(207) (180) (Increase)/ Decrease Income in Advance (207) (180) (9,303) (4,849) (Increase)/ Decrease in Provisions (9,303) (4,849) 2,193 (6,174) Increase / (Decrease) in Prepayments and Other Assets 2,193 (6,174)
(1,286) 4,957 (Increase)/ Decrease in Payables from Operating Activities (1,286) 4,957 (26) (1,085) Net Gain/ (Loss) on Sale of Property, Plant and Equipment (26) (1,085) 50 3,837 Assets donated or brought to account for the first time 50 3,837
106,191 106,982 Net Result 106,191 106,982
27. Non-Cash Financing and Investing Activities
50 3,838 Assets Acquired for no consideration 50 3,838
50 3,838 50 3,838
28. 2017/18 Voluntary Services
- Chaplaincies and Pastoral Care- Pink Ladies/Hospital Auxiliaries
- Patient Support Groups- Community Organisations
29. Unclaimed Monies
All such money and the proceeds of the realisation of any personal effects are lodged to the credit of the Samaritan Fundwhich is used specifically for the benefit of necessitous patients or necessitous outgoing patients.
Central Coast Local Health DistrictNotes to and forming part of the Financial Statements
for the year ended 30 June 2018
It is considered impracticable and immaterial to quantify the monetary value of voluntary services provided to the District. Services provided include:
- Patient Services, Fund Raising
- Practical Support to Patients and Relatives
- Patient & Family Support
- Counselling, Health Education, Transport, Home Help & Patient Activities
All money and personal effects of patients which are left in the custody of the District by any patient who is discharged or diesin the hospital and which are not claimed by the person lawfully entitled thereto within a period of twelve months arerecognised as the property of the District.
CONSOLIDATION

PARENT AND CONSOLIDATION
30. Adjusted Budget Review - Parent and Consolidated
Net Result
Assets and Liabilities
Cash Flows
$000
653,739Keep Them Safe (KTS) project funding 2,841
3,3251,0301,962
Other Allocations 5,742
Balance as per Statement of Comprehensive Income 668,639
Winter 2017 Activity fundingCritical Fire Safety Works funding
Central Coast Local Health DistrictNotes to and forming part of the Financial Statements
for the year ended 30 June 2018
Net cash and cash equivalents decrease was higher than budget by $0.7M. This was primarily driven by the increase in Salaries & Wages payables at 30 June 2018 due to the timing of the payroll run compared to the 30 June 2017. This was partially offset by the increase in payments against budget for the acquisition of Property, Plant & Equipment for the new Gosford Inpatient facility.
Movements in the level of the NSW Ministry of Health Recurrent Allocation that have occurred since the time of the initial allocation on 20 June 2017 are as follows:
The actual Net Result was lower than adjusted budget by $368 thousand, primarily due to:
Net Assets were $1.4M lower than budget due to a more than budgeted increase in Staff Provision liabilities of $4.1M, primarilty in Annual Leave liability, this was partially offset by a greater than budgeted movement in Property, Plant & Equipment assets of $2M being driven by acquisition in equipment for the new Gosford Inpatient facility.
the impact of heavy activity demands driving increased costs as well as additional costs incurred from the commissioning of the new Gosford Inpatient facility in April 2018. This was in turn offset by the favourable result in the Restricted Assets.
Integrated Care Initiative funding
Initial Allocation, 20 June 2017

31. Financial Instruments
(a) Financial Instrument Categories
PARENT AND CONSOLIDATION
Financial Assets Class: Carrying Amount Carrying Amount2018 2017$000 $000
Cash and Cash Equivalents (note 14) 22,622 24,655
Receivables (note 15)* 11,777 9,597
Financial Assets at Fair Value (note 17) 7,865 7,409
42,264 41,661
Financial Liabilities
Payables (note 21)** Financial liabilities measured at amortised cost 39,466 36,711
39,466 36,711 Notes* Excludes statutory receivables and prepayments (i.e. not within scope of AASB7 Financial Instruments Disclosures).
(b) Credit Risk
Cash
Receivables - trade debtors
N/A
Loans and receivables (at amortised cost)
At fair value through profit or loss (designated as such upon initial recognition)
**Excludes statutory payables and unearned revenue (i.e. not within scope of AASB7 Financial Instruments Disclosures).
Credit risk arises when there is the possibility that the counterparty will default on their contractual obligations, resulting in a financial loss to the District.The maximum exposure to credit risk is generally represented by the carrying amount of the financial assets (net of any allowance for impairment).
Credit risk associated with the District's financial assets, other than receivables, is managed through the selection of counterparties and establishment ofminimum credit rating standards. Authority deposits held with NSW TCorp are guaranteed by the State.
The TCorpIM Funds Investment facility is discussed in paragraph (d) below.
All trade debtors are recognised as amounts receivable at balance date. Collectability of trade debtors is reviewed on an ongoing basis. Procedures asestablished in the NSW Ministry of Health Accounting Manual for Public Health Organisations and Fee Procedures Manual are followed to recoveroutstanding amounts, including letters of demand. Debts which are known to be uncollectable are written off. An allowance for impairment is raised whenthere is objective evidence that the District will not be able to collect all amounts due. This evidence includes past experience and current and expectedchanges in economic conditions and debtor credit ratings. No interest is earned on trade debtors.
Credit risk arises from financial assets of the District, including cash, receivables and authority deposits. No collateral is held by the District. The Districthas not granted any financial guarantees.
Cash comprises cash on hand and bank balances deposited within the NSW Treasury banking system. Interest is earned on daily bank balances at rates of approximately 2.35% in 2017/18 compared to 2.37% in the previous year.
Category
Central Coast Local Health DistrictNotes to and forming part of the Financial Statements
for the year ended 30 June 2018
The District's principal financial instruments are outlined below. These financial instruments arise directly from the District's operations or are required tofinance its operations. The District does not enter into or trade financial instruments, including derivative financial instruments, for speculative purposes.
The District's main risks arising from financial instruments are outlined below, together with the District's objectives, policies and processes for measuringand managing risk. Further quantitative and qualitative disclosures are included throughout these financial statements.
The Chief Executive has overall responsibility for the establishment and oversight of risk management and reviews and agrees policies for managing eachof these risks. Risk management policies are established to identify and analyse the risks faced by the District, to set risk limits and controls and to monitorrisks. Compliance with policies is reviewed on a continuous basis.

31. Financial Instruments
Central Coast Local Health DistrictNotes to and forming part of the Financial Statements
for the year ended 30 June 2018
2018 2017$000 $000
Neither past due nor impaired 11,243 8,949
Past due but not impaired1,2
< 3 months overdue 414 602
3 - 6 months overdue 120 46
Impaired1,2
> 6 months overdue 258 198 Total 1,2
12,035 9,795
Notes1 Each column in the table reports "gross receivables".
Authority Deposits
(c) Liquidity Risk
In addition Patient Fees Compensables are frequently not settled within 6 months of the date of the service provision due to the length of time it takes tosettle legal claims. Most of the District's debtors are health insurance companies or compensation insurers settling claims in respect of inpatienttreatments.
The District is not materially exposed to concentrations of credit risk to a single trade debtor or group of debtors. Based on past experience, debtors thatare not past due are not considered impaired.
For other suppliers, where settlement cannot be effected in accordance with the above, e.g. due to short term liquidity constraints, contact is made withcreditors and terms of payment are negotiated to the satisfaction of both parties.
The District has exposure to liquidity risk. However, the risk is minimised by the service agreement with the NSW Ministry of Health, as the annual serviceagreement requires local management to control its financial liquidity and in particular meet benchmarks for the payment of creditors. Where the Districtfails to meet service agreement performance standards, the Ministry as the state manager can take action in accordance with annual performanceframework requirements, including providing financial support and increased management interaction (refer Note 1).
The liabilities are recognised for amounts due to be paid in the future for goods or services received, whether or not invoiced. Amounts owing to suppliers(which are unsecured) are settled in accordance with the policy set by the NSW Ministry of Health in accordance with NSW Treasury Circular 11/12. Forsmall business suppliers, where terms are not specified, payment is made not later than 30 days from date of receipt of a correctly rendered invoice. Forother suppliers, if trade terms are not specified, payment is made no later than the end of the month following the month in which an invoice or astatement is received.
For small business suppliers, where payment is not made within the specified time period, simple interest must be paid automatically unless an existingcontract specifies otherwise.
Financial assets that are past due or impaired could be either 'Sales of Goods and Services' or 'Other Debtors' in the 'Receivables' category of theStatement of Financial Position. Patient Fees Ineligibles represent the majority of financial assets that are past due or impaired.
2 The ageing analysis excludes statutory receivables, as these are not within the scope of AASB 7 Financial Instruments Disclosures. Therefore, the"total" will not reconcile to the receivables total recognised in the statement of financial position.
The District has negotiated no loan outside of arrangements with the NSW Ministry of Health or NSW Treasury.
During the current and prior years, there were no defaults of loans payable. No assets have been pledged as collateral.
The District has placed funds on deposit with TCorpIM Funds Investment facilities, which has been rated 'AAA' by Standard and Poor's. These depositsare similar to money market or bank deposits and can be placed 'at call' or for a fixed term. For fixed term deposits, the interest rate payable by TCorpIMis negotiated initially and is fixed for the term of the deposit, while the interest rate payable on at call deposits can vary. The deposits at balance date wereearning an average interest rate of 0.99% (2017: -0.28%), while over the year the weighted average interest rate was 6.50% (2017: 8.16%) on a weightedaverage balance during the year of $7.63M (2017: $7.14M). None of these assets are past due or impaired.
Liquidity risk is the risk that the District will be unable to meet its payment obligations when they fall due. The District continuously manages risk throughmonitoring future cash flows and maturities planning to ensure adequate holding of high quality liquid assets. The objective is to maintain a balancebetween continuity of funding and flexibility through effective management of cash, investments and liquid assets and liabilities.

31. Financial Instruments
Maturity Analysis and interest rate exposure of financial liabilities
Nominal Amount 1 Non - Interest Bearing < 1 Yr
2018 $000 $000 $000Payables:- Creditors 2 39,466 39,466 39,466
39,466 39,466 39,466 2017Payables:- Creditors 2 36,711 36,711 36,711 36,711 36,711 36,711 Notes:
2 **Excludes statutory payables and unearned revenue (i.e. not within scope of AASB7 Financial InstrumentsDisclosures). Prior year comparatives have been restated to combine Creditors and Accrued Salaries Wages,On-Costs and Payroll Deductions.
1 The amounts disclosed are the contractual undiscounted cash flows of each class of financial liabilities basedon the earliest date on which the District can be required to pay. The tables include both interest and principalcash flows and therefore will not reconcile to the Statement of Financial Position.
Central Coast Local Health DistrictNotes to and forming part of the Financial Statements
for the year ended 30 June 2018
Maturity DatesInterest Rate Exposure
The table below summarises the maturity profile of the District's financial liabilities together with the interest rate exposure.
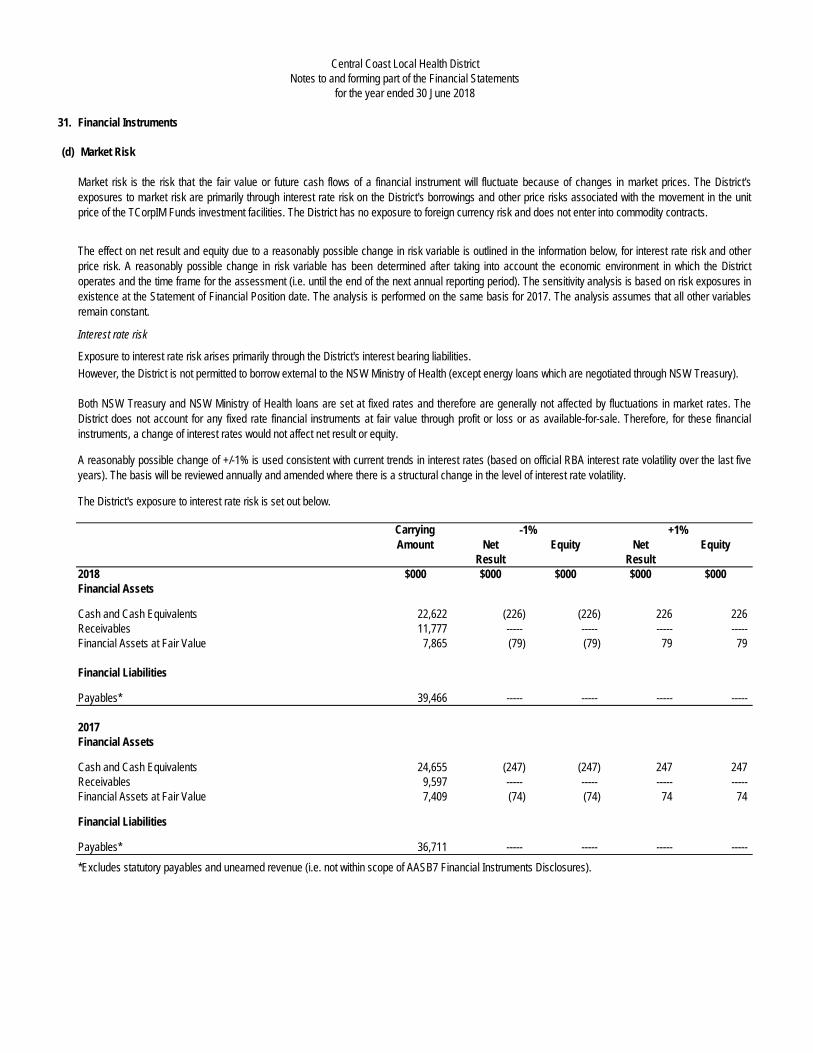
31. Financial Instruments
(d) Market Risk
Interest rate risk
Net Equity Net EquityResult Result
2018 $000 $000 $000 $000 $000Financial Assets
Cash and Cash Equivalents 22,622 (226) (226) 226 226 Receivables 11,777 ----- ----- ----- ----- Financial Assets at Fair Value 7,865 (79) (79) 79 79
Financial Liabilities
Payables* 39,466 ----- ----- ----- -----
2017Financial Assets
Cash and Cash Equivalents 24,655 (247) (247) 247 247 Receivables 9,597 ----- ----- ----- ----- Financial Assets at Fair Value 7,409 (74) (74) 74 74
Financial Liabilities
Payables* 36,711 ----- ----- ----- -----
The effect on net result and equity due to a reasonably possible change in risk variable is outlined in the information below, for interest rate risk and otherprice risk. A reasonably possible change in risk variable has been determined after taking into account the economic environment in which the Districtoperates and the time frame for the assessment (i.e. until the end of the next annual reporting period). The sensitivity analysis is based on risk exposures inexistence at the Statement of Financial Position date. The analysis is performed on the same basis for 2017. The analysis assumes that all other variablesremain constant.
Exposure to interest rate risk arises primarily through the District's interest bearing liabilities.
Both NSW Treasury and NSW Ministry of Health loans are set at fixed rates and therefore are generally not affected by fluctuations in market rates. TheDistrict does not account for any fixed rate financial instruments at fair value through profit or loss or as available-for-sale. Therefore, for these financialinstruments, a change of interest rates would not affect net result or equity.
A reasonably possible change of +/-1% is used consistent with current trends in interest rates (based on official RBA interest rate volatility over the last fiveyears). The basis will be reviewed annually and amended where there is a structural change in the level of interest rate volatility.
+1%-1%
*Excludes statutory payables and unearned revenue (i.e. not within scope of AASB7 Financial Instruments Disclosures).
Market risk is the risk that the fair value or future cash flows of a financial instrument will fluctuate because of changes in market prices. The District'sexposures to market risk are primarily through interest rate risk on the District's borrowings and other price risks associated with the movement in the unitprice of the TCorpIM Funds investment facilities. The District has no exposure to foreign currency risk and does not enter into commodity contracts.
Central Coast Local Health DistrictNotes to and forming part of the Financial Statements
for the year ended 30 June 2018
However, the District is not permitted to borrow external to the NSW Ministry of Health (except energy loans which are negotiated through NSW Treasury).
The District's exposure to interest rate risk is set out below.
Carrying Amount

Central Coast Local Health DistrictNotes to and forming part of the Financial Statements
for the year ended 30 June 2018
Other price risk - TCorpIM Funds investment facilities
Facility 2018 2017$000 $000
4,814 4,604
3,051 2,805
Change in unit price 2018 2017$000 $000
+/- 6% 289 322
+/- 15% 458 449
(e) Fair Value Measurement
(i) Fair value compared to carrying amount
7 years and over
The unit price of each facility is equal to the total fair value of net assets held by the facility divided by the total number of units on issue for that facility. Unitprices are calculated and published daily.
A reasonably possible change is based on the percentage change in unit price (as advised by TCorpIM Funds) multiplied by the redemption value as at 30June each year for each facility (balance from TCorpIM Funds Investment Statement).
Investment in the TCorpIM Funds investment facilities limits the District's exposure to risk, as it allows diversification across a pool of funds with differentinvestment horizons and a mix of investments.
TCorpIM - Medium-term growth fund
TCorpIM - Long-term growth fund
Financial instruments are generally recognised at cost, with the exception of the TCorpIM Funds investment facilities, which are measured at fair value.
The amortised cost of financial instruments recognised in the Statement of Financial Position approximates the fair value, because of the short term nature of many of the financial instruments.
Therefore the fair value of the financial instruments do not differ from the carrying amount.
TCorpIM, as trustee for each of the above facilities is required to act in the best interest of the unit holders and to administer the trusts in accordance with thetrust deeds. As trustee, TCorpIM has appointed external managers to manage the performance and risk of each facility in accordance with a mandateagreed by the parties. TCorpIM has also leveraged off internal expertise to manage certain fixed income assets for the TCorpIM Funds Investment facilities.A significant portion of the administration of the facilities is outsourced to an external custodian.
TCorpIM Funds investment provides sensitivity analysis information for each of the investment facilities, using historically based volatility informationcollected over a ten year period, quoted at two standard deviations (ie 95% probability). TCorpIM Funds investment facilities are designated at fair valuethrough profit or loss and therefore any change in unit price impacts directly on profit (rather than equity).
Investment Sectors Investment Horizon
3 years to 7 yearsMedium term growth fund
Exposure to 'other price risk' primarily arises through the investment in the TCorpIM Funds investment facilities, which are held for strategic rather thantrading purposes. The District has no direct equity investments. The District holds units in the following TCorpIM Funds:
Long-term growth fund
Cash, money market instruments, Australian and International bonds, listed property and Australian shares
Cash, money market instruments, Australian and International bonds, listed property and Australian shares

Central Coast Local Health DistrictNotes to and forming part of the Financial Statements
for the year ended 30 June 2018
(ii) Fair Value recognised in the Statement of Financial Position
Level 1 Level 2 Level 3 2018 Total$'000 $'000 $'000 $'000
TCorpIM Funds ----- 7,865 ----- 7,865
Level 1 Level 2 Level 3 2017 Total$'000 $'000 $'000 $'000
TCorpIM Funds ----- 7,409 ----- 7,409
As discussed, the value of the TCorpIM Funds investment is based on the District's share of the value of the underlying assets of the facility, based on the market value. All of the TCorpIM Funds investment facilities are valued using 'redemption' pricing.
(The table above only includes financial assets as no financial liabilities were measured at fair value in the Statement of Financial Position.)
There were no transfers between level 1 and 2 during the period ended 30 June 2018.

32. Related Party Transactions
PARENT AND CONSOLIDATION
Key management personnel compensation is as follows:
2018 2017$000 $000
Short-term employee benefits 631 813 Post-employment benefits 55 54 Other long-term benefits ----- ----- Termination benefits ----- -----
686 867
Transactions with key management personnel and their close family membersThere were no transactions with key management personnel and their close family members (2017: $Nil).
Transactions with ultimate parentThere were no transactions with the ultimate parent during the financial year (2017: $Nil).
33. Events After the Reporting Period
for the year ended 30 June 2018
Compensation for the Minister for Health is paid by the Legislature and is not reimbursed by the Ministry of Health and its controlled entities. Accordingly nosuch amounts are included in the key management personnel compensation disclosures above.
Remuneration for the Secretary and Deputy Secretaries are paid by the Ministry of Health and is not reimbursed by the health entities. Accordingly no suchamounts are included in the key management personnel compensation disclosures above.
Central Coast Local Health DistrictNotes to and forming part of the Financial Statements
There are no events after the reporting period that require amendment to the financial statements.
END OF AUDITED FINANCIAL STATEMENTS
During the financial year, Central Coast Local Health District obtained key management personnel services from the immediate parent and incurred $381K(2017: $ 406K) for these services.
