health accounts
TRANSCRIPT

www.dha.gov.ae
Confidential
Health Accounts System of Dubai
2019

Table Of
ContentsFOREWORD MESSAGE04 05
EXECUTIVE SUMMARY HIGHLIGHTS11 12
ACKNOWLEDGEMENTLIST OF ABBREVIATIONS AND DEFINITIONS06 07
INTRODUCTION METHODOLOGY13 14POPULATION BOUNDARIES FOR HASD
DATA COLLECTION AND ANALYSIS14 14
RESULTS OF HASD 2019 SOURCES AND FLOW OF FUNDS18 19
HEALTH ACCOUNTSPRODUCTION TOOL LIMITATIONS17 17
FINANCING SCHEMES THAT MANAGED THE HEALTHCARE EXPENDITURE
TYPES OF HEALTH PROVIDERS THAT RECEIVED THE HEALTHCARE EXPENDITURE AMOUNT THROUGH THE VARIOUS FINANCING SCHEMES
20 22HEALTH SERVICES EXPENDI-TURE THROUGH THE VARI-OUS FINANCING SCHEMES
TYPES OF HEALTH SERVICES THAT RECEIVED THE HEALTHCARE EX-PENDITURE AMOUNT THROUGH THE VARIOUS HEALTH PROVIDERS
24 26
COMPARATIVE ANALYSIS28
Health Accounts System of Dubai 3
MAJOR DIAGNOSTIC CATEGORY31
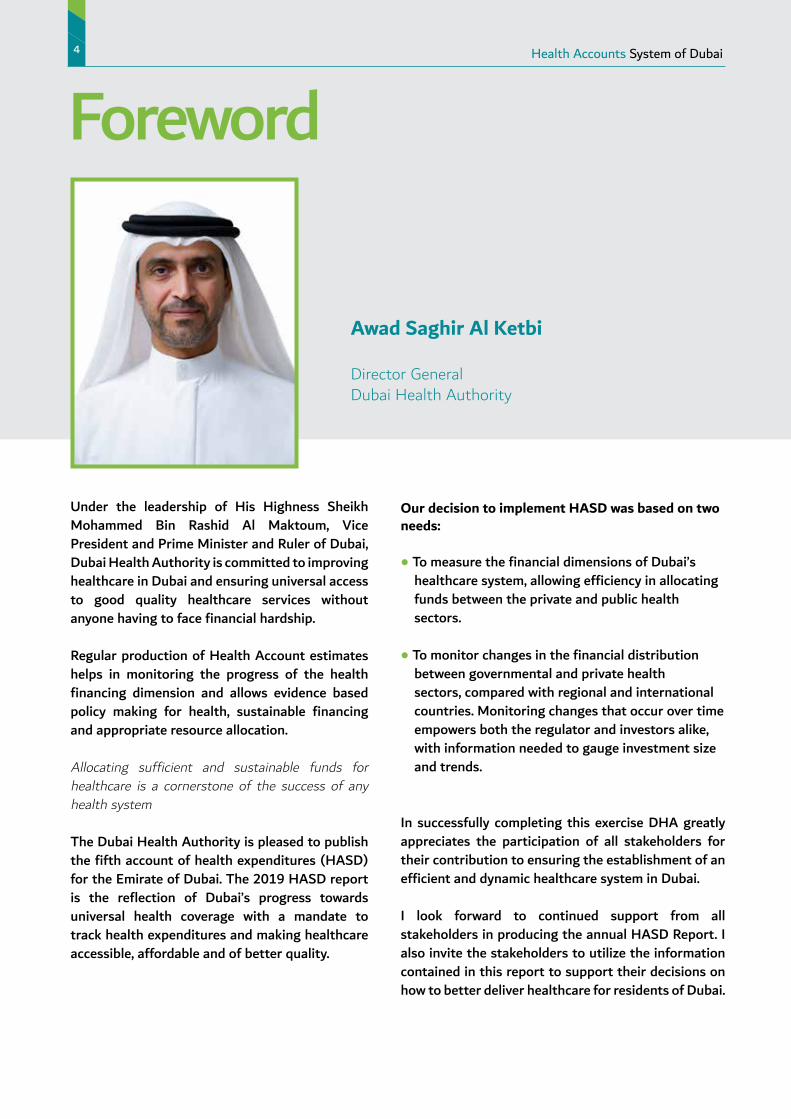
Awad Saghir Al Ketbi
Director GeneralDubai Health Authority
Under the leadership of His Highness Sheikh Mohammed Bin Rashid Al Maktoum, Vice President and Prime Minister and Ruler of Dubai, Dubai Health Authority is committed to improving healthcare in Dubai and ensuring universal access to good quality healthcare services without anyone having to face financial hardship.
Regular production of Health Account estimates helps in monitoring the progress of the health financing dimension and allows evidence based policy making for health, sustainable financing and appropriate resource allocation.
Allocating sufficient and sustainable funds for healthcare is a cornerstone of the success of any health system
The Dubai Health Authority is pleased to publish the fifth account of health expenditures (HASD) for the Emirate of Dubai. The 2019 HASD report is the reflection of Dubai’s progress towards universal health coverage with a mandate to track health expenditures and making healthcare accessible, affordable and of better quality.
Foreword4 Health Accounts System of Dubai
Our decision to implement HASD was based on two needs:
• To measure the financial dimensions of Dubai’s healthcare system, allowing efficiency in allocating funds between the private and public health sectors.
• To monitor changes in the financial distribution between governmental and private health sectors, compared with regional and international countries. Monitoring changes that occur over time empowers both the regulator and investors alike, with information needed to gauge investment size and trends.
In successfully completing this exercise DHA greatly appreciates the participation of all stakeholders for their contribution to ensuring the establishment of an efficient and dynamic healthcare system in Dubai.
I look forward to continued support from all stakeholders in producing the annual HASD Report. I also invite the stakeholders to utilize the information contained in this report to support their decisions on how to better deliver healthcare for residents of Dubai.

Health Accounts System of Dubai 5
Saleh Al Hashimi,
CEO, Dubai Health Insurance CorporationDubai Health Authority
Dubai has achieved substantial progress in improving many health indicators in past decade. These achievements were made possible mainly due to establishment of ISAHD (Insurance System of Advancing Health in Dubai) scheme. This very successful scheme for health sector has been instrumental in mobilizing financial resources to improve access to health services and health outcomes.
In order to sustain the incremental resource allocation and financial protection, DHA generates and uses evidence on the magnitude and flow of health sector resources using the Health Accounts methodologyIn-line with WHO NHA standards, institutionalized Health Accounts informs how total health expenditure flows from financing sources to end users. The current health account charts Dubai’s steady progress in increasing health expenditure and expanding understanding of where investments are made. HASD 2019 report provides an insightful reflection of the healthcare financing indicators for Dubai.
I would like to extend my appreciation to HASD technical team who have been involved in the data collection and analysis for the fifth round of health accounts, as well as the writing and production of this report.
Message
Acknowledgement6 Health Accounts System of Dubai
Substantial efforts were undertaken to provide this comprehensive analysis of health expenditure and flow of funds throughout Dubai’s healthcare sector. Significant data on expenditure was collected, analyzed and validated to produce the HASD Report: 2019. The Dubai Health Insurance Corporation (DHIC) in DHA worked in close collaboration with key stakeholders, in order to publish a transparent report.
This exercise could not have been successfully completed without the support of key stakeholders. Sincere gratitude and appreciation is due for the cooperation of various organizations in providing the vital and sensitive financial information necessary to produce this report. In particular, the following organizations’ collaborative efforts is recognized:• Department of Finance (DOF), Dubai• Ministry of Health and Prevention (MOHAP), United Arab Emirates• Finance Department, Dubai Health Authority• Dubai private healthcare providers and insurance companies
The technical team responsible for the execution of HASD and this report includes the following members: • Dr. Meenu Mahak Soni, Health Economist, led the technical production of this report.• Ms Khadija Mohammed Al Blooshi, Head of CEO office, proof-read the report and led the administrative efforts in producing the report• Mr. Philip Swanny, extracted and interpreted the data from e-claim system• Dr. Eldaw A. Suliman, Advisor for Strategy and Governance Department, provided valuable review of the report• Senior team members from Dubai Health Insurance Corporation, participated in a comprehensive review of the report.

Health Accounts System of Dubai 7
List of Abbreviations and Definitions
AED
CHE
DHA
DHCC
DHCCA
DHIC
DHHS
DM
DoF
DSC
FS
GDP
GGHE
HASD
HC
HF
HP
ISAHD
MOH
MOHAP
OECD
OOP
n.e.c
NCU
PPP
United Arab Emirate Dirham
Current Health Expenditure
Dubai Health Authority
Dubai Health Care City
Dubai Health Care City Authority
Dubai Health Insurance Corporation
Dubai Health Household Survey
Dubai Municipality
Dubai Department of Finance
Dubai Statistics Center
Funds of Financing Scheme
Gross Domestic Product
General Government Expenditure on Health
Health Accounts System of Dubai
Health care Functions
Health Financing Schemes
Health care Providers
Insurance System of Advancing Health in Dubai
Ministry of Health
Ministry of Health and Prevention
Organization for Economic Co-operation and Development
Out-of-Pocket
Not Elsewhere Classified
National Currency Unit
Purchasing Power Parity

List of Abbreviations and Definitions
PvHE
RoW
SHA
THE
UAE
US$
WHO
Private Expenditure on Health
Rest of the World
System of Health Accounts
Total Health Expenditures
United Arab Emirates
United States Dollars
World Health Organization
Ancillary services: A variety of services such as laboratory tests, diagnostic imaging and patient transport,
usually performed by paramedical or medical technical personnel with or without the direct supervision of a
medical doctor.
Investment: Investment in health care facilities and equipment that creates assets that are typically used over
a long period of time.
Curative care: Medical and paramedical services delivered during an episode of curative care. An episode of
curative care occurs when the principal medical intent is to: relieve the symptoms of injury or illness; to reduce
severity of an illness or injury; or to protect against injury or exacerbation of an injury which could threaten life
or normal function.
Current health expenditure (CHE): Comprises all services such as curative care (including services provided
to residents by non-residents providers), rehabilitative care, prevention, public health, and ancillary health care.
Also includes expenditures for administration of these services and drugs, medical goods, and salaries and fees
of health personnel. This excludes investment expenditures, and exports (services provided to non-residents).
Day care: Planned medical and paramedical services delivered to patients who have been formally admitted for
diagnosis, treatment or other types of health care but with the intention to discharge the patient on the same
day.
Definitions
8 Health Accounts System of Dubai

Health Accounts System of Dubai 9
Exports (of health care goods and services): Health care goods and services acquired by non-residents (visi-
tors) from resident providers.
Financing agents (FA): Institutional units that manage health finance schemes. For example, collecting Funds
and premiums, purchase services, and pay for these services.
Financing schemes (HF): Components of a country’s health financial system that channel funds to pay for, or
purchase, the activities within the health accounts boundary.
Health care functions (HC): The goods and services provided and activities performed within the health ac-
counts boundary.
Health care system administration and financing: Establishments that are primarily engaged in the regulation
of the activities of agencies that provide health care and in the overall administration of the health care sector,
including the administration of health financing.
Imports of healthcare goods and services (Imports): Health care goods and services acquired by residents
from nonresident providers. In other words, healthcare services provided outside the geographical boundaries of
the health care system.
Inpatient care (IP): Formal admission into a health care facility for treatment and/or care that is expected to
constitute an overnight stay.
Not Elsewhere Classified (n.e.c): A category used to reflect those activities or transactions that fall within the
boundaries of the health accounts but which cannot be definitively allocated to a specific category due to insuf-
ficient documentation.
Out-Of-Pocket (OOP) spending: The direct outlays of households, including gratuities and payments in-kind,
made to health practitioners and suppliers of pharmaceuticals, therapeutic appliances, and other goods and ser-
vices whose primary intent is to contribute to the restoration or enhancement of the health status of individuals
or population groups. Includes household payments to public services, non-profit institutions or non-govern-
mental organizations.
Definitions
Outpatient care (OP): Any care offered to a non-admitted patient regardless of where it. It may be delivered in
a hospital, an ambulatory care center, or a physician’s private office.
Preventive services: Services provided as having the primary purpose of risk avoidance, of acquiring diseases or
suffering injuries, which can frequently involve a direct and active interaction of the consumer with the health
care system.
Providers (HP): Encompass organizations and actors that deliver health care goods and services as their prima-
ry activity, as well as those for which health care provision is only one among a number of activities.
Inflow Funds of financing schemes (FS): The funds of the health financing schemes received or collected
through specific contribution mechanisms.
System of Health Accounts (SHA): A system developed by the OECD, Eurostat, and WHO to provide interna-
tional comparability standards for member and non-member countries. The manual was produced first in 2010
with the latest iteration published in 2011.
Total health expenditure (THE): Total health expenditure is no longer part of the health accounts as per SHA
2011. It is defined as the sum of current health expenditure (CHE) and the expenditure on capital goods. In this
report, the term is used only to draw comparison with other countries.
Prepayment schemes: Schemes that receive payments from the insurer or other institutional units on behalf of
the insured, to secure entitlement to benefits of health insurance schemes.
Definitions
10 Health Accounts System of Dubai
Health Accounts System of Dubai 11
HASD (Health Accounts System of Dubai) is designed to monitor the flow of funds in Dubai’s healthcare sys-
tem, which is undergoing continuous sector reforms including mandatory health coverage. HASD provides vital
information regarding who pays for health, who manages health resources and on which interventions health
resources are spent. HASD data informs how total health expenditure flows from financing sources to end users
of spending.
The preparation of HASD is led annually, by Dubai Health Insurance Corporation, Dubai Health Authority. This
report covers the results of 2019 and includes also key findings from previous reports covering 2017 and 2018.
HASD is developed using an internationally recognized and standardized methodology which facilitate com-
parisons across countries and over time within the Emirates of Dubai. Health Expenditure data was collected
from several sources. Information on government spending was collected from Department of Finance (DOF),
Dubai Health Authority (DHA) and Ministry of Health and Prevention (MOHAP). The data on private sector
expenditure was extracted from eClaimLink platform and was collected from employers through pre-designed
templates. The information on out of pocket spending was based on the results from Dubai Household Health
Survey 2018-19.
Total current healthcare expenditure in 2019 was 19.27 B AED, an increase of 4.8% from the spending in
2018, which was 18.39 B AED.
In 2019, Government financed healthcare expenditure accounted for 36% of total spending, 6,864 M AED and
Private healthcare expenditure accounted for 64% of total spending, 12,410 M AED.
Since 2017, the source of funding by employers, as contribution to their employees’ health insurance premium,
increased from 49% to 53%. Over the same period, the government contribution dropped from 38% to 36%
and out of pocket spending reduced from 13% to 11%.
The share of all health spending received by various providers was 42%, 26% and 16% for hospitals, clinics,
retail pharmacies and ancillary providers, respectively.
The curative care accounted for 59% of the total health expenditure. The spent on ancillary services and
medical goods was 14% and 17%, respectively. The spent on preventive care services was very low at 1%. The
government allocated 25% of their health expenditure to governance and administrative functions. The private
insurance spent 40% of their total health expenditure on ancillary services and medical goods.
Executive Summary

Highlights
12 Health Accounts System of Dubai
Current Health Expenditure (CHE)AED 19,273 M
4.7% of GDP
Per capita health expenditure
AED 4,114 (USD 1,121)
How has current expenditure changed?CHE as % of GDP
Who paid for it?
What was it spent on? Curative Services 59% Medical Goods 17%
Ancillary Services 14% Governance 9%
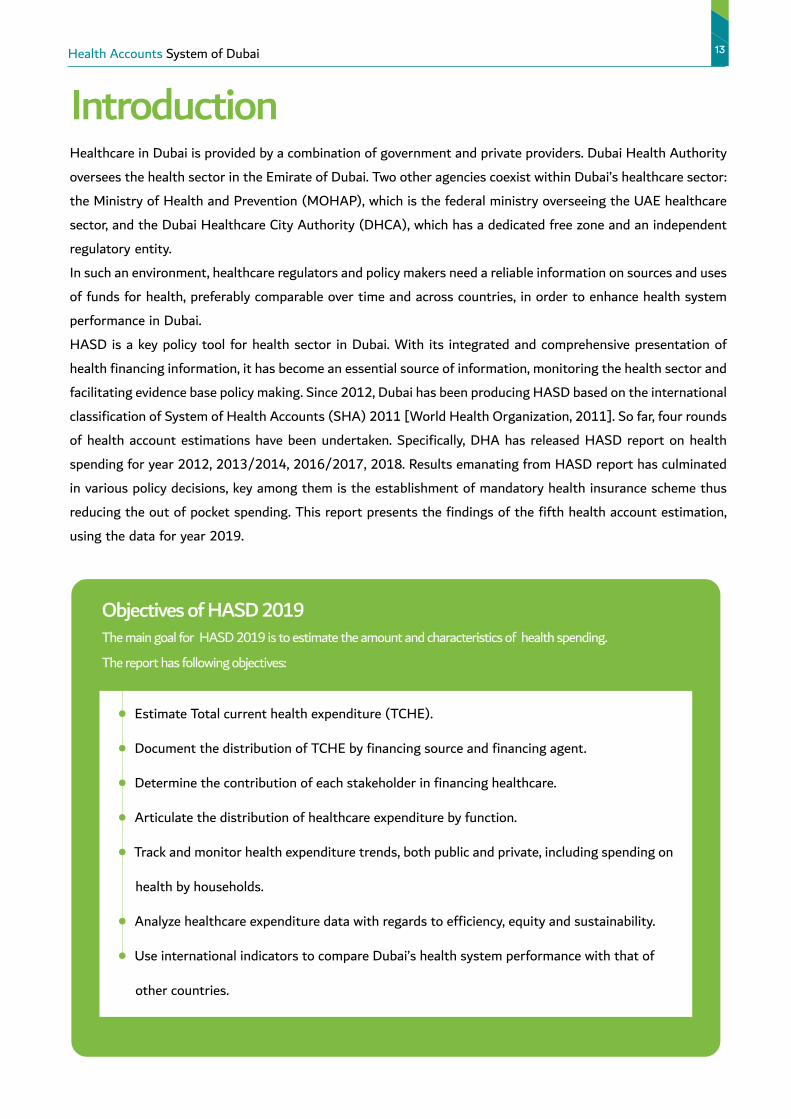
• Estimate Total current health expenditure (TCHE).
• Document the distribution of TCHE by financing source and financing agent.
• Determine the contribution of each stakeholder in financing healthcare.
• Articulate the distribution of healthcare expenditure by function.
• Track and monitor health expenditure trends, both public and private, including spending on
health by households.
• Analyze healthcare expenditure data with regards to efficiency, equity and sustainability.
• Use international indicators to compare Dubai’s health system performance with that of
other countries.
Health Accounts System of Dubai 13
IntroductionHealthcare in Dubai is provided by a combination of government and private providers. Dubai Health Authority
oversees the health sector in the Emirate of Dubai. Two other agencies coexist within Dubai’s healthcare sector:
the Ministry of Health and Prevention (MOHAP), which is the federal ministry overseeing the UAE healthcare
sector, and the Dubai Healthcare City Authority (DHCA), which has a dedicated free zone and an independent
regulatory entity.
In such an environment, healthcare regulators and policy makers need a reliable information on sources and uses
of funds for health, preferably comparable over time and across countries, in order to enhance health system
performance in Dubai.
HASD is a key policy tool for health sector in Dubai. With its integrated and comprehensive presentation of
health financing information, it has become an essential source of information, monitoring the health sector and
facilitating evidence base policy making. Since 2012, Dubai has been producing HASD based on the international
classification of System of Health Accounts (SHA) 2011 [World Health Organization, 2011]. So far, four rounds
of health account estimations have been undertaken. Specifically, DHA has released HASD report on health
spending for year 2012, 2013/2014, 2016/2017, 2018. Results emanating from HASD report has culminated
in various policy decisions, key among them is the establishment of mandatory health insurance scheme thus
reducing the out of pocket spending. This report presents the findings of the fifth health account estimation,
using the data for year 2019.
Objectives of HASD 2019The main goal for HASD 2019 is to estimate the amount and characteristics of health spending.
The report has following objectives:

Methodology
14 Health Accounts System of Dubai
The HASD report for 2019 is carried out in accordance with the guidelines of producing System of Health
Accounts (SHA) 2011 [World Health Organization, 2011], similar to the previous year reports. SHA 2011 is
intended to constitute a system of comprehensive, internally consistent, internationally comparable accounts,
which should be compatible with other aggregate economic and social statistics as far as possible. The WHO
system of health accounts explains the rationale of producing the reports at a country level and requires the
definition of population boundaries to accompany each system of health accounts
Population boundaries for HASDThe population in Dubai is classified in the following groups:
1. Nationals in the Emirate of Dubai
2. Non-Nationals with employment visas from Dubai and residence inside Dubai
3. Non-Nationals with employment visas from Dubai and residence outside Dubai
4. Tourists who visit Dubai
Dubai Statistics Center considers first two groups as a part of Dubai’s population. However, the health care fi-
nancing reform is aimed to offer mandatory health coverage to all members of the first three groups, regardless
of geographic location. Thus, for the purpose of HASD report, the first three groups is considered. Healthcare
expenditure by tourists is not included in this report.
Data Collection and AnalysisThe data collection process for HASD 2019 report extensively relied on secondary as well as primary
data collected through Dubai Health Household survey (2018-2019). Secondary data was used for the
estimation of expenditures, collation and triangulation of primary data, including determining health
expenditure ratios
Data Sources
GovernmentDubai Department of Finance (DoF)
DoF provided HASD’s technical team with data for health expenditure paid by Dubai Government to
three entities namely Dubai Municipality, Dubai Police and Dubai Ambulance for health services ren-
dered. The data received included a detailed breakdown of expenditure and funds based on the Dubai
Government Chart of Accounts which includes the cost centers and the line item details. The breakdown
was useful to accurately map the expenditures at the item level, and to ensure consistency with the
reports from recipients of the funds. DOF also provided data on amount paid towards health insurance
claims for government employees distinguishing clearly between the funds paid towards insurance pre-
miums and healthcare claims. These data were adjusted based on claims data for government schemes
in eClaimlink Data. DOF data didn’t indicate which providers and health services were used.

Health Accounts System of Dubai 15
Dubai Health Authority (DHA)
DHA finance provided two datasets which were used to analyze and map DHA activities to HASD.
DHA Expenditure Dataset: Detailed government expenditure data was collected from DHA by cost cen-
ter by each item definition and by sector. The cost center data was classified in healthcare functions
(inpatient, daycase and outpatient) based on the healthcare utilization data published by DHA health
information and statistics department.
DHA Revenue Dataset: The revenue data that contains the money collected by each cost center and was
used to triangulate validate the estimates of out-of-pocket (OOP) Expenditures.
Data on expenditure by major disease categories in public facilities was provided DHA revenue cycle
management team.
Ministry of Health and Prevention, U.A.E (MOHAP)
MOHAP provided the HASD team with detailed expenditure data broken down by facility type and cost
centers located in Dubai. MOHAP healthcare utilization in Dubai was used to analyze and map this ex-
penditure by healthcare functions. MOHAP collection of revenue from service users was not reported
and has been necessarily omitted from this report.
eClaimlink Data
The data for private health insurance in 2019 was extracted from eclaimlink, operated by the DHA. The
datasets from eclaimlink included the claims transaction data for all Dubai based policies with details of
the services provided, and the financial transaction for each service episode. The data was classified by
payer type, provider type and service type so that it could be mapped to SHA 2011.
Major employers
Data from major employers in Dubai such as Emirates Airlines that provided health insurance coverage
for their employees and families were collected and classified by provider type, and service type, and
mapped to SHA 2011.
Dubai Household Health Survey (DHHS) 2018
The household health expenditures were obtained from Dubai Household Health Survey (DHHS) 2018
conducted by Dubai Statistics Center (DSC) in close collaboration with DHA.
The DHHS is the largest comprehensive household survey of healthcare and health issues carried out
in The Emirates of Dubai. The survey provides a statistically accurate and representative outlook of key
health and healthcare variables across the entire population of Dubai.
The survey of 2018 was based on a multi- stage stratified cluster sample. The sampling was designed
so that after weighting it would be representative of four subpopulation: UAE citizens, Non- citizens

16 Health Accounts System of Dubai
living in households, Non-citizens living in collective housing and Non- citizens living in labor camps.
Surveyors personally visited these randomly selected households to obtain detailed information on is-
sues ranging from household health expenditure, and access to health services to questions on exercise
levels, dietary habits, lifestyle diseases, mental health, and a detailed module on the use of public and
private health services in Dubai. The 2018 survey had a response rate of 96%. The design and method-
ology of the survey were adopted from those used in the World Bank’s Living Standards Measurement
Surveys ( LSMS), the World Health Organization’s World Health Surveys (WHS) and the US Center for
Disease Control’s National Health Interview and Examination Surveys ( NHIES).
Importance weights were assigned by DSC because UAE citizens were oversampled. After weighting,
the sample was representative of population of 3.2 million Dubai residents as of 2018. The sample size
for 2018 was a total of 9,630 persons in 2200 housing units of whom 5,665 were UAE citizens, 2342
were Non- citizens in households, 1,335 were Non-citizens in collective housing, and 288 were Non-cit-
izens in labor camps. The survey was sanctioned by the institutional review board of the Dubai Health
Authority.
Each of the surveyors received extensive training in the collection of self-reported expenditure data
and interviewed the person in the household most knowledgeable about recent medical utilization. After
collecting a household roster and basic demographics for each household member, the surveyor asked
whether each household member had had any outpatient utilization in the last 30 days, made any dis-
cretionary purchases of medical supplies or over the counter medicines
(mentioning blood pressure cuffs, blood sugar monitors, orthopedic supplies, medicines etc.) in the last
30 days and whether each household member had an overnight inpatient stay in the last 12 months.
For households where more than one member had experienced these events, an individual member was
selected at random and details of their medical events were collected to investigate the total of out of
pocket spending for various categories of discretionary spending, outpatient spending and inpatient
spending, after adjusting for the appropriate weights.
Health Accounts System of Dubai 17
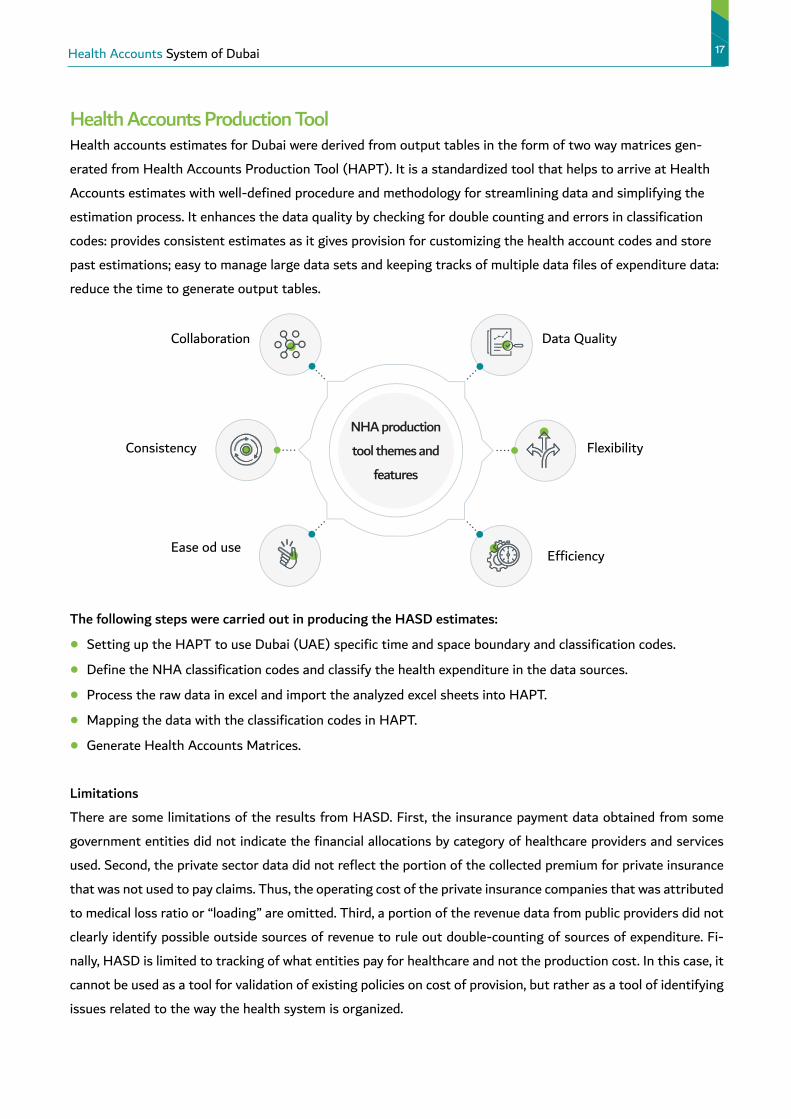
Health Accounts Production ToolHealth accounts estimates for Dubai were derived from output tables in the form of two way matrices gen-
erated from Health Accounts Production Tool (HAPT). It is a standardized tool that helps to arrive at Health
Accounts estimates with well-defined procedure and methodology for streamlining data and simplifying the
estimation process. It enhances the data quality by checking for double counting and errors in classification
codes: provides consistent estimates as it gives provision for customizing the health account codes and store
past estimations; easy to manage large data sets and keeping tracks of multiple data files of expenditure data:
reduce the time to generate output tables.
The following steps were carried out in producing the HASD estimates:
• Setting up the HAPT to use Dubai (UAE) specific time and space boundary and classification codes.
• Define the NHA classification codes and classify the health expenditure in the data sources.
• Process the raw data in excel and import the analyzed excel sheets into HAPT.
• Mapping the data with the classification codes in HAPT.
• Generate Health Accounts Matrices.
Limitations
There are some limitations of the results from HASD. First, the insurance payment data obtained from some
government entities did not indicate the financial allocations by category of healthcare providers and services
used. Second, the private sector data did not reflect the portion of the collected premium for private insurance
that was not used to pay claims. Thus, the operating cost of the private insurance companies that was attributed
to medical loss ratio or “loading” are omitted. Third, a portion of the revenue data from public providers did not
clearly identify possible outside sources of revenue to rule out double-counting of sources of expenditure. Fi-
nally, HASD is limited to tracking of what entities pay for healthcare and not the production cost. In this case, it
cannot be used as a tool for validation of existing policies on cost of provision, but rather as a tool of identifying
issues related to the way the health system is organized.
NHA production
tool themes and
features
Data Quality
Flexibility
Efficiency
Consistency
Collaboration
Ease od use
Results of HASD 2019
18 Health Accounts System of Dubai
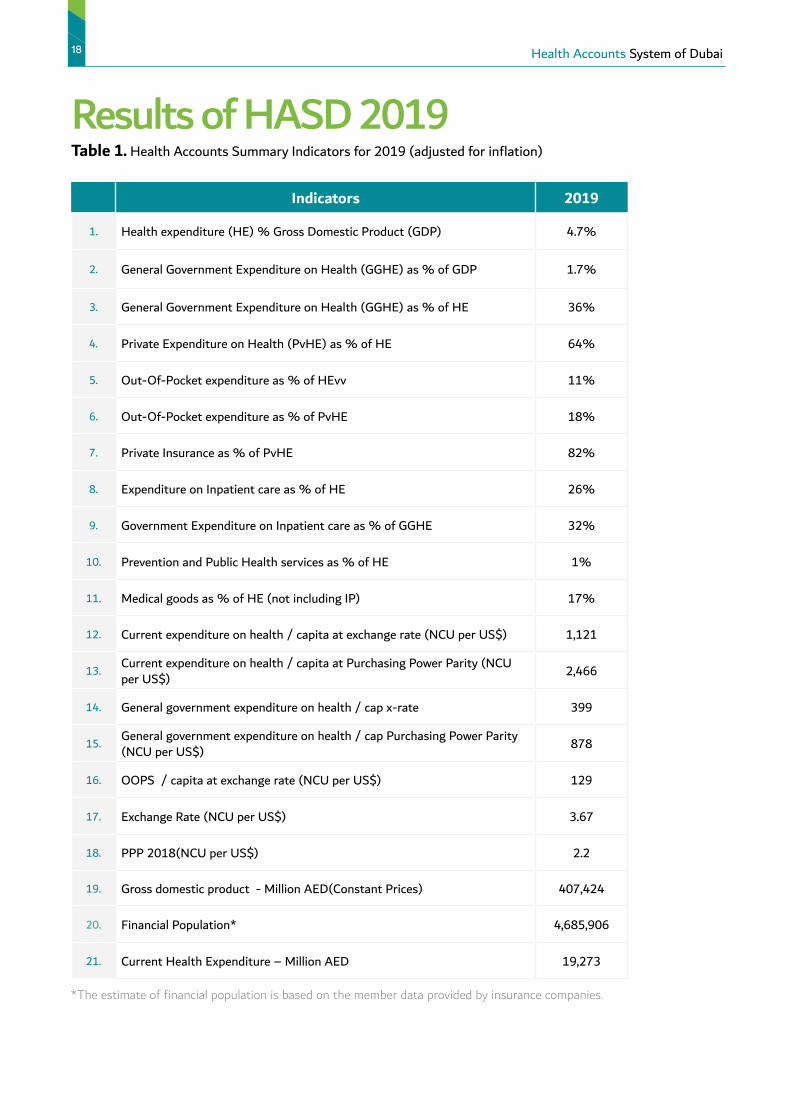
Table 1. Health Accounts Summary Indicators for 2019 (adjusted for inflation)
Indicators 2019
1. Health expenditure (HE) % Gross Domestic Product (GDP) 4.7%
2. General Government Expenditure on Health (GGHE) as % of GDP 1.7%
3. General Government Expenditure on Health (GGHE) as % of HE 36%
4. Private Expenditure on Health (PvHE) as % of HE 64%
5. Out-Of-Pocket expenditure as % of HEvv 11%
6. Out-Of-Pocket expenditure as % of PvHE 18%
7. Private Insurance as % of PvHE 82%
8. Expenditure on Inpatient care as % of HE 26%
9. Government Expenditure on Inpatient care as % of GGHE 32%
10. Prevention and Public Health services as % of HE 1%
11. Medical goods as % of HE (not including IP) 17%
12. Current expenditure on health / capita at exchange rate (NCU per US$) 1,121
13. Current expenditure on health / capita at Purchasing Power Parity (NCU per US$) 2,466
14. General government expenditure on health / cap x-rate 399
15. General government expenditure on health / cap Purchasing Power Parity (NCU per US$) 878
16. OOPS / capita at exchange rate (NCU per US$) 129
17. Exchange Rate (NCU per US$) 3.67
18. PPP 2018(NCU per US$) 2.2
19. Gross domestic product - Million AED(Constant Prices) 407,424
20. Financial Population* 4,685,906
21. Current Health Expenditure – Million AED 19,273
*The estimate of financial population is based on the member data provided by insurance companies.

Health Accounts System of Dubai 19
Sources and flow of fundsIn 2019, the biggest source of funds and financing schemes were employers, who accounted for 53% of funds
followed by the government and household who accounted for 36% and 11% respectively. In terms of flow of
funds, Hospitals received less than half of the pooled funds (42%) with the majority of funds received by hospi-
tals being used for curative care (59%) which includes inpatient, outpatient and daycare. Healthcare expenditure
outside Dubai (“Import”) is estimated at 4%. Expenditure for preventive care remains very low at 1% (Preven-
tive care not shown in Figure 1).
Figure 1: Flow of funds
100%
90%
80%
70%
60%
50%
40%
30%
20%
10%
0%Health Providers
Health Providers
2%
Clinics26%
Retailers16%
Ancillary2%
Clinics26%
Import4%
Clinics26%
Clinics26%
Hospital41%
Hospital42%
HQ9%
Source of Revenues
Employers53%
Households11%
Government,36%
Financing Schemes
Private Insurance
53%
Government,36%
Services Provided
Ancillary14%
Others1%
Curative 59%
Administrative9%
Medical goods17%
OOP11%
19.27B
19.27B
19.27B

Financing schemes that managed the healthcare expenditure
20 Health Accounts System of Dubai
The current health expenditure increased by 4.8% from 2018 to 2019. The private employers were the major
source of funds estimated at 10,198 M AED (53%) in 2019. The government financing schemes accounted for
6,864 M AED (36%) in 2019. Household out of pocket was estimated at 2,212 M AED (11%) in 2019.
Within 6864 M AED funds managed by the government entities, the major spending was by government of
Emirates of Dubai, estimated at 6504 (95%) while the federal government contributed only 360 M AED (5%)
Over the last 4 years (Figure 2), there was a significant increase in funds from private employers, however the
government contribution slightly decreased and household out of pocket spending didn’t show much variation.
Table 2. Financing Schemes (HF) by Financing Sources (FS) in 2019 (HF X FS)
Inflow funds of health care financing schemes
U.A.Emirates dirham (AED), MillionFinancing schemes
FS.1
Transfers from government
domestic reve-nue (allocated
to health purposes)
FS.4
Compulsory prepayment (Other, and unspecified, than FS.3)
FS.6
Other funds from house-holds n.e.c
All FS Share of FS
HF.1 Government schemes and compulsory contributory health care financing schemes
6,864 10,198 0 17,061 89%
HF.1.1 Government schemes 6,864 0 0 6,864 36%
HF.1.1.1 Central government schemes 360 0 0 360 2%
HF.1.1.2 State/regional/local government schemes 6,504 0 0 6,504 34%
HF.1.2 Compulsory contributory health insurance schemes 0 10,198 0 10,198 53%
HF.1.2.2 Compulsory private insurance schemes 0 10,198 0 10,198 53%
HF.3 Household out-of-pocket payment 0 0 2,212 2,212 11%
All HF 6,864 10,198 2,212 19,273 100%Share of HF 36% 53% 11% 100%
Health Accounts System of Dubai 21
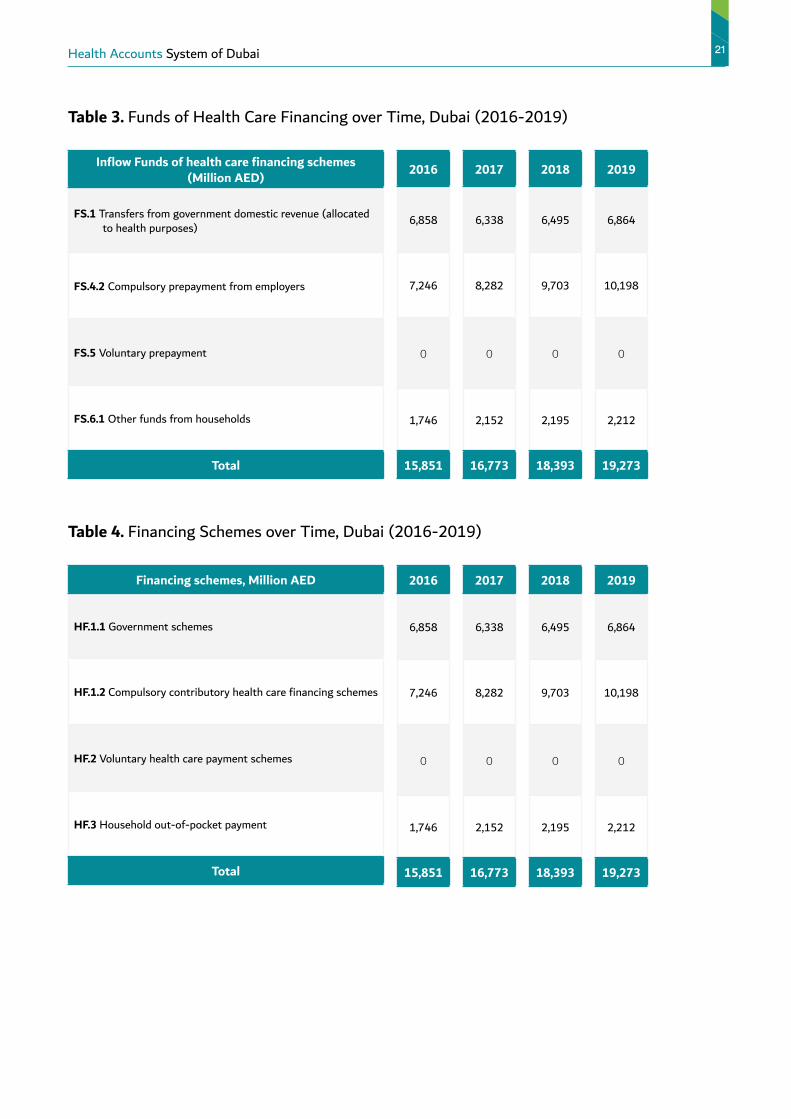
Table 3. Funds of Health Care Financing over Time, Dubai (2016-2019)
Inflow Funds of health care financing schemes (Million AED)
FS.1 Transfers from government domestic revenue (allocated to health purposes)
FS.4.2 Compulsory prepayment from employers
FS.5 Voluntary prepayment
FS.6.1 Other funds from households
Total
2016
6,858
7,246
0
1,746
15,851
2017
6,338
8,282
0
2,152
16,773
2018
6,495
9,703
0
2,195
18,393
Table 4. Financing Schemes over Time, Dubai (2016-2019)
Financing schemes, Million AED
HF.1.1 Government schemes
HF.1.2 Compulsory contributory health care financing schemes
HF.2 Voluntary health care payment schemes
HF.3 Household out-of-pocket payment
Total
2016
6,858
7,246
0
1,746
15,851
2017
6,338
8,282
0
2,152
16,773
2018
6,495
9,703
0
2,195
18,393
2019
6,864
10,198
0
2,212
19,273
2019
6,864
10,198
0
2,212
19,273

22 Health Accounts System of Dubai
Figure 2. Trends in Health Financing Schemes, Dubai (2016-2019)
Trends in Health Financing Schemes
HouseholdsCompulsary insurance schemesGovernment
100%
80%
60%
40%
20%
0%
11%
53%
36%
2019
12%
53%
35%
13%
49%
38%
11%
46%
43%
201820172016
Types of health providers that received the healthcare expenditure amount through the various financing schemes
The major amount of current healthcare expenditure for 2019 went to hospitals amounting to 8,136 M AED
(42%), followed by the primary health centers 5,043 (26%) Ancillary providers such as medical and diagnostic
labs, imaging centers received 313 M AED(2%) while pharmacies received 3,041 M AED (16%). Healthcare
governance and providers of healthcare system administration and financing received 1,705 (9%) of the funds.
Households allocated 857 M AED (39%) towards discretionary health care spending. And 711 M AED (4%)
was given to providers outside Dubai.
The HF1.1 column of Table 5 shows that large share of government scheme’s spending goes to Hospitals
(53%) and healthcare system administration (25%) which is 3% lesser compared to 2018. The private
insurance schemes provide a major share of fund to hospitals (38%) and clinics (32%) respectively. The
pharmacies receive 2028 M AED (20%) from private insurance schemes. As noted earlier, data about private
health insurance spending on administration and claims management was not available.

Health Accounts System of Dubai 23
Table 5. Health Providers (HP) by Financing Schemes (HF) in 2019 (HP X HF)
Financing schemes
U.A.Emirates dirham (AED), Million
Health care providers
HF.1HF.1.1
HF.1.1.1 HF.1.1.2
HF.1.2HF.3 All HF Share
of HF
HP.1 Hospitals 7,518 3,607 239 3,368 3,911 618 8,136 42%
HP.3 Providers of
ambulatory health care4,307 1,072 105 967 3,235 737 5,043 26%
HP.4 Providers of ancillary
services313 306 0 306 7 0 313 2%
HP.5 Retailers and Othe
providers of medical goods2,184 156 0 156 2,028 857 3,041 16%
HP.7 Providers of health care
system administration and
financing
1,705 1,705 16 1,689 0 0 1,705 9%
HP.9 Rest of the world 711 18 0 18 694 0 711 4%
HP.nec Unspecified health care
providers (n.e.c.)323 0 0 0 323 0 323 2%
All HP 17,061 6,864 360 6,504 10,198 2,212 19,273 100%Share of HP 89% 36% 2% 34% 53% 11% 100%
Figure 3. CHE by Financing Schemes and Providers, Dubai 2019
3%
53%
25%2%4%
16%
%
Health system administration
Hospitals
Provider of ambulatory
Provider of Ancillary services
Retaillers
20%
7%
32%
38%
Unspecified providers
RoW
Retaillers
Hospitals
Provider of ambulatory
39%
33%
28%
Retaillors and medical goods provuders
Hospitals
Provider of ambulatoryhealth care
OOP
2,21211%
Government6,86436%
Insurance 10,19853%
Financing Schemes
Gove
rnm
ent s
chem
es a
nd
com
puls
ory
cont
ribut
ory
heal
th c
are
finan
cing
sc
hem
es
Com
pulso
ry c
ontr
ibut
ory
heal
th in
sura
nce
sche
mes
Gove
rnm
ent s
chem
es
Hou
seho
ld
out-
of-p
ocke
t pay
men
t
Cent
ral g
over
nmen
t sc
hem
es
Stat
e/re
gion
al/l
ocal
go
vern
men
t sch
emes
Health services expenditure through the various financing schemes
24 Health Accounts System of Dubai
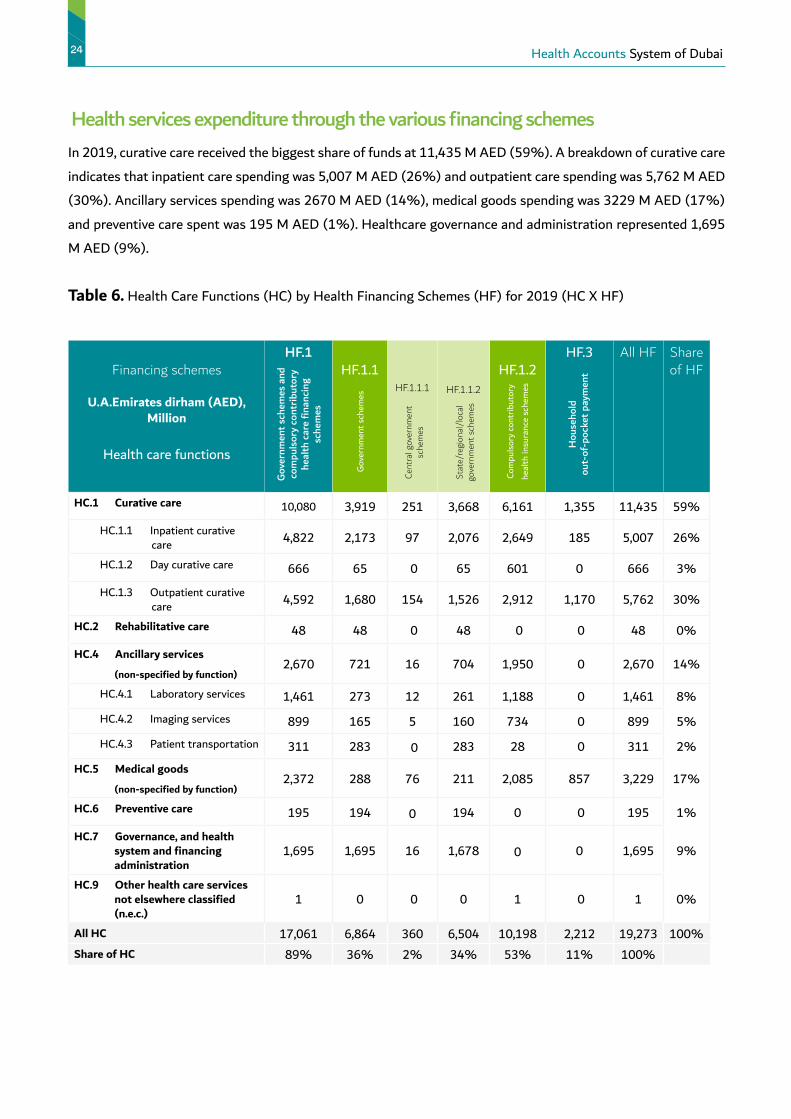
In 2019, curative care received the biggest share of funds at 11,435 M AED (59%). A breakdown of curative care
indicates that inpatient care spending was 5,007 M AED (26%) and outpatient care spending was 5,762 M AED
(30%). Ancillary services spending was 2670 M AED (14%), medical goods spending was 3229 M AED (17%)
and preventive care spent was 195 M AED (1%). Healthcare governance and administration represented 1,695
M AED (9%).
Table 6. Health Care Functions (HC) by Health Financing Schemes (HF) for 2019 (HC X HF)
Financing schemes
U.A.Emirates dirham (AED), Million
Health care functions
HF.1HF.1.1
HF.1.1.1 HF.1.1.2
HF.1.2HF.3 All HF Share
of HF
HC.1 Curative care 10,080 3,919 251 3,668 6,161 1,355 11,435 59%
HC.1.1 Inpatient curative care 4,822 2,173 97 2,076 2,649 185 5,007 26%
HC.1.2 Day curative care 666 65 0 65 601 0 666 3%
HC.1.3 Outpatient curative care 4,592 1,680 154 1,526 2,912 1,170 5,762 30%
HC.2 Rehabilitative care 48 48 0 48 0 0 48 0%
HC.4 Ancillary services
(non-specified by function)2,670 721 16 704 1,950 0 2,670 14%
HC.4.1 Laboratory services 1,461 273 12 261 1,188 0 1,461 8%
HC.4.2 Imaging services 899 165 5 160 734 0 899 5%
HC.4.3 Patient transportation 311 283 0 283 28 0 311 2%
HC.5 Medical goods
(non-specified by function)2,372 288 76 211 2,085 857 3,229 17%
HC.6 Preventive care 195 194 0 194 0 0 195 1%
HC.7 Governance, and health system and financing administration
1,695 1,695 16 1,678 0 0 1,695 9%
HC.9 Other health care services not elsewhere classified (n.e.c.)
1 0 0 0 1 0 1 0%
All HC 17,061 6,864 360 6,504 10,198 2,212 19,273 100%Share of HC 89% 36% 2% 34% 53% 11% 100%
Gove
rnm
ent s
chem
es a
nd
com
puls
ory
cont
ribut
ory
heal
th c
are
finan
cing
sc
hem
es
Com
pulso
ry c
ontr
ibut
ory
heal
th in
sura
nce
sche
mes
Gove
rnm
ent s
chem
es
Hou
seho
ld
out-
of-p
ocke
t pay
men
t
Cent
ral g
over
nmen
t sc
hem
es
Stat
e/re
gion
al/l
ocal
go
vern
men
t sch
emes
Health Accounts System of Dubai 25
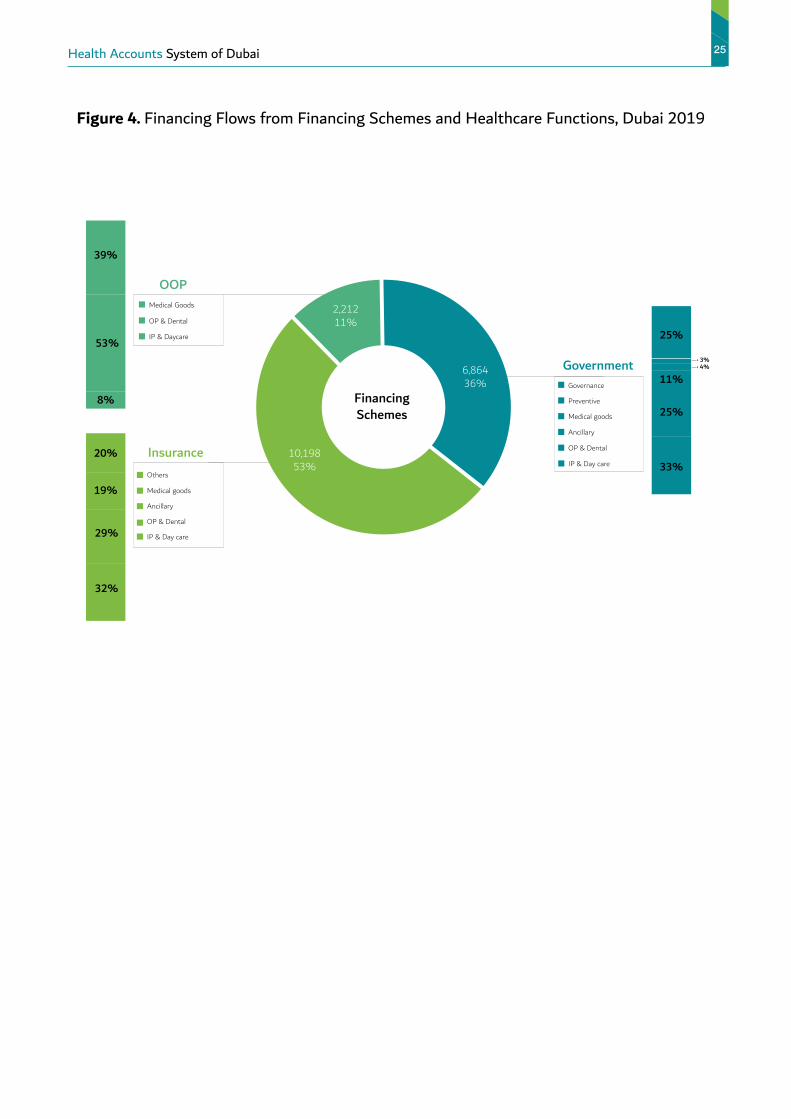
Figure 4. Financing Flows from Financing Schemes and Healthcare Functions, Dubai 2019
Financing Schemes
25%
3%4%
25%
11%
33%
Governance
IP & Day care
OP & Dental
Ancillary
Medical goods
Preventive
20%
19%
29%
32%
Others
Medical goods
Ancillary
IP & Day care
OP & Dental
39%
53%
8%
Medical Goods
IP & Daycare
OP & Dental
OOP
2,21211%
Government6,86436%
Insurance 10,19853%

Types of health services that received the healthcare expenditure amount through the various health providers
26 Health Accounts System of Dubai
As shown in Table 7, in 2019, hospitals received a total of 8,136 M AED of which 6,919 M AED was spent on
curative care, 1063 M on ancillary services ,43M on rehabilitative care, and 63 M on medical goods. Primary
Healthcare centers received a total of 5043 M of which 3,758 M was spent on curative care, 1,092 M on ancillary
services, 147 M on preventive care and 40M on medical goods. Retailers and providers of medical goods received
3041 M AED. The Rest of the World provided a wide array of services totaling 711 M AED with majority spent
towards curative care (424 M).
Table 7. Health Care Functions by Health Care Providers in 2019
Health care providers
U.A.Emirates dirham (AED), Million
Health care functions
HP.1 HP.3 HP.4 HP.5 HP.7 HP.9 HP.nec All HP Share of HP
HC.1 Curative care 6,919 3,758 0 0 10 424 323 11,435 59%
HC.1.1 Inpatient curative care 4,138 585 0 0 10 174 101 5,007 26%
HC.1.2 Day curative care 495 130 0 0 0 26 15 666 3%
HC.1.3 Outpatient curative care 2,287 3,043 0 0 0 224 207 5,762 30%
HC.2 Rehabilitative care 43 5 0 0 0 0 0 48 0%
HC.4 Ancillary services
(non-specified by function)1,063 1,092 284 51 0 180 0 2,670 14%
HC.4.1 Laboratory services 600 697 9 31 0 124 0 1,461 8%
HC.4.2 Imaging services 463 360 0 20 0 56 0 899 5%
HC.4.3 Patient transportation 0 36 275 0 0 0 0 311 2%
HC.5 Medical goods
(non-specified by function)63 40 29 2,990 0 107 0 3,229 17%
HC.6 Preventive care 48 147 0 0 0 0 0 195 1%
HC.7 Governance, and health system and financing administration
0 0 0 0 1,695 0 0 1,695 9%
HC.9 Other health care services not elsewhere classi fied (n.e.c.)
0 1 0 0 0 0 0 1 0%
All HC 8,136 5,043 313 3,041 1,705 711 323 19,273 100%Share of HC 42% 26% 2% 16% 9% 4% 2% 100%
Hos
pita
ls
Prov
ider
s of
am
bula
tory
he
alth
car
e
Prov
ider
s of
anc
illar
y se
rvic
es
Reta
ilers
and
Oth
er p
ro-
vide
rs o
f med
ical
goo
ds
Prov
ider
s of
hea
lth c
are
syst
em a
dmin
istr
atio
n an
d fin
anci
ng
Rest
of t
he w
orld
Uns
peci
fied
heal
th c
are
prov
ider
s (n
.e.c.
)

Health Accounts System of Dubai 27
Figure 5. CHE by Healthcare Providers and Healthcare Functions, Dubai 2019
Providers of Services
Ancillary
Medical goods
OP & Dental
IP & Day care
Governance
Medical goods
Ancillary
Outpatient
IP & Day care
Hospital
Rehabilitation
Medical goods
Ancillary
OP & Dental
IP & Day care
13%
28%
57%
Clinics
22%
61%
14%Preventive
Ancillary
OP & Dental
IP & Day care
Others
6%
56%
31%
25%
15%
32%
28%
3%
0.6%1%
4%2%
RoW
7114%
8,13642%
5,38228%
5,04326%

Comparative Analysis
28 Health Accounts System of Dubai
This section compares Dubai’s results with other regional and selected countries from Organization of Economic
Cooperation and Development (OECD). Data for comparative analysis was obtained from WHO Global Health
Expenditure Database and OECD Health Expenditure and Financing Statistics for the recent year available. The
OECD countries such as France, Switzerland, Canada, United Kingdom and USA were chosen to create a basket
of countries that are similar to the current or future health financing system in Dubai. In addition, UAE health
accounts for year 2017 was used to compare Dubai’s health indicators with UAE overall.
The data from the other GCC countries provided the closest regional comparison to Dubai’s healthcare system.
Figure 6. Current Health Expenditure (CHE) as Percentage of GDP
CHE as % of GDP
18%
16%
0%
2%
4%
6%
8%
10%
12%
14%
Qatar
2.5%
Oman
4.1%
United Kingdom
10%
Saudi Arabia
6.4%
Bahrain
4.1%
Dubai
4.7%
Korea
8%
UAE
4.2%
USA
17%
Switzerland
12%
France
11%
Canada
11%
Kuwait
5%
Health Accounts System of Dubai 29
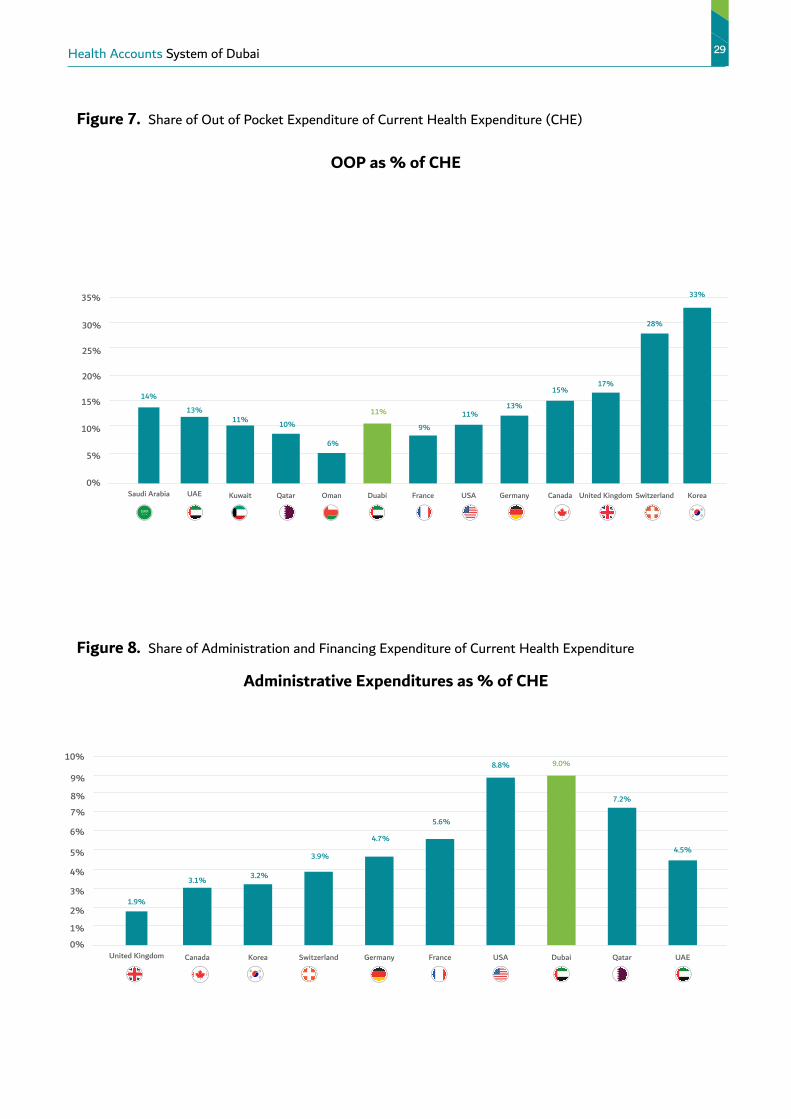
Figure 7. Share of Out of Pocket Expenditure of Current Health Expenditure (CHE)
OOP as % of CHE
Figure 8. Share of Administration and Financing Expenditure of Current Health Expenditure
Administrative Expenditures as % of CHE
0%
5%
10%
15%
20%
25%
30%
35%
Duabi
11%
Oman
6%
Germany
13%
Saudi Arabia
14%
Qatar
10%
France
9%
USA
11%
Kuwait
11%
Korea
33%
Switzerland
28%
United Kingdom
17%
Canada
15%
UAE
13%
1%
2%
3%
0%
4%
5%
6%
7%
8%
9%
10%
Switzerland
3.9%
United Kingdom
1.9%
Korea
3.2%
Germany
4.7%
France
5.6%
Canada
3.1%
UAE
4.5%
Qatar
7.2%
Dubai
9.0%
USA
8.8%

30 Health Accounts System of Dubai
Figure 9. Share of Preventive Care Expenditure of Current Health Expenditure (CHE)
Preventive Care Expenditure as % of CHE
Figure 10. Share of Ancillary Services Expenditure of Current Health Expenditure (CHE)
Ancillary Expenditures as % of CHE
UAE
1%
0%
1%
2%
3%
4%
5%
6%
7%
USA
2.9%
United Kingdom
5.1%
Qatar
0.40%
Switzerland
2.6%
Germany
3.2%
Korea
3.5%
France
1.8%
Canada
6%
Dubai
1%
16%
0%
2%
4%
6%
8%
10%
12%
14%
Germany
4.9%
UAE
6.3%
Dubai
14%
Korea
1.5%
Switzerland
4.5%
France
5.2%
Qatar
12%
Canada
3.3%
United Kingdom
1.8%

Major Diagnostic CategoryTable 8 illustrates healthcare expenditure by Major Diagnostic Category (MDC’s) in Dubai. In 2019, the total net
amount spent by MDC’s was 12 billion AED . The highest expenditure was on diseases of the respiratory system
(13.7%), followed by diseases of musculoskeletal system (10.8%) and digestive system (10.5%). The top ten
MDC’s in Dubai ends with Injury, poisoning and external causes. They represent 82% of the total expenditure.
Health Accounts System of Dubai 31
Table 8
MDC ShareDiseases of the respiratory system 13.7%
Diseases of the musculoskeletal system and connective tissue 10.8%
Diseases of the digestive system 10.5%Symptoms, signs and abnormal clinical and laboratory findings, not elsewhere classified 8.5%
Endocrine, nutritional and metabolic diseases 7.9%
Diseases of the circulatory system 7.5%
Diseases of the genitourinary system 7.1%
Factors influencing health status and contact with health services 5.9%
Pregnancy, childbirth and the puerperium 5.2%
Injury, poisoning and certain other consequences of external causes 4.6%
Neoplasms 3.2%
Diseases of the skin and subcutaneous tissue 3.1%
Certain infectious and parasitic diseases 2.8%
Diseases of the eye and adnexa 2.7%
Diseases of the nervous system 2.1%Diseases of the blood and blood-forming organs and certain disorders involving the immune mechanism 1.2%
Diseases of the ear and mastoid process 1.1%
Certain conditions originating in the perinatal period 0.7%
Codes for special purposes 0.6%
Mental and behavioral disorders 0.4%Congenital malformations, deformations and chromosomal abnormalities 0.3%
External causes of morbidity and mortality 0.02%

Figure 11.
MDC’s percentages from total paid amount
32 Health Accounts System of Dubai
Diseases of the circulatory system
8%
All other conditions18%
Diseases of the respiratory system14%
Diseases of the digestive system
10%
Diseases of the musculoskeletal system and connective tissue
11%
Symptoms, signs and abnormal clinical and laboratory findings,
not elsewhere classified9%
Endocrine, nutritional and metabolic diseases
8%
Injury, poisoning and certain other consequences
of external causes5%
Diseases of the genitourinary system
7%
Factors influencing health status and contact with
health services6%
Pregnancy, childbirth and the puerperium
5%

Health Accounts System of Dubai 33
A Report byDUBAI HEALTH INSURANCE CORPORATIONDubai Health Insurance Corporation was formed in 2018 under the guidance of Shaikh Hamdan Bin Mohammad
Bin Rashid Al Maktoum, Crown Prince of Dubai and Chairman of the Dubai Executive Council who issued Execu-
tive Council Resolution No. (18) of 2018 approving the new organizational structure of Dubai Health Authority
(DHA). The Corporation helps regulate the insurance market, create a conducive environment for growth and
help maximise benefits to customers as well as protect their interest. At the same time, it also keeps the interest
of the insurance companies and Third Party Administrators in mind.
The corporation also license and regulate health insurance companies, claims management companies, insurance
brokers and service providers.
It is responsible for managing Dubai Government’s health insurance programme and issuing reports and recom-
mendations related to health insurance and health economics.
For Any Queries
Contact - Dr. Meenu Mahak Soni (Health Economist, DHIC, DHA)
Email: [email protected]

34 الحسابات الصحية لإمارة دبي 2019 (حصد)
الملخص التنفيذيالحاجة لـ “حصد”
تم تطوير ”حصد“ باستخدام منهجية موحدة ومعترف بها دوليًا والتي تسهل المقارنات المعيارية بين البلدان وإمارة
دبي على وجه الخصوص. حيث يتم الإشراف على إعداد تقرير ”حصد“ (نظام الحسابات الصحية في دبي) سنويًا من
قبل فريق مؤسسة دبي للضمان الصحي والذي يخضع لتحسينات مستمرة في شتى القطاعات بما في ذلك التغطية
الصحية الإلزامية.
يغطي التقرير الحالي نتائج العام المالي 2019 ويتضمن أيضًا النتائج الرئيسية من التقارير السابقة التي تغطي الأداء
للأعوام 2017 و 2018.
كما يوفر تقرير “حصد” معلومات حيوية بشأن:
• قياس الأبعاد المالية لنظام الرعاية الصحية في دبي بما يتيح الكفاءة في تخصيص الأموال بين قطاعي الصحة العام
والخاص.
• مراقبة التغيرات في التوزيع المالي بين القطاعات الصحية الحكومية والخاصة مقارنة بالدول الإقليمية والدولية حيث
أن مراقبة التغيرات التي تحدث بمرور الوقت ستمنح حكومة دبي والمستثمرين المعلومات اللازمة لقياس حجم
واتجاهات الاستثمار.
• توضيح الجهات التي تقوم بالدفع مقابل الخدمات الصحية، كيفية إدارة الموارد الصحية وفي أي مسار يتم إنفاق
الموارد الصحية.
• آلية تدفق إجمالي الإنفاق الصحي من مصادر التمويل إلى المستخدمين النهائيين.
• مراقبة تدفق الأموال في نظام الرعاية الصحية في دبي.
جمع وتحليل البياناتتم جمع بيانات الإنفاق الصحي من عدة مصادر وجهات، حيث تم جمع المعلومات حول الإنفاق الحكومي على شكل
قوالب مصممة مسبقاً من كلا من دائرة المالية (DOF) وهيئة الصحة في دبي (DHA) ووزارة الصحة ووقاية المجتمع
(MOHAP). بالإضافة إلى ذلك تم استخراج البيانات الخاصة بنفقات القطاع الخاص من منصة المطالبات الإلكترونية
eClaimLink system وكذلك من أصحاب العمل. فيما استندت المعلومات الخاصة بالإنفاق الصحي للأسر على نتائج
مسح صحة الأسرة في دبي للأعوام 2019-2018.
الحسابات الصحية لإمارة دبي 2019 (حصد) 35
النتائج الرئيسية لـ “حصد”
بلغ إجمالي الإنفاق الحالي على الرعاية الصحية في عام 2019 حوالي 19.27 مليار درهم إماراتي، بزيادة قدرها %4.8 عن
الإنفاق في عام 2018، والذي بلغ 18.39 مليار درهم إماراتي. حيث شكلت نفقات الرعاية الصحية الممولة من الحكومة
في عام 2019 ما يعادل %36 من إجمالي الإنفاق بما يعادل 6,864 مليون درهم إماراتي، فيما بلغت نفقات الرعاية
الصحية في القطاع الخاص نسبة %64 من إجمالي الإنفاق بما يعادل 12,410 مليون درهم إماراتي.
ارتفعت نسبة التمويل من قبل أصحاب العمل منذ عام 2017 كمساهمة في أقساط التأمين الصحي لموظفيهم من
%49 إلى %53 خلال نفس الفترة، فيما انخفضت مساهمة الحكومة من %38 إلى %36 وانخفض كذلك الإنفاق
الصحي للأسر من %13 إلى 11%.
وقد بلغت حصة مجموع الإنفاق الصحي التي تلقاها مختلف مقدمي الخدمات الصحية كالتالي:
• %42 للمستشفيات، %26 للعيادات، و%16 لصيدليات البيع بالتجزئة ومقدمي الخدمات المساعدة.
• شكلت الرعاية العلاجية %59 من إجمالي الإنفاق الصحي. فيما بلغ الإنفاق على الخدمات الإضافية %14 والسلع
الطبية 17%.
• الإنفاق على خدمات الرعاية الوقائية كان منخفضاً جداً عند 1%.
• خصصت الحكومة %25 من نفقاتها الصحية لمجالات الحوكمة والإدارة. فيما تم إنفاق %40 من إجمالي نفقات
التأمين الصحي الخاص على الخدمات الإضافية والسلع الطبية.