health 2.0 quarterly report (q2 2015)
TRANSCRIPT
HEALTH 2.0 QUARTERLY REPORT :: Q2 2015
QUARTERLYREPORTS
HEALTH 2.0 QUARTERLY REPORT :: Q2 2015
BROUGHT TO YOU BY:
HEALTH 2.0 QUARTERLY REPORT :: Q2 2015
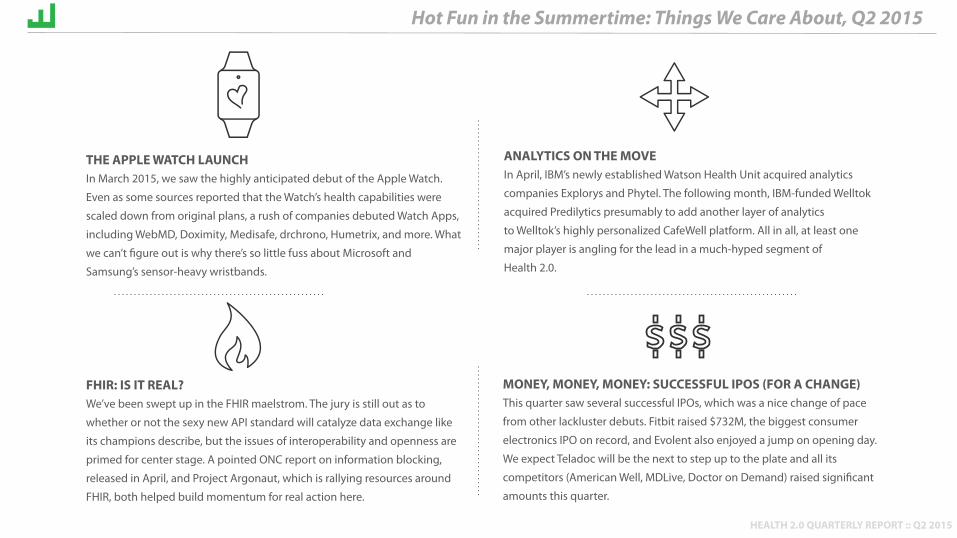
THE APPLE WATCH LAUNCH In March 2015, we saw the highly anticipated debut of the Apple Watch. Even as some sources reported that the Watch’s health capabilities were scaled down from original plans, a rush of companies debuted Watch Apps, including WebMD, Doximity, Medisafe, drchrono, Humetrix, and more. What we can’t figure out is why there’s so little fuss about Microsoft and Samsung’s sensor-heavy wristbands.
ANALYTICS ON THE MOVE In April, IBM’s newly established Watson Health Unit acquired analytics companies Explorys and Phytel. The following month, IBM-funded Welltok acquired Predilytics presumably to add another layer of analytics to Welltok’s highly personalized CafeWell platform. All in all, at least one major player is angling for the lead in a much-hyped segment of Health 2.0.
FHIR: IS IT REAL? We’ve been swept up in the FHIR maelstrom. The jury is still out as to whether or not the sexy new API standard will catalyze data exchange like its champions describe, but the issues of interoperability and openness are primed for center stage. A pointed ONC report on information blocking, released in April, and Project Argonaut, which is rallying resources around FHIR, both helped build momentum for real action here.
MONEY, MONEY, MONEY: SUCCESSFUL IPOS (FOR A CHANGE) This quarter saw several successful IPOs, which was a nice change of pace from other lackluster debuts. Fitbit raised $732M, the biggest consumer electronics IPO on record, and Evolent also enjoyed a jump on opening day. We expect Teladoc will be the next to step up to the plate and all its competitors (American Well, MDLive, Doctor on Demand) raised significant amounts this quarter.
Hot Fun in the Summertime: Things We Care About, Q2 2015
HEALTH 2.0 QUARTERLY REPORT :: Q2 2015
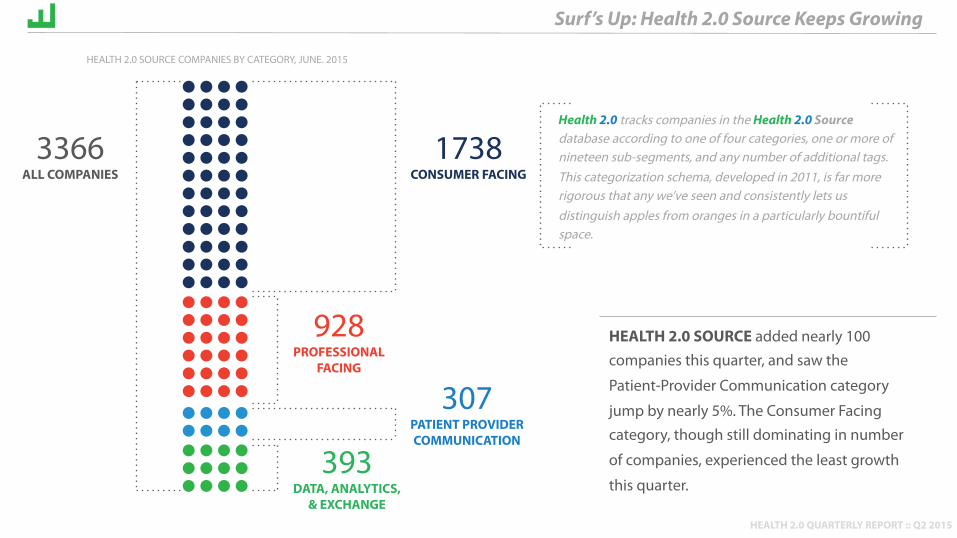
1738 CONSUMER FACING
928 PROFESSIONAL
FACING
307 PATIENT PROVIDER COMMUNICATION
393 DATA, ANALYTICS,
& EXCHANGE
3366 ALL COMPANIES
Health 2.0 tracks companies in the Health 2.0 Source database according to one of four categories, one or more of nineteen sub-segments, and any number of additional tags. This categorization schema, developed in 2011, is far more rigorous that any we’ve seen and consistently lets us distinguish apples from oranges in a particularly bountiful space.
HEALTH 2.0 SOURCE added nearly 100 companies this quarter, and saw the
Patient-Provider Communication category
jump by nearly 5%. The Consumer Facing category, though still dominating in number
of companies, experienced the least growth
this quarter.
Surf’s Up: Health 2.0 Source Keeps Growing
HEALTH 2.0 SOURCE COMPANIES BY CATEGORY, JUNE. 2015
HEALTH 2.0 QUARTERLY REPORT :: Q2 2015
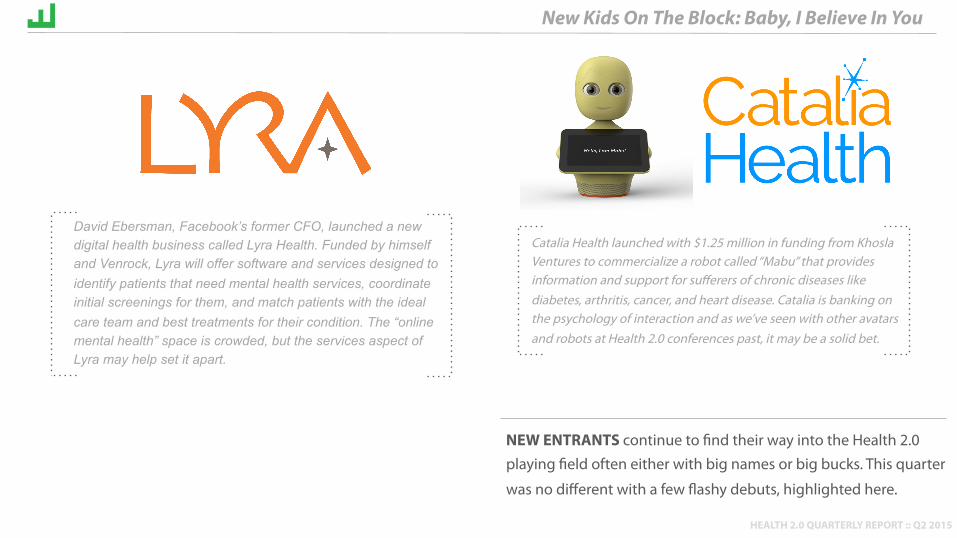
NEW ENTRANTS continue to find their way into the Health 2.0 playing field often either with big names or big bucks. This quarter
was no different with a few flashy debuts, highlighted here.
New Kids On The Block: Baby, I Believe In You
David Ebersman, Facebook’s former CFO, launched a new digital health business called Lyra Health. Funded by himself and Venrock, Lyra will offer software and services designed to identify patients that need mental health services, coordinate initial screenings for them, and match patients with the ideal care team and best treatments for their condition. The “online mental health” space is crowded, but the services aspect of Lyra may help set it apart.
Catalia Health launched with $1.25 million in funding from Khosla Ventures to commercialize a robot called “Mabu” that provides information and support for sufferers of chronic diseases like diabetes, arthritis, cancer, and heart disease. Catalia is banking on the psychology of interaction and as we’ve seen with other avatars and robots at Health 2.0 conferences past, it may be a solid bet.
HEALTH 2.0 QUARTERLY REPORT :: Q2 2015
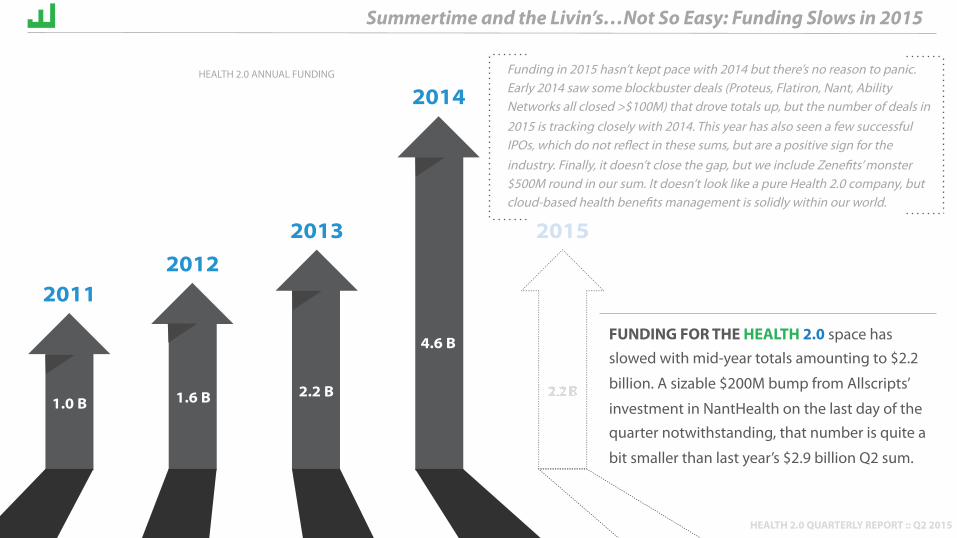
2011
1.0 B 1.6 B 2.2 B
4.6 B
20122013
2014
2015
FUNDING FOR THE HEALTH 2.0 space has slowed with mid-year totals amounting to $2.2
billion. A sizable $200M bump from Allscripts’
investment in NantHealth on the last day of the quarter notwithstanding, that number is quite a
bit smaller than last year’s $2.9 billion Q2 sum.
Summertime and the Livin’s…Not So Easy: Funding Slows in 2015
Funding in 2015 hasn’t kept pace with 2014 but there’s no reason to panic. Early 2014 saw some blockbuster deals (Proteus, Flatiron, Nant, Ability Networks all closed >$100M) that drove totals up, but the number of deals in 2015 is tracking closely with 2014. This year has also seen a few successful IPOs, which do not reflect in these sums, but are a positive sign for the industry. Finally, it doesn’t close the gap, but we include Zenefits’ monster $500M round in our sum. It doesn’t look like a pure Health 2.0 company, but cloud-based health benefits management is solidly within our world.
HEALTH 2.0 ANNUAL FUNDING
HEALTH 2.0 QUARTERLY REPORT :: Q2 2015
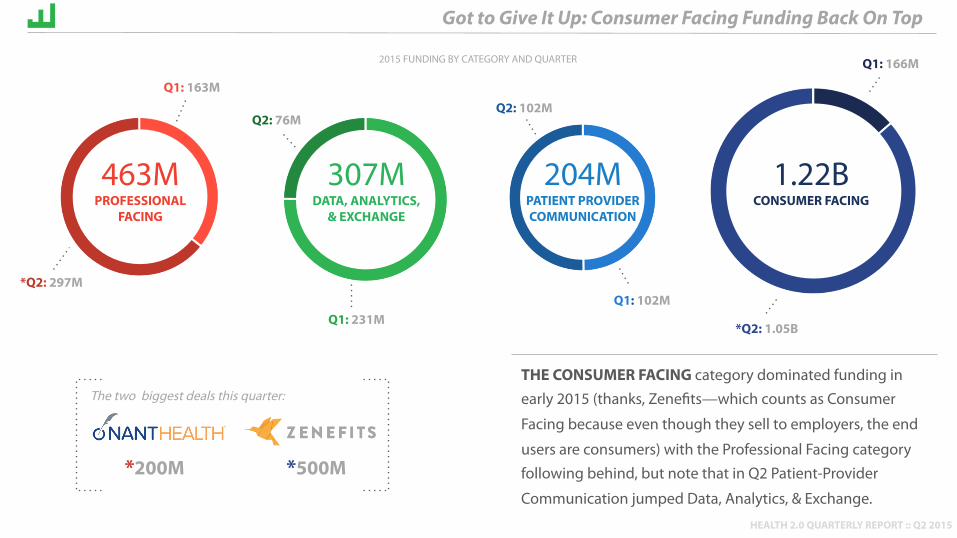
1.22B CONSUMER FACING
THE CONSUMER FACING category dominated funding in early 2015 (thanks, Zenefits—which counts as Consumer
Facing because even though they sell to employers, the end
users are consumers) with the Professional Facing category following behind, but note that in Q2 Patient-Provider
Communication jumped Data, Analytics, & Exchange.
Got to Give It Up: Consumer Facing Funding Back On Top
463M PROFESSIONAL
FACING
204M PATIENT PROVIDER COMMUNICATION
307M DATA, ANALYTICS,
& EXCHANGE
*Q2: 297M
Q1: 163M
Q1: 231M
Q2: 76M
Q1: 102M
Q2: 102M
Q1: 166M
*Q2: 1.05B
The two biggest deals this quarter:
*500M *200M
2015 FUNDING BY CATEGORY AND QUARTER
HEALTH 2.0 QUARTERLY REPORT :: Q2 2015
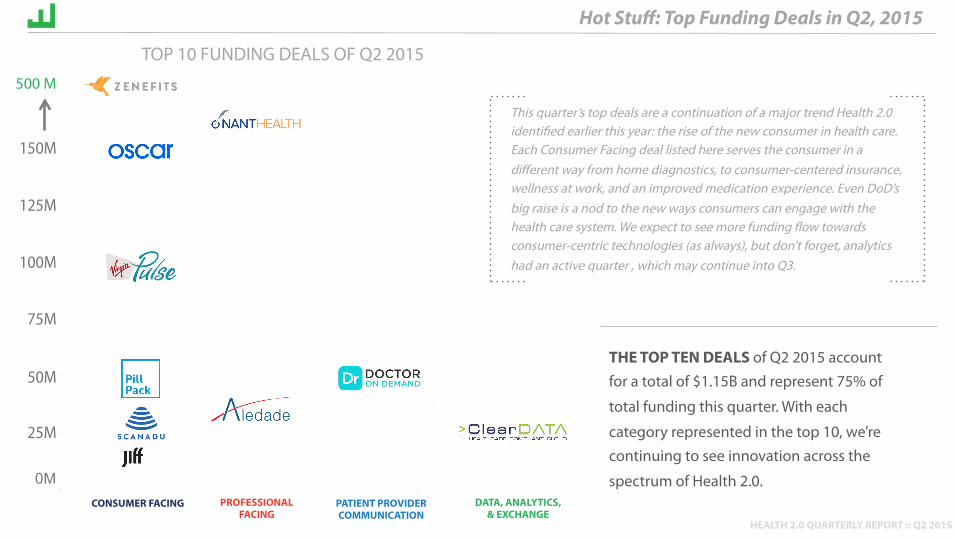
THE TOP TEN DEALS of Q2 2015 account for a total of $1.15B and represent 75% of
total funding this quarter. With each
category represented in the top 10, we’re continuing to see innovation across the
spectrum of Health 2.0.
Hot Stuff: Top Funding Deals in Q2, 2015
CONSUMER FACING PROFESSIONAL FACING
PATIENT PROVIDER COMMUNICATION
DATA, ANALYTICS, & EXCHANGE
TOP 10 FUNDING DEALS OF Q2 2015
This quarter’s top deals are a continuation of a major trend Health 2.0 identified earlier this year: the rise of the new consumer in health care. Each Consumer Facing deal listed here serves the consumer in a different way from home diagnostics, to consumer-centered insurance, wellness at work, and an improved medication experience. Even DoD’s big raise is a nod to the new ways consumers can engage with the health care system. We expect to see more funding flow towards consumer-centric technologies (as always), but don’t forget, analytics had an active quarter , which may continue into Q3.
25M
50M
75M
100M
125M
150M
500 M
HEALTH 2.0 QUARTERLY REPORT :: Q2 2015 0 100 200 300 400 500 600 700 800 900
B2B-Decision Support Analytics
Privacy & Identity
Data Utility Layer
B2B-Administrative Tools
B2B-Revenue Collection & Management
B2B-Clinician Workflow
Professional Knowledge Exchanges
Patient-Provider Communication
Provider Search
Coaching & Advisory Services
Personal Health Assessment & Diagnostic Testing
Clinical Trials Search & Recruitment
Gaming
Financial Management
Patient Communities
Search
Wellness
Content
Self-Management Tools & Trackers
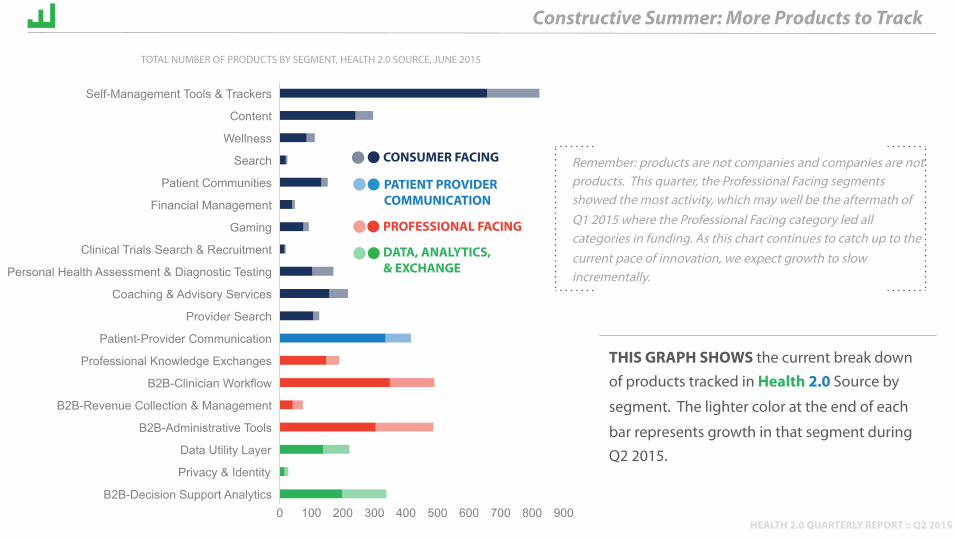
Remember: products are not companies and companies are not products. This quarter, the Professional Facing segments showed the most activity, which may well be the aftermath of Q1 2015 where the Professional Facing category led all categories in funding. As this chart continues to catch up to the current pace of innovation, we expect growth to slow incrementally.
THIS GRAPH SHOWS the current break down of products tracked in Health 2.0 Source by
segment. The lighter color at the end of each
bar represents growth in that segment during Q2 2015.
Constructive Summer: More Products to Track
CONSUMER FACING
PROFESSIONAL FACING
PATIENT PROVIDER COMMUNICATION
DATA, ANALYTICS, & EXCHANGE
TOTAL NUMBER OF PRODUCTS BY SEGMENT, HEALTH 2.0 SOURCE, JUNE 2015
HEALTH 2.0 QUARTERLY REPORT :: Q2 2015
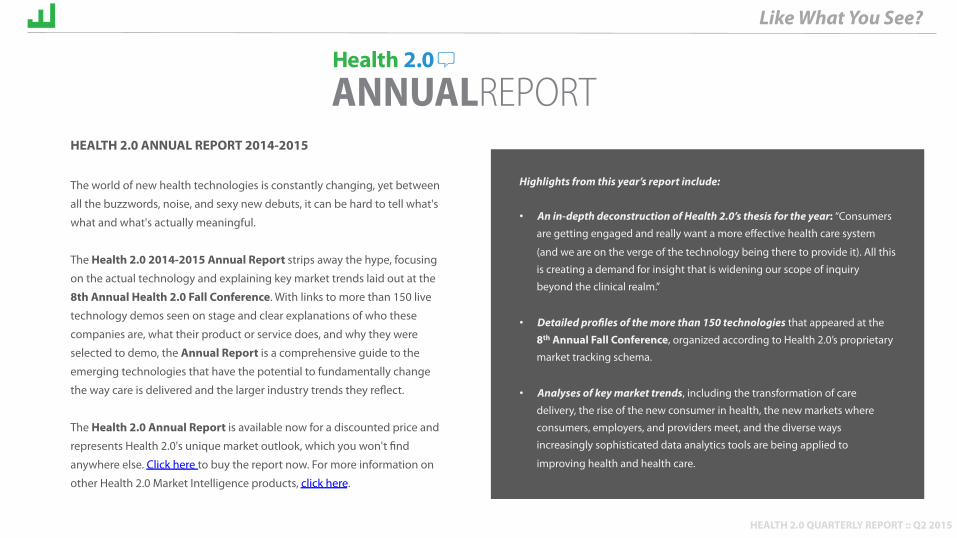
HEALTH 2.0 ANNUAL REPORT 2014-2015 The world of new health technologies is constantly changing, yet between all the buzzwords, noise, and sexy new debuts, it can be hard to tell what's what and what's actually meaningful. The Health 2.0 2014-2015 Annual Report strips away the hype, focusing on the actual technology and explaining key market trends laid out at the 8th Annual Health 2.0 Fall Conference. With links to more than 150 live technology demos seen on stage and clear explanations of who these companies are, what their product or service does, and why they were selected to demo, the Annual Report is a comprehensive guide to the emerging technologies that have the potential to fundamentally change the way care is delivered and the larger industry trends they reflect. The Health 2.0 Annual Report is available now for a discounted price and represents Health 2.0's unique market outlook, which you won't find anywhere else. Click here to buy the report now. For more information on other Health 2.0 Market Intelligence products, click here.
Like What You See?
Highlights from this year’s report include: • An in-depth deconstruction of Health 2.0’s thesis for the year: “Consumers
are getting engaged and really want a more effective health care system
(and we are on the verge of the technology being there to provide it). All this is creating a demand for insight that is widening our scope of inquiry beyond the clinical realm.”
• Detailed profiles of the more than 150 technologies that appeared at the 8th Annual Fall Conference, organized according to Health 2.0’s proprietary market tracking schema.
• Analyses of key market trends, including the transformation of care delivery, the rise of the new consumer in health, the new markets where consumers, employers, and providers meet, and the diverse ways increasingly sophisticated data analytics tools are being applied to
improving health and health care.
ANNUALREPORT
HEALTH 2.0 QUARTERLY REPORT :: Q2 2015
ABOUT HEALTH 2.0 MARKET INTEL Since 2007, Health 2.0 has catalyzed, tracked, and showcased the web, SaaS, cloud, mobile, and sensor revolution in health information technology. Our unique industry positioning and experience has given us an unrivaled depth of knowledge in the Health 2.0 space. Health 2.0 offers a comprehensive set of Market Intelligence offerings that range from this quarterly data release to a curated, contextualized newsletter, to monthly trend reports, to custom market research reports, and subscription access to the Health 2.0 Source Database. The Health 2.0 Source database serves as the foundation of our intelligence products and includes detailed data on more than 3,500 companies and 4,500 products. To learn more about Health 2.0 Market Intelligence offerings, please visit health2con.com/marketintel/market-intelligence-bundle or email [email protected]
ABOUT THE QUARTERLY REPORT The Quarterly Report represents a summary set of data that explains where industry funding is going, which product segments are growing fastest, and where new company formation is happening. Health 2.0’s precision and clarity when it comes to market segmentation and product information make this quarterly release the cream of the freebie crop. This report is provided for informational purposes and was prepared in good faith and good fun. This report is a proprietary aggregation of publicly and some privately available data and shall not be reproduced in a different format without written consent of Health 2.0
QUARTERLYREPORTS
QUARTERLY REPORT CONTRIBUTORS
Matthew Holt Co-Chairman Prerna Anand Project Manager Kim Krueger Research Analyst Rachael Charbonneau Graphic Designer
HEALTH 2.0 QUARTERLY REPORT :: Q2 2015
ABOUT Health 2.0 is the premiere showcase and catalyst for the advancement of new health technologies. Through a global series of conferences, thought leadership roundtables, developer competitions, pilot programs, and leading market intelligence, Health 2.0 drives the innovation and collaboration necessary to transform health and health care. For more information visit health2con.com
HEALTH 2.0 QUARTERLY REPORT :: Q2 2015