headwaters of the harpeth river - sitemason habitat and nutrient... · best case) bank erosion, in...
TRANSCRIPT

Headwaters of the Harpeth River
Water Quality and Habitat Study February, 2007
Authors: Mike Cain and John McFadden
Final Draft
Harpeth River Watershed Association
PO Box 1127 Franklin, Tennessee 37065
www.harpethriver.org
Headwaters of the Harpeth River, Eagleville, TN

2
Table of Contents
Introduction p.3
Methods p.4
Results p.5-6
Conclusions and Recommendations p.6-8
Summary p.8
References p.9
Appendix I – Figures Figure 1- Site Location Descriptions p.11 Figure 2 – Kelly Creek and Highway 99 p.12 Figure 3- Habitat Scores for Sites 5-19 (15, 17, 18, 20 unscored) p.12 Figure 4 – Site 10 Kelly Creek Total Nitrates p.13 Figure 5 – Site 10 Kelly Creek Total Phosphates p.13 Figure 6 – Site 10 Kelly Creek Total Turbidity p.13 Figure 7 – Site 10 Kelly Creek Stage p.13 Figure 8 – Site 5 Unnamed Tributary to Harpeth Total Nitrates p.14 Figure 9 – Site 5 Unnamed Tributary to Harpeth Total Phosphates p.14 Figure 10 – Site 5 Unnamed Tributary to Harpeth Total Turbidity p.14 Figure 11 – Site 5 Unnamed Tributary to Harpeth Stage p.14 Figure 12 – Site 13 Concord Creek Total Nitrates p.15 Figure 13 – Site 13 Concord Creek Total Phosphates p.15 Figure 14 – Site 13 Concord Creek Total Turbidity p.15 Figure 15 – Site 13 Concord Creek Stage p.15 Figure 15.1 – Site 13 Concord Creek Algae p.16 Figure 15.2 – Site 10 Kelly Creek Algae p.16 Figure 15.3 – Site 5 Unnamed Tributary Algae p.16 Figure 16 – Harpeth River Headwaters Phosphate Levels Sites 5-16 p.17 Figure 17 – Harpeth River Headwaters Nitrate Levels Sites 5-16 p.17 Figure 18 – Harpeth River Headwaters Turbidity Levels Sites 5-16 p.18 Figure 19 – Harpeth River Headwaters Flow Levels Sites 5-16 p.18 Figure 20 – Harpeth River Headwaters Algae Levels Sites 5-16 p.19
Appendix II – Table Table 1 – Average physical/chemical data collected from May 05-May 06 and habitat data collected Fall 06 p.21

3
Water Quality and Habitat Study Introduction
The Harpeth River Watershed Association (HRWA) is a 501(c)3 not for profit conservation organization. HRWA’s mission is to restore and protect the ecological health and biodiversity of the Harpeth River system for the people, fish and wildlife that depend on it by building an organization that provides scientific and technical foundation to efforts to improve and protect the river system and when applicable to influence statewide water policy. HRWA’s guiding principles establish that all work, from outreach to policy and politics, is based on a scientific and technically accurate understanding of watershed ecology and that it utilizes the vast resources of trained volunteers in every aspect of its work, including data collection and restoration. Finally, HRWA strives to work collaboratively in all possible areas with other organizations to further common goals. With the help of its science advisory council, HRWA designed and implemented the Headwaters of the Harpeth River Water Quality and Habitat Study detailed in this report.
The Tennessee Department of Environment and Conservation’s (TDEC) 2006 303(d) List
identifies the cause of degradation in the Harpeth River headwaters generally as alteration in stream-side or littoral vegetative cover, siltation and pollutant sources such as pasture grazing and removal of riparian habitat. The 303(d) List identifies Concord Creek, an unnamed tributary to the Harpeth River, Kelly Creek and Cheatham Branch as being impaired. Following is a brief description of each system’s impairment as reported by TDEC’s 303(d) List.
Fifteen and one tenth (15.1) miles of Concord Creek (TN13204018-0200) are identified
as impaired as a result of “alteration in stream-side or littoral vegetative cover and siltation” with the specific source being identified as “pasture grazing and removal of riparian habitat.” One and three tenths miles (1.3) of an unnamed tributary to the Harpeth River (TN05130204018-0300) are identified as impaired as a result of “alteration in stream-side or littoral vegetative cover and siltation” with the specific source being identified as “pasture grazing.” Nine and three tenths (9.3) miles of Kelly Creek (TN05130204018-0400) are identified as impaired as a result of “alteration in stream-side or littoral vegetative cover and siltation, E. coli” with the specific source being identified as “pasture grazing.” Three and four tenths (3.4) miles of Cheatham Branch (TN05130204018-0500) are identified as impaired as a result of “alteration in stream-side or littoral vegetative cover and siltation” with the specific source being identified as “pasture grazing.”
In addition to the 303(d) List, HRWA in 2001, conducted a visual stream assessment
(VSA) of over 200 sites along 303(d) listed stream segments. Among other things, the VSA revealed that over 50% of sites surveyed had occasional (75% of best case) or common (50% of best case) bank erosion, in addition to riparian impairment. Of the 200 plus sites, seven were in the headwaters area and the data from these sites generally indicated that wide spread habitat degradation and nutrient enrichment (see Figure 2) were problems. For example, riparian scores for the east fork of Kelly Creek were 1 (poor) out of 5 (optimal) for both right and left banks, and there were agricultural land uses noted adjacent to the stream. In addition, quality control data collected by the principle investigator indicated the same.

4
As a result of the VSA data and the 303 (d) list data, HRWA designed and implemented the Headwaters of the Harpeth River Water Quality and Habitat Study. The purpose of the study was 1) to validate the existing HRWA and TDEC data and 2) to begin to identify areas contributing to the identified impairment in an effort to begin the restoration process.
This project is funded, in part, under an agreement with the Tennessee Department of
Agriculture, Nonpoint Source Program and the U.S. Environmental Protection Agency, Assistance Agreement, #C9994674-03-0. Grant contract #GR-04-15878-00.
Methods
HRWA collected physical/chemical data and habitat quality data at 16 locations (Figure 1) in the headwaters located in Eagleville/Rockvale area in Rutherford County, Tennessee. Physical/chemical and algal information were collected nine times from May 2005 to May 2006 and included location (latitude/longitude), total nitrates, reactive phosphorus, pH, turbidity, conductivity, stage and algal growth. Habitat quality data were collected at each site once during the fall of 2005. Physical/Chemical/Algal Data HRWA collected one-liter grab samples at each location and utilized a Hach DR/890 Colorimeter for nutrient (TN method #8171, & TP method # 8048) and other parameter analysis as appropriate (e.g. turbidity method #8237). Dissolved oxygen data was acquired via LaMotte chemical test kit (model #5860), while temperature and conductivity (model #HI 8733) and pH (model #HI 93100) were collected utilizing a pair of Hanna instruments. Initially all samples were to be processed in the field, however due to the number of sites and time required to carry out sampling, nutrient samples were placed on ice and processed in the lab. Stage was measured initially in May of 2005 and recorded as base. The subsequent measurements were collected from the same prominent point on the stream overpass and recorded as difference from base. Finally, algae growth was assessed on a scale of 0 to 5 based on estimates of percent of coverage with 0 being no coverage and 5 being 100% coverage. Habitat Quality Data The habitat assessment was conducted in accordance with the EPA Rapid Bioassessment Protocols (Barbour et al., 1999) and Tennessee’s Standard Operating Protocols (TDEC, 2002). The habitat assessment consisted of 10 parameters measured visually by the investigator. For example, riparian zone, stream bank stability and available cover for aquatic life are scored from 1 – 20 at each sampling station. The total score represents the condition of habitat with reference to the specific site. Individual scores range from 0 – 20, with a maximum possible score of 200. The higher the habitat assessment score, the greater habitat suitability for fish and aquatic life.

5
Results
The purpose of the study was to further validate existing HRWA and TDEC data and to
begin to identify areas contributing to impairment in an effort to begin restoration. HRWA along with TDEC have documented physical/chemical, biological and habitat impairment in the headwaters of the Harpeth River. The results of this study include data on the physical/chemical, habitat and biological characteristics (algae) of these aquatic systems. Physical/Chemical Average and minimum/maximums for physical chemical data are included in Table 1 Appendix II. These data sets were collected over a period of one year at 16 different locations. The complete data file can be acquired from [email protected]. Data for sites 17 and 20, in Table 1 are absent, as these sites were never observed with flowing water. Figures 4–15 (Appendix I) present physical chemical data for sites 5, 10, and 13. The data generally show pollutant loads associated with increased flows as measured by stage. For example, site 13 total phosphate increased from 0.15 mg/l to 0.54 mg/l, while flow increased from 0.2 to 0.5 feet above base from February to March 2006. Turbidity also increased from 8 to 22 NTUs, while temperature almost doubled 7 to 13 degrees C. Dissolved oxygen decreased during this time period from 11.0 to 6.8 mg/l and nitrate levels decreased from 1.9 to 0.5 during the same time period. The decrease in nitrate levels may be due to increased algae activity. However, the algal measurement stayed the same (2) during this time period.
Site 10 data was similar to 13, however total phosphate decreased from 0.33 to 0.26 mg/l, while flow increased from 0.2 to 1.3 feet above base from December 2005 (no sample in January) to March 2006 (February and March flow was 1.3 feet above base). Turbidity increased from 33 to 47 NTUs while temperature increased from 9 to 14 degrees C from February to March 2006. Dissolved oxygen decreased from February to March 2006 from 9.0 to 6.8 mg/l and nitrate levels decreased from 0.5 mg/l to below detection limits during the same time period.
Figures 17 through 20 include data from sites 5, 6, 7, 8, 9, 10, 11, 12, 13, 14 and 16. These data appear to generally indicate that pollutant loading occurred during the wetter months (November, 2005 – April, 2006). However, during September 2006, turbidity data from site 11 indicate low flow sediment loading (Figure 18). During the fieldwork, it was noted that construction of a gravel road had been completed immediately adjacent to the unnamed tributary. This activity apparently was the cause of the increased turbidity levels. Habitat Quality
Habitat scores for each site are presented in Figure 3. Scores ranged from about 70 to 140 out of 200 with an average score of 92 or less than 50% of optimal habitat condition. The typical site has a highly impacted riparian zone with little of no forest buffer and failing stream banks, likely associated with livestock access and increased storm flows. In addition, habitat data indicate significant channel modification (channelization) and in-stream sedimentation. The data indicate wide spread riparian, bank and in-stream habitat degradation. Given the historic land use

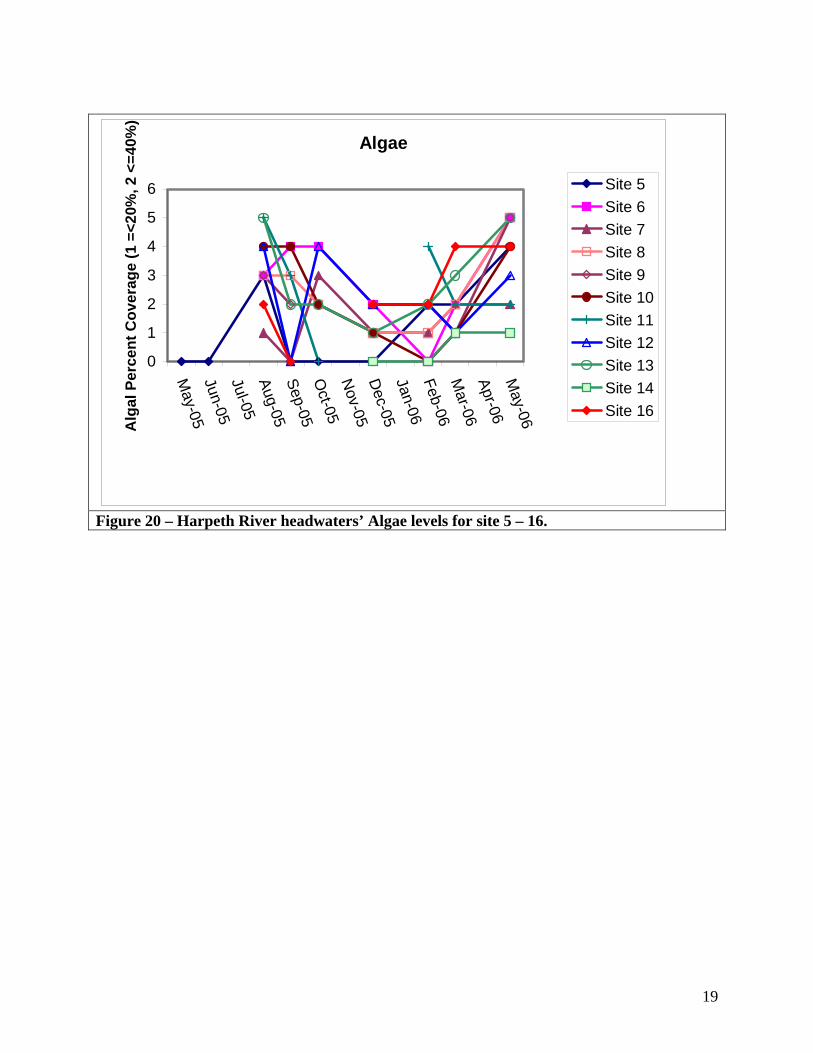
6
and propensity to channel the streams and tile (drain) surrounding lands this level of habitat degradation is not unexpected. Algae Alga percent coverage was estimated by the investigator and recorded utilizing a scale from 1 to 5, with 1 representing less than 20 percent and 5 representing greater than 80 percent surface coverage. Average algal values for each site are included in Table 1 with sites 5, 6, 7, 8, 9, 10, 11, 12, 13, 14 and 16 data presented in Figure 20. The highest values tended to occur during the month of May 2006 (nine sites), followed by the month of October 2005 (two sites). This may be related to the availability of nitrogen in the water column and associated with agricultural fertilization practices. It also appears from the data as presented in Figures 15.1, 15.2, 15.3 and 20 the level of algal coverage decreased during higher flow periods, higher nitrate and phosphate levels.
Conclusions and Recommendations The Harpeth River Watershed Association (HRWA) initiated the headwaters study to further validate existing HRWA and TDEC data and to identify areas contributing to impairment in an overall restoration effort. The study documents widespread habitat degradation, in addition to indicating existing pollutant loads are generally tied to nonpoint source pollution, however in some cases causes were observed directly related to land use changes adjacent to tributary systems. Unfortunately, the data do not indicate any one area as contributing a mass pollutant load. Conversely, the data indicate impairment appears to be a result of agricultural and municipal land use, in part resulting in wide spread habitat degradation. Habitat degradation seems to be the most obvious and widespread problem related to current land use in the headwaters. Thus, our recommendations focus on habitat restoration and include additional monitoring. Habitat Restoration HRWA has, for the past three years, met with landowners, citizens, NRCS employees and government leaders in an effort to develop a stakeholder-based watershed enhancement plan. Stakeholders recognized that channelization of the many tributary streams is not likely to be corrected. Yet, project staff working with the local Watershed Enhancement Committee, have developed a watershed enhancement plan that calls for relatively simple activities designed to increase habitat and bank stability and deal with some of the more obvious problems. The core of the restoration activities called for includes reforestation of riparian zones, stabilization of stream banks and increased sinuosity in existing channels.
Riparian reforestation consists of two basic activities, including: 1) removal of the cause
of degradation and 2) restoration of the vegetative community. In addition, some hydrologic conditions may need to be restored. Removal of the cause of degradation includes livestock exclusion and provision for alternative water supply. Alternative water supply may be provided by one of two mechanisms, placement of trough or tank outside the livestock exclusion zone or a

7
limited stable access point allowing livestock to enter the creek. Based on conversations with district conservationists, water supply points should be provided every 2,000 feet. Once livestock are excluded from the riparian zone and alternative water supply provided, riparian (buffer) restoration can occur.
The Natural Resources Conservation Service (NRCS) guidance calls for a minimum 35
foot wide buffer along rivers and streams, however, other sources call for up to a 100 foot buffer (see Wenger, 1999). HRWA should promote as wide a buffer as possible, based on land condition, landowner concerns and other factors that may apply. In an effort to leverage additional (NRCS) funds, buffers would need to be a minimum of 35 feet wide. However, because TDEC biologist (as per communication with James R. Smith) and others have observed improvements in water quality associated with one row of trees along creek banks, and because land owner objections often have to do with loss of land to graze, crop etc. HRWA recommends as much width as possible, but in some cases suggests working to reestablish minimal riparian zones (e.g. one row of trees).
Finally, in some cases it may be necessary to restore natural hydrology to the riparian
zone. In cases where aquatic systems are severely down cut or where channels have formed through the riparian zone, bypassing sheet flow and thus pollutant load reductions associated with the filtration capacity of the riparian zone. In addition, it may be desirable to add in stream structures to increase a system’s ability to carry its bed load. For example a series of check dams, j-vanes or other appropriate structures may be used to increase velocity and/or sinuosity within an existing channel. However, in doing this one should pay particular attention to opposing banks to make sure the structure does not create additional erosion. Proper installation of structures is the key to proper functioning.
Stream bank stabilization should be carried out along roughly 10% of stream banks.
Stream bank erosion is a significant problem in the headwaters of the Harpeth River and thus treating all stream banks is not cost-effective or practical. HRWA recommends the following prioritizing scheme; areas where specific ecological assets, such as mature trees are located should be treated first and then areas thought to be contributing significant soil to the system second. For example, streams with one row or scattered trees on a highly erosive stream bank would be treated in a effort to protect and save those trees providing shade and detrital material (habitat and food) to the system (ecological asset). Secondly, in systems impacted by sediment, long, highly erosive segments may be treated. This should provide for the greatest load reductions at the least cost. Utilizing the HRWA Bank Erosion Study (McFadden, 2006) the following formula can be utilized to calculate an estimated sediment load (ESL):
ESL = ((bh/9.17) x 0.143) x L
Where: ESL = Sediment loss in cubic yards per foot
bh = bank height to be treated 9.17 feet = average bank height from HRWA Bank Erosion study 0.143 cubic yards = soil loss/foot per year in HRWA Bank Erosion Study L = Length of bank to be treated
8
The primary method utilized to treat eroding stream banks should be placement of cedar revetments, possibly with reshaping of banks, back fill and revegetation. HRWA continues to utilize cedar revetment to treat banks as high as 12 feet and generally found them effective in reducing stream bank erosion. HRWA utilizes a technique developed by Jen-Hill Construction for cedar revetments. The process is the same as Natural Resources Conservation Service, except cedar trees are bundled in coir matting or jute, prior to being attached to the stream bank. The coir matting or jute helps capture sediment by allowing branches to be more compact. In addition, the revetment can be backfilled and re-vegetated immediately following installation promoting bank stability and habitat quality in the short term. Monitoring HRWA recommends additional physical/chemical and biological monitoring be carried out. First, it is believed that greater pollutant loads result from non -point source events than were observed during this study. Because the study was carried out during a time of minimal rainfall, high flow data may not reflect the upper end of pollutant loadings associated with storm events. Thus, additional storm event/high flow sampling should be carried out. One sampling of all sites during the first flush of pollutants would speak volumes relative to pollutant loadings and source. This might be best accomplished with automatic samplers or volunteers.
HRWA recommends that benthic sampling be conducted at all major and minor tributaries. Initially, benthic organisms should be keyed out to the order level, and then selected sites processed to genus level. The initial screening level (order) can be conducted by volunteers and will allow project biologists to begin to assess if all systems are impaired. Areas along Kelly Creek and Concord Branch appear to have sub-optimal to optimal habitat and thus may not have the level of impairment when compared to other sites with poor habitat. Once the order level benthic macro-invertebrate inventory (BMI) survey is conducted, project biologists can carry out genus-level assessment. Once this is done, additional questions relative to source may be answered based on pollutant specific tolerance of benthic organisms thereby driving more specific restoration needs.
Summary
The purpose of the study was to add to an already existing body of information collected by HRWA and TDEC regarding impairment and subsequent 303 (d) listing of the headwaters of the Harpeth River and to begin to identify areas contributing pollutant loadings to impairment in an effort to begin restoration activities. While the study did document higher pollutant loading in headwater tributaries, none stood out as a large single source. However, it was clear from the data large scale in stream, bank, and riparian habitat degradation has occurred over time. This appears to be primarily related to a historical agricultural land use. Fortunately, many of these “sources’ of habitat impairment can be easily and to some degree cost – effectively mitigated.
Although the activity referenced in this publication has been financed, in part, with the
Sate and/or federal fund, the mention of trade names or commercial products does not constitute endorsement or reformation by the State or the Environmental Protection Agency.

9
References
Barbour, M., Gerritsen, J., Snyder, B., & Stribling, J. 1999. Rapid Bioassessment Protocols for use in Streams and Wadeable Rivers: Periphyton, Benthic Macroinvertebrates, and Fish. Second Edition. USEPA Report. EPA 841-B-99-002. Washington, DC.
McFadden. 2006. “Stream Bank Erosion: So how much sediment does stream bank erosion
contribute?” Presented at the 2006 Kentucky/Tennessee Water Environment Federation meeting. Nashville, Tennessee.
McFadden, J. and D. Bolze, 2004. Volunteer Visual Assessment of 303(d) Listed Streams:
Implications For Resource Managers. In proceedings of 14th Annual Tennessee Water Resources Symposium. Burns, Tennessee.
Plafkin, J.L., M.T. Barbour, K.D. Porter, S.K. Gross and R.M. Hughes. 1989. Rapid
Bioassessment Protocols For Use in Streams and Rivers: Benthic Macroinvertebrates and Fish. EPA/440/4-89/00/, Washington, D.C.
Tennessee Department of Environment of Conservation (TDEC). 2002 (revised November 2003).
Quality System Standard Operating Procedure for Macroinvertebrate Stream Surveys. Nashville, TN 58pp.

10
Appendix 1 – Figures

11
Figure 1- Site Location Descriptions

12
Figure 2 – Kelly Creek and Highway 99, Rutherford County Tennessee
0
20
40
60
80
100
120
140
160
Hab
itat S
core
s (2
00 M
ax)
5 6 7 8 9 10 11 12 13 14 16 19
Site No.
Harpeth River Headwaters Fall 2006 Habitat Scores
Figure 3 – Habitat scores for sites 5 – 19 (15, 17, 18 and 20 were not scored)

13
Total Nitrates Location 10
0.0
0.2
0.4
0.6
0.8
1.0
May-05
Jul-0
5
Sep-05
Nov-05
Jan-0
6
Mar-06
May-06
mg/
L
Total Phosphate Location 10
0.000.100.200.300.40
May-05
Jul-0
5
Sep-05
Nov-05
Jan-0
6
Mar-06
May-06
mg/
L
Figure 4 – Site 10 Kelly Creek Total Nitrates Figure 5 – Site 10 Kelly Creek Total Phosphate
Turbidity Location 10
0
10
20
30
40
50
May-05
Jul-0
5
Sep-05
Nov-05
Jan-0
6
Mar-06
May-06
NTU
's
Stage
00.20.40.60.8
11.21.4
May-05
Jul-0
5
Sep-05
Nov-05
Jan-0
6
Mar-06
May-06
Feet
Figure 6 – Site 10 Kelly Creek Turbidity Figure 7 – Site 10 Kelly Creek Stage

14
Total Nitrates Location 5
00.20.40.60.8
11.2
May-05
Jul-0
5
Sep-05
Nov-05
Jan-0
6
Mar-06
May-06
mg/
L
Total Phosphate Location 5
0.00
0.10
0.20
0.30
0.40
May-05
Jul-0
5
Sep-05
Nov-05
Jan-0
6
Mar-06
May-06
mg/
L
Figure 8 – Site 5 Unnamed Tributary to Harpeth River Total Nitrates
Figure 9 – Site 5 Unnamed Tributary to Harpeth River Total Phosphates
Turbidity Location 5
05
10
152025
May-05
Jul-0
5
Sep-05
Nov-05
Jan-0
6
Mar-06
May-06
NTU
's
Stage
-0.50
0.51
1.52
2.53
3.5
May-05
Jul-0
5
Sep-05
Nov-05
Jan-0
6
Mar-06
May-06
Feet
Figure 10 – Site 5 Unnamed Tributary to Harpeth River Turbidity
Figure 11 – Site 5 Unnamed Tributary to Harpeth River Stage

15
Total Nitrates Location 13
0.0
0.5
1.0
1.5
2.0
May-05
Jul-0
5
Sep-05
Nov-05
Jan-0
6
Mar-06
May-06
mg/
L
Total Phosphate Location 13
0.000.100.200.300.400.500.60
May-05
Jul-0
5
Sep-05
Nov-05
Jan-0
6
Mar-06
May-06
mg/
L
Figure 12 – Site 13 Concord Creek Total Nitrates
Figure 13 – Site 13 Concord Creek Total Phos.
Turbidity Location 13
05
10152025
May-05
Jul-0
5
Sep-05
Nov-05
Jan-0
6
Mar-06
May-06
NTU
's
Stage
00.10.20.30.40.50.6
May-05
Jul-0
5
Sep-05
Nov-05
Jan-0
6
Mar-06
May-06
Feet
Figure 14 – Site 13 Concord Creek Turbidity
Figure 15 – Site 13 Concord Creek Stage

16
Algae Location 13
0123456
28-M
ay-05
27-Ju
n-05
5-Aug
-05
18-S
ep-05
20-O
ct-05
9-Dec
-05
7-Feb
-06
14-M
ar-06
12-M
ay-06
scal
e 0
- 5
Algae Location 10
012345
28-M
ay-05
27-Ju
n-05
5-Aug
-05
18-S
ep-05
20-O
ct-05
9-Dec
-05
7-Feb
-06
14-M
ar-06
12-M
ay-06
scal
e 0
- 5
Figure 15.1 – Site 13 Concord Creek Algae Figure 15.2 – Site 10 Kelly Creek Algae
Algae Location 5
012345
28-M
ay-05
27-Ju
n-05
5-Aug
-05
18-S
ep-05
20-O
ct-05
9-Dec
-05
7-Feb
-06
14-M
ar-06
12-M
ay-06
scal
e 0
- 5
Figure 15.3 – Site 5 Unnamed Tributary to Harpeth River Algae

17
Phosphate levels
0.00
0.20
0.40
0.60
0.80
1.00
May-05
Jun-05Jul-05
Aug-05Sep-05O
ct-05
Nov-05
Dec-05
Jan-06Feb-06M
ar-06Apr-06
May-06
mg/
L
Site 5Site 6Site 7Site 8Site 9Site 10Site 11Site 12Site 13Site 14Site 16
Figure 16 – Harpeth River headwaters’ Phosphate levels sites 5 – 16 May 2005 to May 2006.
Nitrate Levels
00.20.40.60.8
11.21.41.61.8
2
May-05
Jun-05Jul-05Aug-05Sep-05O
ct-05N
ov-05D
ec-05Jan-06Feb-06M
ar-06Apr-06M
ay-06
mg/
L
Site 5Site 6Site 7Site 8Site 9Site 10Site 11Site 12Site 13Site 14Site 16
Figure 17 – Harpeth River headwaters’ Nitrate levels for site 5 – 16.

18
Turbidity
0
50
100
150
200
250
May-05
Jun-05Jul-05Aug-05Sep-05O
ct-05N
ov-05D
ec-05Jan-06Feb-06M
ar-06Apr-06M
ay-06
NTU
's
Site 5Site 6Site 7Site 8Site 9Site 10Site 11Site 12Site 13Site 14Site 16
Figure 18 – Harpeth River headwaters’ Turbidity levels for site 5 – 16.
Flow
-5
0
5
10
15
20
25
May-05
Jun-05Jul-05Aug-05Sep-05O
ct-05N
ov-05D
ec-05Jan-06Feb-06M
ar-06Apr-06M
ay-06
Diff
from
bas
e
Site 5Site 6Site 7Site 8Site 9Site 10Site 11Site 12Site 13Site 14Site 16
Figure 19 – Harpeth River headwaters’ flow levels for site 5 – 16.
19
Algae
0
1
2
3
4
5
6
May-05
Jun-05Jul-05Aug-05Sep-05O
ct-05N
ov-05D
ec-05Jan-06Feb-06M
ar-06Apr-06M
ay-06Alg
al P
erce
nt C
over
age
(1 =
<20%
, 2 <
=40%
)
Site 5Site 6Site 7Site 8Site 9Site 10Site 11Site 12Site 13Site 14Site 16
Figure 20 – Harpeth River headwaters’ Algae levels for site 5 – 16.

20
Appendix II Tables

21
Table 1 - Average physical / chemical data collected from May 2005 – May 2006 and Habitat data collected fall 2006 Site #/ Parameter
5* 6 7 8 9 10 11 12 13 14 15 16 17 *3
18 19 20 ****
Stage (ft)
1.65
1.73
-.04
0.14
0.20
0.41
0.28
0.19
0.10
0.58
0.12
0.35
0.08
0.22
Phosphate (mg/l)
0.24
0.38
0.74
0.21
0.13
0.24
0.26
0.22
0.20
0.15
0.14
0.56
0.73
0.97
Nitrate (mg/l)
0.5 0.5 0.4 0.2 0.2 0.4 0.2 0.2 0.5 0.2 0.2 0.1 0.5 0.2
Temp (deg. C)
10.5
17.1
20.9
18.9
18.9
19.3
20.4
17.6
18.1
8.6 6.0 16.9
13.0
11.7
Turbudity (ntu)
12 20 10 15 15 19 77 19 9 14 4 21 3 8
pH (SU)
8.34
7.86
8.48
8.12
8.16
7.97
8.70
7.90
8.07
7.89
8.26
8.5 8.53
8.10
Dissolved Oxygen (mg/l)
7.9 6.5 8.0 7.8 7.9 7.8 8.3 6.7 6.9 7.2 8 7.7 11 8.8
Condu. (u/S)
376
383
421
367
417
336
266
286
328
302
268
348
492
382
Habitat scores (/200) *1
136
111
70 79 94 69 59 98 74 96 *2 75 *2 145
Algae (1 – 5)
2.75
3.3 1.43
2.43
2.5 2.67
3.2 2.29
2.9 0.5 1.0 2.33
0 3
* Site # 5 – 20 (1 – 4 were in another watershed) *1 habitat scores are from one sample *2 not scored *3 - never scored due to lack of water