head start class data - eclkcthe office of head start (ohs) is pleased to share this report...
TRANSCRIPT
R
Fall 2016
Report onHead Start CLASS®
DataFiscal Years 2012-2015

IntroductionThe Office of Head Start (OHS) is pleased to share this report regarding the
use of the CLASS Pre-K® instrument during monitoring reviews of Head Start
grantees. Information is provided about the national CLASS® scores and about the
characteristics of the grantees. Information on the teachers, children, and classroom
activities also is presented. Regional and state scores are included at the end of the
report. Throughout the report, there are questions for you to think about.
We hope that this information stimulates dialogue about quality improvement –
with appreciation of the steps your program has already taken and ideas about
what it can do in the future.

INTRODUCTION 3
Using CLASS® in Head Start
The Improving Head Start for School
Readiness Act of 2007 requires that
the OHS monitoring review process
include the use of “a valid and
reliable research-based observational
instrument…that assesses classroom
quality…” The Act also states that
such an instrument should be used
as part of the system for designation
renewal (re-competition of grantees).
After extensive review of different instruments, leading early childhood experts agreed
that the Classroom Assessment Scoring System (CLASS Pre-K®) was the instrument that
best met the statutory requirements. Since the fall of 2011, CLASS Pre-K® has been used
during monitoring reviews in center-based Head Start programs.

INTRODUCTION4
What is CLASS®?
CLASS® is an observation tool
that assesses the quality of
teacher-child interaction in center-
based preschool programs.
CLASS® includes three domains
or categories of teacher-child
interaction that support children’s
learning and development. Within
each domain are dimensions that
capture more specific details of
teacher-child interaction.
The three domains are
❚ Emotional Support (ES) assesses the degree to which teachers establish and promote a positive climate in their classrooms through everyday interactions.
❚ Classroom Organization (CO) assesses classroom routines and procedures related to the organization and management of children’s behavior, time and attention in the classroom.
❚ Instructional Support (IS) assesses the ways in which teachers implement the curriculum to effectively promote cognitive and language development.
CLASS® is scored by trained and certified observers using a specific protocol. CLASS®
evaluations are on a 7-point scale. Scores of 1-2 mean that the quality of teacher-child
interaction is low. Scores of 6-7 mean that effective interactions are consistently observed.
Scores are reported at the grantee level.

INTRODUCTION 5
Reporting Head Start CLASS® Data
This report highlights findings from the national data set over a period of
four fiscal years (FY) 2012 – 2015. A fiscal year extends from October 1 to
September 30, which roughly corresponds to the program year. For example,
fiscal year 2012 goes from October 1, 2011 to September 30, 2012. The
monitoring cycle follows the fiscal year.
In this report, the term grantee includes delegate agencies.

INTRODUCTION6
Snapshot of Head Start
Head Start promotes the school
readiness of young children,
birth to age 5, from low-income
families through agencies in their
local community. In addition to
education services, programs
provide children and their families
with health, nutrition, social, and
other services. Programs build
relationships with families that
support positive parent-child relationships, family well-being, and connections to peers
and community. Head Start services are responsive to each child and family’s ethnic,
cultural, and linguistic heritage.
Think About...
» What kind of conversations about CLASS®
does your program have with staff, parents,
and the community?
» What do your program scores look like? What
are the practices or procedures that might
impact the scores?

INTRODUCTION 7
In 2015, Head Start programs operated approximately 48,000 pre-school classes. This includes American Indian and Alaska Native Head
Start programs and Migrant and Seasonal Head Start programs.
In 2015, Head Start programs had a total funded enrollment of 821,000 children. This includes American Indian and Alaska Native
Head Start programs and Migrant and Seasonal Head Start programs.
Note: Data collected from the Program Information Report (PIR)
Note: Data collected from the Program Information Report (PIR)
National CLASS® Scores
9NATIONAL CLASS SCORES
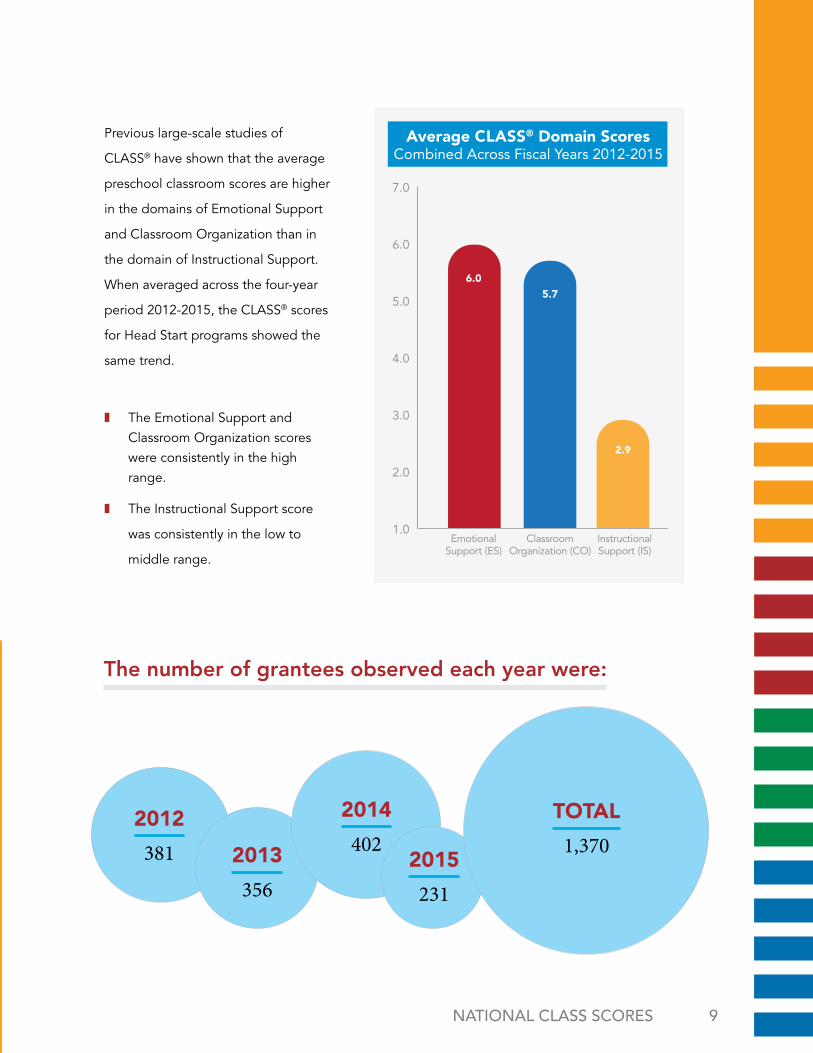
Previous large-scale studies of
CLASS® have shown that the average
preschool classroom scores are higher
in the domains of Emotional Support
and Classroom Organization than in
the domain of Instructional Support.
When averaged across the four-year
period 2012-2015, the CLASS® scores
for Head Start programs showed the
same trend.
❚ The Emotional Support and Classroom Organization scores were consistently in the high range.
❚ The Instructional Support score
was consistently in the low to
middle range.
7.0
6.05.7
2.9
6.0
5.0
4.0
3.0
2.0
1.0Emotional
Support (ES)Classroom
Organization (CO)InstructionalSupport (IS)
2012
381 2013
356
2014
4022015
231
TOTAL
1,370
The number of grantees observed each year were:
Average CLASS® Domain ScoresCombined Across Fiscal Years 2012-2015

NATIONAL CLASS SCORES10
Highest Domain Scores
Many grantees received high domain scores during their CLASS® reviews. Across the
four-year period 2012 – 2015.
❚ 721 grantees received a score of 6 or higher in Emotional Support. Over 50 percent of the grantees received these high scores.
❚ 321 grantees received a score of 6 or higher in Classroom Organization. Nearly 25 percent of the grantees received these high scores.
❚ 189 grantees received a score of 3.5 or higher in Instructional Support. About 14 percent of the grantees received these scores.

11NATIONAL CLASS SCORES
The maximum score achieved by any
grantee during the CLASS® review was:
❚ 7.0 in Emotional Support
❚ 7.0 in Classroom Organization
❚ 5.7 in Instructional Support
Think About...
» In your program, do the domain scores look like the
national average? Are there any major differences
and what might account for them?
» Consider how various factors, such as professional
development in your program, might impact CLASS®
scores. Examine other factors, such as grantee
characteristics and teacher qualifications, which are
discussed in the following pages.
Emotional Support
Classroom Organization
Instructional Support
5.7
7.0
7.0
Grantee Characteristics

13GRANTEE CHARACTERISTICS
Grantee Type
Head Start grantees include school systems, community action agencies, other government
agencies, private and public non-profits, and Tribal government or consortium agencies.
Across the four-year period 2012-2015, 1,370 grantees participated in the CLASS® reviews,
ranging from very small (127 grantees) to super grantees (10 grantees).
Grantee Type with Completed CLASS® ObservationsFiscal Years 2012 - 2015
2012 2013 2014 2015
Community Action Agency 38% 41% 39% 35%
Government Agency 5% 8% 7% 8%
Private/Public For Profit <1% <1% <1% <1%
Private/Public Non-Profit 29% 25% 27% 37%
School System 14% 20% 16% 17%
Tribal Government 14% 6% 9% 3%

GRANTEE CHARACTERISTICS 14
7.0
6.0
5.0
4.0
3.0
2.0
1.0
Community Action Agency
Government Agency
Private/Public For Profit
Private/Public Non-Profit
School System Tribal Government
Grantee Type
6.0
5.6
2.9
6.0
5.6
2.8
6.15.9
2.6
6.0
5.7
2.9
6.05.8
3.0
6.0
5.6
2.6
Emotional Support (ES) Classroom Organization (CO)
Instructional Support (IS)
❚ Across grantee types, Emotional Support and Classroom Organization scores were consistently in the high range. Instructional Support scores were consistently in the low to middle range.
Average CLASS® Domain Scores by Grantee TypeCombined Across Fiscal Years 2012-2015

15GRANTEE CHARACTERISTICS
Think About...
» In your program, which photos or videos could
you share with staff, families, and community
members to demonstrate high-quality
emotional support, classroom organization,
and instructional support?
GRANTEE CHARACTERISTICS 16
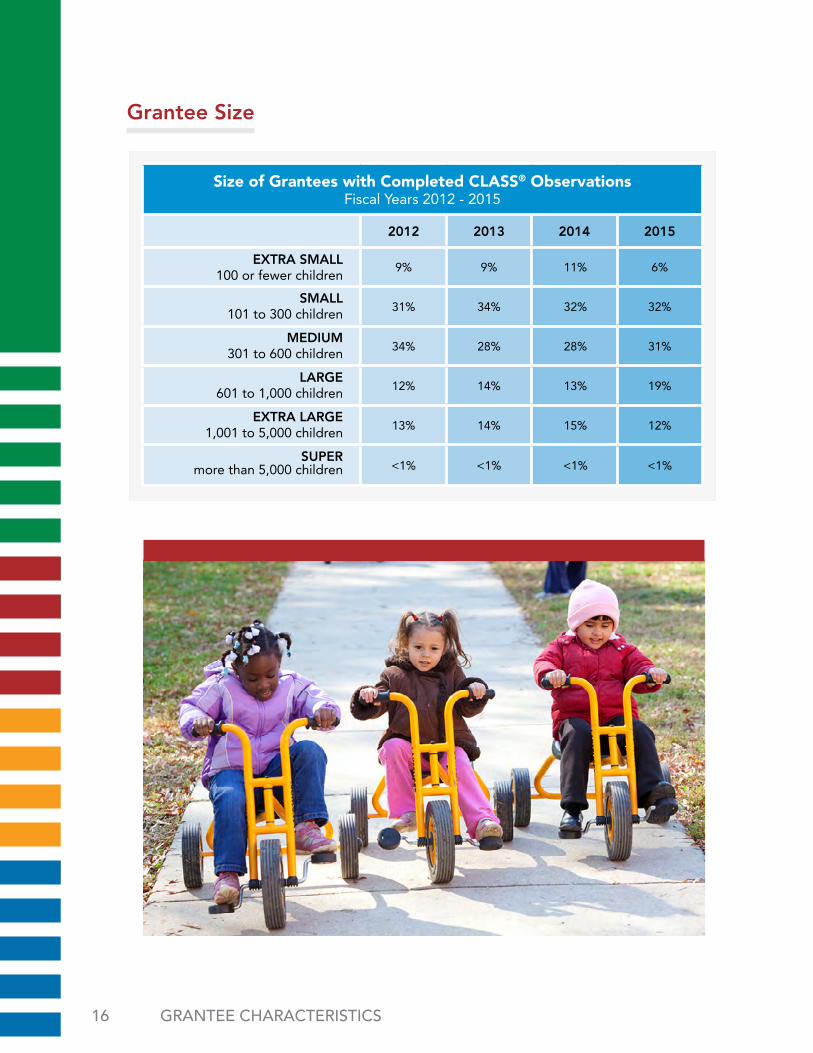
Size of Grantees with Completed CLASS® ObservationsFiscal Years 2012 - 2015
2012 2013 2014 2015
EXTRA SMALL100 or fewer children
9% 9% 11% 6%
SMALL101 to 300 children 31% 34% 32% 32%
MEDIUM301 to 600 children 34% 28% 28% 31%
LARGE601 to 1,000 children 12% 14% 13% 19%
EXTRA LARGE1,001 to 5,000 children 13% 14% 15% 12%
SUPERmore than 5,000 children <1% <1% <1% <1%
Grantee Size

17GRANTEE CHARACTERISTICS
❚ Regardless of grantee size, Emotional Support and Classroom Organization scores were consistently in the high range. Instrumental Support scores were consistently in the low to middle range.
❚ Extra small grantees had higher scores in all domains compared to extra large and super grantees.
7.0
2.9
6.0
5.0
4.0
3.0
2.0
1.0
Emotional Support (ES) Classroom Organization (CO)
Instructional Support (IS)
Extra Small Small Medium Large Extra Large Super
6.15.8
2.9
6.0
5.7
6.05.7
2.9
6.0
5.6
2.8
5.9
5.6
2.7
5.8
5.5
2.7
Grantee Size
Average CLASS® Domain Scores by Grantee TypeCombined Across Fiscal Years 2012-2015
Think About...
» What might account for the
differences in scores based on
grantee size?
» What advantages might extra
small grantees have?
» How large is your grantee?
Do you think that your program
size affects the quality of teacher-
child interactions?

Teacher Qualifications

19TEACHER QUALIFICATIONS
❚ Grantees with a higher
percentage of teachers with
Bachelor’s degrees had higher
CLASS® scores on average than
programs with fewer teachers
with Bachelor’s degrees.
Think About...
» In your program, are there
opportunities for staff to
obtain course credits or work
toward a degree?
» How does your program
encourage staff to share their
knowledge or reflect on their
teaching practices?
Child Characteristics

21CHILD CHARACTERISTICS
Approximately 13 percent of the children
observed during CLASS® interactions were
identified as children with Individualized
Education Programs (IEPs).
❚ Grantees with high percentages of children with IEPs had slightly higher CLASS® scores in each domain including Instructional Support.
OHS requires that the CLASS® reviewer
be fluent in the predominant language
used in the classroom. Spanish language
competency is evaluated for CLASS®
reviewers who are assigned to conduct
observations in programs and/or classrooms
where Spanish is the dominant language spoken by the children. There are no reviewers
available who are fluent in other home languages spoken by children.
❚ There were no differences in the CLASS® scores of grantees with high percentages of children whose dominant language was Spanish.
Think About...
» In your program, do you think that classrooms with more
children with IEPs have higher quality teacher-child interaction?
Why or why not?
» How can the positive teaching practices associated with children
with IEPs be implemented with children who do not have IEPs?
» How does your program ensure that teacher interactions
with children who are dual language learners are high-quality
interactions across the CLASS® domains?

Classroom Activities
23CLASSROOM ACTIVITIES
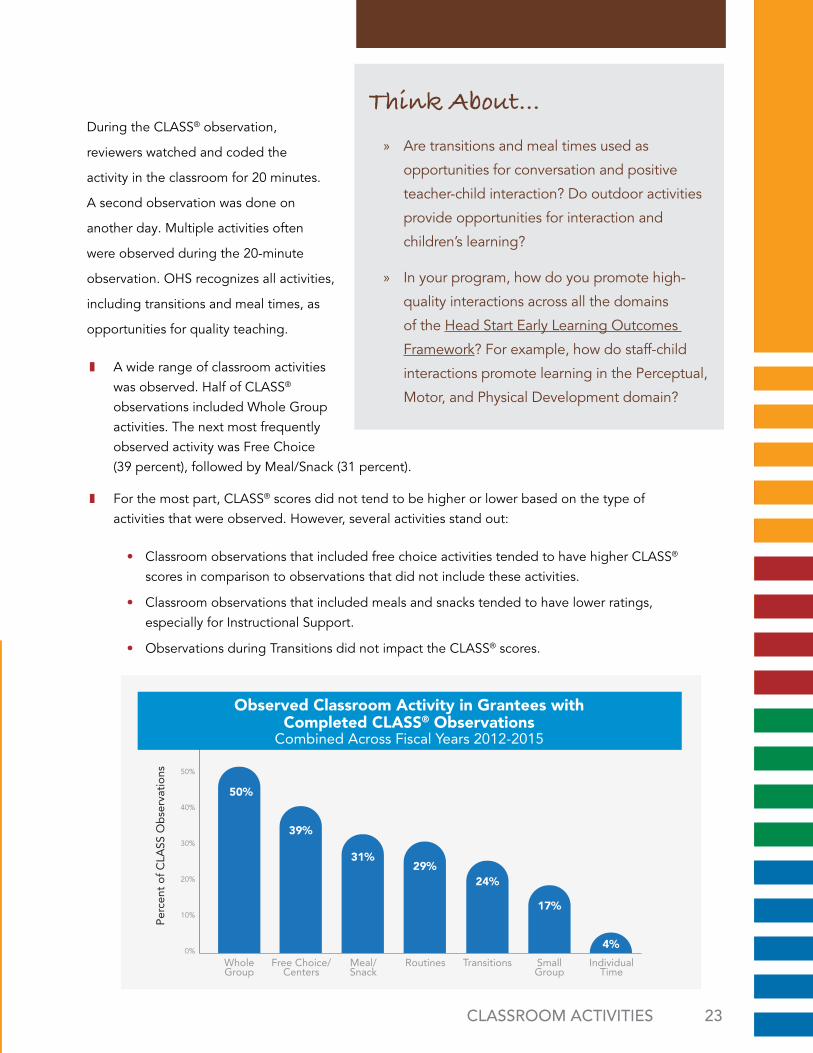
During the CLASS® observation,
reviewers watched and coded the
activity in the classroom for 20 minutes.
A second observation was done on
another day. Multiple activities often
were observed during the 20-minute
observation. OHS recognizes all activities,
including transitions and meal times, as
opportunities for quality teaching.
❚ A wide range of classroom activities was observed. Half of CLASS® observations included Whole Group activities. The next most frequently observed activity was Free Choice (39 percent), followed by Meal/Snack (31 percent).
❚ For the most part, CLASS® scores did not tend to be higher or lower based on the type of activities that were observed. However, several activities stand out:
• Classroom observations that included free choice activities tended to have higher CLASS® scores in comparison to observations that did not include these activities.
• Classroom observations that included meals and snacks tended to have lower ratings, especially for Instructional Support.
• Observations during Transitions did not impact the CLASS® scores.
60%
70%
80%
90%
100%
50%
40%
30%
20%
10%
0%
WholeGroup
Perc
ent
of C
LASS
Ob
serv
atio
ns
50%
Free Choice/ Centers
39%
Meal/Snack
31%
Routines
29%
Transitions
24%
Small Group
17%
Individual Time
4%
Observed Classroom Activity for Fiscal Years 2012-2015
Think About...
» Are transitions and meal times used as
opportunities for conversation and positive
teacher-child interaction? Do outdoor activities
provide opportunities for interaction and
children’s learning?
» In your program, how do you promote high-
quality interactions across all the domains
of the Head Start Early Learning Outcomes
Framework? For example, how do staff-child
interactions promote learning in the Perceptual,
Motor, and Physical Development domain?
Observed Classroom Activity in Grantees with Completed CLASS® Observations
Combined Across Fiscal Years 2012-2015

CLASSROOM ACTIVITIES24
Do Grantees Use Observational Tools?
The answer is overwhelmingly YES
– in fiscal year 2015, 96 percent
of Head Start programs reported
that they used an observation
tool or instrument, including
CLASS®, to measure teacher-child
interaction. The purpose was to
plan professional development and
improve classroom quality.
Note: Data collected from the Program Information Report (PIR)
In 2015, 96 percent of Head Start programs used a staff-child interaction observation tool.
25CLASSROOM ACTIVITIES
Think About...
» Did the requirements of the Act of 2007 lead your program
to implement a more systematic approach to observing
teachers and providing them with feedback?
» Which tool does your program use to measure teacher-
child interaction? If the CLASS® tool is not being used, does
the alternative assess how the teacher uses instructional
strategies?
» Are the results shared with individual teachers to help them
reflect on and improve their teaching practices?
» Are the results used to target areas needing improvement
and to plan professional development?
STATE AND REGION SCORES
27STATE AND REGION SCORES
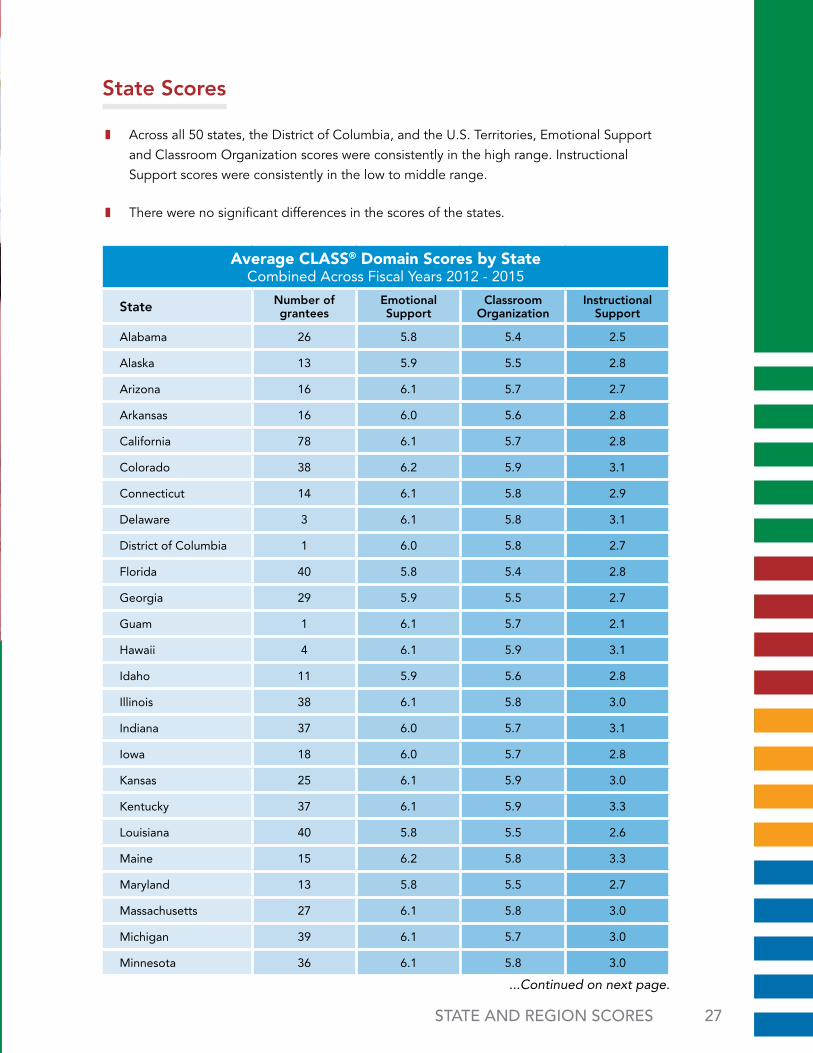
Average CLASS® Domain Scores by State Combined Across Fiscal Years 2012 - 2015
State Number of grantees
Emotional Support
Classroom Organization
Instructional Support
Alabama 26 5.8 5.4 2.5
Alaska 13 5.9 5.5 2.8
Arizona 16 6.1 5.7 2.7
Arkansas 16 6.0 5.6 2.8
California 78 6.1 5.7 2.8
Colorado 38 6.2 5.9 3.1
Connecticut 14 6.1 5.8 2.9
Delaware 3 6.1 5.8 3.1
District of Columbia 1 6.0 5.8 2.7
Florida 40 5.8 5.4 2.8
Georgia 29 5.9 5.5 2.7
Guam 1 6.1 5.7 2.1
Hawaii 4 6.1 5.9 3.1
Idaho 11 5.9 5.6 2.8
Illinois 38 6.1 5.8 3.0
Indiana 37 6.0 5.7 3.1
Iowa 18 6.0 5.7 2.8
Kansas 25 6.1 5.9 3.0
Kentucky 37 6.1 5.9 3.3
Louisiana 40 5.8 5.5 2.6
Maine 15 6.2 5.8 3.3
Maryland 13 5.8 5.5 2.7
Massachusetts 27 6.1 5.8 3.0
Michigan 39 6.1 5.7 3.0
Minnesota 36 6.1 5.8 3.0
State Scores
❚ Across all 50 states, the District of Columbia, and the U.S. Territories, Emotional Support and Classroom Organization scores were consistently in the high range. Instructional Support scores were consistently in the low to middle range.
❚ There were no significant differences in the scores of the states.
...Continued on next page.
STATE AND REGION SCORES 28
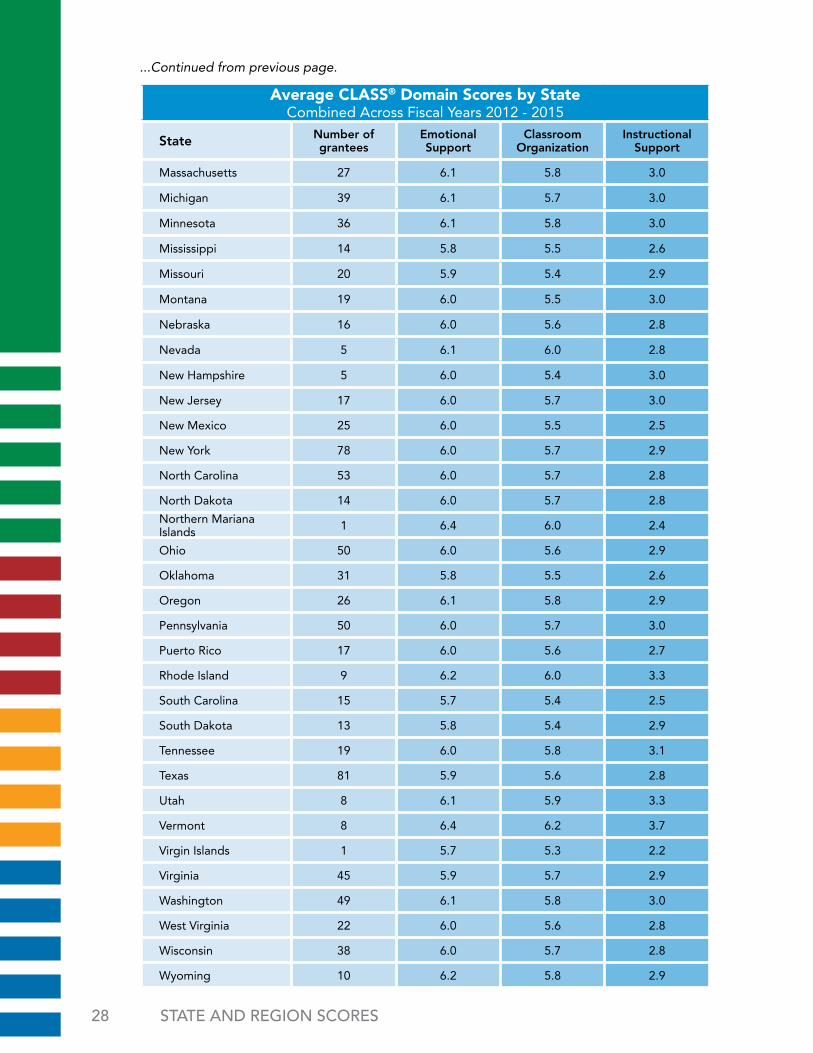
Average CLASS® Domain Scores by State Combined Across Fiscal Years 2012 - 2015
State Number of grantees
Emotional Support
Classroom Organization
Instructional Support
Massachusetts 27 6.1 5.8 3.0
Michigan 39 6.1 5.7 3.0
Minnesota 36 6.1 5.8 3.0
Mississippi 14 5.8 5.5 2.6
Missouri 20 5.9 5.4 2.9
Montana 19 6.0 5.5 3.0
Nebraska 16 6.0 5.6 2.8
Nevada 5 6.1 6.0 2.8
New Hampshire 5 6.0 5.4 3.0
New Jersey 17 6.0 5.7 3.0
New Mexico 25 6.0 5.5 2.5
New York 78 6.0 5.7 2.9
North Carolina 53 6.0 5.7 2.8
North Dakota 14 6.0 5.7 2.8
Northern Mariana Islands 1 6.4 6.0 2.4
Ohio 50 6.0 5.6 2.9
Oklahoma 31 5.8 5.5 2.6
Oregon 26 6.1 5.8 2.9
Pennsylvania 50 6.0 5.7 3.0
Puerto Rico 17 6.0 5.6 2.7
Rhode Island 9 6.2 6.0 3.3
South Carolina 15 5.7 5.4 2.5
South Dakota 13 5.8 5.4 2.9
Tennessee 19 6.0 5.8 3.1
Texas 81 5.9 5.6 2.8
Utah 8 6.1 5.9 3.3
Vermont 8 6.4 6.2 3.7
Virgin Islands 1 5.7 5.3 2.2
Virginia 45 5.9 5.7 2.9
Washington 49 6.1 5.8 3.0
West Virginia 22 6.0 5.6 2.8
Wisconsin 38 6.0 5.7 2.8
Wyoming 10 6.2 5.8 2.9
...Continued from previous page.

29STATE AND REGION SCORES
Average CLASS® Domain Scores by Region Combined Across Fiscal Years 2012 - 2015
Region Number of grantees
Emotional Support
Classroom Organization
Instructional Support
I 74 6.2 5.8 3.1
II 110 6.0 5.7 2.9
III 135 6.0 5.7 2.9
IV 225 5.9 5.6 2.9
V 214 6.1 5.7 3.0
VI 169 5.9 5.6 2.7
VII 74 6.0 5.7 2.9
VIII 82 6.2 5.9 3.1
IX 78 6.0 5.7 2.9
X 64 6.1 5.8 3.0
XI 124 6.0 5.6 2.6
XII 25 6.0 5.6 2.5
Region Scores
❚ Across the Regions, Emotional Support and Classroom Organization scores were consistently in the high range. Instructional Support scores were consistently in the low to middle range.
Source: https://hmrf.acf.hhs.gov/programs/find-a-program/
Note: Region XI is American Indian and Alaska Native Head Start and Region XII is Migrant and Seasonal Head Start. These Regions are geographically distributed throughout the country.
30
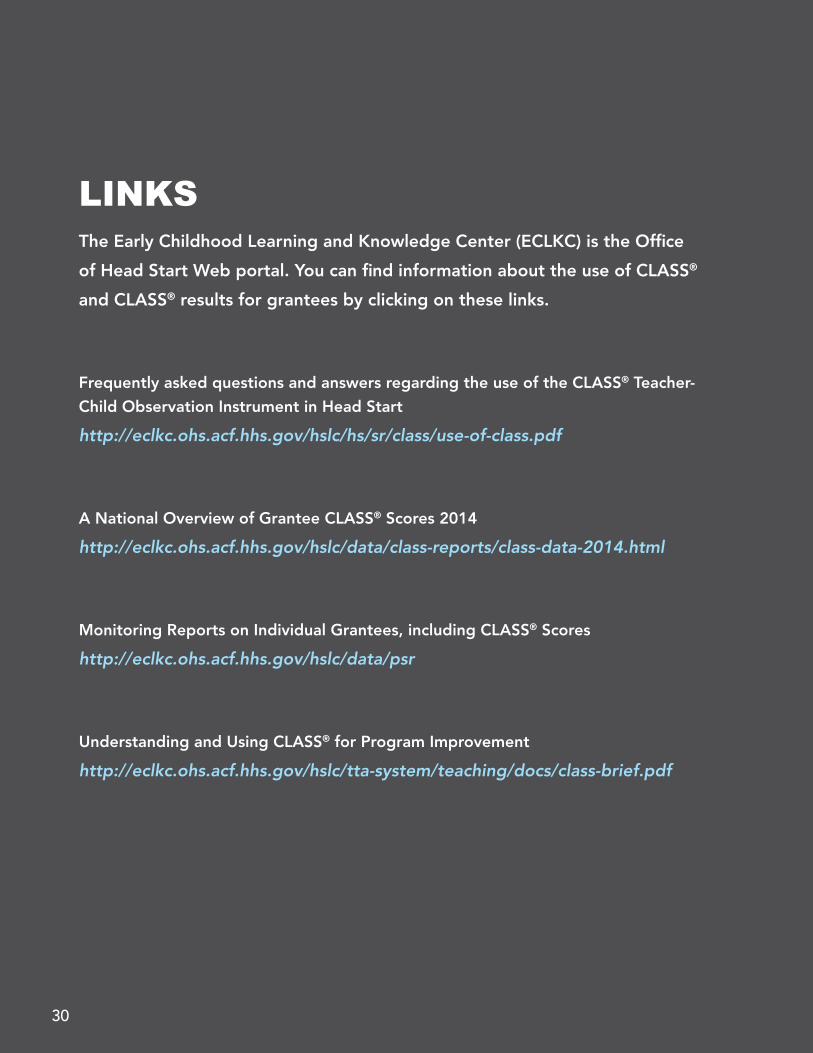
LINKSThe Early Childhood Learning and Knowledge Center (ECLKC) is the Office
of Head Start Web portal. You can find information about the use of CLASS®
and CLASS® results for grantees by clicking on these links.
Frequently asked questions and answers regarding the use of the CLASS® Teacher-
Child Observation Instrument in Head Start
http://eclkc.ohs.acf.hhs.gov/hslc/hs/sr/class/use-of-class.pdf
A National Overview of Grantee CLASS® Scores 2014
http://eclkc.ohs.acf.hhs.gov/hslc/data/class-reports/class-data-2014.html
Monitoring Reports on Individual Grantees, including CLASS® Scores
http://eclkc.ohs.acf.hhs.gov/hslc/data/psr
Understanding and Using CLASS® for Program Improvement
http://eclkc.ohs.acf.hhs.gov/hslc/tta-system/teaching/docs/class-brief.pdf

31STATE AND REGION SCORES
Report onHead Start CLASS®
DataFiscal Years 2012-2015