hdm manager version 2 - world bank · the highway design and maintenance standards series hdm...
TRANSCRIPT

THE WORLD BANK
ENVIRONMENTALLY SUSTAINABLE DEVELOPMENT STAFF
TRANSPORTATION, WATER & URBAN DEVELOPMENT DEPARTMENT
TRANSPORT DIVISION
Report TWLT 12
HDM Manager Version 2.1
Rodrigo Archondo-Callao
March 1994
Technical Paper
This is a document published informally by the World Bank. The views andinterpretations herein are those of the authors and should not be
attributed to the World Bank, to its affiliated organizations,or to any individual acting on their behalf.
Pub
lic D
iscl
osur
e A
utho
rized
Pub
lic D
iscl
osur
e A
utho
rized
Pub
lic D
iscl
osur
e A
utho
rized
Pub
lic D
iscl
osur
e A
utho
rized
Pub
lic D
iscl
osur
e A
utho
rized
Pub
lic D
iscl
osur
e A
utho
rized
Pub
lic D
iscl
osur
e A
utho
rized
Pub
lic D
iscl
osur
e A
utho
rized

The Highway Design and Maintenance Standards Series
HDM Manager Version 2.1
The Highway Design and Maintenance Standards Model SeriesTransportation. Water & Urban Development Department. The World Bank
HDM Manager. Version 2.1, 04/04/94
| Analysis Control P H Deterioration
|Road Characteristics + < Cost Streams
HDM Model .-
| Vehicle Fleet Data + . { Economic Analysis
l Strategi:es: e -Project Summary |
F Other Options Quit Program
Rodrigo Archondo-Callao
Transportation, Water & Urban Development DepartmentThe World Bank

This report presents the HDM Manager software developed by Rodrigo Archondo-Callao, The Transportation,Water & Urban Development Department, The World Bank. To obtain a copy of the HDM Manager software,contact the following organization:
World BankTransportation, Water & Urban Development DepartmentTransport Division1818 H Street, N.W.Washington, DC 20433, U.S.A.Telephone: (202) 473-5205Fax: (202) 522-3223
The Highway Design and Maintenance Standards Model (HDM) developed by the World Bank (Thawat Watanatadaand others) is required to be used in conjunction with the HDM Manager. To obtain a copy of the HDM Model,contact the following organization:
University of FloridaMcTransCenter for Microcomputers in Transportation512 Weil HallPO BOX 116585Gainesville, FL 32611-6585, U.S.A.Telephone: (904) 392-0378Fax: (904) 392-3224
Copyright I 1994The International Bank for Reconstructionand Development / The World Bank1818 H Street, N.W.Washington, DC 20433, U.S.A.
All rights reservedManufactured in the United States of AmericaFirst printing March 1994
HDM Manager is designed for use on 286, 386 or 486 personal computers. A hard disk of 20 megabytes andminimum installed memory of 640K is required to run the HDM Manager program, using MS-DOS 3.3 or higher.
The HDM Manager program was written to assist in the operational work of the World Bank. The author, theWorld Bank, the members of its Board of Executive Directors, and the countries they represent make norepresentations or warranty with respect to the HDM Manager program other than as specified in the User LicenseAgreement. The User assumes all risk for the installation and use of, and results obtained from, the program. Theauthor and The World Bank shall not be liable for any error contained in the program or in the supporting manualor documentation supplied with the program or for incidental or consequential damage resulting from furnishing,performance, or use of the program.
Although every effort has been made to test HDM Manager and ensure its accuracy, the World Bank is not in aposition to provide user support.

Table of Contents
Introducing HDM Manager ................................................. 1
Installing the Program .................................................... 2
Program Requirements ..................................... ............... 3
Starting the Program ..................................................... 3
The Main Menu ........................................................ 3
Learning the Basics ...................................................... 4
Defining the Analysis Control ............................................... 5
Defining Road Characteristics ............................................... 6
Defining Vehicle Fleet Data ................................................ 7
Working withStrategies ............................................................ 10
Running the HDM Model ................................................... 17
Viewing the Road Deterioration .............................................. 17
Viewing the Costs Streams ................................................. 19
Viewing the Economic Analysis .............................................. 20
Producing the Project Summmy .............................................. 20
Working with Other Options ................................................ 21
Exiting the Program ..................................................... 22
Storing the Data Sets in Otier Directories ........................................ 23
Printing the Graphs ...................................................... 23
Monochrome Monitors .................................................... 23
HDM Manager and HDM .................................................. 23
Annexes ............................................................. 24
References ........................................................... 27

I

HDM Manager 1
Introducing HDM The Highway Design and Maintenance Standard Model HDM' is aManager computer program for analyzing the total transport costs of alternative road
Manager improvement and maintenance strategies. The program provides detailedmodeling of pavement deterioration and maintenance effects, and calculatesannual costs of road construction, maintenance, and vehicle operation.Accidents and other impacts can be added exogenously to the economicevaluation. It is widely used in the evaluation of specific road proposals,national or regional road investments analysis, and road maintenance policyassessment.
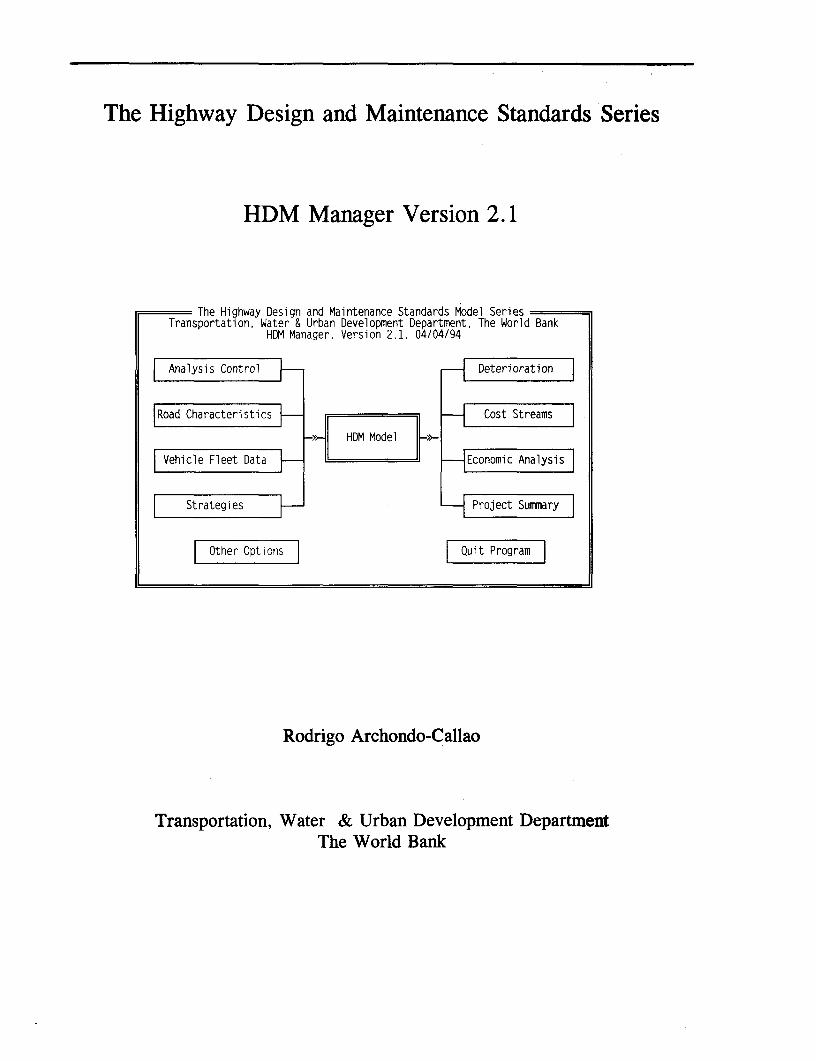
HDM Manager is a user-friendly shell environment for specific customizedapplications of HDM (see the figure below). It stores the input dataefficiently, creates all the required HDM input files, runs the HDM program,collects the results, and presents the results in a practical way. The programis a simple but powerful package for learning and using the major concepts ofHDM.
HDM-111Manager
HDM Manager is designed for use with the full HDM software package anddocumentation, which must be obtained separately. While you can use theHDM Manager software alone for demonstration purposes, it cannot analyzenew options or save new data without the presence of the full HDM model.
HDM Manager is designed to evaluate a set of road agency strategies appliedto paved and unpaved roads. The program computes the road deterioration,the cost streams (agency costs, vehicle operating costs, and total societycosts) for each of the road agency strategies being evaluated, and theeconomic indicators (net present value of net benefits and the internal rate ofreturn) used to compare the set of road agency strategies.

2 HDM Manager
HDM Manager incorporates most but not all the features of HDM and hassome constraints on parameter choices, e.g. must use seven vehicle types.The main HDM features not included in this version are the following: i)Division of links into sections and subdivision of sections into threesubsections, ii) Execution of more than one link at a time, iii) Definition ofexogenous costs and benefits, and iv) Use of alternative vehicle operatingcosts relationships.
Installing the To use HDM Manager, you first need to install the HDM program into yourhard disk. The steps to install the HDM program, as given by the HDM-PCProgram manual', are the following:
STEP 1 - Make a directory called HDM for HDM with the DOScommand:
MD\HDM
STEP 2 - Change to the HDM directory with the following DOScommand:
CD\HDM
STEP 3 - Place the first HDM program disk in drive A: and enter:
COPY A:*.*
STEP 4 - Repeat step 3 for all the HDM disks supplied.
After installing HDM, install HDM Manager with the following steps:
STEP 1 - Make a directory called HDM-MAN for HDM Managerwith the DOS command:
MD\HDM-MAN
STEP 2 - Change to the HDM-MAN directory with the followingDOS command:
CD\HDM-MAN
STEP 3 - Place the HDM Manager program disk in drive A andenter:
COPY A:*.*

HDM Manager 3
Program To run HDM Manager you need DOS 3.3 or higher and 600 KB of free
Requirements conventional memory. Also make sure that the following line is included inthe CONFIG.SYS file:
FILES = 30
Starting the Start the program following the steps below:
ProgramSTEP 1 - Change to the HDM-MAN directory with the followingDOS command:
CD\HDM-MAN
STEP 2 - Run the program with the command:
HDM-MAN
The Main Menu The main menu (shown below) shows you the basic structure of the programand gives you a series of options (Analysis Control, Deterioration, etc.). Atthis type of menu, select an option by using the cursor keys to highlight theoption and pressing the Enter key or by pressing the first letter of the optionselected.
The Highway Design and Maintenance Standards Model SeriesTransportation, Water & Urban Development Department, The World Bank
HDM Manager, Version 2.1, 04/04/94
r Analysis Control > H Deterioration
2 |Road Characteristics + H Cost Streams
- HDM Model -
| Vehicle Fleet Data W + Economic Analysis
l Strategies W H Project Summary
LOther Options|| Quit Program |

4 HDM Manager
Learning the To do a basic economic analysis of road agency strategies applied to a paved
Basics or unpaved road, follow the steps below:
STEP 1 - Define the Analysis Control. Enter the discount rate, theanalysis period, the calendar year of the initial year, and thecurrency to be used.
STEP 2 - Define the Road Characteristics. Enter the road geometry,road structure, road condition, environment, daily traffic, and thetraffic growth.
STEP 3 - Define the Vehicle Fleet Data. Enter the vehicle fleetcharacteristics and the vehicle operation unit costs.
STEP 4 - Define the Strategies. Enter the maintenance operationsand construction unit costs, define a data bank of possible roadagency maintenance and construction policies, and define the roadagency strategies being evaluated. Each strategy should include oneor more road agency policies.
STEP 5 - Execute the HDM Model. Run the HDM model fromwithin the shell environment. Note that after the HDM run iscompleted, the HDM Manager program collects the HDM resultsfrom the HDM output files.
STEP 6 - View the Deterioration. Examine the road deterioration= behavior of each of the road agency strategies being evaluated.
STEP 7 - View the Cost Streams. Examine the financial andeconomic cost streams (agency costs, vehicle operating costs, andtotal society costs) of the road agency strategies being evaluated.
STEP 8 - View the Economic AnalYsis. Examine the economiccomparison of the strategies being evaluated. The comparison isbased on the net present value of benefits (NPV) or the internal rateof return (IRR) of each strategy in relation to a base strategy (thefirst strategy).
STEP 9 - Produce the Proiect Summay. Select the optimal roadagency strategy among the five strategies being evaluated and createa project summary report for the selected strategy. The projectsummary report contains all the basic inputs and results for theselected strategy.
STEP 10 - Explore Other Options. For example: export the resultsto Lotus 1-2-2, view or print the original HDM output files, ormanage the input data set files.
For each step described above, select the corresponding option at the mainmenu.
HDM Manager 5
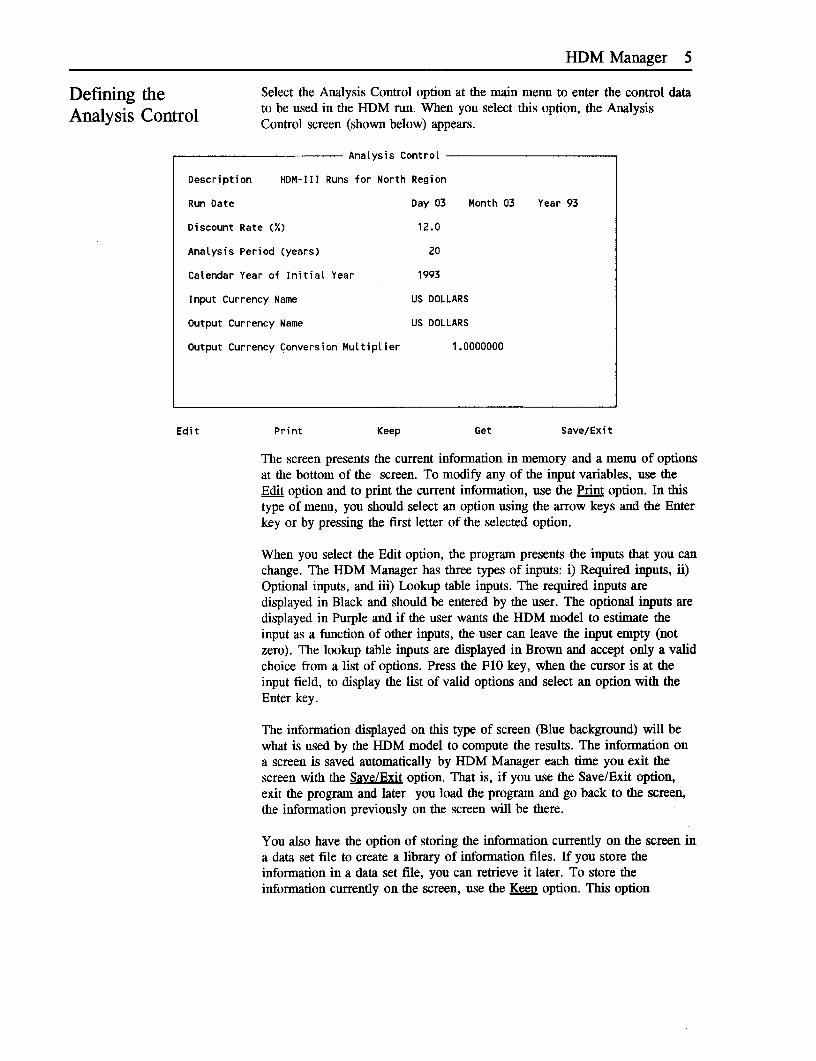
Defining the Select the Analysis Control option at the main menu to enter the control data
Analysis Control to be used in the HDM run. When you select this option, the AnalysisControl screen (shown below) appears.
Analysis Control
Description HDM-III Runs for North Region
Run Date Day 03 Month 03 Year 93
Discount Rate (X) 12.0
Analysis Period (years) 20
Calendar Year of Initial Year 1993
Input Currency Name US DOLLARS
Output Currency Name US DOLLARS
Output Currency Conversion MultipLier 1.0000000
Edit Print Keep Get Save/Exit
The screen presents the current information in memory and a menu of optionsat the bottom of the screen. To modify any of the input variables, use theEdit option and to print the current information, use the Print option. In thistype of menu, you should select an option using the arrow keys and the Enterkey or by pressing the first letter of the selected option.
When you select the Edit option, the program presents the inputs that you canchange. The HDM Manager has three types of inputs: i) Required inputs, ii)Optional inputs, and iii) Lookup table inputs. The required inputs aredisplayed in Black and should be entered by the user. The optional inputs aredisplayed in Purple and if the user wants the HDM model to estimate theinput as a function of other inputs, the user can leave the input empty (notzero). The lookup table inputs are displayed in Brown and accept only a validchoice from a list of options. Press the F10 key, when the cursor is at theinput field, to display the list of valid options and select an option with theEnter key.
The information displayed on this type of screen (Blue background) will bewhat is used by the HDM model to compute the results. The information ona screen is saved automatically by HDM Manager each time you exit thescreen with the Save/Exit option. That is, if you use the Save/Exit option,exit the program and later you load the program and go back to the screen,the information previously on the screen will be there.
You also have the option of storing the information currently on the screen ina data set file to create a library of information files. If you store theinformation in a data set file, you can retrieve it later. To store theinformation currently on the screen, use the Keep option. This option

6 HDM Manager
prompts for the name of the data set file to store the information. Enter up tosix characters or digits.
To retrieve the information of a previously stored (with the Keep option) dataset file, use the Get option. This option lists the available data sets. Highlightthe data set you want and press the Enter key. The program will get theinformation from the data set file and present it on the screen. Rememberthat the HDM model uses the current information displayed on the screen(saved automatically with the Save/Exit option) to compute the results.
To return to the main menu use the Save/Exit option. If you press the Escapekey, the program will return to the menu but it will not save the latest screenchanges. Note that in the HDM Manager at any moment you can press theEscape key to cancel an operation or to go back to a previous menu.
Defining Road Select the Road Characteristics option at the main menu to enter the roadCharacteristics information to be used in the HDM run. When you select this option,the
Road Characteristics screen (shown below) appears.
Road CharacteristicsPage 1/3
Description Gravel Road 1 in North Region
Road Type (Paved/Unpaved) U
GEOMETRYRoad Length (km) 100.0 Road Width (m) 6.0One Shoulder Width (m) 0.4 Effective Number of LanesRise & Fall (m/km) 40.0 Curvature (deg/km) 100.0Superelevation (%) 0.0
ENVIRONMENTAltitude (m) 500 Rainfall (m/month) 0.0300
Next Page
Edit Print Keep Get Save/Exit
The Road Characteristics menu is similar to the Analysis Control menu. Usethe E option to edit the information, the Print option to print theinformation, the KeeM option to store the information into a data set file forfuture use, the Get option to retrieve a data set information, and theSave/Exit option to save the current information and return to the previousmenu.
Note that if you decide to store the current information (Keep option), youcan use the same data set name for an Analysis Control, Vehicle Fleet,Maintenance Unit Costs, Road Agency Policies, or a Road Agency Strategiesdata set. The HDM Manager program treats each set of information (AnalysisControl, Road Characteristics, Vehicle Fleet, Maintenance Unit Costs,

HDM Manager 7
Policies and Strategies) as independent of each other. Therefore, you can usethe same data set name for all the input sets.
The Road Characteristics data is divided into three screen "pages": i) Page 1with the road type, road geometry and environment data, ii) Page 2 with theroad structure and condition data, and iii) Page 3 with current traffic andexpected traffic growth data. Note that the data requested on the second pagechanges as a function of the road type (paved or unpaved).
To move among the three pages use Next Page option or press the Page Upor Page Down keys. When you use the Edit option, you edit the page beingdisplayed. To edit another page, you have to display the page and then usethe Edit option. When you use the Print, Keep, and Get options, you areworking with the data of all three pages. Therefore, when you use the Keepoption, you are storing the data of all three pages into a single data set file.
For detailed information on the information requested at the RoadCharacteristics option, refer to the HDM manuals3 . This input screens containthe information required by the HDM model to describe the roadcharacteristics and traffic (series A and E in HDM). Note that if you don'twant to include a particular vehicle type, you should enter 0 (zero) in thecorresponding average daily traffic (ADT) field. Note also that as in theHDM Model you have the option of entering both the Structural Number andthe Benkelman Beam deflection or just either one of these variables leavingthe other as blank.
Defining Vehicle Select the Vehicle Fleet Data option at the main menu to enter the vehicleFleet Data fleet characteristics to be used in the HDM run. When you select this option,
the Vehicle Fleet Data menu (shown below) appears.
Required Parameters
Optional Parameters| Vehicte Fleet DatE
Exit

8 HDM Manager
You have three options: i) Enter the Required Parameters, ii) Enter theOptional Parameters, or iii) Exit the menu. Select an option using the arrowkeys and the Enter key or by pressing the first letter of the selected option.When you select the Required Parameters option, the Vehicle Mleet Data -Required Parameters screen (shown below) appears.
VehicLe FLeet Data - Required ParametersPage 1/2
Description Required Data for North Region
Light Medium Heavy Artic.BASIC CHARACTERISTICS Car Pickup Bus Truck Truck Truck Truck
Gross Vehicle Weight (t) 1.200 1.800 10.900 5.600 11.300 20.800 27.000ESAI Factor per Veh.(E4) 0.000 0.010 0.500 0.100 1.000 3.000 5.000Number of AxLes 2 2 2 2 2 3 5Number of Tires 4 4 6 6 6 10 18Number of Passengers 1.00 1.00 1.00 1.00 1.00 1.00 1.00
VEHICLE UTILIZATION DATA
Service Life (yr) 10.0 8.0 8.0 8.0 8.0 8.0 8.0Hours Driven per Year 450 1300 2000 1300 2100 2000 1900Km Driven per Year 18000 30000 80000 50000 65000 67500 80000Depreciation Code 2 2 2 2 2 2 2Utilization Code 1 3 3 3 3 3 3AnnuaL Interest Rate (%) 12.00 12.00 12.00 12.00 12.00 12.00 12.00
i Next PageIL
Edit Print Keep Get Save/Exit
The Required Parameters menu is similar to the Analysis Control and RoadCharacteristics menus. Use the Edit option to edit the information, the Printoption to print the information, the Keep option to store the information intoa data set file for future use, the Get option to retrieve a data set infonnation,and the Save/Exit option to save the current information and return to theprevious menu.
The Required Parameters are defined in two pages of information. Use theNext Page option to move among pages. Remember that the Edit option actson the current page while the Print, Keep, and Get options act on all thepages.
The Required Parameters (all inputs in Black) option contains the basicvehicle characteristics, the vehicle utilization, and the vehicle unit costs data.The HDM model uses this information to compute the vehicle operating costof the vehicle fleet as a function of the road geometry and the roadroughness.
When you select the Optional Parameters option at the Vehicle Fleet Datamenu, the Vehicle Fleet Data - Optional Parameters screen (shown below)appears.

HDM Manager 9
Vehicle Fleet Data - Optional ParametersPage 1/2
Description Optional Data for North Region
Light Medium Heavy Artic.VEHICLE PARAMETERS Car Pickup Bus Truck Truck Truck Truck
Payload (Tons) 0.20 0.40 3.50 2.80 7.60 12.80 22.00Aerodynamic Drag Coeff. . . . .
Projected Frontal Area . . . .
Driving Power (Metric HP) . . . .
Braking Power (Metric HP) . . . .
Paved Desired Spd (km/h) . . . .
Unpaved Desired Sp (km/h) . . . .
Energy Efficiency Factor . . . .
Hourly Utilization Ratio . . . .
Calibrated Eng Spd (rpm) . . . .
Weibull Shape Parameter . . . .
Max Avg Rect Vel (mm/s) . . . .
Width Parameter for Spd . . . .
Fuel Adjustment Factor . . . .
Next Page
Edit Print Keep Get Save/Exit
The Optional Parameters menu is similar to the Analysis Control and RoadCharacteristics menus. Use the Edi option to edit the information, the Printoption to print the information, the Ke option to store the information intoa data set file for future use, the Get option to retrieve a data set information,and the Save/Exit option to save the current information and return to theprevious menu.
The Optional Parameters option (all inputs in Purple) is used to enter the datarequired to calibrate the vehicle operating costs model. Remember that if youwant to change any of the default values supplied by the HDM model, youshould enter the new values, otherwise leave the fields blank (not zero).
For detailed information on the information requested at the Vehicle FleetData option, refer to the HDM mamnals. The HDM manuals describe eachinput item, the units used, and the valid range. This option contains thevehicle fleet characteristics required by HDM (series D in HDM). Note thatthe currency used to enter the unit costs is defined in the Analysis Controlscreen.
The HDM Manager program adopts the Brazil vehicle operating costsrelationships of HDM and defines seven types of vehicles. The number ofvehicle types defined is fixed by the HDM Manager program. Therefore,while the full HDM program allows you to change the number of vehicletypes and their names, these cannot be changed through the HDM Manager.The HDM Manager allows you to change the characteristics of each of theseven vehicle types defined and if in your analysis you don't want to includea particular vehicle type, enter 0 (zero) in the corresponding average dailytraffic (ADT) field at the Road Characteristics option. Note also that HDMManager does not present the computed vehicle operating costs and vehiclespeed by vehicle type, which is available in the full HDM.

10 HDM Manager
Working with Select the Strategies option at the main menu to define the road agencyStrategies strategies to be evaluated in the HDM run. This option displays the Strategies
Menu screen (shown below). You have five options: i) Enter the maintenanceand construction operations unit costs, ii) Define the road agency strategies,iii) Define a library of possible paved road maintenance policies, iv) Define alibrary of possible unpaved road maintenance policies, v) Define a library ofpossible construction policies.
Operations Unit Costs
Definition of Strategies
PoLicies Data BankPaved Maintenance Policies
l Unpaved Maintenance Policiesl Strategies l Construction Policies
Exit
To define the road agency strategies to be evaluated, follow the steps below:
STEP 1 - Define ODerations Unit Costs
Define the maintenance and construction operations unit costs. TheOperations Unit Costs menu is similar to the Analysis Control menu (seebelow). Use the Edit option to edit the information, the Print option to printthe information, the Keen option to store the information into a data set filefor future use, the Get option to retrieve a data set information, and theSave/Exit option to save the current information and return to the previousmenu.
The unit costs entered are the costs for a particular (user defined) operation.For example, in the screen below: the financial unit cost for an overlay isequal to 8.00 $/km, the thickness and the material being defined by the user.This cost, for example, may be based on a 40 mm asphalt concrete overlay,but these details are not shown in the input screen. The cost for a particularoperation can be adjusted by a cost factor to consider variations on thedefined operation (for example to consider different thicknesses or materials)in each policy to be defined in step 2.
The maintenance and construction unit costs can be in any currency (definedin the Analysis Control screen) and will be used by all the road agency

HDM Manager 11
policies to be defined in Step 2. Note that the unit cost for the constructionoperation is in thousands of the currency defined in the Analysis Controlscreen.
Strategies - Operations Unit Costs
Description Unit Costs for North Region
Financial EconomicOperation Unit Cost Unit Cost
Grading (Currency per km of road graded) 85.0 70.0Spot Regraveling (Currency per cu m) 7.20 6.00Gravel Resurfacing (Currency per cu m) 17.80 12.50Unpaved Routine Maintenance (Currency per km per yr) 100 85
Patching (Currency per sq m) 8.00 6.80Resealing (Currency per sq m) 3.20 2.70Overlay (Currency per sq m) 8.00 6.80Reconstruction (Currency per sq m) 40.00 34.00Paved Routine Maintenance (Currency per km per yr) 500 425
Construction (Thousands currency per km) 120.0 86.0
Note: The input currency is defined in the Analysis ControL Data
Edit Print Keep Get Save/Exit
STEP 2 - Define Policies Data Bank
The HDM Manager evaluates road agency strategies. Each road agencystrategy is composed of one or more than one paved maintenance policy,unpaved maintenance policy, or construction policy. Therefore, you have tocreate a Data Bank of road agency policies before defining the strategies tobe evaluated.
For example:
Strategy X Policy 1: - Grading every 90 days, plus gravelresurfacing (from 1993 to 2011)
Strategy Y Policy 1: - Reseals every 5 years (from 1993 to2002)
Policy 2: - Overlays every 9 years (from 2003 to2011)
Strategy Z Policy 1: - Grading every 90 days (from 1993 to1994)
Policy 2: - Paving the road (in 1995)Policy 3: - Overlays when roughness > 4.5 (from
1996 to 2011)
Note that strategies are the road agency alternatives (with the first being thebase case) being evaluated. Policies within a strategy are not alternatives, but
12 HDM Manager
a sequence, with only one being applicable in a given year. Note also that apolicy can include a number of actions which may be scheduled or conditionresponsive.
You define the paved maintenance policies, unpaved maintenance policies,and construction policies that should belong to your Data Bank. Thesepolicies are stored in data set files with unique file names and should haveunique and clear descriptions to identify the policies at the Definition ofStrategies phase.
Paved Maintenance Policies
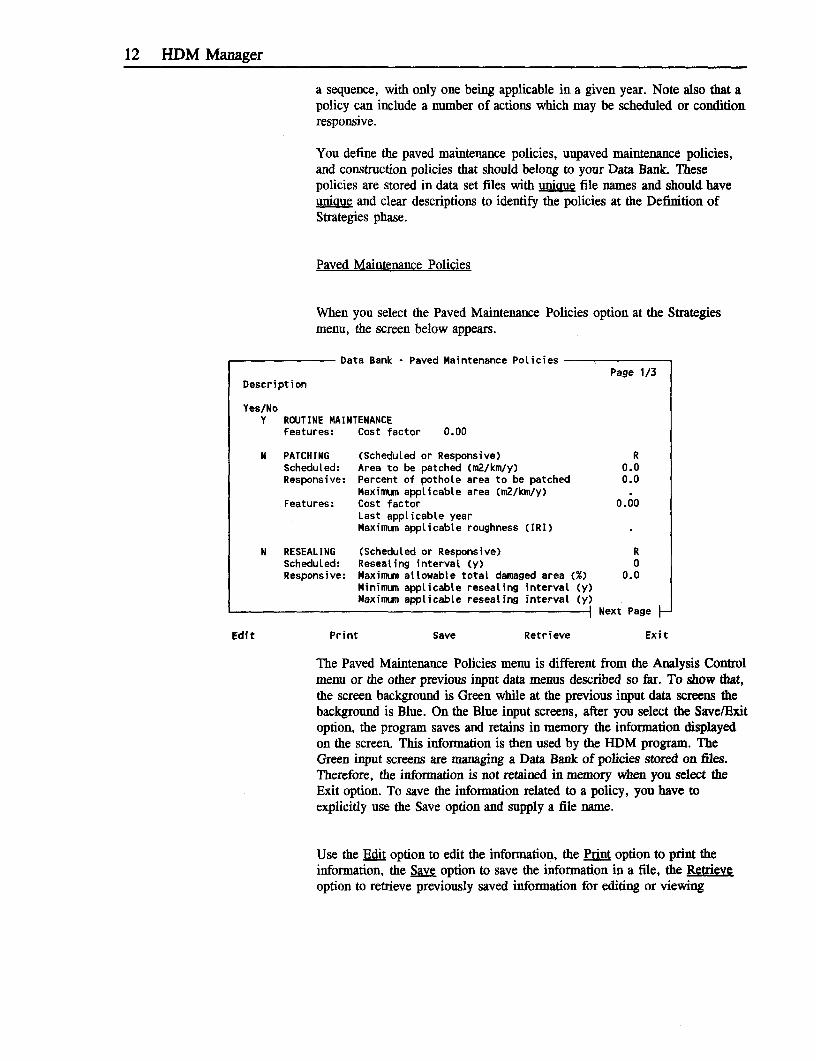
When you select the Paved Maintenance Policies option at the Strategiesmenu, the screen below appears.
Data Bank - Paved Maintenance PoliciesPage 1/3
Description
Yes/NoY ROUTINE MAINTENANCE
Features: Cost factor 0.00
N PATCHING (Scheduled or Responsive) RScheduled: Area to be patched (m2/km/y) 0.0Responsive: Percent of pothoLe area to be patched 0.0
Maximum applicable area (m2/km/y)Features: Cost factor 0.00
Last applicable yearMaximum applicable roughness (IRI)
N RESEALING (Scheduled or Responsive) RScheduled: Resealing interval (y) 0Responsive: Maximum allowable total damaged area (%) 0.0
Minimum applicable resealing interval (y)Maximumn applicable resealing interval (y)
Next Page
Edit Print Save Retrieve Exit
The Paved Maintenance Policies menu is different from the Analysis Controlmenu or the other previous input data menus described so far. To show that,the screen background is Green while at the previous input data screens thebackground is Blue. On the Blue input screens, after you select the Save/Exitoption, the program saves and retains in memory the information displayedon the screen. This information is then used by the HDM program. TheGreen input screens are managing a Data Bank of policies stored on files.Therefore, the information is not retained in memory when you select theExit option. To save the information related to a policy, you have toexplicitly use the Save option and supply a file name.
Use the Edit option to edit the information, the Print option to print theinformation, the Save option to save the information in a file, the Retrieyvoption to retrieve previously saved information for editing or viewing

HDM Manager 13
purposes, and the Exit option to return to the previous menu. When you usethe Save option, you are requested to enter a six digit/character file name andwhen you use the Retrieve option, the program displays a list of previouslysaved policies.
Remember that in this step you are not deciding which policies to include inthe strategies to be evaluated. You are managing a series of road agencypolicies stored in files that could or could not be used by the HDM program.You define the policies to be included in each strategy and the timing of thesepolicies in the Definition of Strategies option (see Step 3).
The Paved Maintenance Policies information is composed of three screen"pages". In these pages, you define the maintenance operations included inthe policy and the characteristics of the operations. A paved maintenancepolicy is composed of Routine Maintenance and if wanted other maintenanceoperations (Patching, Reseal, Overlay or Reconstruction). Each maintenanceoperation can be scheduled at a certain time interval or activated in responseto the condition of the road. Note that the Routine Maintenance operation isalways included and that you can have more than one operation in a policy.
To show that a certain operation should be included on the policy beingdefined, enter a "Y" at the left column of the screen at the correspondingoperation. Otherwise, enter "N" or leave it blank. To select the type ofoperation (Scheduled or Responsive) place an "R" or "S" at right of the"Scheduled or Responsive" line. If you select the Scheduled option, enter theinformation at the Scheduled line (lines) and disregard the information on theResponsive line (lines). If you select the Responsive option, enter theinformation at the Responsive line (lines), and disregard the Scheduled line(lines). In both cases, Scheduled or Responsive options, you should define theFeatures of the operation.
Unpaved Maintenance Policies
When you select the Unpaved Maintenance Policies option at the Strategiesmenu, the screen below appears.
The Unpaved Maintenance Policies menu is equal to the Paved MaintenancePolicies menu. Use the Edit option to edit the information, the Print option toprint the information, the Save option to save the information in a file, theRetrieve option to retrieve previously saved information for editing orviewing purposes, and the Exit option to return to the previous menu. Whenyou use the Save option, you are requested to enter a six digit/character filename and when you use the Retrieve option, the program displays a list ofpreviously saved policies.
Remember that the inputs in Black are required, the inputs in Purple areoptional (you can leave them blank, not zero), and the inputs in Brown areobtained from a list of valid options (press FIO).

14 HDM Manager
Data Bank - Unpaved Maintenance PoliciesPage 1/2
Description
Yes/NoY ROUTINE MAINTENANCE
Features: 'Cost factor 0.00R
N GRADING (Scheduled or Responsive)Scheduled: Time interval between gradings (d) 0Responsive: Traffic interval between grading (vet) 0
Minimum applicable time interval (d)Maximum appLicabLe time interval (d)
Features: Cost factor 0.00
N SPOT REGRAVELLING (Scheduled or Responsive) RScheduled: Gravel volume (m3/km/y) 0.0Responsive: Percent annuaL material Loss replaced (%) 0
Maximun applicable gravel volume (m3/km/y)Features: Cost factor 0.00
I Next Page
Edit Print Save Retrieve Exit
The Unpaved Maintenance Policies structure is similar to the PavedMaintenance Policies structure. The only difference is the type of operationsincluded (Grading, Spot Regravelling, and Gravel Resurfacing). Rememberthat you select an operations by placing a "Y" at the left of the operation lineand you decide between a Scheduled or Responsive operation by placing an'R" or "S" at right of the corresponding line.
Construction Policies
When you select the Construction Policies option at the Strategy menu, thescreen below appears. The Construction Policies menu is equal to the PavedMaintenance Policies menu.
Use the Edit option to edit the information, the Print option to print theinformation, the Save option to save the information in a file, the Retrieveoption to retrieve previously saved information for editing or viewingpurposes, and the Exit option to return to the previous menu. When you usethe Save option, you are requested to enter a six digit/character file name andwhen you use the Retrieve option, the program displays a list of previouslysaved policies.
Remember that each policy should have a unique file name and a uniquedescription. While defining the strategies in Step 3, you will identify thepolicies that are part of a strategy through the policy description.
The Construction Policies option requests the characteristics of a constructionpolicy. That is, the construction duration and costs, the new roadcharacteristics, and an optional generated traffic.

HDM Manager 15
Data Bank - Construction PoLiciesPage 1/3
Description
CONSTRUCTIONConstruction Duration (y) 1Annual Cost Stream (% of total cost): Construction Year 1 0.0
Construction Year 2 0.0Construction Year 3 0.0Construction Year 4 0.0Construction Year 5 0.0
Salvage Value (% of totaL cost) 0.0Cost Factor 0.00
,GEOMETRYRoad Type (Paved/Unpaved) PRoad Length (km) 1.0 Road Width (m) 2.5One Shoulder Width (m) 0.0 Effective Number of LanesRise & Fall (m/km) 0.0 Curvature (deg/km) 0.0Superelevation (X)
Next Page
Edit Print Save Retrieve Exit
For detailed information on the information requested at the PavedMaintenance Policies, Unpaved Maintenance, and Construction Policiesoptions, refer to the HDM manuals. The HDM manuals describe each inputitem, the units used, and the valid range.
STEP 3 - Define Stratezies
The HDM Manager evaluates and compares five road agency strategies at atime. Each strategy is composed of one or more than one road agency policythat is valid for a certain period. The program always analyzes fivestrategies. Therefore, you always have to define five strategies even if youare interested in the results of only one or two strategies. You could use theother strategies to do some sensitivity analysis.
When you select the Define Strategies option, the screen below appears. TheDefinition of Strategies menu is similar to the Analysis Control menu. Usethe Edit option to edit the information, the Print option to print theinformation, the Keen option to store the information into a data set file forfuture use, the Get option to retrieve a data set information, and theSave/Exit option to save the current information and return to the previousmenu.
To define the strategies enter the description of the set of strategies and foreach strategy defines the policies that compose the strategy. For eachstrategy, define at least the following information:
- The description of the strategy- The starting year of the first policy- The description of the first policy

16 HDM Manager
Strategies - Definition of StrategiesPage 1/2
Description Paving Strategies, Gravel Road 1
STRATEGY 1: Grading every 90 days + Regrav.Starting in Year: 1993 PoLicy: Grading (90d), Regravelling (G_R90
( )( )
STRATEGY 2: Paving in 1993 + Reseal at 20%Starting in Year: 1993 PoLicy: Grading (90d), No Regravelting (G_90 )
1993 Paving Gravel Road 1 (P GRO1)1994 Reseal (12mn,20%), Patching (SST_20)
Note: Strategy 1 is the base strategy for the economic analysis.
| Next Page
Edit Print Keep Get Save/Exit
Each strategy should have at least one policy and the first policy should startat the calendar year of the begimning of the analysis period. Each strategy canhave a maximum of four policies. For example:
Starting Policy Descriptionin year (Paved Maint., Unpaved Maint.,
or Construction)
STRATEGY 1 1992 Grading every 90 days
STRATEGY 2 1992 Grading every 90 days1993 Paving the road1994 Reseal when damage > 30%2004 Overlays when IRI > 4.5
A policy will be active from the starting year up to the end of the analysisperiod, unless a new policy starts. If a new policy starts, the previous policywill be stopped.
Enter the starting calendar year for each policy and to enter the policydescription press the FIO key while the cursor positioned at the descriptionfield. When you press the F10 key at a policy description field, the programlists all the available policies (stored in your Data Bank and managed in Step2). Select a policy by highlighting it and pressing the enter key.
Note that the first strategy is the strategy defined by the HDM Manager asthe base strategy (do minimum case). The HDM Manager computes theeconomic benefits of implementing the other strategies in relation toimplementing the first strategy.

HDM Manager 17
Running the After defining all the input data, run the HDM model with the "HDMHDM Model Model" option. This option creates all the input data files required by HDM,
runs the HDM program automatically, and after the HDM run is completed,collects the HDM results. Note that you need 3.5 Mb of empty hard disk tostore the temporary files created by the HDM program. These temporaryfiles are erased automatically when you exit the HDM Manager program.
If there is an input data or system error detected by the HDM program, theHDM program will not generate the results. The HDM Manager programshows this fact by giving you a warning message. If there is an input dataerror, you should locate it by viewing the output HDM scan files. Use the"Other Options" option at the main menu. View the SCAN 1 file to locateerrors on the Analysis Control and Road Characteristics Data. View theSCAN 2 file to locate errors on the Vehicle Fleet Data and Road AgencyPolicies. View the SCAN 3 file to locate errors on the Road AgencyStrategies and the structure of the run and to obtain a summary table oferrors and warnings. View the SCAN 4 file to locate execution errors. Afterlocating the errors, you should fix them and run the HDM model again. IfHDM is not installed on your hard disk, the HDM Manager presents awarning message and doesn't compute the results.
Viewing the Road Select the Deterioration option at the main menu to view the roadDeterioration deterioration under the five standards being evaluated. When you select this
option, the periodic operations table appears and if you select the Next Tableoption, the following deterioration (Roughness) table appears.
Roughness (IRI m/km)
First Second Third Fourth FifthYear Strategy Strategy Strategy Strategy Strategy
1 1993 10.2 10.2 10.2 10.2 10.22 1994 10.5 2.7 10.5 10.5 10.53 1995 11.2 2.7 2.7 10.7 10.74 1996 12.0 2.8 2.7 2.7 10.85 1997 12.2 2.9 2.8 2.8 2.76 1998 12.3 3.0 2.9 2.8 2.87 1999 12.5 3.0 3.0 2.9 2.88 2000 11.8 3.1 3.0 3.0 2.99 2001 12.8 3.2 3.1 3.0 3.010 2002 13.0 3.3 3.2 3.1 3.011 2003 13.1 3.4 3.3 3.2 3.112 2004 13.3 3.4 3.4 3.3 3.213 2005 12.5 3.5 3.4 3.4 3.314 2006 13.6 3.6 3.5 3.4 3.415 2007 13.8 3.7 3.6 3.5 3.4
|Change Years
Next Table Prev. Table Select Table Graph Table Output Table Exit
The Roughness table presents the roughness progression for all five standardsand is only one of the following fifteen available tables:
18 HDM Manager
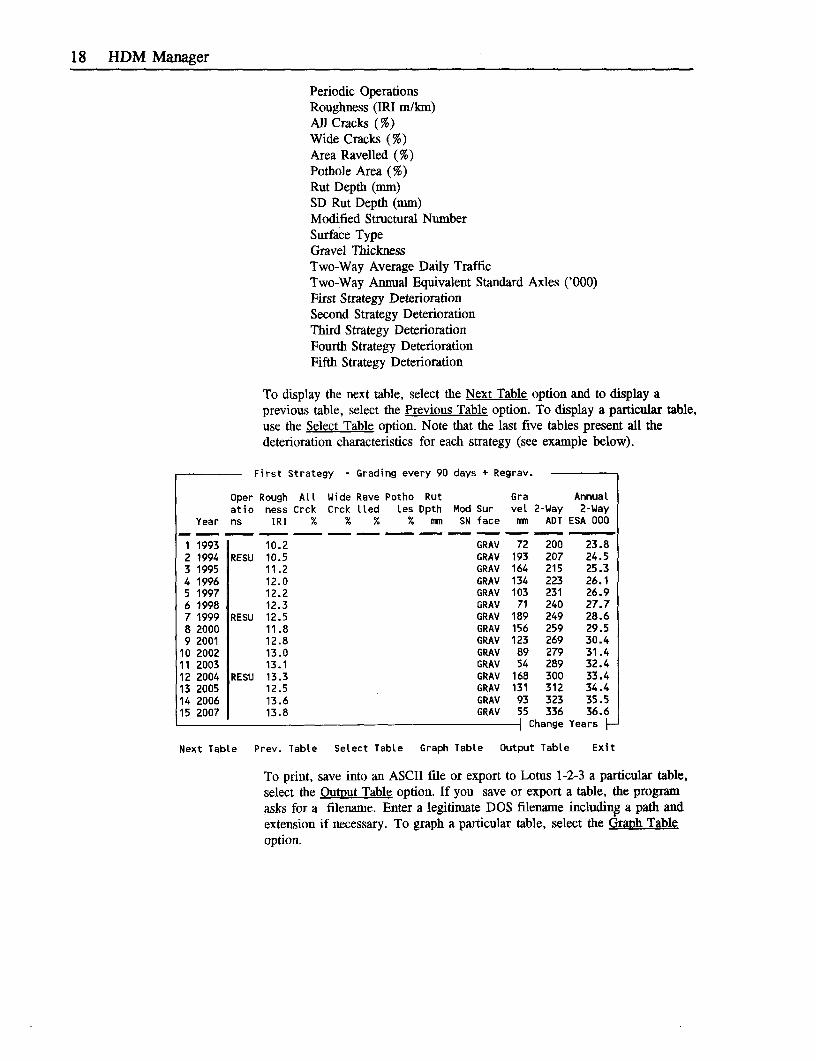
Periodic OperationsRoughness (IRI m/krn)All Cracks (%)Wide Cracks (%)Area Ravelled (%)Pothole Area (%)Rut Depth (mnm)SD Rut Depth (mm)Modified Structural NumberSurface TypeGravel ThicknessTwo-Way Average Daily TrafficTwo-Way Annual Equivalent Standard Axles ('000)First Strategy DeteriorationSecond Strategy DeteriorationThird Strategy DeteriorationFourth Strategy DeteriorationFifth Strategy Deterioration
To display the next table, select the Next Table option and to display aprevious table, select the Previous Table option. To display a particular table,use the Select Table option. Note that the last five tables present all thedeterioration characteristics for each strategy (see example below).
First Strategy - Grading every 90 days + Regrav.
Oper Rough All Wide Rave Potho Rut Gra Annualatio ness Crck Crck lIed les Dpth Mod Sur vel 2-Way 2-Way
Year ns IRI % % % % mm SN face mn ADT ESA 000
1 1993 10.2 GRAV 72 200 23.82 1994 RESU 10.5 GRAV 193 207 24.53 1995 11.2 GRAV 164 215 25.34 1996 12.0 GRAV 134 223 26.15 1997 12.2 GRAV 103 231 26.96 1998 12.3 GRAV 71 240 27.77 1999 RESU 12.5 GRAV 189 249 28.68 2000 11.8 GRAV 156 259 29.59 2001 12.8 GRAV 123 269 30.410 2002 13.0 GRAV 89 279 31.411 2003 13.1 GRAV 54 289 32.412 2004 RESU 13.3 GRAV 168 300 33.413 2005 12.5 GRAV 131 312 34.414 2006 13.6 GRAV 93 323 35.515 2007 13.8 GRAV 55 336 36.6
1 Change Years P
Next Table Prev. Table Select Table Graph Table Output Table Exit
To print, save into an ASCII file or export to Lotus 1-2-3 a particular table,select the Output Table option. If you save or export a table, the programasks for a filename. Enter a legitimate DOS filename including a path andextension if necessary. To graph a particular table, select the Graph Tableoption.

HDM Manager 19
Viewing the Cost Select the Cost Streams option at the main menu to view the cost streams for
Streams the five strategies being evaluated. When you select this option, the followingcosts table (Financial Agency Capital Costs) appears.
Financial Agency Capital Costs(miLlion US DOLLARS)
First Second Third Fourth FifthYear Strategy Strategy Strategy Strategy Strategy
1 1993 0.000 12.000 0.000 0.000 0.0002 1994 1.709 0.000 12.000 0.000 0.0003 1995 0.000 0.000 0.000 12.000 0.0004 1996 0.000 0.000 0.000 0.000 12.0005 1997 0.000 0.000 0.000 0.000 0.0006 1998 0.000 0.000 0.000 0.000 0.0007 1999 1.709 0.000 0.000 0.000 0.0008 2000 0.000 0.000 0.000 0.000 0.0009 2001 0.000 0.000 0.000 0.000 0.00010 2002 0.000 0.000 0.000 0.000 0.00011 2003 0.000 0.000 0.000 0.000 0.00012 2004 1.709 0.000 0.000 0.000 0.00013 2005 0.000 0.000 0.000 0.000 0.00014 2006 0.000 2.240 0.000 0.000 0.00015 2007 0.000 0.000 2.240 0.000 0.000
c Change Years
Next Table Prev. Table Select TabLe Graph Table Output Table Exit
The table presents the financial agency capital cost stream for all fivestrategies and is only one of the following eleven available tables:
Financial Agency Capital CostsFinancial Agency Recurrent CostsEconomic Agency Capital CostsEconomic Agency Recurrent CostsEconomic Vehicle Operating CostsEconomic Total Society CostsNet Economic BenefitsFirst Strategy CostsSecond Strategy CostsThird Strategy CostsFourth Strategy CostsFifth Strategy Costs
To display the next table select, the Next Table option and to display aprevious table select, the Previous Table option. To display a particular table,use the Select Table option. Note that the last five tables present all the coststreams for each strategy.
To print, save into an ASCII file or export to Lotus 1-2-3 a particular table,select the Output Table option. If you save or export a table, the programasks for a filename. Enter a legitimate DOS filename including a path andextension if necessary. To graph a particular table, select the Graph Tableoption.

20 HDM Manager
Viewing the Select the Economic Analysis option at the main menu to view the economic
Economic analysis performed by the HDM model. When you select this option, theAnalysis following table appears.
Economic Analysis (million US DOLLARS)Internal
Constr. Periodic Recurrent Total Vehicle Total Net Rate ofStra Recons. Maint. Maint. Agency Operating Society Present Returntegy Costs Costs Costs Costs Costs Costs Value (X)
0.0% Discount Rate
1 0.00 6.00 0.74 6.74 74.6 81.3 0.0 NONE2 7.74 1.89 0.84 10.47 45.0 55.5 25.9 17.13 7.74 1.89 0.84 10.47 45.8 56.2 25.1 18.74 7.74 1.89 0.83 10.46 46.5 57.0 24.3 20.85 7.74 1.89 0.83 10.46 47.4 57.9 23.5 MANY
12.0% Discount Rate
1 0.00 2.40 0.31 2.71 26.7 29.4 0.0 NONE2 8.50 0.43 0.35 9.28 16.9 26.2 3.2 17.13 7.58 0.39 0.34 8.31 17.7 26.0 3.4 18.74 6.76 0.35 0.34 7.44 18.4 25.8 3.6 20.85 6.02 0.31 0.34 6.67 19.0 25.7 3.7 MANY
NPV Sensitivity Graph Table Output Table Exit
To print, save into an ASCII file or export the table to Lotus 1-2-3, select theOutput Table option. If you save or export the table, the program asks for afilename. Enter a legitimate DOS filename including a path and extension ifnecessary. Select the NPV Sensitivity option to compute the Net PresentValue of all strategies for a range of discount rates. Select the Graph Tableoption to graph the table.
Producing the Select the Project Summary option to view, print, or export a summaryProject Sulmmaiy report for your selected project (see Annex 1). Your selected project should
ProJect Summary be one of the four strategies being analyzed (second strategy to fifthstrategy). Remember that the first strategy is the base strategy (withoutproject case) used to compute the benefits of implementing the otherstrategies. The summary report prints for the without project case (firststrategy) and for the selected project the following information:
- Roughness Prpgression- Average Daily Traffic- Periodic Maintenance Actions- Financial Road Agency Costs- Economic Vehicle Operation Costs- Economic Total Society Costs- Net Economic Benefits- Project Net Present Value- Project Internal Rate of Return

HDM Manager 21
Note that even if the HDM program finds many Internal Rates of Return(MANY is displayed at the Economic Analysis screen) for a particularstrategy, the project summary report routine computes the rates of return andpresents the appropriate rate of return for the strategy. The appropriate rateof return will be the first rate of return greater than the discount rate if thenet present value is positive, and the first rate of return less than the discountrate if the net present value is negative.
Working with Select the Other Options option at the main menu to perform any of the tasks
Other Options listed in the Other Options menu (shown below).
Export ResuLts
View HDM-III Output Files
Print HDM-III Output FiLes
Keep HDM-III Output Files
Delete a Data Set
Copy a Data Set
Copy Att Data Sets
Other Options |- Exit
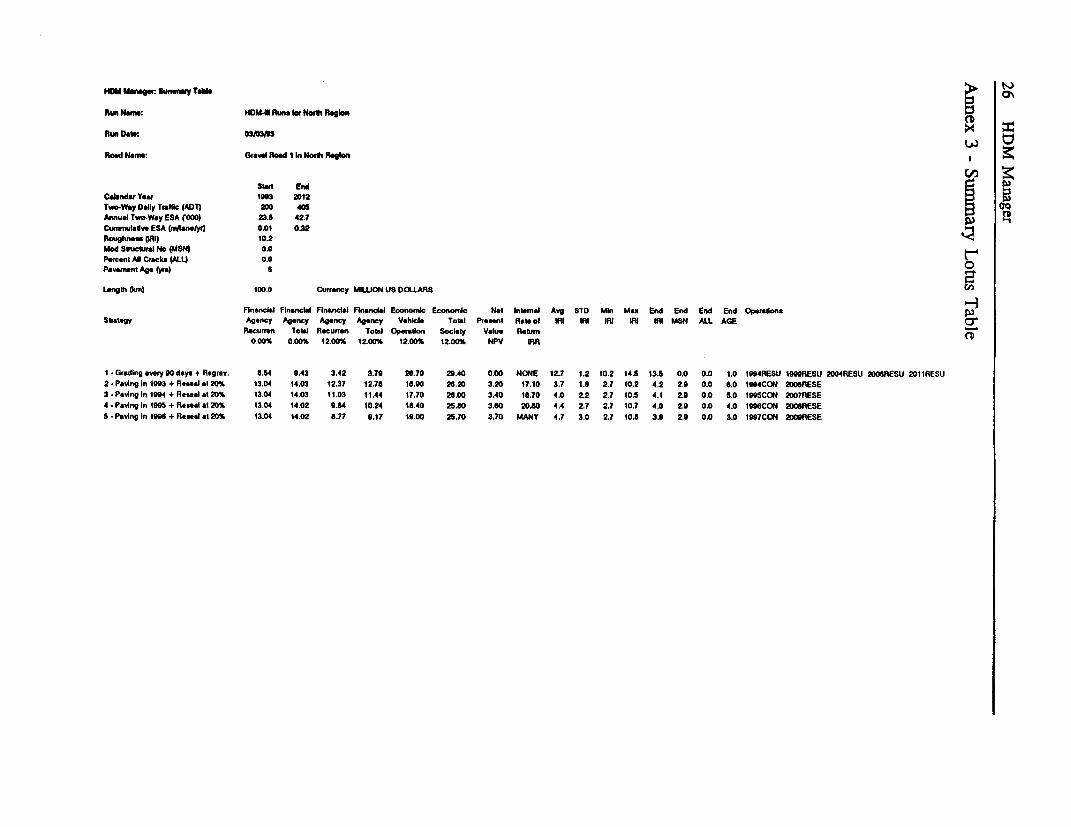
Select the "Export Results " option to export the results to Lotus 1-2-3 orDbase. You can create a Detailed Lotus 1-2-3 Table (see Annex 2), or aSummary Lotus 1-2-3 Table (see Annex 3). When you select this option, theprogram asks for a filename. Enter a legitimate DOS filename including apath if necessary. Note that you don't have to include the .WK1 or .DBFextension in the filename. The Lotus 1-2-3 tables can be used to prepare plotsor charts, or perform further analysis of the results. The Dbase tables can beused to merge the results of different roads. For this purpose when creatingthe Dbase Results Table, you can give to each road and strategy anidentification code.
Select the "View the HDM Output Files" option to view the output filescreated by HDM or any text file. When you select this option and the file toview, the file you selected is displayed on the screen. Use the arrow keys tomove through the file and press the ESC key to return to the previous memn.
Select the "Print the HDM Output Files" option to print the output filescreated by HDM. When you select this option, you have to select the file youwant to print and a printer from a list of available printers. Note that theHDM output files contain 132 characters per line.
22 HDM Manager
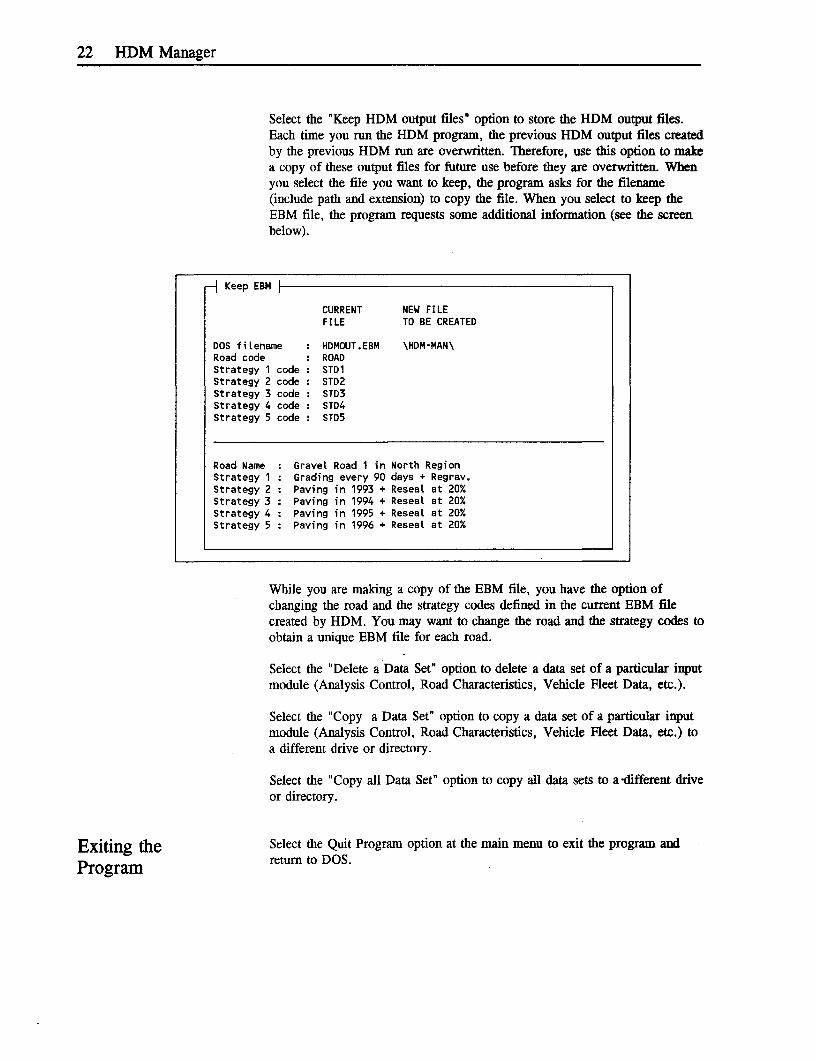
Select the "Keep HDM output files" option to store the HDM output files.Each time you run the HDM program, the previous HDM output files createdby the previous HDM run are overwritten. Therefore, use this option to makea copy of these output files for future use before they are overwritten. Whenyou select the file you want to keep, the program asks for the filename(include path and extension) to copy the file. When you select to keep theEBM file, the program requests some additional information (see the screenbelow).
Keep EBM
CURRENT NEW FILEFILE TO BE CREATED
DOS filename HDMOUT.EBM \HDM-MAN\Road code ROADStrategy 1 code STD1Strategy 2 code STD2Strategy 3 code STD3Strategy 4 code STD4Strategy 5 code STD5
Road Name Gravel Road 1 in North RegionStrategy 1 Grading every 90 days + Regrav.Strategy 2 Paving in 1993 + Reseal at 20%Strategy 3 Paving in 1994 + Reseal at 20%Strategy 4 Paving in 1995 + Reseal at 20%Strategy 5 Paving in 1996 + Reseal at 20%
While you are making a copy of the EBM file, you have the option ofchanging the road and the strategy codes defined in the current EBM filecreated by HDM. You may want to change the road and the strategy codes toobtain a unique EBM file for each road.
Select the "Delete a Data Set" option to delete a data set of a particular inputmodule (Analysis Control, Road Characteristics, Vehicle Fleet Data, etc.).
Select the "Copy a Data Set" option to copy a data set of a particular inputmodule (Analysis Control, Road Characteristics, Vehicle Fleet Data, etc.) toa different drive or directory.
Select the "Copy all Data Set" option to copy all data sets to a'different driveor directory.
Exiting the Select the Quit Program option at the main menu to exit the program and
Program return to DOS.
HDM Manager 23
Storing the Data The default setup of the HDM Manager is to store the data sets in the HDM-Sets 0in Other MAN directory (current directory). If you want to store the data sets inSets n O er another disk drive or directory, start the program as follows:
DirectoriesHDM-MAN xxxxxxx
replace xxxxxxx by the disk/directory path. For example:
HDM-MAN c:\hdmdata\
Printing the To print the graphs, you have the following options::
Graphs a) To produce a screen dump to an Epson printer, IBM Proprinter
printer, or HP Laserjet printer, press the F7 Key while displaying agraph.
b) To print a high quality graph in a Lasetjet printer, press the F9Key while displaying a graph.
Note that if you run the HDM Manager under Windows, you can alsocapture the graphs using the clipboard of Windows.
Monochrome HDM Manager detects if you have a color or monochrome board and sets theMonitors screen colors accordingly. If you want to force HDM Manager to use the
monochrome palette (for example on portable computers), start the programas follows:
HDM-MAN xxxxxxx M
replace xxxxxxx by the disk/directory path. For example:
HDM-MAN c:\hdmdata\ M
HDM Manager The HDM program reads a series of input files (ASCII text files) and after itand HDM computes the results, it creates another series of output text files. The HDM
Manager program stores the input data and the results in Dbase files.Therefore, the HDM input files you created with your word processor orwith the HDM Input Data Facility are not compatible with HDM Manager.That means that you cannot import the data stored in HDM input files intoHDM Manager.
The 11DM Manager creates all the required HDM input files before it runsHDM. These files are named HDMDATA.*. That is, HDMDATA.RUN,HDMDATA.AAA, HDMDATA.BBB, etc. You can view and modify thesefiles with a word processor or the HDM Input Data Facility to run the HDMmodel directly.
24 HDM Manager
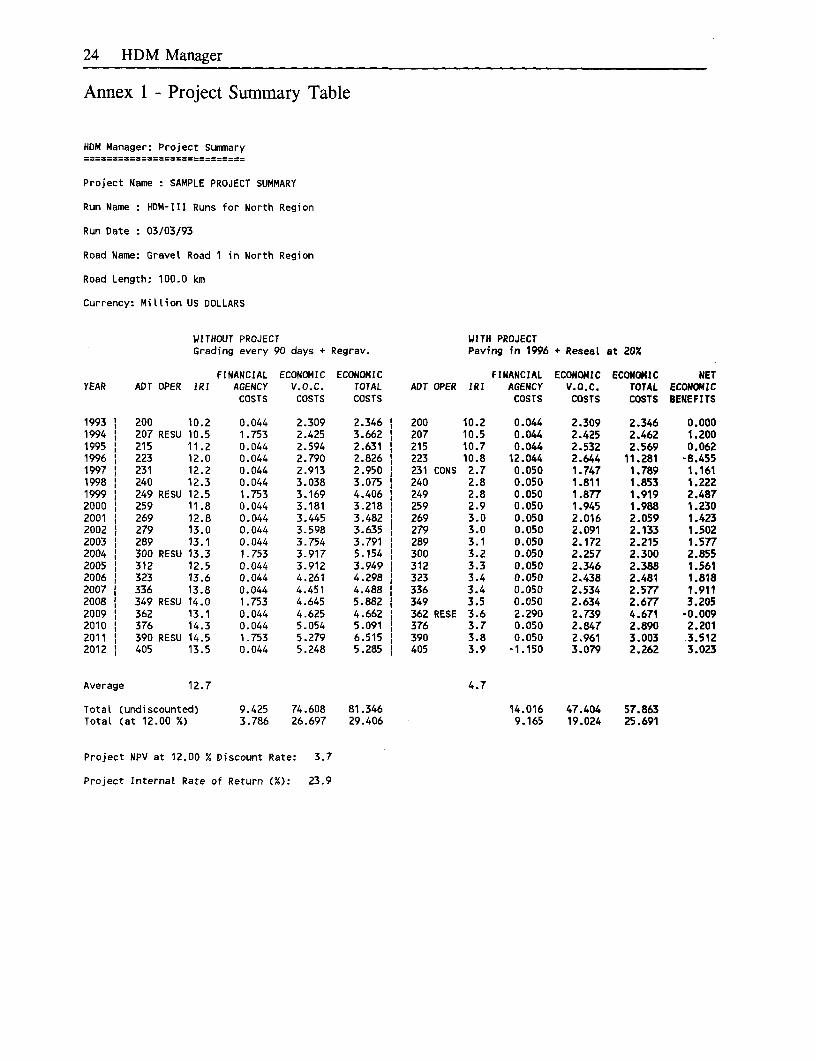
Annex 1 - Project Summary Table
HDM Manager: Project Summary
Project Name : SAMPLE PROJECT SUMMARY
Run Name : HDM-III Runs for North Region
Run Date : 03/03/93
Road Name: Gravel Road 1 in North Region
Road Length: 100.0 km
Currency: Million US DOLLARS
WITHOUT PROJECT WITH PROJECTGrading every 90 days + Regrav. Paving in 1996 + Reseat at 20%
FINANCIAL ECONOMIC ECONOMIC FINANCIAL ECONOMIC ECONOMIC NETYEAR ADT OPER IRI AGENCY V.O.C. TOTAL ADT OPER IRI AGENCY V.O.C. TOTAL ECONOMIC
COSTS COSTS COSTS COSTS COSTS COSTS BENEFITS
1993 200 10.2 0.044 2.309 2.346 200 10.2 0.044 2.309 2.346 0.0001994 2 207 RESU 10.5 1.753 2.425 3.662 207 10.5 0.044 2.425 2.462 1.2001995 215 11.2 0.044 2.594 2.631 215 10.7 0.044 2.532 2.569 0.0621996 223 12.0 0.044 2.790 2.826 I 223 10.8 12.044 2.644 11.281 -8.4551997 231 12.2 0.044 2.913 2.950 231 CONS 2.7 0.050 1.747 1.789 1.1611998 240 12.3 0.044 3.038 3.075 240 2.8 0.050 1.811 1.853 1.2221999 249 RESU 12.5 1.753 3.169 4.406 249 2.8 0.050 1.877 1.919 2.4872000 259 11.8 0.044 3.181 3.218 259 2.9 0.050 1.945 1.988 1.2302001 269 12.8 0.044 3.445 3.482 269 3.0 0.050 2.016 2.059 1.4232002 279 13.0 0.044 3.598 3.635 279 3.0 0.050 2.091 2.133 1.5022003 289 13.1 0.044 3.754 3.791 289 3.1 0.050 2.172 2.215 1.5772004 1 300 RESU 13.3 1.753 3.917 5.154 300 3.2 0.050 2.257 2.300 2.8552005 1 312 12.5 0.044 3.912 3.949 1 312 3.3 0.050 2.346 2.388 1.5612006 1 323 13.6 0.044 4.261 4.298 1 323 3.4 0.050 2.438 2.481 1.8182007 336 13.8 0.044 4.451 4.488 336 3.4 0.050 2.534 2.577 1.9112008 349 RESU 14.0 1.753 4.645 5.882 349 3.5 0.050 2.634 2.677 3.2052009 362 13.1 0.044 4.625 4.662 362 RESE 3.6 2.290 2.739 4.671 -0.0092010 376 14.3 0.044 5.054 5.091 376 3.7 0.050 2.847 2.890 2.2012011 390 RESU 14.5 1.753 5.279 6.515 390 3.8 0.050 2.961 3.003 3.5122012 1 405 13.5 0.044 5.248 5.285 1 405 3.9 -1.150 3.079 2.262 3.023
Average 12.7 4.7
Total tundiscounted) 9.425 74.608 81.346 14.016 47.404 57.863Total (at 12.00 %) 3.786 26.697 29.406 9.165 19.024 25.691
Project NPV at 12.00 % Discount Rate: 3.7
Project Internal Rate of Return (%): 23.9

HIW M_:ge 0e1d Te
Run NaM: HDON- Runs lo Moult Region
Run Date: 03103/93
Road Name: GrIvel Road I In Nroth Rgion
Road Langth #un): lOOD0 ,n US DOCLARS)
2-Way 2-Way Roughn Peukdic All W¶ie Ara Poioe Rut SD Rut Modified Surta Gravel FnnciaW Fnbcil Economl Economi Econodi Economl NatDaily Trali ESA Annus IRI Mainbane Crcke Cracke Revelled Are Dept De$t Stuctural Type Thicknes Agency Agency Agency Ancy Vehicl Socety Economl
Strategy Yer (vpd) pOO) D re) A#plld (%) N (%) %) (rim (nan) Number Code (rat Capital Recunen Capital Racurren Operalo To Benefits (
I - GradIng every 90 days + llRegrv 1993 200.0 23.6 102 0.0 0.0 0.0 0.0 00 0.0 00 GRAV 71.9 OC0O 0.044 0000 0.037 2.309 2.346 0.000 -1994 207.0 24.5 10S RES&J 0.0 0.0 0.0 0.0 0.0 0.0 0.0 GRAV 193.2 1.709 * 0.044 1.2D0 0.037 2.425 3.002 0.000 CC1996 215.0 25.3 11.2 0.0 0.0 0.0 0.0 0.0 0.0 0. GRAV 143.0 0. 0.044 0.000 0.037 2.594 2.631 0.00 A
096G 223.0 29.1 12.0 0.0 0.0 0.0 0.0 0.0 0.0 0.0 GRAV 133 O 0.000 044 OOO 0.037 2.790 2.826 0.0001997 231.0 25.9 12.2 0.0 0.0 0.0 0.0 0.0 0.0 o0 GRAV 102.7 0.000 0.044 0.000 0.037 2.913 2.950 o.0001996 240.0 27.7 12.3 0.0 0.0 0.0 00 0.0 0. 0.0 GllAV 71.3 0.000 0.044 O.OCO 0.037 3.030 . 3.075 0.000 I9W 249.0 26.6 12S RESU 0.0 0.0 0.0 00 0.0 0.0 0.0 GRAV 180.2 1.709 0.044 1.200 0.037 3.169 4.400 0.000200o 259.0 20.s 11. 0.0 00 0.0 0.0 0.0 0.0 0.0 GRAV 156.4 0.000 0.044 O.0DO 0.037 3.151 3.216 0.0002001 260.0 30.4 12.8 0.0 0.0 0.0 0.0 0.0 0.0 0.0 GRAV 1229 o0o0 0.044 0.000 0.037 3.445 3.4e2 o.ooo
2c02 279.0 31.4 13.0 0.0 0.0 0.0 0.0 0.0 0.0 0.0 GRAV 80.6 0.000 0.044 O.00 0.037 3.598 3.03s 0.0002D03 299.0 32.4 13.1 0.0 0.0 0.0 0o0 0.0 0.0 o0 GRAV 53.5 O.0o 0.044 O.OD 0.037 3.754 3.791 O.0002004 300.0 33.4 133 RESU 0.0 0.0 0.0 0.0 0.0 0.0 0.0 GRAV 167.7 t.709 0.044 1.2D0 0.037 3.917 5.154 0.OD02005 312.0 34.4 12.5 0.0 0.0 0.0 0.0 0.0 0.0 00 GRAV 131.0 0.000 0.044 O.OD 0.037 3.912 3.949 0.000
2500 323.0 35.5 13.0 0.0 00 0.0 0.0 0o0 0o0 O GRAV 93.4 0.000 0.044 o.o00 0.037 4.2e1 4.28 0.000
2007 336.0 36.0 13.0 0.0 0.0 0.0 0.0 0.0 0.0 0.0 GRAV 55.0 O.O0 0.044 0.000 0.037 4.451 4.488 oo.0206 349.0 37.7 140 RESU 0.0 00 0.0 0.0 0.0 00 0.0 GRAV 105.6 1.709 0.044 1.250 0.037 4.645 5.582 OODO
2509 362.0 38.9 13.1 0.0 0.0 0.0 00 0.0 0.0 0.0 GRAV 125.2 OC0 0.044 0.000 0.037 4.625 4.662 0.0002510 370.0 40.1 14.3 0.0 0.0 0.0 0.0 0.0 0.0 0.0 GRAV 03.8 o0oo 0.044 O.000 0.037 5.054 5.09t1 oo.
20tt 390.0 41.4 145 RESU 0.0 0.0 0.0 0. 0.0 00 O GRAV 191.4 1.709 0.044 1.200 0.037 1.279 6.515 0.000
2012 405.0 42.7 135 0.0 0.0 0.0 0.0 0.0 O 00. GRAV 147.8 0.000 0.044 0.000 0.037 5.248 5.25 o0c0
2- Paving in 1993 4 eal at 2D% 19t3 240.0 23.6 10.2 0.0 00 0.0 0.0 0.0 00 0.0 GRAV 71.9 12.0 0.044 .4000 0.037 2.309 10.46 -O.6001964 207.0 24.5 2.7 CONS 0.0 00 0.0 0.0 22 10 2.8 ST 0.0 0.000 O050 o.o0 0.043 1 J72 1.614 2.047t945 2t5.0 25.3 2.7 0.0 0.0 0.0 o0 2.S 1.1 20 ST 0.0 OOO O.0 o.ooo 0.043 t.530 1A72 osss
I9wo 223.0 26.1 2J 0.0 00. 0.0 o0 2.7 1.2 2z ST 0.0 Oc0 0.00 o.0oo 0.043 1.669 1.732 tDs51997 231.0 29.9 2.9 0.0 00 0.0 00 30 1.2 2. ST 0.0 ooc 0060 0.000 0.043 1.711 1.793 1.157
1990 240.0 27.7 3.0 0.0 0.0 0.0 0.0 3.1 1.3 2.8 ST 0.0 OttO 0.00 0.000 0.043 1.J14 1J57 1.2101096 249.0 2Z.0 3.0 O 0.0 0.0 0.0 33 1.3 z2 ST 00 00 O6 OCO 0.043 1161 1.923 2.48
20to 214.0 29.5 3.1 0.0 0.0 0.0 0.0 SA 1.3 2. ST 0.0 OCo 00D0 OcO 0.043 1064 1.997 I2
CAMrPeden .4 Ib-legle idntenaConsr Peddc Recurent TOtl VeSic Tol Not Rate ofRAecn Mtin" Menlen Agony Opwe 4 Slad Pe tb PASun
staeCe Code Code COde Co_ Code Coats Ve M
lcosrtA Rete 1t2O
1 Graing evwy90day 4 Raw 00 2.40 0.31 2.71 26.70 33.40 0Aa - Pwadg Ibn 1 + Ree at M% 6AO OAS 06s OAS 1900 260.1 3.2 17.1
- PevOg in 164+ eadt 4a26% 70A 0AS 0.34 O.31 17.70 2.06 SA 1.74 . PAWInt 1996. + Re_A 403% 6.7 6.3 0.54 744 M.40 2S60 3 26.6S-Paing&tV eaDai2 6.s9 "01 9.84 GM SAO a.70 S.?
CD
MDM Mmag r S_mn y Table t
R1n NHum: M-tl Rune lor iha Ragln
Run Dxte: 0303 4
Road Nome: Gravat Road I In Nont Ragio
Stait EndCaldr Ya 1 093 2012Two-Way Dalty Tnaftk (ADT) 200 405 (IQ
Annual Two-Way ESA (000) 2t3. 42.7Cunamutativa ESA (mintne/yr) 0.01 0.32Reughnoxx ORI) 10.2Mod SxntcWra No (ISN) 0.0PFernt Al Cracks (ALL) 0.0 0Pavenmnt Age (yr 5 0
Lnth (knt) 100.0 Currency MIUON US DOLLARS
Financial FinncIa FInaneal FinancIal EconomIe Economic Net lntemal Avg STO Min Max End End End End Operatona
Strategy Agency Agency Agency Agency Vehicle Total Premnt Rate of IFR IRI IrU R t IPJ MSN ALL AGE
Recurrn Total Rvcurnen Tota OperaUon Society Value Rabim0.00% 0.00% 12.00% 12.00% 12.00% 12.00% NPV iRR
I . Grding every 00 days + R grav. 6.54 0.43 3.42 3.79 2t.70 29.40 0.00 NONE 12.7 1.2 10.2 14.5 13.5 0.0 0.0 1.0 1tt4RESU 1000RESU 2004RESU 200tRESU 2011RESU
2 -PavIngIn 1003 + R*weal at 20% 13.04 14.03 12.37 12.76 16.00 26.20 3.20 17.10 3.7 1.o 2.7 10.2 4.2 2.0 0.0 6.0 1004CON 200tRESE
3 -Pvringin 1004 + Resealat20% 13.04 14.03 11.03 11.44 17.70 26.00 3.40 18.70 4.0 2.2 2.7 10.5 4.1 2.9 0.0 5.0 lOOSCON 2007RESE
4 Paving In 1995 + Rasesl at 20% 13.04 14.02 9.84 10.24 18.40 25.80 3.60 20.0 4.4 2.7 2.7 10.7 4.0 2.0 0.0 4.0 1tttCON 200tRESE
5 - Paving In ¶00 + Reaa at 20% 13.04 14.02 6.77 0.17 10.00 25,70 3.70 MANY 4.7 3.0 2.7 ¶0.8 3.0 2.9 0.0 3.0 1907CON 2)00RESE
HDM Manager 27
References
1. The Highway Design and Maintenance Standards Series:
- Vehicle Operating Costs: Evidence from Developing Countries. Andrew Casher and Robert Harrison.
- Vehicle Speeds and Operating Costs: Models for Planning and Management. That Watanatada, AshokM. Dhareshwar, and Paulo Roberto S. Rezende Lima.
- Road Deterioration and Maintenance Effects: Models for planning and Management. William D. 0.Paterson.
Washington, D.C.: Transportation Department, World Bank, 1987.
2. The Highway Design and Maintenance Standards Model: HDM-PC User's Guide and PC Disks,Rodrigo Archondo-Callao and R. K. Purohit. Washington D.C.: Transportation Department, WorldBank, 1989.
Distributed Exclusively by:
McTransCenter for Microcomputers in TransportationUniversity of Florida512 Weil HallGainesville, FL 32611-2083(904) 392-0378 1-800-226-1013McFax (904) 392-3224McLink (904) 392-3225
3. The highway Design and Maintenance Standards Model
- Volume 1. Description of the HDM-III Model
- Volume 2. User's Manual for the HDM-II Model
Thawat Watanatada, Clell G. Harral, William D. O. Pateron, Ashok M. Dhareshwar, Anil Bhandari,and Koji Tsunokawa. Washington D.C.: Transportation Department, World Bank, 1987.


