hde available nasa sponorsfip 0 9. 6 semination of earth ... · semination of earth resources...
TRANSCRIPT
"hde available under NASA sponorsfip 0 9. 6In the interest of early and wide dis-semination of Earth Resources SurveyProgram information and without liabilityfor any use made thereof."
Investigation Title: Utilization of ERTS-A Data in Geological Evaluation,Regional Planning, Forest Management, and WaterManagement in North Carolina
Proposal No. 18
Contract No. NAS5-21732
Principal Investigator: Charles W. Welby, Dept. of Geosciences, NCSU
Date: August 31, 1973
The objective of the contract is to demonstrate the usefulness of ERTS-1
data to various state agencies.
The period July-August has been spent in two ways: (1) continuation of
contacts with various state and local agencies regarding use of ERTS-1
data in their functions and (2) specific project studies concerning use
of ERTS-1 data.
In the case of the second activity, specific work on use of ERTS-1 data
in mapping coastal features has been carried on and is still progressing.
A second project, evaluation of density-slicing techniques for study of
the Hofmann Forest test site and adjacent areas has been completed. A
copy of the report is attached.
A copy of a paper presented at the International Symposium on the Inter-
relationships of Estuarine and Continental Shelf Sedimentation in Bordeaux,
France, by the principal investigator accompanies this report. The fig-
ures summarize the slides used in the oral presentation.
E73-10 9 6 2 ) UTILIZATION OF ERTS-A DATA N73-3030IN GEOLOGICAL EVALUATION, REGIONALpLANNING, FOREST MANAGEMENT, AND WATERMANAGEMENT IN NORTH (North Carolina State Unclas
Univ.) 33 p HC $3.75 CSCL 08F G3/13 00962 f
https://ntrs.nasa.gov/search.jsp?R=19730021572 2018-06-01T23:41:58+00:00Z
Copies of ERTS-1 imagery at a scale of 1:250,000 have been made available
to Dr. Robert Butler of the Geology Department at the University of
North Carolina, Chapel Hill. He and his graduate students will use them
in conjunction with a regional mapping program extending across the
piedmont and mountain provinces of the western part of North Carolina and
including the Asheville area. A report on the usefulness of the imagery
for work undertaken during July through September should be received
later in he year. Cooperation of the Cape Fear Technical Institute in
groundtruth studies in the Wilmington area continues.
Future plans call for a concentrated use of ERTS imagery in study of the
geology and soils of the state planning of Region J (Raleigh area) in
part supported by the Office of Earth Resources, and the Winston Salem
area. Work will continue on ERTS imagery evaluation in the Wilmington
area in conjunction with SKYLAB. Special emphasis will be placed upon
coordinating the study with other on-going studies.
A major algae bloom has occurred late in August in the Chowan River area,
and when the August 30 imagery is returned it will be studied in conjunction
with multispectral camera data collected about a week later.
Funding of the project seems adequate at this time. Support from other
sources is constantly being sought during the efforts to bring the ERTS-1
data to potential users.
A,1
NORTH CAROLINA ESTUARINE-SHELF COMPLEX --
PLEISTOCENE TO RECENT HISTORY
Charles W. Welby
North Carolina State University
Raleigh, North Carolina 27607
Like many coastal regions the North Carolina coast has a diverse
geologic history. Its present form and the present processes are
influenced by what has gone before. The following discussion addresses
itself to two aspects of the development of an understanding of the
North Carolina coastal region. The first aspect is that of the post-Miocene
geologic history; the second is that of present-day processes and the
relation of the estuarine areas to the continental shelf.
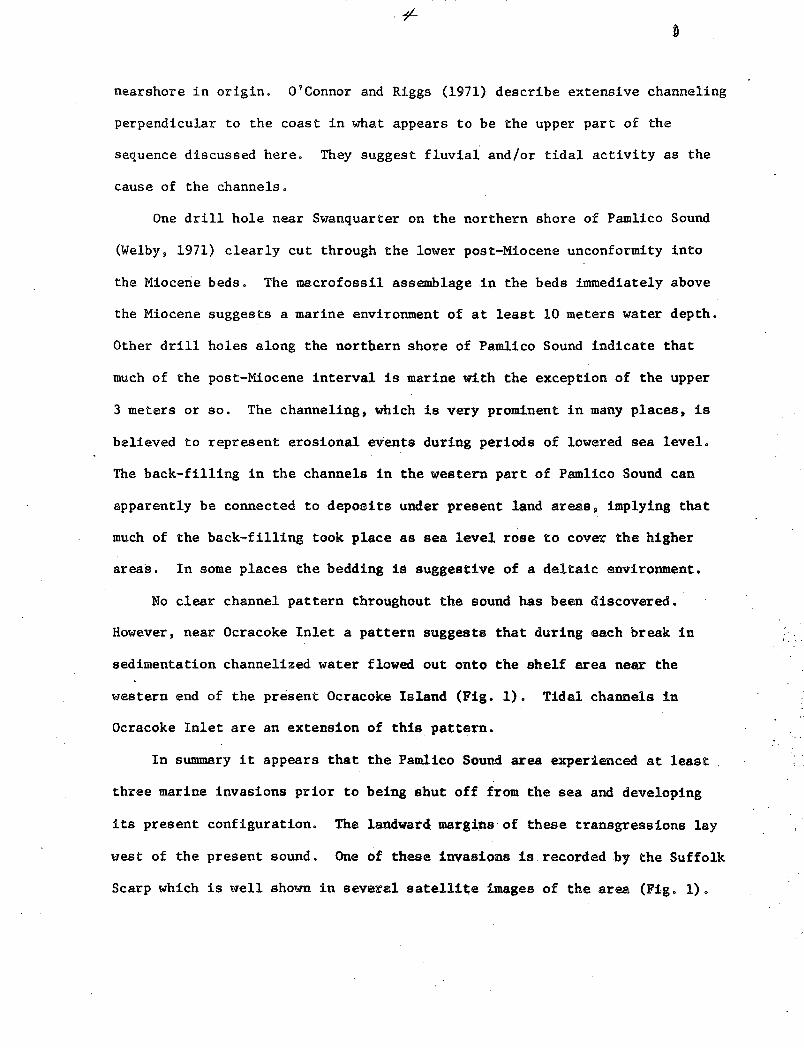
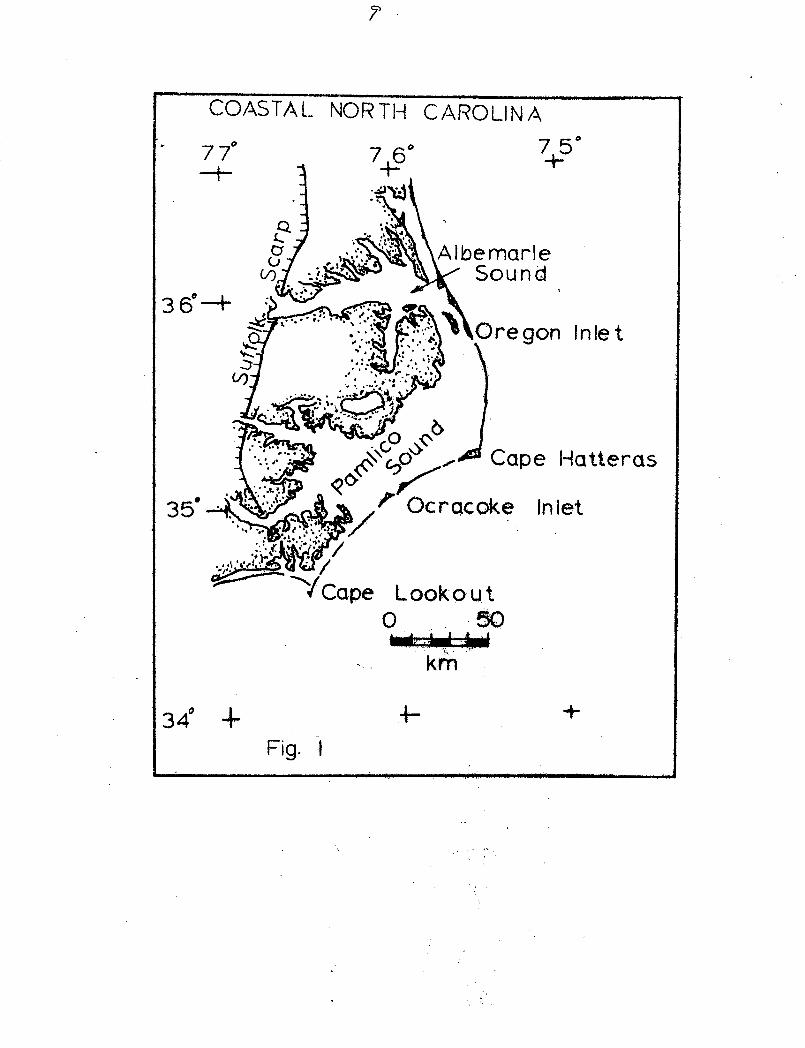
Figure 1 shows the area being described. An important element in
the discussion of the relations between the shelf and estuarine deposition
is the presence of the well-known barrier islands, the "Outer Banks."
Post-Miocene History
Generalizing about the history of the North Carolina coast, it appears
that during Late Pliocene to Early Pleistocene erosion took place. Streams
incised themselves into the Late Miocene formations, and many of the major
streams still follow the sites of this downcutting. Erosion developed an
undulose surface on the Miocene and older beds.
As sea level rose during the Pleistocene, marine water crept up the
stream valleys, and as the coastal area was inundated, sediment accumulated
to greater thicknesses in the lower areas than in the topographically
N3
higher ones. Some of the best records of Pleistocene events appear to lie
beneath the waters of Pamlico Sound and adjacent areas. In general there
is a seaward thickening of the post-Miocene section.
The Pleistocene sediments exposed on land record a mixture of marine
and nearshore environments in an as yet incompletely deciphered pattern.
So in a general way we see the Pleistocene recorded not too differently
from what we find today, except that the margin of the sea lay farther
inland than at the present.
A high resolution boomer study of the Pamlico Sound area has shown
the presence of three post-Miocene unconformities in addition to the uncon-
formity existing between the Late Miocene and Pleistocene sediments.
Shideler and Swift (1972) describe a basal boundary reflector off the North
Carolina and Virginia coasts at depths of 40 to 80 meters. The contours
shown on their map can be interpreted as extension of the structural con-
tours presented by Brown, Miller, and Swain (1972) for the top of the Late
Miocene. The geophysical work in Pamlico Sound generally agrees with the
subsurface interpretations of these authors. It thus appears that for much
of the eastern one-half of Pamlico Sound that the top of the Miocene is
between 50 and 60 meters below sea level.
The unconformities found beneath Pamlico Sound are best defined in the
geophysical records on the basis of the edges of channels, but inclined
bedding and locally cross-bedding also assist in their recognition. Swift
and Shideler (1972) recognize in the Cape Hatteras to Cape Henry stretch of
the shelf a set of unconformities which appear to correlate with those
described in this report. They attribute the sedimentation in the lowermost
post-Miocene sequence to fluvial processes and recognize the middle unit as
nearshore in origin. O'Connor and Riggs (1971) describe extensive channeling
perpendicular to the coast in what appears to be the upper part of the
sequence discussed here. They suggest fluvial and/or tidal activity as the
cause of the channels.
One drill hole near Swanquarter on the northern shore of Pamlico Sound
(Welby, 1971) clearly cut through the lower post-Miocene unconformity into
the Miocene beds. The macrofossil assemblage in the beds immediately above
the Miocene suggests a marine environment of at least 10 meters water depth.
Other drill holes along the northern shore of Pamlico Sound indicate that
much of the post-Miocene interval is marine with the exception of the upper
3 meters or so. The channeling, which is very prominent in many places, is
believed to represent erosional events during periods of lowered sea level.
The back-filling in the channels in the western part of Pamlico Sound can
apparently be connected to deposits under present land areas, implying that
much of the back-filling took place as sea level rose to cover the higher
areas. In some places the bedding is suggestive of a deltaic environment.
No clear channel pattern throughout the sound has been discovered.
However, near Ocracoke Inlet a pattern suggests that during each break in
sedimentation channelized water flowed out onto the shelf area near the
western end of the present Ocracoke Island (Fig. 1). Tidal channels in
Ocracoke Inlet are an extension of this pattern.
In summary it appears that the Pamlico Sound area experienced at least
three marine invasions prior to being shut off from the sea and developing
its present configuration. The landward margins-of these transgressions lay
west of the present sound. One of these invasions is recorded by the Suffolk
Scarp which is well shown in several satellite images of the area (Fig. 1).
It appears from drilling elsewhere in the North Carolina Coastal Plain
that the oldest post-Miocene beds extend west of the Suffolk Scarp (Daniels
and Gambel, personal communication, May, 1973) and that much of the post-
Miocene record is pre-Wisconsin in age.
Present-Day Processes
Although today's shoreline activities do not necessarily duplicate those
of the past exactly, we can get some appreciation of the energy relations
and sediment transport patterns from today's circumstances. In recent years
considerable study of coastal erosion has been undertaken and some long-term
patterns of coastwise sand movement developed (Langfelder, et al, 1968).
One recently completed study (Masterson, 1973) suggests that the net sediment
movement through the inlets is associated with the ebb tideo Thus far,
however, the coastal system has been studied piecemeal, and not all of the
pieces have been fitted together. Repetitive satellite imagery has provided
an opportunity to study some of the coastal processes synoptically.- . ::
ERTS-1 imagery
Any number of air photographs exist which show sediment movement along
the North Carolina coast and which show sediment plumes off Cape Hatteras,
Cape Lookout, and Cape Fear. With the advoF of the ERTS-1 satellite
operating on its eighteen-day cycle, it has been possible to obtain imagery
·over a large area for different wind and tide conditions. Study of the .
ERTS-1 images taken since the fall of 1972 shows the strong influence that
wind conditions have on sediment behavior in the estuaries as well as off-
shore. Only a few examples can be presented here.
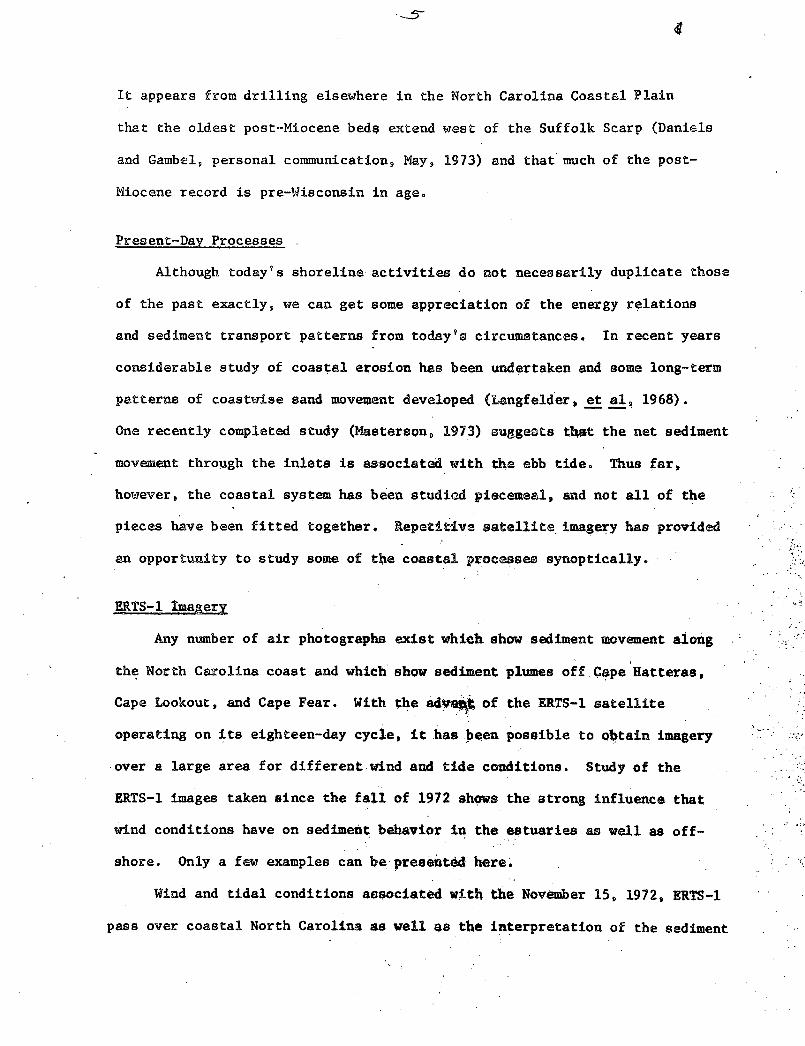
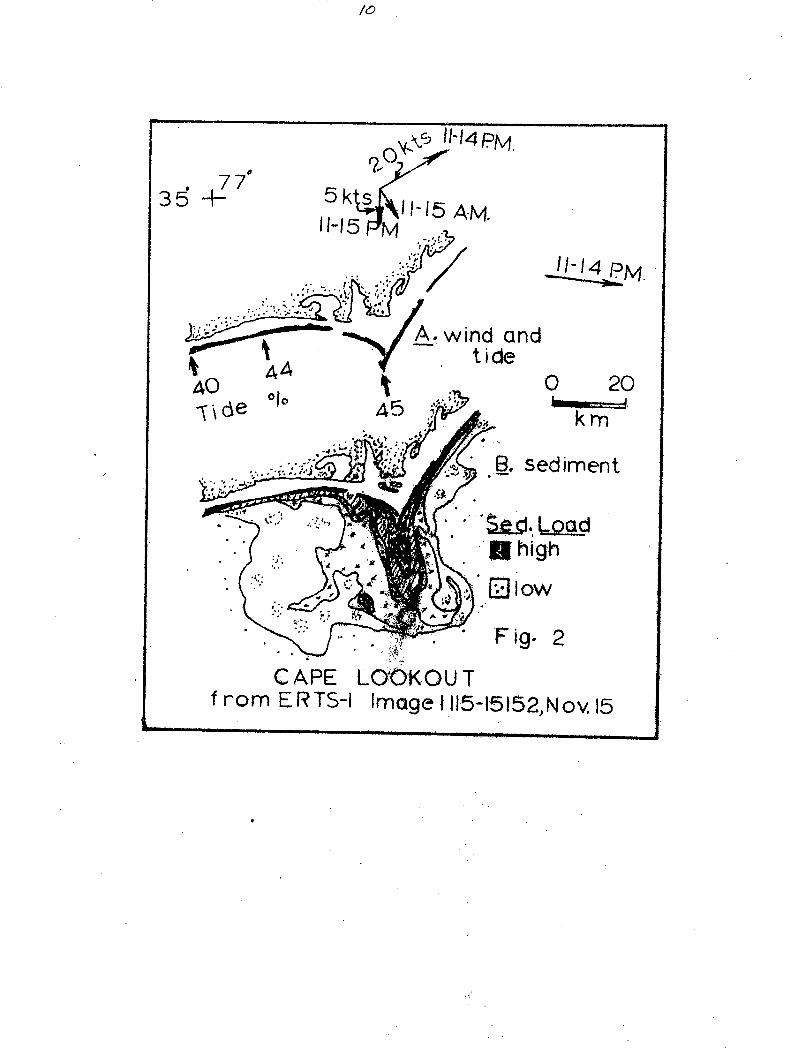
Wind and tidal conditions associated with the November 15, 1972, ERTS-1
pass over coastal North Carolina as well as the interpretation of the sediment
patterns seen on ERTS-1 image 1115-15152 are found in Fig. 2. The patterns
taken from a density slice of the .5 to .6 micron band show the decrease in
suspended material away from the Cape. The original image suggests not
only a mushroom-like plume but also a southward drift at some depth below
the surface.
Cape Hatteras and the sediment plumes adjacent to it are generally well.
known from the Apollo IX photographs. ERTS-1 has provided some interesting
imagery of this area, including information on the behavior and migration of
the Gulf Stream.
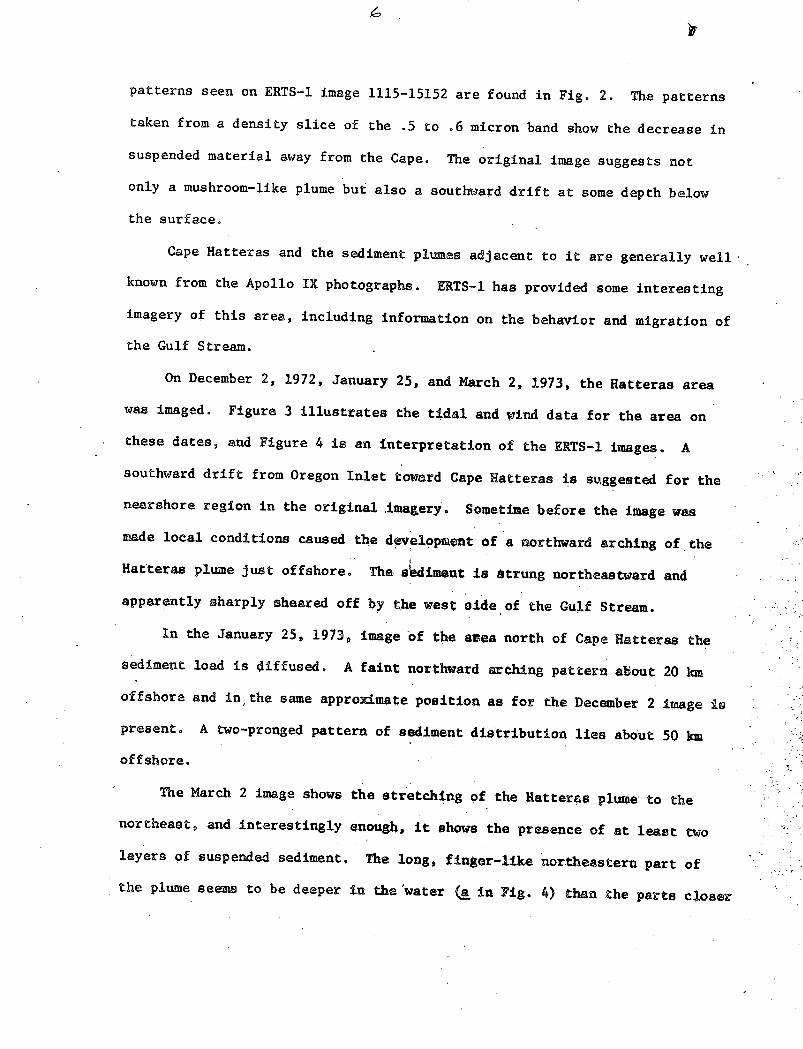
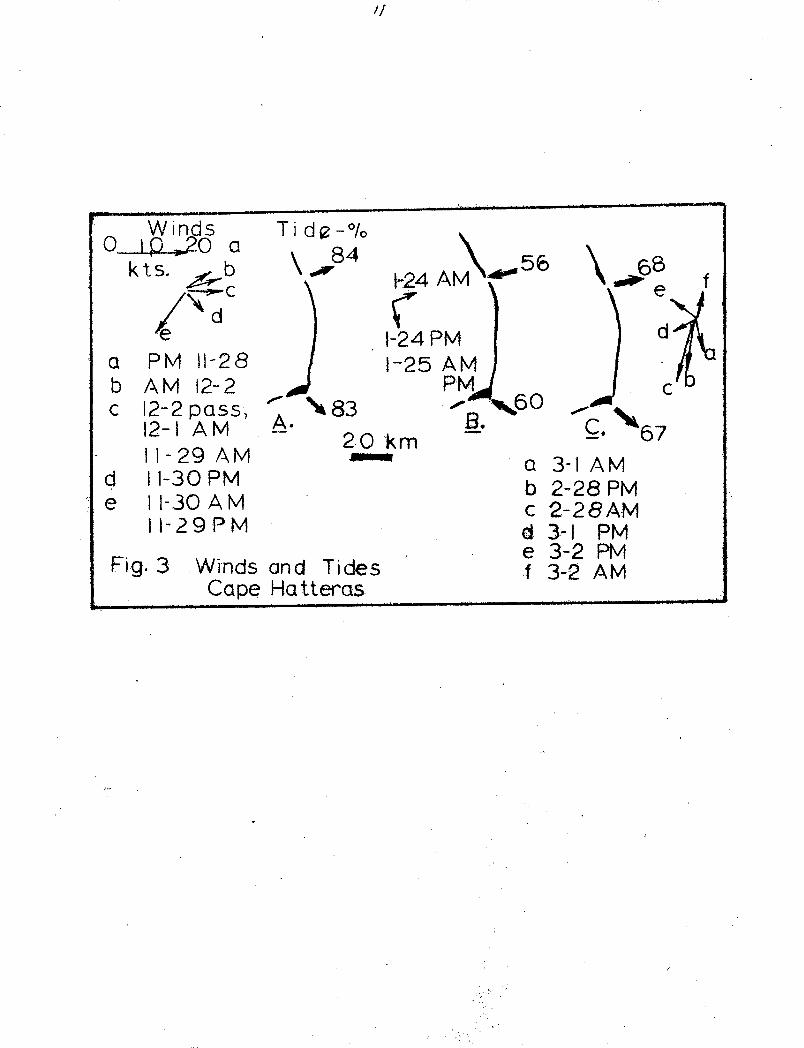
On December 2, 1972, January 25, and March 2, 1973, the Hatteras area
was imaged. Figure 3 illustrates the tidal and Vind data for the area on
these dates, and Figure 4 is an interpretation of the ERTS-1 images. A
southward drift from Oregon Inlet toward Cape Hatteras is suggested for the
nearshore region in the original imagery. Sometime before the image was
made local conditions caused the development of a northward arching of the
Hatteras plume just offshore. The 9sdiment is Strung northeastward and
apparently sharply sheared off by the west side of the Gulf Stream.
In the January 25, 1973, image of the area north of Cape Hatteras the
sediment load is diffused. A faint northward arching pattern about 20 km
offshore and in the same approximate position as for the December 2 image is
present. A two-pronged pattern of sediment distribution lies about 50 km
offshore.
The March 2 image shows the stretching of the Hatteras plupme to the
northeast, and interestingly enough, it shows the presence of at least two
layers of suspended sediment. The long, finger-like northeastern part of
the plume seems to be deeper in the'water (a in Fig. 4) then the parts closer
to the shore. The image is interpreted as showing at least two periods of
sediment injection into the system. The arching seen in the December and
January images just north of Cape Hatteras does not seem to be present at
this time. Figure 4 illustrates the several positions of the Hatteras plume
at the different times. Shifting of the plume undoubtedly has had an effect
upon the distribution of suspended material.
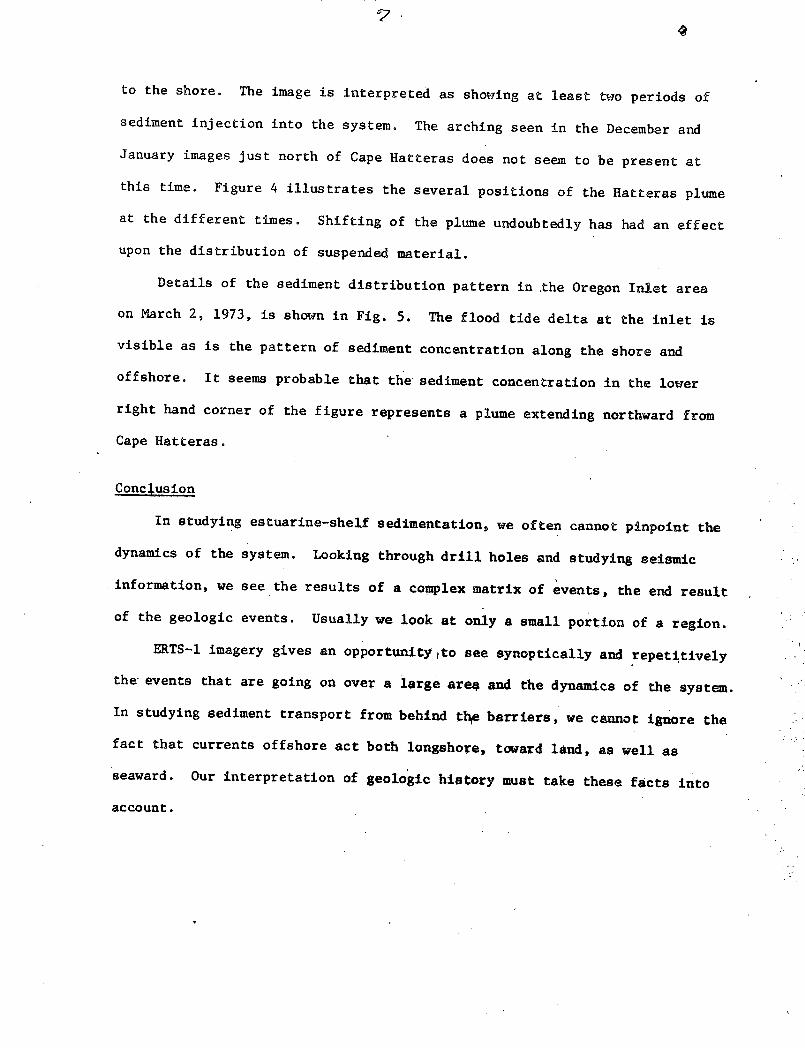
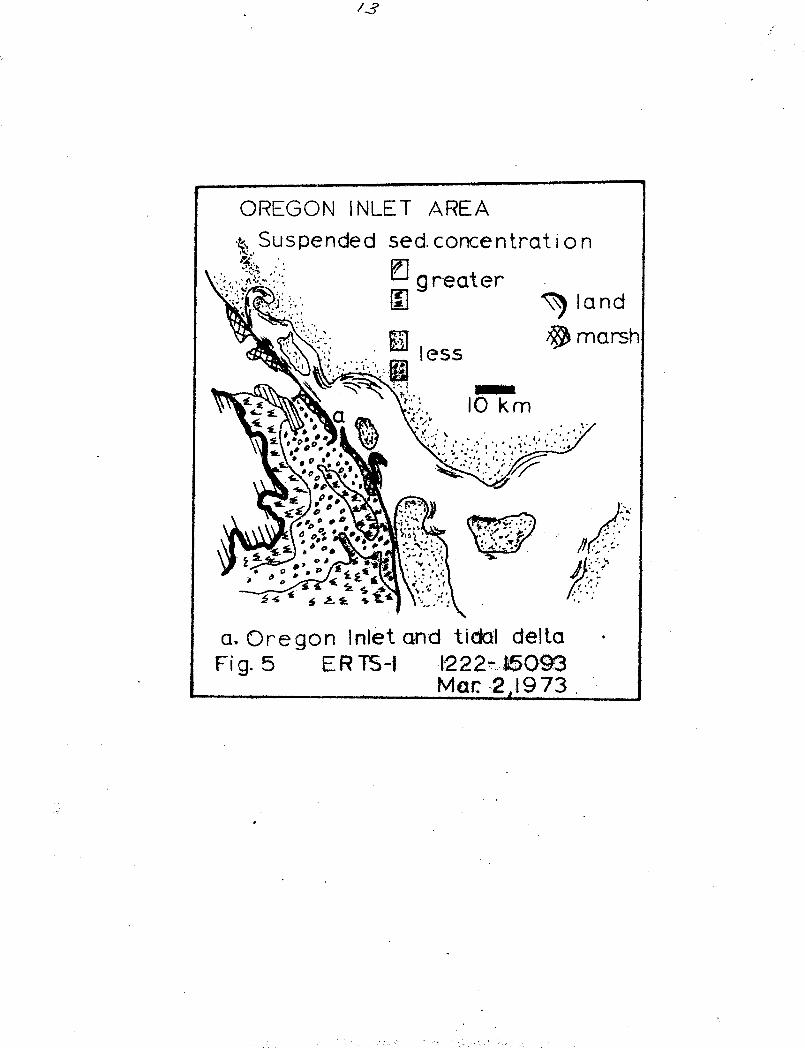
Details of the sediment distribution pattern in the Oregon Inlet area
on March 2, 1973, is shown in Fig. 5. The flood tide delta at the inlet is
visible as is the pattern of sediment concentration along the shore and
offshore. It seems probable that the sediment concentration in the lower
right hand corner of the figure represents a plume extending northward from
Cape Hatteras.
Conclusion
In studying estuarine-shelf sedimentation, we often cannot pinpoint the
dynamics of the system. Looking through drill holes and studying seismic
information, we see the results of a complex matrix of events, the end result
of the geologic events. Usually we look at only a small portion of a region.
ERTS-1 imagery gives an opportunitylto see synoptically and repetitively
the events that are going on over a large area and the dynamics of the system.
In studying sediment transport from behind the barriers, we cannot ignore the
fact that currents offshore act both longshore, toward land, as well as
seaward. Our interpretation of geologic history must take these facts into
account.

g
References Cited
Brown, P. M., Miller, J. A., and Swain, F. M., 1972, Structural andstratigraphic framework, and spatial distribution of permeabilityof the Atlantic Coastal Plain, North Carolina to New York: U.S.Geol. Survey Prof. Paper 796.
Langfelder, L. J., Stafford, D., and Amein, K., 1968,-A reconnaissanceof coastal erosion in North Carolina: Department of Civil Engr.,North Carolina State University, Raleigh, N. C.
Masterson, R. P. Jr., 1973, Sediment movement in Tubbs Inlet, NorthCarolina: M.S. Thesis, Department of Geosciences, North CarolinaState University, Raleigh, N. C.
O'Connor, M. P. and Riggs, S. R., 1971, Relict sediments within atransgressive barrier island-estuarine system, North CarolinaAtlantic coast. Paper presented at VIII International Sedimento-logical Congress, Aug. 30 - Sept. 4, 1971, Heidelberg, Germany.
Shideler, G. L. and Swift, D. J. P., 1972, Seismic reconnaissance ofpost-Miocene deposits, middle Atlantic continental shelf - CapeHenry, Virginia to Cape Hatteras, North Carolina: Marine Geology,v. 12, p. 165-185.
Welby, C. W., 1972, Post-Yorktown erosional surface, Famlico River andSound, North Carolina: Southeastern Geology, v. 13, p. 199-205.
7
COASTAL NORTH CAROLINA
7 70 7 6 75"-4 7-6" +'-- C t~~~+"
gon Inlet
Cape Hatteras
In let
Lookout0 .' .. km
km
340 4- 4- +
Fig. I, I. ~I'Btl. I1 -'.. -, . . ......
35'
I _M _ I .....g I I... I I I ___�__
P
/o
,. 11-4 PM.l- 0
~1
35
11-14 p 1
0 20
k rn
sediment
. ~ .... rr I9 3 ;
CAPE LOOKOU Tf rom E R TS-I Image 115-15152,N ov. 15
I
L
m
//
Windso0L0 a
kts. _b
a PM 11-28b AM 12-2c 12-2 pass,
12-1 AM11-29 AM
d 11-30 PMe i 1-30 AM
11-29 PM
Fig. 3 WindsCape
Ti d E-°/o
f
P ,83A.2_0
and TidesHa tteras
B1km10
C. 67
a 3-1AMb 2-28 PMc 2-28AMd 3-1 PMe 3-2 PMf 3-2 AM
-I--C CI--·.-L-- - - .· - i·--�
I
I

/ cP_
ec.2arching inDec and Ma
from ETRS-l datat + +3576 75'CAPE HATTERAS PLUMES
a. Boundary between upperand lower layer Mar 2SecL concentration decreases
seaward Fg ~~~~~~~~~Fi iii i I l I ,,,...
__ L __I
. . . .
.
.
. . . .
Sf t 0 0 t i � r n U s o $ r
OREGON INLET AREAk Suspended sed. concentration
\;;*. By: 1 g reatergod 1X1 land
' 1 .{ less' marshI ,\ : ess
N V' 10 km
a. Oregon Inlet and tidal deltaFig. 5 ERTS-1 1222- 5093
,. .Mar. 2,19 73-
ml m -- ,, . . . . m
Hf
AUG 2 1973
THE UTILIZATION OF ERTS-1 IMAGERY FOR LAND-USE CLASSIFICATION AND DE-SCRIPTION IN.THE EASTERN COASTAL PLAIN OF NORTH CAROLINA: ACTUALITIES AND POTENTIALITIES OF THE'AVAILABLE'DATA WITH SPECIAL REFERENCE TO THEUSE OF DENSITY SLICES
REPORT OF JOHN L.'WARREN
Introduction
This collection of.ideas and findings is intended to serve two pur-
.poses. One is to explain what I have learned about the area in ques-
tion and what I think should be done in the future. The second is to
provide a starting point for anyone else who wishes to pursue the use
of ERTS-1 imagery for land classification in this part of the state. If
a graduate student happens to read this,please note that this area of
endeavor is pregnant with dissertation possibilities that are entertain-
ing as well as interesting-a,, combination very few students at N.C. State
presently enjoy in their academic programs. Before detailing what's up,
a brief outline of where and whom to get information from will be given.
* Information Sources for E. Coastal Plain Land Use
The area studied in detail the most is as follows: From the Hofmann
Forest in Jones and Onslow counties east to Cedar.Island in Carteret
County; From New Bern south to Swansboro and all land and water areas
south of the Neuse- River and North of Bogue Banks. This is a rather
large area but full of diverse uses, some unique to this part of the
United States. I concentrated my attention to the Hofmann Forest and
the Central and Eastern half of Carteret'County.
1. Hofmann'Forest'Information .
The Hofmann Forest is owned'by. the North Carolina Forestry Foundation
and leased to the Hoerner-Waldorf Corporation (formerly the Albemarle
(s-
Paper Company). Researchers are welcome and the staff will assist in
any reasonable way. This writer was stuck on Plum Nearly Road 10 miles'
from anything; W.W. Wicks and help spent the'better part of a Saturday
trying to get me out. They are interested in what we are foing and
very cooperative.
The manager is W.W. Wicks whose headquarters are in Deppe, on U.S.
Highway 17 south of Maysville at the Hofmann Forest entrance. Any visit
to the forest should go thru him or his assistant so that they will at
least know you are there. In Raleigh there is little information availa-
ble in print. A book about the history of the Hofmann Forest, THE HOFiMAVNN
' FOREST, is available from the School of Forestry. It offers a general
overview of what has happened up until a few years ago. Maps of the forest
and its many roads arE available in the ERTS lab. Numbered areas are
keyed with general descriptions of what the particul ar ea containo. Th4
map should only be used at q rough qppooxt4pto4,
The best app~re of ilforfQmtion pB the Hopmann and is 74,OPO acres $t
F, T,9. Make4 a walking PhSWC pf the )1qaQe, He w4ll help with any probl,~t
or questions and :has son0e paronal alides of ~tha qg which may be usefu%4
those whq have never been there. Dr. Maki alto has extensive information
on drainage research in pocosins and fire influences and control. The in-
terested one is referred to FOREST FUELS ON ORGANIC AND ASSOCIATED SOILS IN
THE COASTAL PLAINS OF NORTH CAROLINA, S.E. FOR. EXP. STA. BULL, 144, 1962.
This is a good summary of the different vegetation types and their
fire potentials encountered in a pocosin. Also a Forest Service manuscript
THE HOFMANN FOREST FIRE by Ward and Nelson (copy available from Dr. Maki)
is an excellent account of the 18,000 acre fire in May of 1972. For further
information on pocosins consult Dr. Maki. An aerial photo composite of
portions of the'forest is available in the ERTS lab.
/16
Note: Any one who intends to do much in this area of the state
should make at least a preliminary field trip to the Hofmann or other
pocosin. There is no adequate way to describe' one until you have been
in it and gotten the feeling of vast tracts of man-less laads. Also,
careful ground-truth studies facilitate quick recognition of imagery
differences.
-2. Carteret COunty Information
County highway maps at a scale of 1"=2 miles are available for
Carteret, Onslow, Jones, Pamlico, Craven. USGS maps are available at
a 1: 250,000 scale for-the area. (There are in the ERTS lab in Bilt-
more.) Extensive information on the Croatan forest and other areas
in the area east of the Hofmann are available from Andy Weber or others
in Forestry Extension. If they don't know, they know who does. If
one is interested in coastal processes or estuarine problems the Duke
Marine'Lab in Beaufort is a fine resourceo Also UNC has a Marine. Re-
sources Institute at Morehead City. The Duke Marine Lab is the cheap-
est place to stay in the area at less than $5/night. If lodging is
desired contact Mary Fond Jones at the Duke Lab as far in advance as
possible. Explain what you are doing and the need for a place to stay.
Also, they are usually full at certain times of the year with students,
so arrangements should be made at least a week in advance.
ACTUALITIES: What was actually done
Ground truth studies
As the author was not very familiar with the area many trips were
made, one covering practically every paved road in Carteret County.
Such evaluation and data gathering are essential before any interpreta-
tion of imagery or density slices can be meaningful.
/,2
General'Highwa' Corridor Land Use Survey
Most major paved roads of the area were driven and the different
land uses were nQted. No detailed account of every use wa~ attempted.
Rather, major changes in use and/or cover type were noted as well as
any distinguishing Characteristic or unusual happening. I found that
the main uses which could be noted or changed were: FOREST COVER,
TIDAL MARSHES, AGRICULTURAL FIELDS, LOGGED AREAS, POCOSINS, URBAN
AREAS, HOMES AND FIELDS, LAKES, GRASSY AREAS, SHRUBS, POWER LINES (IF
WIDE ENOUGH), SITE-PREPARED AREAS, AIRPORTS, INTERSECTIONS, LARGE REX
CREATIONAL OR RESIDENTIAL DEVELOPMENTS, BOMBING RANGES, CANALS, BEACH
DUNES. A map including Onslow, Jones, Craven, and Carteret counties
contains a brief outline of these findings for roadways only. (Using
county highway maps). Green-forested cover; Purple-urban and built-
up areas; Red-bare agricultural fields or clearings (areas of high
reflectance); Yellow-orange-areas of tidal marsh rivers or black-water
swamps. Mileages are keyed to the car speedometer. Key to map includes
mileages giving starting points so. that any particular stretch can be
accurately located on the county highway maps. Overlays were made using
image 1205-15153-5 with the lantern slide projector for 70 mm negatives.
By aligning the green crosses on the highway map with the red crosses
on the overlay proper register can be achieved. An overlay using a den-
sity slice was not useful due to the vertical exaggeration (1.2 in the
Y-axis) in the slices. This exaggeration will be present in all of the
slices due to the curvature of the television screen from which the photo
of the images is made. Hence, any mapping efforts must account for this
difference by. compensation.
Note that vast areas on the'study area cannot be readily accessed
by car due to poor road conditions or no-road conditions. However,
reasonable ground-truth studies'can be conducted using the highway-cor-
ridor approach an4 coupling it with use of aerial photographs, ERTS-1
imagery, high-altitude photography.
(Note: U-2 photos of the coastal areas along Bogue Sound are
available; they are excellent and serve as "ground-truth" for one who
has already been in the area to some extent..)
Based on this survey and other field-trips the following areas and/
or cover types can be distinguished on ERTS-1 imagery; often enlargement
is needed to a scale of 1: 125,00 to facilitate interpretation of the
image. At scales much larger than this the enlarged image becomes too
fuzzy for feasible use.
Areas Detectable on ERTS-1 Imagery
.'o High schools and their adjacent athletic fields-usually areas of
very high reflectance (often same reflectance as central portions of
pocosins). Locations: 1 mile east of the intersection of US 70 and
NC 101 on NC 101; at the intersection of US 70 and County Road 1238
in E. Carteret County, this area is quite large with many fields in
addition to the high school and a boat-works to the east of the inter-
section.
2. Tidal marshes and rivers. Very prevalent in this area and are
best seen and studied on infrared (BAND 6) or far infrared (BAND 7).
On the keyed map they are yellow-orange and usually found where roads
cross rivers or mouths of rivers into larger bodies of water ri-
fluenced by the tides. Locations: many, a few are as follows - on
US 70 east of Beaufort, from the intersection of US 70 and County Road
(CR) 1238 east on US 70 there are numerous tidal marshes where the road
skirts the waters edge or crosses a tidal stream; also near the end of
US 70 is Cedar Island National Wildlife Rufuge - about 8-10 miles of
uninterrupted marshes and channels; on CR 1154 east of Newport are many
beautiful marshes; on NC 24 west of its intersection with US 70 the road.
crosses many rivers; where NC 24 enters Swansboro at the White Oak River
there are large expanses of tidal marshes.
3. Lakes. Many prominent lakes are in the area but must be interpreted
with care as will be explained. The infrared bands are best for delineate-
ing these lakes and their surrounding wetlands where present. Locations:
On CR 1154 east of Newport is a beautiful black-water lake and river, must
be located with care as it is surrounded.by fields and site prepared areas
of high reflectance; Great Lake, Long Lake, Little Lake, and Lake Ellis
Simon are in the eastern area of the Croatan Forest, these lakes are often
very silty and do not always have definitely delineated boundaries. In
density slices they are often similar in reflectance to the more turbid
parts of the Neuse; Great Lake has a southern extension which is dammed
off during the winter part of the year and planted with brown millet or
other grain to serve as a source of feed for migratory waterfowl in the
area; this damming can be readily seen in ERTS-1 imagery; Lake Ellis
Simon appears to be filling in rapidly and should be field checked if
feasible; in the western area of the Croatan, Catfish Lake is highly
visible as a linkage between the two main pocosins in the Forest. CR 1100
west of US 70 can serve as an access to this area and I would suggest that
the rangers for this area be contacted as some roads are often in very
poor condition for car travel.
n2 o
4. Agricultural fields.' Numerous. At present no study of differences
by' crop has beeT done and the'author has had no success in determining
whether particular crops can be delineated. Most fields have high re-
flectances in the 'yellow range on density slices and the cyan range for
less reflective fields.
5. Recreational or residential developments: detectable but need to
know general location. SeaGate is visible.(located on NC 101 at the
Intracoastal Waterway bridge) on the west side of the waterway. This
reflectance is accounted for due to the removal of the forest cover
and the present of mainly sand and sandy beaches in the area.
6. Roads and Power lines: highly visible; power lines are usually
straighter for longer distances and in areas of little population as
along Roper Road in the Hofmann Forest (to be discussed later).
7. Airports: highly reflective and visible. Marine Corps Air Station
at Cherry Point north of NC 101 and US 70.
8. Bombing Range: in east Carteret Count east of CR 1300 and north
of US 70. Most highly reflective; we think this has been drained and
is kept high and dry without substantial vegetation; further information
as to ground cover should be sought from the Marine Base at Cherry
Point if possible. This large square area is readily visible on all
area images and photos.
9. Old beach scarps and ridges:' most easily seen between CR 1141 and
CR 1124 in Carteret County; readily visible as light colored streaks
on images; further'investigation should be done to determine the major
causes in differences; appears to be differences in vegetation and
hence reflectance but may be topographical as well.

10. Pocosins: these are unique features only found in the coastal
areas of the Carolinas; basically a pocosin is a swamp on a hill -
that is it is a wet area that is higher than surrounding areas-
usually underlain by 20-60 inches of organic soil and then a rather
impermeable clay lens which is dry. The cover vegetation is varied
and can be of 3 types:
The low, open pocosin - low shrub species 1-3 1/2 feet high; on or-
ganic soil with 90+% organic matter and an organic layer 2 feet or
more; principal species are swamp cyrilla, fetterbush, cormnon gall.
berry, and honeycup. Overstory consists of widely scattered pond
pine usually less than 15 feet in height; contains 3 years of brush
and litter accumulation. OD weight 5.68 tons/acre.
The 1;w, dense pocosin - shrub heights average 4 feet with principal
species being swamp cyrilla, honeycup, fetterbush,. common gallberry
and widely-scattered clumps of loblolly-bay; overstory has widely
scattered pond pine; denser due to brush growth and litter accumula-
tion of about eight years. OD weight 8.45 tons/acre.
The high pocosin - plants average 14 feet high; on organic soils 138
24 inches thick; includes swamp cyrilla, loblolly-bay, common gall=
berry, and greenbrier; undisturbed brush growth and little accumula-
tion for at least nine years. OD weight 15.00 tons/acre.
Pocosins have a very distinctive appearance on ERTS-1 imagery
that is hard to explain to one who has not seen the imagery. They
appear as "smudged" areas on the image.. This appears due to the
gradations between the pocosin fringes and the central pocosin it=
self. As the center of the pocosin is approached the vegetation is
different from the edges and exhibits greater reflectance.
Principal pocosins are as follows': East Cartaret'County east of
the bombing range; a'small area'between'the'bombing range and the CR
1300 (can be easily seen'from CR 1300 north of its intersection with
CR 1163); an area between the intracoastal waterway and CR 1300; be-
tween'CR 1300 and CR 1700; in Croatan National Forest the Fakes are
separated by two large, distinctive pocosins; the Hofmann Forest in
Onslow and Jones Counties (more on this later).
11. River'Courses - particularly visible in the infrared bands, these
areas can be traced due to the distinctive vegetation of the hardwood
swamp types. Some of the more easily seen river bottoms are: the
White Oak River - starts in the Hofmann Forest and ends in the Swans-
boro area; Pettiford Creek - feeds into White Oak from Croatan Forest;
Hadnot Creek - feeds into White Oak from the Croatan;.Newport River -
west of Newport to the Newport River estuary north of Morehead City.
12. Logged and Site Prepared Areas: usually appear as areas of high
reflectance similar to agricultural fields. Main areas are around
the Hofmann Forest (to be discussed later) and in Eastern land North
Central Sections of Carteret County, east of CR 1300 and Southeast
of CR 1318.
13. Forests - forests appear as dense dark areas for the more mature
types and dark gray for thinned or partly logged areas. Better deli-
neation is given by the density slices and will be discussed later.
Detailed Examination of the Hofmann Forest Area
In addition to the highway-corridor land use survey an extensive
study was made of the Hofmann Forest area in Jones and Onslow counties.
Owned by the N.C. Forestry Foundation and leased to the Albemarle
Paper Company this 78,000 acre area has many access roads and artifi-
cial enhancements which lend it to study with ERTS-1 data. Further
detailed study will be most useful and fruitful. n this :r.a,, Are-as
such as the Hofmann which are predominantly pocosin and sw,no vesgeta-
tion are being bought at a rapid rate by paper and wood comilpanies
throughout North;and South Carolina. The possibility that such areas
can be mapped and examined utilizing ERTS-1 imagery would be of bene-'
fit to such operations as well to any proposed or planned State-widc
Land Use Plan in which land classification would be a : ei'rt gad essen ~-,
tial step. Pocosin areas are very difficult to navlgate i:.; aad in
some areas essentially closed to man. Remote sensing o sLuch a.reas9
particularly when coupled with density slicing, can be of va.uea to
government and private organizations. A review of wYhat has been learned
about this area utilizing ERTS-1 imagery and related data follcaws
General
A map of the Hofmann is available with keyed number sections to
orient the user. A large scale 1: 83,333 (approx.) photo of just the
forest was made from image 1170-15205-5. This provides a synoptic
view of the entire forest not available before and at such low cost.
Such imagery can be repeated every 18 days and would be useful to the
land manager once interpretations can be standardized. The most ap-
parent uses are large man-made changes in the land cover, These are
areas that have been recently: site-prepared. Aiso the grass airport
landing strip is visible as well as some experimental agricultural
operations within the forest.
Roads - these are very visible and their appearance is enhanced by
.their contrast with adjacent land uses or cover types. Most roads
..are bordered by drainage ditches 3 feet wide and 3-6 feet deep with
the water level 3-6 feet below the top of the road. Roper.road
-(see Hofmann Forest Map) isbordered by a 150-foot-wide power line
and right-of-way -ihich.'is grassed. This is particularly noticed in
images and the power line can be followed to the New Bern area. (as
a parenthetical note - power companies and other utilities might be
very interested in the ttilisation of ERTS-1 imagery for gross, pre-
liminary planning for placement of power transmission lines or other
utility corridors; coupled with appropriate'density slices ERTS-1
imagery could greatly aid planning efforts).
Forests - appear as dense and darker than surrounding areas; in most
areas loblolly and pond pine are present while hardwoods are found
along the river courses and in swampy areas, Commercial forests can
be clearly delineated in density slices..
Agricultural areas - the company is experimenting with various crops
in large planted areas visible on images . In order to prepare the
areas for use for crops the trees and associated Vegetation are re-
moved and then the top.layer of organic roots and mats are burned.
After all this and the removal of old stumps and roots the new field
is 3-6 feet lower than the road running next to it. Thus9 such areas
are very wet if there has been any rain recently before the image was
made. Materials not removed'or burned are piled in large berms 4-10
feet high which run parallel to the length of the fields. In areas
adjacent to the forest there are extensive agricultural activities par-
ticularly along the White Oak River which has its origin in the forest,
All imagery to date has been from winter and early spring. This should
be compared with summer imagery and crops as soon as such imagery is
available° The effects of the' crops on the' ef eotamce will. b most
interesting if there is any effect.
Site-prepared and recently logged areas - often appear same reflectance
as agricultural fields although subtle differences can be detected on
the density slice. Large areas to the west and south of the forest are
being site prepared after clearcutting, followe4 by drum choppercs may-
be burning and root raking and then plantings. Oft~e some bare soil As
exposed,though grass or other vegetation quickly grows back in this
warm, humid climate. See the Hofmann Forest Hap for these particular
areas and their approximate location.
Pocosins - this is probably the most interesting aspect of the forest.
As already mentioned pocosins have three general cover types and a
very distinctive appearance on ERTS-1 imagery. The main pocosin area
in the Hofmann Forest is known as the White Oak Pocosin and as the Big
Opening. In May of 1972 a fire burned over 18,000 acres in this area
with most of the damage in the pocosin area. Though wet large quanti-
ties of vegetation are maintained per acre and'this can become very
dry during periods of low, rainfall and low precipitation such as April
or May. Further study should seek to determine whether differences in
fire intensity can be detected by ERTSli imagery. Fires in pocosins
are frequent and images taken after a fire should be analyzed carefully.
After much study and looking at many images the pocosins stand out
due to their extremely high degree of reflectivity. Only the Marine
Corps bombing range in East Cartaret county is more reflective.
Considered opinion is that the'reflectivity is due to a less dense over-
story, pond pine occur rather'far apart and the predominant ground cover'
is 'shrubs., Vegetation in a pocosin is different from non-pocosin vege-
tation in many ways. Further study should seek to determine if these
differences'in pocosins can be detected or are being detected in density
slices.'
Two characteristics are important in evaluating pocosin images;
first, many species ip pocosins are evergreens or semi-evergreens;
secondly, many speciep have coriaceous leaves, that is their leaves
have a leathery appearance which should increase the reflectivipy of
he' vege tt ion,
T;hq.c DO e t 0 followng spaciac capjpastion ip common;
5pei*es
Swanp oyr$l1a Crtl p rfemiflora ,.Fetperbush 'LyonTa luda'Comnon gallberry 'lex g14brsHoneycup Zenobia pulvprulentaGreenbrier Smilax laurifolia & rotundifoliaLeatherleaf Chamaedaphne calyculataRedbay Persea borbonia (L.) Spreng.Pond pine sprouts Pinus serotina Michx.
Low, dense pocosin species composition
Species
Swamp cyrilla Cyrilla racemiflora'L.Honeycup Zenobia pulerulentaFetterbush' Lyonia luciaCommon gallberry Ilex glabraGreenbrier'- Smilax'lauriflora & rotundifloraChokeberry 'Aronia'arbutifoliaRedbay 'Persea borbonia (L.) Spreng.White Bay Magnolia'virginiana L..Bracken Fern 'Pteridium 'aauiliniumSheep Laurel''Kalmia'angustifolia
Parceni:
1Q0
l0g
10%
Percent
35%35%
.15%10%
5%
Evergreen Coriaceoua
x xx x
x
x xxxx
,Evergreen Coriaceous
x x
xxx x
xx x
x x
. :
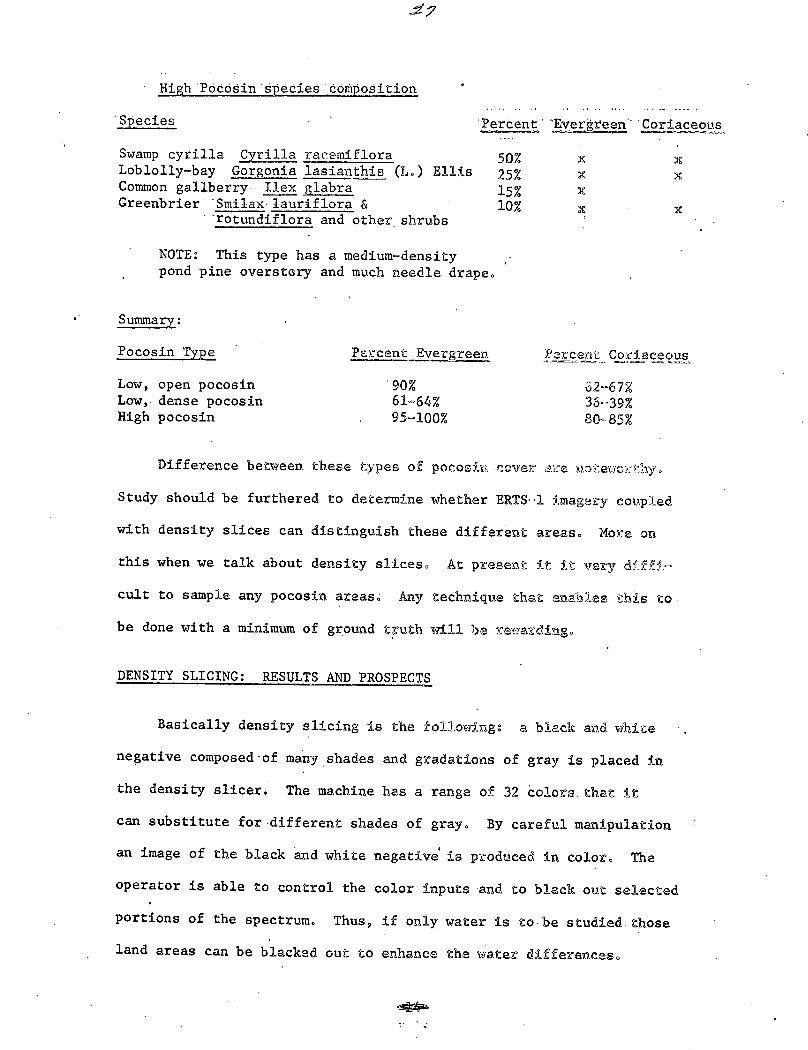
High Pocosin species co6mpiosition
Species Percent ' er 'Coriaceous
Swamp cyrilla Cyrilla racemiflora 50% xxLoblolly-bay Gorgonia lasianthis (Lo) Ellis 25% x xCommon gallberry Ilex glabra 15% xGreenbrier'Smilax lauriflora & 10% x
'rotundiflora and other shrubs
NOTE: This type has a medium-densitypond pine overstory and much needle drape.
Summary:
Pocosin Type
Low, open pocosinLow, dense pocosinHigh pocosin
Pezrcent Evergreen
'90%61-64%95-100%
Percent Coriaceous
62-67%36 -39%80-85%
Difference between these types of pocosi. -cover a.e kotew3rthyo
Study should be furthered to determine whether ERTS-1 imagery coupled
with density slices can distinguish these different areaso More on
this when we talk about density sliceso At present it it very dlffi.
cult to sample any pocosin areas0 Any technique that enables this to
be done with a minimum of ground truth will be rewarding°
DENSITY SLICING: RESULTS AND PROSPECTS
Basically density slicing is the following: a black and white
negative composed-of many shades and gradations of gray is placed in
the density slicer. The machine has a range of 32 colors that it
can substitute for different shades of gray. By careful manipulation
an image of the black and white negativeI is produced in color. The
operator is able to control the color inputs and to black out selected
portions of the spectrum. Thus, if only water is to be studied those
land areas can be blacked out to enhance the water differences.
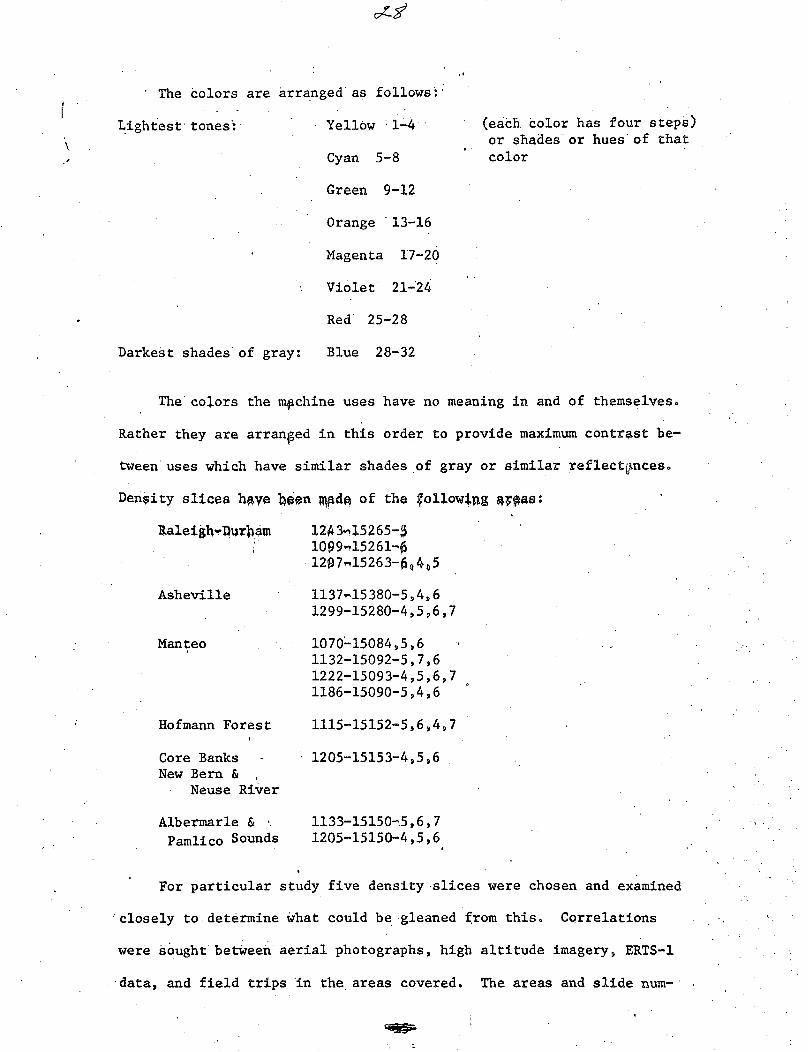
The colors are arranged as follows:,
Lightest tones'- Yellow 1-4
Cyan 5-8
Green 9-12
Orange '13-16
Magenta 17-20
Violet 21-24
Red' 25-28
Darkest shades'of gray: Blue 28-32
(each color has four steps)or shades'-or hues'of thatcolor
The colors the mochine uses have no meaning in and of themselves.
Rather they are arranged in this order to provide maximum contrast be-
tween'uses which have similar shades of gray or similar reflectnceso
Density slices have hen bide of the following ras;:
Raleigh-Durha m 12431l5265-5109915261-61207r15263-6 4o5
Asheville 1137-15380-5,4,61299-15280-4,5,6,7
Manteo 1070-15084,5,61132-15092-5,7,61222-15093-4,5,6,71186-15090-5,4,6
Hofmann Forest 1115-15152-5,6,4,7
Core Banks 1205-15153-4,5,6New Bern &
Neuse River
Albermarle & .
Pamlico Sounds
1133-15150-5,6,71205-15150-4,5,6
For particular study five density slices were chosen and examined
'closely to determine what could be gleaned from this. Correlations
were sought' between aerial photographs, high altitude imagery, ERTS-1
'data, and field trips 'in the areas covered. The areas and slide num-
I
Ii
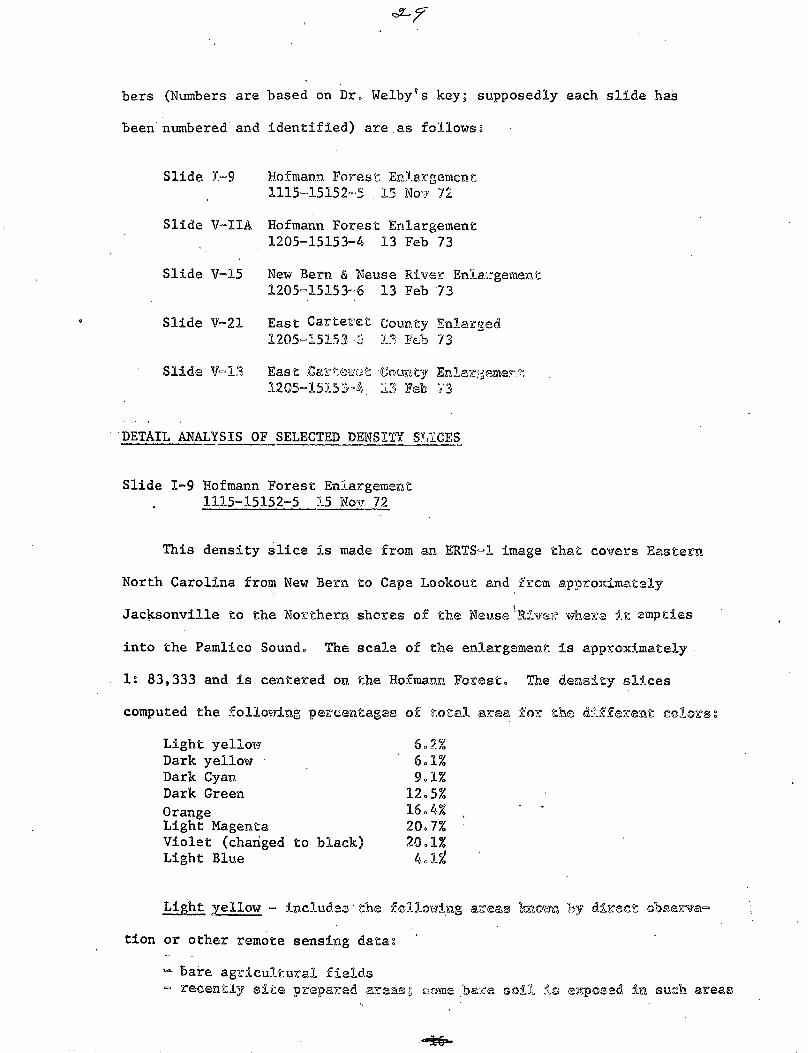
bers (Numbers are based on Dro Welby's key; supposedly each slide has
been numbered and identified) are as follows:
Slide rn9 Hofmann Forest Enlargement115-s15152-5 15 No'v 72
Slide V-IIA Hofmann Forest Enlargement1205-15153-4 13 Feb 73
Slide V-15 New Bern & Neuse River Enlargement1205-15153-6 13 Feb 73
Slide V-21 East Carteret County Enlarged1205D15152 - 13. FbE: 73
Slide V-13 East Carte-et 'County Enlra-iemei%1205l15l53-%4 133 Feb Y'3
'DETAIL ANALYSIS OF SELECTED DENSIlS SLICES
Slide I-9 Hofmann Forest Enlargement1115-15152-5 15 Nov 72
This density slice is made from an ERTS-1I image that covers Eastern
North Carolina from New Bern to Cape Lookout and frcm approximately
Jacksonville to the Northern shores of the NeuselR-ivser where it empties
into the Pamlico Sound. The scale of the enlargement is approximately.
1: 83,333 and is centered on the Hofmann Forest. The density slices
computed the following percentages of total area for the dlfferent colors:
Light yellow 602%Dark yellow 6o1%Dark Cyan 9o1%Dark Green 12o5%
Orange 16o4%Light Magenta 20°7%Violet (changed to black) 20o1%Light Blue 4CIA
Light yellow = includes the following areas knon by direct abserva=
tion or other remote sensing data.
bare agricultural fieldsrecently site prepared arease somme bare soil ls exposed in such areas
aI*6
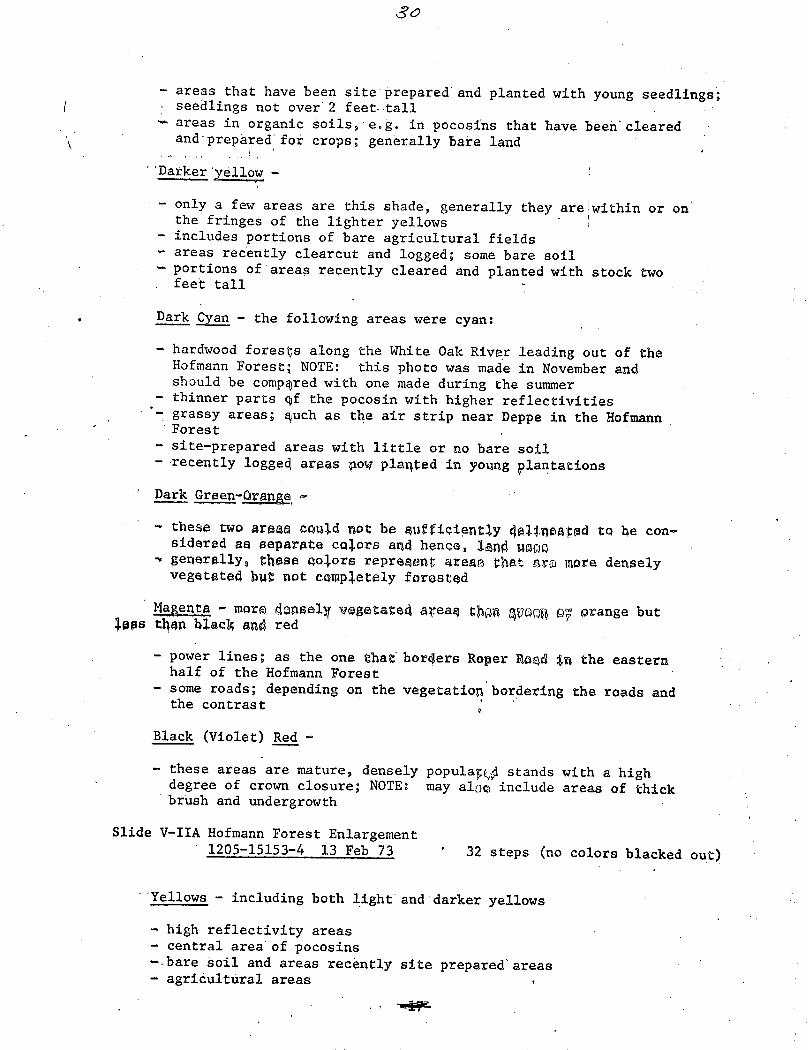
- areas that have been site prepared'and planted with young seedlings;seedlings not over'2 feet-.tallareas in organic soils, eg. in pocosins that have been'clearedand prepared for crops; generally bare land
-'Darker'yellow -
- only a few areas are this shade, generally they are within or onthe fringes of the lighter yellows
- includes portions of bare agricultural fields- areas recently clearcut and logged; some bare soil- portions of areas recently cleared and planted with stock two
feet tall
Dark Cyan - the following areas were cyan:
- hardwood forests along the White Oak River leading out of theHofmann Forest, NOTE: this photo was made in November andshould be compared with one made during the summer
- thinner parts of the pocosin with higher reflectivities- grassy areas; 9uch as the air strip near Deppe in the Hofmann
Forest-site-prepared areas with little or no bare soil- recently logged arias pow planted in young plantations
Dark Green-OraIng -
- these two arpa could not be gsufficient4y 4lt.4ea-gd to he con-sidered as separate colors and hence, land pUngenerallya these to~ors represent areaa thatt ari more denselyvegetated bht not completely forested
Magenta - more d4nsel3y vegetate4 reaq tb quayp i orange butJeps than black and red
- power lines; as the one that borders Roper Road $n the easternhalf of the Hofmann Forest
- some roads; depending on the vegetation bordering the roads andthe contrast
Black (Violet) Red =
- these areas are mature, densely populatQe stands with a highdegree of crown closure; NOTE: may aloi include areas of thickbrush and undergrowth
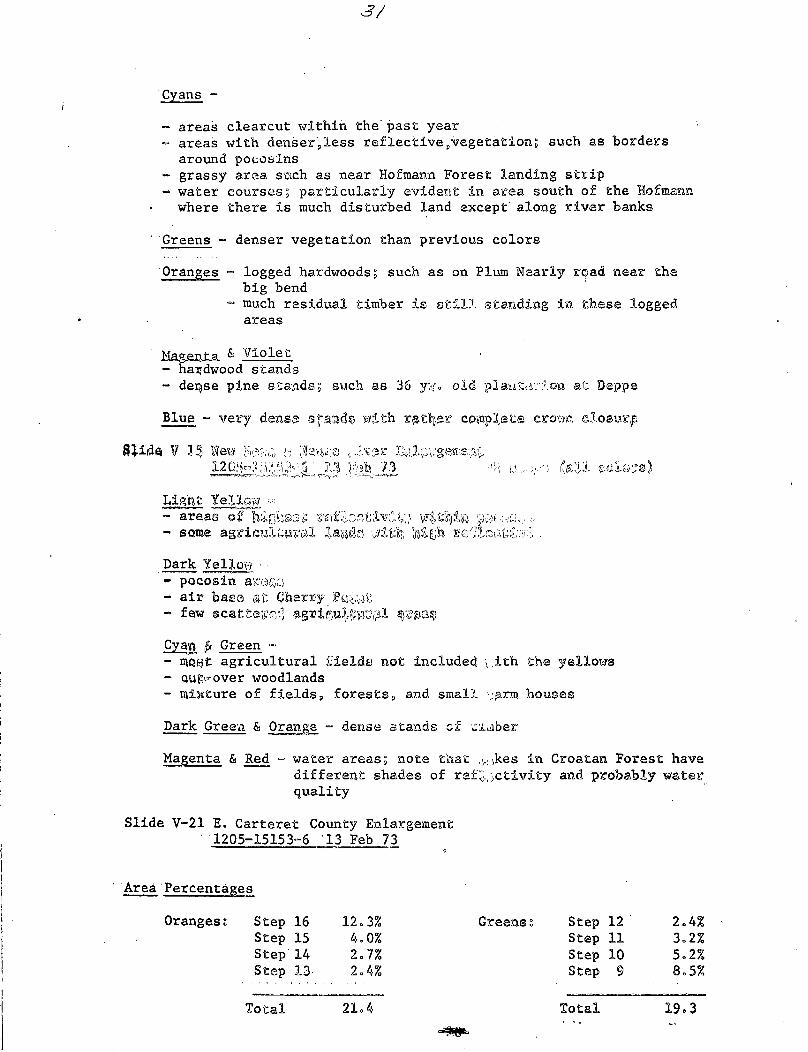
Slide V-IIA Hofmann Forest Enlargement1205-15153-4 13 Feb 73 ' 32 steps (no colors blacked out)
'Yellows - including both light and darker yellows
- high reflectivity areas- central area' of pocosins--bare soil and areas recently site prepared'areas- agricultural areas
3/
Cyans -
- areas clearcut within the' past yearareas with denser',less reflectivevegetation; such as bordersaround pocosins
- grassy area snch as near Hofmann Forest landing strip- water courses; particularly evident in area south of the Hofmannwhere there is much disturbed land except along river banks
'Greens - denser vegetation than previous colors
'Oranges - logged hardwoods; such as on Plum Nearly road near thebig bendmuch residual timber is stil. standing in these loggedareas
neh ta '& 'Violet- hardwood stands- dense pine sta'nds; such as 36 yo·. old pSau,:--.on at Deppe
Blue - very dense sra2d* with rather cpDnpaete croar. closure
- aras of ^':',it:X' 'K;.-w",e ttY't7- b'' '28qiW3 'acis
- some aogir~aiu'i Ia Yn :l ', Bh rI' ? c ',: :;
Dark Yel].oT._ - pocosin a'c;i- air base at Cherry PL3'vvi- few scattev-.K- as-grP t' .l ~'
Cyan i Green - nmjat agricultural Ei2elds not included 1ith the yellows- Qutover woodlands- mixture of fields, forests, and small :arm. houses
Dark Green & Orange - dense stands cfi l.,iber
Magenta & Red - water areas; note that ,.x,>kes in Croatan Forest havedifferent shades of refr '.,ctivity and probably waterquality
Slide V-21 E. Carteret County Enlargement'1205-15153-6 '13 Feb 73
'Area Percentages
Oranges: Step 16 12.3% Greens: Step 12 2.4%Step 15 4.0% Step 11 3.2%Step' 14 2.7% Step 10 5.2%Step 13 2.4% Step 9 8.5%
2104Total Total 1903
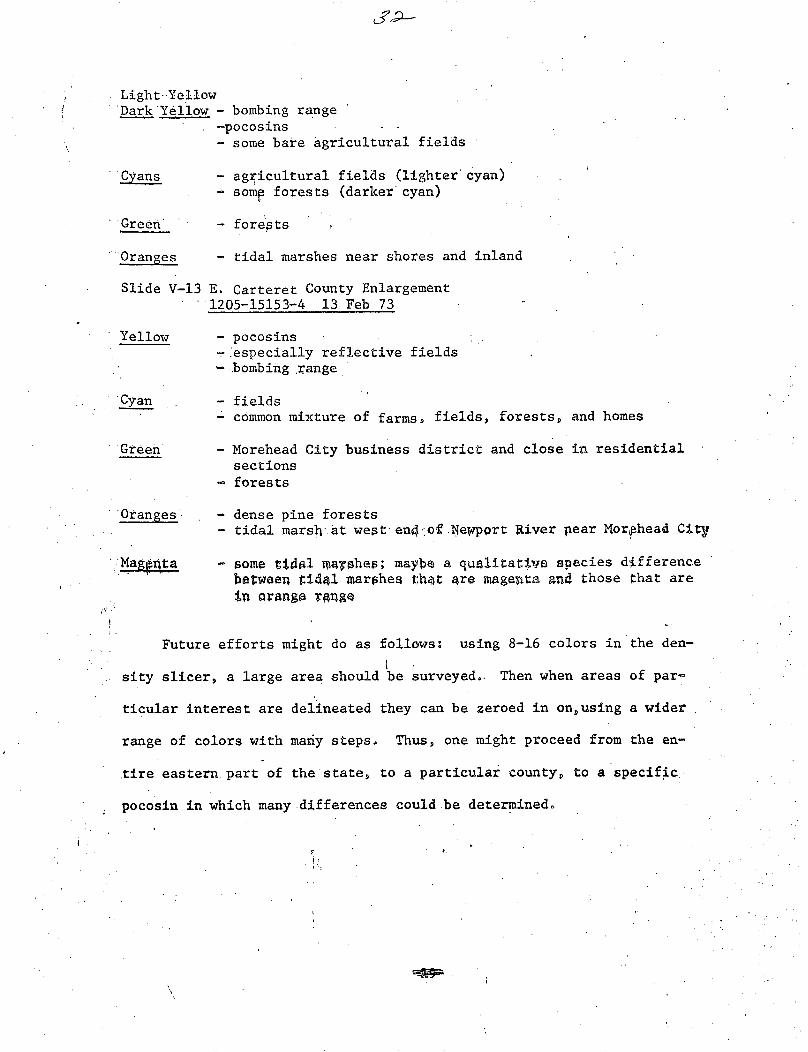
Light. Yellow'Dark'Yellow - bombing range
-pocosins- some bare agricultural fields
''Cyans
Green'
'Orange
Slide
Yellov
' Cyan
' Green
''Orang
- agricultural fields (lighter'cyan)- some forests (darker'cyan)
- forests
es - tidal marshes near shores and inland
V-13 E. Carteret County Enlargement1205-15153-4 13 Feb 73
w - pocosins-:[especially reflective fields- bombing ,range
- fields-.common mixture of farms, fields, forests, and homes
- Morehead City business district and close in residentialsections
- forests
es' - dense pine forests- tidal marsh'at west end4of Newport River pear Morphead Clty
- some tidal marshes; maybe a qualitative species differencebetween tidcl marshes that 4re magenta and those that arein oranga range
Future efforts might do as follows: using 8-16 colors in the den-
sity slicer, a large area should be surveyed.. Then when areas of par-
ticular interest are delineated they can be zeroed in onusing a wider
range of colors with many steps. Thus, one might proceed from the en-
.tire eastern.part of the state, to a particular county, to a specific
pocosin in which many differences could,be determined.
I
"Mag~nt''M ''
l