hcal1 status 2003 oleg gavrishchuk, jinr, dubna 1. hcal1 performance 2003 general design high...
TRANSCRIPT

HCAL1 Status 2003
Oleg Gavrishchuk, JINR, Dubna
1. HCAL1 performance 2003
• General design
• High Voltage system
• LED monitoring
2. Tests in muon halo beam (June 2003)
3. On-line reference plots
4. On-line LED monitoring plots
5. End of Run muon test (September 2003)
6. Stability control
7. Conclusions

Lisbon, September 1-3, 2003
O.Gavrishchuk, COMPASS Collaboration Meeting
2
HCAL1 general view in frame
•Matrix setup of 28v20 cells
•480 cells 150x150mm**2
•Total size: 4200x3000mm**2
•Window size:
1200x600mm**2 (8x4 cells)
•Total Weight: 83 tonn
•Moving range: +/-2.5m
HCAL1 Status 2003HCAL1 Status 2003

Lisbon, September 1-3, 2003
O.Gavrishchuk, COMPASS Collaboration Meeting
3
High Voltage layout •H/V interface is controlled by pccofe03
•100 m flat cable (50 pairs) transfer the commands from H/V interface to receiver in the CAMAC crate
•Receiver distribute the commands to 7 Data and 1-Chip-select boards
•Power suppliers:
+100V DC, load current 140mA per 480 PM
+6V DC, load current 8A (6A for 480 PM)
-6V DC, load current 3A
HCAL1 Status 2003

Lisbon, September 1-3, 2003
O.Gavrishchuk, COMPASS Collaboration Meeting
4
LED monitoring layout •Blue LED (470nm) high (ultra bright)
luminosity used for 480 HCAL1 Photo-multipliers PM-84
•Light intensity controlled by avalanche PIN diode
•Led generator pulsed out of Spill with frequency selected before start of Run
HCAL1 Status 2003
Lisbon, September 1-3, 2003
O.Gavrishchuk, COMPASS Collaboration Meeting
5
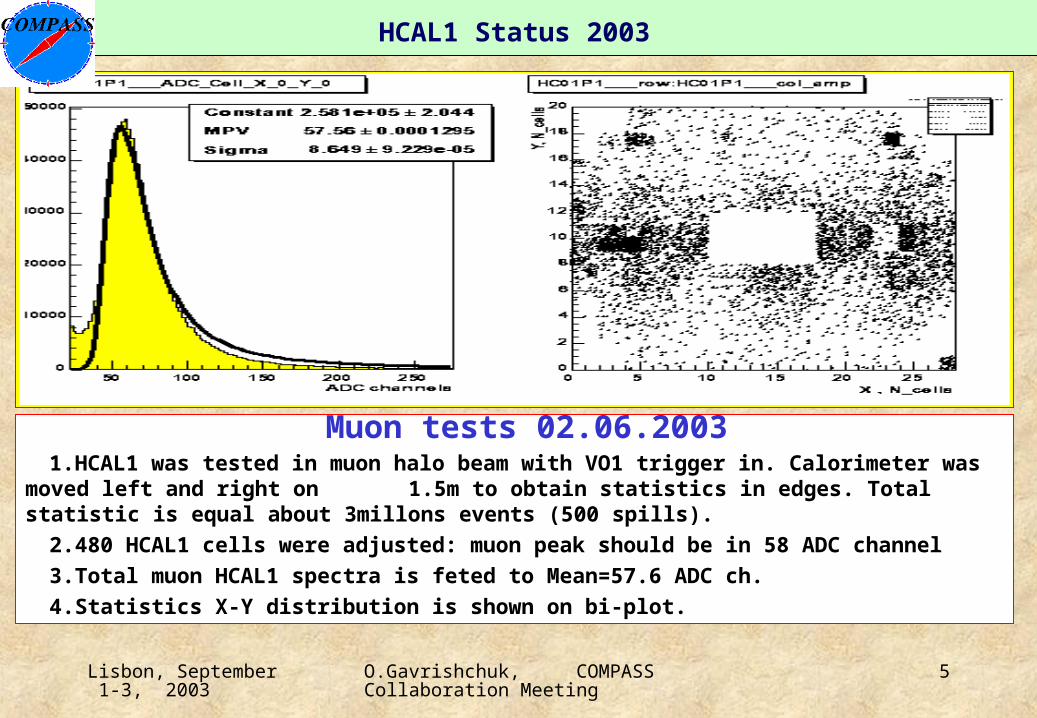
Muon tests 02.06.20031.HCAL1 was tested in muon halo beam with VO1 trigger in. Calorimeter was moved left and right on
1.5m to obtain statistics in edges. Total statistic is equal about 3millons events (500 spills).
2.480 HCAL1 cells were adjusted: muon peak should be in 58 ADC channel
3.Total muon HCAL1 spectra is feted to Mean=57.6 ADC ch.
4.Statistics X-Y distribution is shown on bi-plot.
HCAL1 Status 2003

Lisbon, September 1-3, 2003
O.Gavrishchuk, COMPASS Collaboration Meeting
6
HCAL1 Status 2003
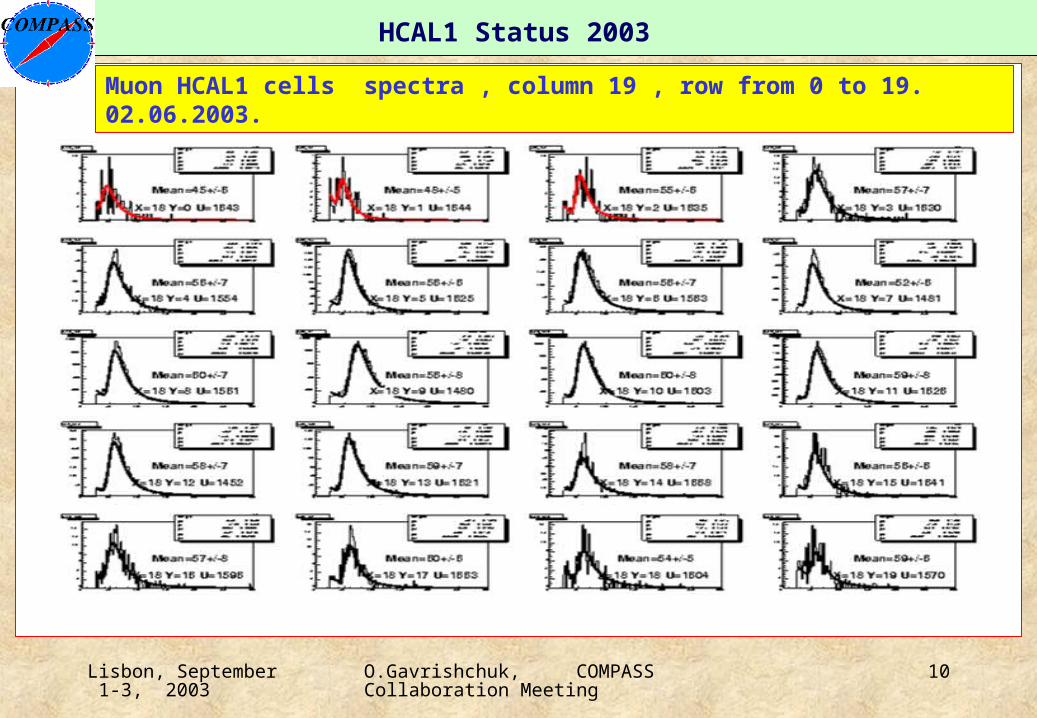
Muon HCAL1 cells spectra , column 19 , row from 0 to 19. 02.06.2003.

Lisbon, September 1-3, 2003
O.Gavrishchuk, COMPASS Collaboration Meeting
7
ON-Line Reference Plots:1. Hits distribution.
2. Amplitude vs channels.
3. Amplitude distribution.
4. Noise distribution
5. All events hits histogram
6. Frequency vs HCAL1 560 channels (matrix 28x20)
7. Total HCAL1 amplitude
8. Hits for events with amplitude cut of 20 ADC channels.
HCAL1 Status 2003

Lisbon, September 1-3, 2003
O.Gavrishchuk, COMPASS Collaboration Meeting
8
LED reference plots.
1. Sum HCAL1 Led amplitude histogram
2. Pin Diode amplitude histogram
3. LED amplitude vs HCAL1 560 channels (matrix 28x20)
4. X-Y amplitude be- plot
HCAL1 Status 2003
Ampl. VS N_chann
Sum_LED Pin Diode_amp
Lisbon, September 1-3, 2003
O.Gavrishchuk, COMPASS Collaboration Meeting
9
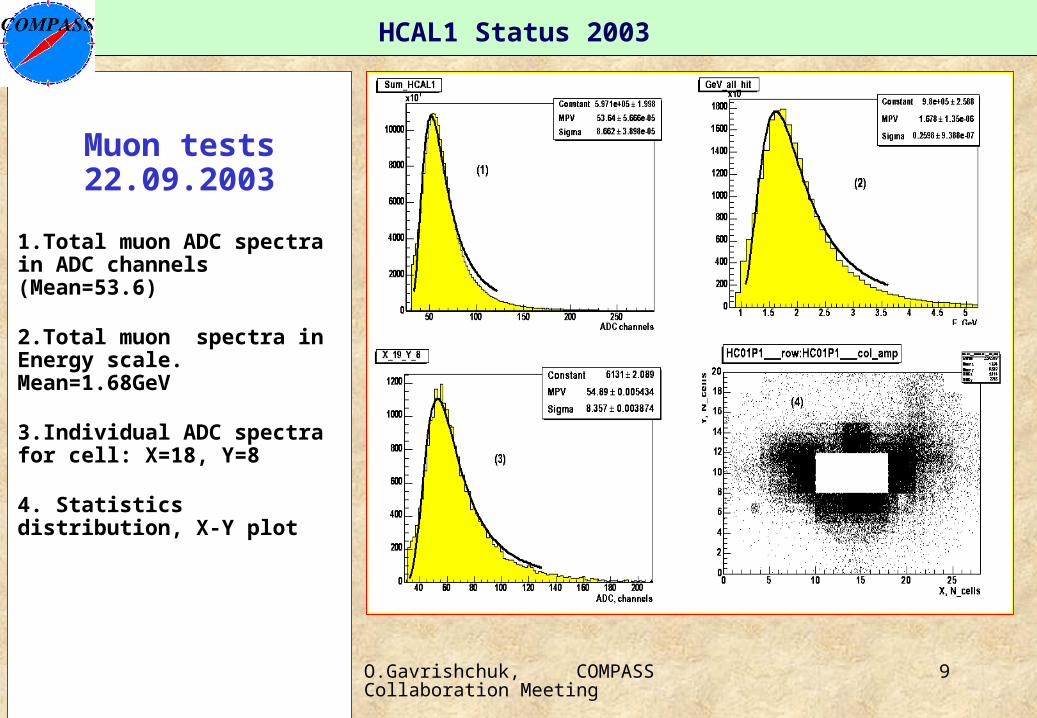
Muon tests 22.09.2003
1.Total muon ADC spectra in ADC channels (Mean=53.6)
2.Total muon spectra in Energy scale. Mean=1.68GeV
3.Individual ADC spectra for cell: X=18, Y=8
4. Statistics distribution, X-Y plot
HCAL1 Status 2003
Lisbon, September 1-3, 2003
O.Gavrishchuk, COMPASS Collaboration Meeting
10
HCAL1 Status 2003
Muon HCAL1 cells spectra , column 19 , row from 0 to 19. 02.06.2003.

Lisbon, September 1-3, 2003
O.Gavrishchuk, COMPASS Collaboration Meeting
11
Muon HCAL1 cells spectra , column 19 , row from 0 to 19. Measurement of 22.09.2003.
HCAL1 Status 2003

Lisbon, September 1-3, 2003
O.Gavrishchuk, COMPASS Collaboration Meeting
12
LED amplitude behavior in data taking periods
P1A_P1H 1.Pin diode amplitude
2.HCAL1 corrected on PIN
3.HCAL1 LED with-out PIN corrections
LED monitoring system indicate:
1.HCAL1 amplitude decrease on 8% from P1A to P1H data taking periods.
2.HCAL1 amplitude is practically stable
HCAL1 Status 2003
Lisbon, September 1-3, 2003
O.Gavrishchuk, COMPASS Collaboration Meeting
13
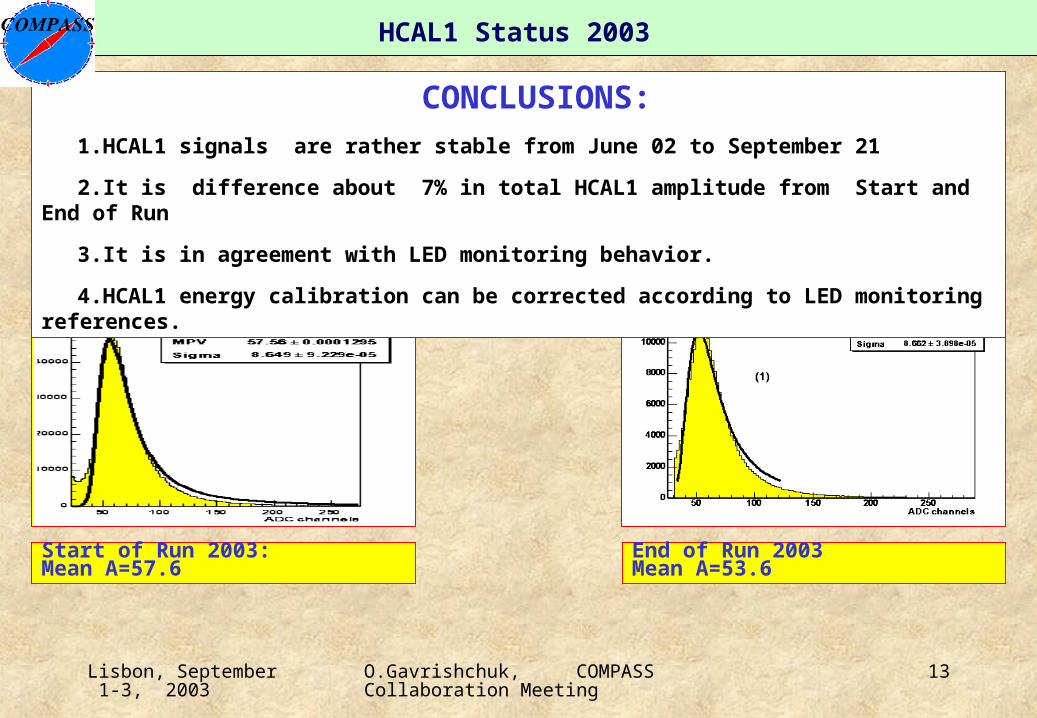
Start of Run 2003:Mean A=57.6
End of Run 2003Mean A=53.6
CONCLUSIONS:
1.HCAL1 signals are rather stable from June 02 to September 21
2.It is difference about 7% in total HCAL1 amplitude from Start and End of Run
3.It is in agreement with LED monitoring behavior.
4.HCAL1 energy calibration can be corrected according to LED monitoring references.
HCAL1 Status 2003