hays consolidated independent school...
TRANSCRIPT

Hays Consolidated Independent
School District
Kyle, Texas
Comprehensive Annual
Financial Report
For the Fiscal year Ended August 31, 2012
Prepared by the Financial Services Department
Carter Scherff, MBA, CPA Deputy Superintendent Annette Folmar, MBA, CPA Executive Director of FinanceJanet Meyer, CPA Assistant Director of Finance

HAYS CONSOLIDATED INDEPENDENT SCHOOL DISTRICT COMPREHENSIVE ANNUAL FINANCIAL REPORT
FOR THE YEAR ENDED AUGUST 31, 2012
TABLE OF CONTENTS
Exhibit Page INTRODUCTORY SECTION Letter of Transmittal i Certificate of Achievement v Administrative Organizational Chart vi List of Elected and Appointed Officials vii Certificate of Board viii
FINANCIAL SECTION Independent Auditors’ Report 1 Management’s Discussion and Analysis 3
Schedule
Basic Financial Statements: Government-wide Financial Statements: A-1 Statement of Net Assets 11 B-1 Statement of Activities 12 Governmental Fund Financial Statements: C-1 Balance Sheet – Governmental Funds 14 C-2 Reconciliation of the Governmental Funds Balance Sheet to the Statement of Net Assets 15 C-3 Statement of Revenues, Expenditures, and Changes in Fund Balance – Governmental Funds 16 C-4 Reconciliation of the Governmental Funds Statement of Revenues, Expenditures, and Changes in Fund Balances to the Statement of Activities 17 Proprietary Fund Financial Statements: D-1 Statement of Net Assets – Proprietary Funds 18 D-2 Statement of Revenues, Expenses, and Changes in Fund Net Assets – Proprietary Funds 19 D-3 Statement of Cash Flows – Proprietary Funds 20
Fiduciary Fund Financial Statements: E-1 Statement of Fiduciary Net Assets 21 E-2 Statement of Changes in Fiduciary Fund Net Assets 22 Notes to the Basic Financial Statements 23
Required Supplementary Information: G-1 Schedule of Revenues, Expenditures and Changes in Fund Balance Budget and Actual – General Fund 48 Notes to Required Supplementary Information 49
Combining Statements: Nonmajor Governmental Funds: H-1 Combining Balance Sheet 50 H-2 Combining Statement of Revenues, Expenditures, and Changes in Fund Balances 56
Internal Service Funds: H-3 Combining Statement of Net Assets 62 H-4 Combining Statement of Revenues, Expenses, and Changes in Fund Net Assets 63 H-5 Combining Statement of Cash Flows 64 Nonmajor Enterprise Funds: H-6 Combining Statement of Net Assets 65 H-7 Combining Statement of Revenues, Expenses, and Changes in Fund Net Assets 66 H-8 Combining Statement of Cash Flows 67

HAYS CONSOLIDATED INDEPENDENT SCHOOL DISTRICT COMPREHENSIVE ANNUAL FINANCIAL REPORT
FOR THE YEAR ENDED AUGUST 31, 2012 (Continued)
TABLE OF CONTENTS Schedule Page Required TEA Schedules: J-1 Schedule of Delinquent Taxes Receivable 68 J-2 Schedule of Expenditures for Computations of Indirect Cost for 2013 – 2014 70 J-4 Schedule of Revenues, Expenditures and Changes in Fund Balance Budget and Actual – Child Nutrition Program 71 J-5 Schedule of Revenues, Expenditures and Changes in Fund Balance Budget and Actual – Debt Service Fund 72 STATISTICAL SECTION (Unaudited) Government-wide Information: 1 Net Assets by Component 73 2 Expenses, Program Revenues and Net (Expense)/Revenue 75 3 General Revenues and Total Change in Net Assets 77 Fund Information: 4 Fund Balances – Governmental Funds 79 5 Changes in Fund Balances – Governmental Funds 81 6 Total Assessed and Net Taxable Value of Taxable Property 87 7 Property Tax Rates – Direct and Major Overlapping Governments 88 8 Principal Property Taxpayers 90 9 Property Tax Levies and Collections 91 10 Outstanding Debt by Type 92 11 Ratio of Net General Bonded Debt to Taxable Assessed Valuation and Net Bonded Debt per Capita 93 12 Estimated General Obligation Overlapping Debt Statement 95 13 Demographic and Economic Statistics 96 14 Major Employers 97 15 Full-time Equivalent District Employees by Type 98 16 Teacher Data 100 17 Expenditures, Enrollment and per Pupil Cost 101 18 Expenses of Governmental Activities, Enrollment and Per Pupil Cost 102 19 School Building Information 103 Exhibit FEDERAL AWARDS SECTION Report on Internal Control Over Financial Reporting and on Compliance and Other Matters Based on an Audit of Financial Statements Performed in Accordance with Government Auditing Standards 104 Independent Auditors’ Report on Compliance with Requirements that Could Have a Direct and Material Effect on Each Major Program and on Internal Control Over Compliance in Accordance With OMB Circular A-33 106 K-1 Schedule of Expenditures of Federal Awards 108 Notes to Schedule of Expenditures of Federal Awards 111 Schedule of Findings and Questioned Costs 112 Summary Schedule of Prior Audit Findings 113
THIS PAGE LEFT BLANK INTENTIONALLY

INTRODUCTORY SECTION

THIS PAGE LEFT BLANK INTENTIONALLY

i
January 14, 2013 Mr. Willie Tenorio, Jr., President Board of Trustees Hays Consolidated Independent School District 21003 IH 35 Kyle, TX 78640 Dear Mr. Tenorio and Members of the Board: The Texas Education Code requires that all school districts file a set of financial statements with the Texas Education Agency (TEA) within 150 days of the close of each fiscal year. The financial statements must be presented in conformity with the generally accepted accounting principles (GAAP) and audited by a firm of licensed certified public accountants in accordance with generally accepted auditing standards. Pursuant to the requirement, we hereby issue the Comprehensive Annual Financial Report of the Hays Consolidated Independent School District (the District) for the fiscal year ended August 31, 2012. The District’s Financial Services Department prepares the report, which has earned the Certificate of Achievement for Excellence in Financial Reporting from the Government Finance Officers Association (GFOA) every year since 2006. The comprehensive annual financial report is presented in four sections: Introductory, Financial, Statistical and Federal Awards. The Introductory section includes this transmittal letter, a copy of the Government Finance Officers Association (GFOA) Certificate of Achievement for Excellence in Financial Reporting for 2011, the District’s organizational chart and a list of principal officials. The management’s discussion and analysis in the Financial section provides an overview of the financial position and results of operations for the year. The Financial section also includes the auditors’ report, the basic financial statements, including the Government Wide Financial Statements and the Governmental Fund Financial Statements, the combining schedules and required supplementary information. The Statistical section includes selected financial and demographic information, generally presented on a multi-year basis. The Federal Awards section includes the Schedule of Federal Awards, auditors’ reports and the Schedule of Findings for both current and prior years. This report consists of management’s representations concerning the finances of the District. Consequently, management assumes full responsibility for the completeness and reliability of all the information presented in this report. In order to provide a reasonable basis for making these representations, management of the District has established a comprehensive internal control framework that is designed to protect the District’s assets from loss, theft or misuse. Additionally, the internal control framework is designed to compile sufficient reliable information for the preparation of the District’s financial statements in conformity with GAAP. Because the costs of internal controls should not outweigh their benefits, the District’s comprehensive framework of internal controls has been designed to provide reasonable assurance rather than absolute assurance that the financial statements will be free from material misstatement. To the best of our knowledge and belief, this financial report is complete and reliable in all material respects. The financial statements of the District have been audited by Pattillo, Brown and Hill, L.L.P., a firm of licensed certified public accountants. The goal of the independent audit is to provide reasonable assurance that the financial statements of the District are free of material misstatement. The independent audit involves examining, on a test basis, evidence supporting the amounts and disclosures in the financial statements; assessing the accounting principles used and significant estimates made by management; and evaluating the overall financial statement presentation. The independent auditors concluded, based upon the audit, that there was a reasonable basis for rendering an unqualified opinion and that the financial statements are fairly presented in conformity with GAAP. The independent auditors’ report is presented as the first component of the financial section of this report. The independent audit of the financial statements is part of a broader, federally mandated “Single Audit” designed to meet the special need of federal grantor agencies. The standards governing Single Audit engagements require the independent auditor to report not only on the fair presentation of the financial statements, but also on the audited government’s internal controls and compliance with legal requirements, with special emphasis on internal controls and legal requirements involving the administration of federal awards. These reports are available in the Federal Awards section of this report.
21003 N IH 35, Kyle, Texas 78640 Phone (512) 268-2141
Fax (512) 268-2147

ii
GAAP require that management provide a narrative introduction, overview, and analysis to accompany the basic financial statements in the form of Management’s Discussion and Analysis (MD&A). This letter of transmittal is designed to complement the MD&A and should be read in conjunction with it. The District’s MD&A can be found immediately following the report of the independent auditors. THE DISTRICT AND ITS SERVICES
Hays Consolidated Independent School District was formed on May 6, 1967, through the consolidation of Kyle Independent School District, Buda County-Line Independent School District and Wimberley Rural High School District. The Wimberley School District withdrew from the consolidation in September 1986 and created Wimberley Independent School District. The District comprises 212 square miles of land, or approximately half of the total area of Hays County, with small portions extending into Travis and Caldwell Counties. The District includes the cities of Kyle and Buda, both of which are located within Hays County. The cities of Kyle and Buda are located on Interstate Highway 35 between Austin and San Marcos. The District also includes the cities of Uhland, Niederwald and Driftwood. The District is governed by a seven-member Board of Trustees (the Board). The Trustees serve three-year staggered terms with elections being held every year. Monthly meetings of the Board are posted and advertised as prescribed under state law so that the Board may fulfill its charge to the students, parents, staff, and taxpayers of the District. Special meetings or study sessions are scheduled as needed. The Board has final control over all school matters except as limited by state law. The Board of Trustees meets annually to set goals for the District. The goals are both long-term and short-term in an effort to focus resources and efforts on specific areas, as well as set high standards for the students and staff of the District. They are reviewed and revised by the Board periodically. Mission Statement – The mission of Hays CISD, an innovative community of learners that values the diversity and legacy of the people, is to nurture students to become extraordinary citizens through unique, personal educational experiences. Beliefs – We believe: Cultivating positive relationships is the cornerstone of success Valuing diversity enriches and strengthens performance High expectations and hard work dramatically affect performance Balance in life is essential to well-being Every person has inherent value and deserves respect Every person has an innate curiosity and a desire to learn Every person is a learner and a teacher Every person is ultimately accountable to self and others Fostering community is essential for individual and collective prosperity Choices we make today determine our future and the future of our planet Safety is paramount to success; risk is essential to achieving greatness Integrity requires open, honest communication Allocation of resources reflects the values of the organization Recognizing and addressing unique abilities and needs generate powerful outcomes The power of possibility and change fuels opportunity and achievement Goals for 2012-2013 – The District will: Improve performance in student achievement indicators, which include:
Developmental Reading Assessment for early literacy Percentage of students achieving Level II and Level III on STAAR EOC exceeding state performance averages. Percentage of students completing in AP and Dual Credit courses Percentage of AP student exams receiving a score of 3, 4, or 5 Graduation rate Percentage of students graduating on the Recommended High School Program and Distinguished Achievement
Program Increased opportunities for students to earn career certifications
Improve its culture of recognizing, welcoming and appreciating the contributions of parents, volunteers and mentors – partners in the district’s effort to provide exceptional educational experiences and to foster student achievement.
Increase the racial and ethnic diversity of our teaching and administrative workforce. Celebrate and support all district employees who are successful in creating a culture of high achievement.

iii
The District provides a well-rounded program of public education for children from pre-kindergarten through grade twelve. In addition to basic instructional programs, the District offers special education, gifted and talented, Bilingual/ESL, intervention, college preparatory, and career and technical programs. The District is fully accredited by the Texas Education Agency (TEA). Hays CISD operates 13 elementary schools, 5 middle schools, 2 comprehensive high schools, 1 alternative education program high school, and one disciplinary alternative education program campus. The District’s 2012-13 enrollment, for budget purposes, was 16,450 which is an increase of 4% from 2011-12. Enrollment for 2012-13 was 16,511 on December 12, 2012.
ECONOMIC INFORMATION
Hays County, created in 1848, is located in south central Texas and is a component of the Austin Metropolitan Statistical Area. Hays County is traversed by Interstate Highway 35, U.S. Highway 290, State Highways 21 and 123 with the City of San Marcos as the county seat. State Highway 130 is a new commuter roadway that is being constructed on the outskirts of the district to relieve congestion on IH 35 and will extend from north of Georgetown, east of metropolitan Austin, to I-10 near Seguin. Hays County is diversified by tourism, education, agriculture, retail, healthcare, and manufacturing. Kyle, Buda and San Marcos are located within what has become known as the Austin/San Antonio Corridor along Interstate Highway 35. Austin and San Antonio are two anchors of a region which includes several million people. The District’s population has grown to an estimated 72,770, up from the 2000 census number of 29,892, making it one of the fastest growing school districts in Texas. Residents in Hays County have easy access to higher education including the University of Texas, Texas State University, and Austin Community College. The Hays Consolidated Independent School District covers land which was once used primarily for ranching and recreational area. Residential and retail development has steadily increased in the last 10 years. The cities of Kyle and Buda are located on Interstate Highway 35 between San Marcos and Austin. Extensive roadway improvement projects, the construction of Austin Community College, and the addition of a large, regional hospital complex that opened in 2009 will continue to drive growth in the District.
REPORT INFORMATION
The Comprehensive Annual Financial Report is prepared in accordance with generally accepted accounting principles (GAAP) and in conformance with standards of financial reporting established by the Governmental Accounting Standards Board (GASB) using guidelines recommended by the Government Finance Officers Association of the United States and Canada (GFOA). All funds of the District are covered by this report. The District’s financial policies address accounting and fiscal operations of the District, with an emphasis on asset, procurement, and budget management. The District maintains budgetary controls, and the objective is to ensure compliance with legal provisions embodied in the annual budget approved by the District’s Board of Trustees. The annual expenditure budget serves as the foundation for the District’s financial planning and control. Every school district in Texas is required, by law, to prepare and file a budget with the Texas Education Agency (TEA). The Board legally adopts a budget for the General Fund, Debt Service Fund, and Child Nutrition Fund. Budgets for Special Revenue Funds (other than Child Nutrition) and Capital Projects Funds are prepared on a project bases, based on grant regulations or applicable bond ordinances. Budgetary control (the level at which expenditures cannot legally exceed appropriations) is mandated at the functional category level within each fund. These functional categories are defined by TEA and identify the purpose of transactions. The District also maintains an encumbrance accounting system as one technique of accomplishing budgetary control. Encumbered amounts lapse at year-end unless specifically identified for rollover into the next fiscal year.
LONG TERM FINANCIAL PLANNING
At a national level, the United States has been in a recession since 2008. The State of Texas has weathered the economic downturn better than most states, in part because of large size and diverse economy. As a result of the recession, most school districts across Texas saw taxable property values decline though not as dramatically as in other states. The District’s taxable property values have not declined, but have continued to increase at a slower pace over the past 4 years. During the 2011 Legislative Session, the Legislature enacted a budget that cut $4 billion from the Foundation School Program for the 2012-13 State fiscal biennium, as compared to the funding level school districts were entitled to under the current funding formulas. Various grants were also cut approximately $1.3 billion (pre-kindergarten grant program, student success initiative, etc.). These cuts were made in light of a projected State deficit of up to $27 billion for the 2012-13 biennium.

v

Superintendent
Assistant SuperintendentCurriculum & Instruction
Deputy SuperintendentAssistant SuperintendentHuman Resources
Executive DirectorTechnology
Executive DirectorFinance
DirectorConstruction/Sustainability
Executive DirectorHuman Resources
Executive DirectorStudent Achievement
Executive DirectorSecondary Schools
Executive DirectorSpecial Education
Executive DirectorElementary Schools
BOARD OF TRUSTEES
High School Principals
Middle School Principals
Elementary Principals
Assistant DirectorSpecial Education
Special Education Coordinators
DirectorProfessionalDevelopment
DirectorCollege & Career
Readiness
DirectorBilingual Services
DirectorStudent Services
DirectorInstructional Technology
DirectorFederal Programs
DirectorEmployee Services
DirectorHealth Services
DirectorChild NutritionDirector
Purchasing
Payroll Coordinator Accounts Payable
DirectorMaintenance/
Operations
DirectorCustodial Services
DirectorTransportation
Services
DirectorManagement
Information Systems
DirectorDistrict Network
September 2012
DirectorIntervention Services
2012-2013Hays CISD Organization Chart
Benefits Coordinator
Public Information Officer
Webmaster
DirectorCommunity Relations
Communication Specialist
Superintendent/BoardAdministrative Coordinator
Executive DirectorMaintenance/Operations
DirectorStudent Programs
DirectorAssessment
DirectorAdministrative
Technology
vi
vii
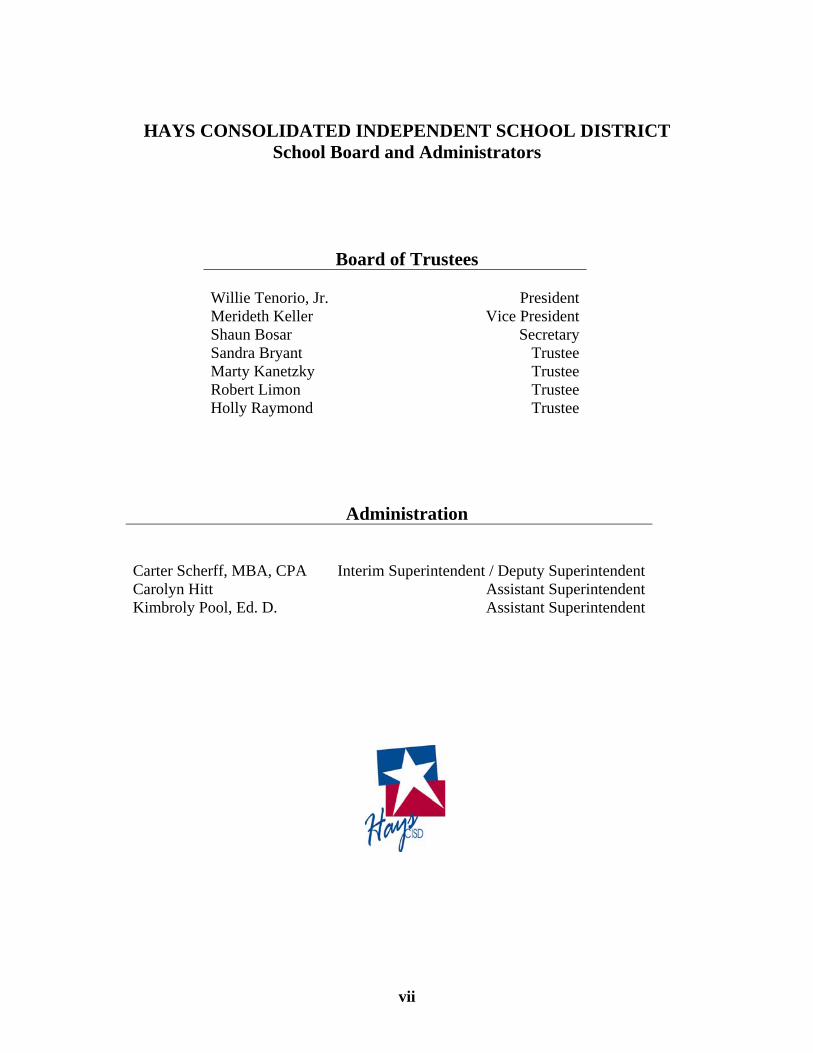
HAYS CONSOLIDATED INDEPENDENT SCHOOL DISTRICT School Board and Administrators
Board of Trustees Willie Tenorio, Jr. President Merideth Keller Vice President Shaun Bosar Secretary Sandra Bryant Trustee Marty Kanetzky Trustee Robert Limon Trustee Holly Raymond Trustee
Administration Carter Scherff, MBA, CPA Interim Superintendent / Deputy Superintendent Carolyn Hitt Assistant Superintendent Kimbroly Pool, Ed. D. Assistant Superintendent


FINANCIAL SECTION

INDEPENDENT AUDITORS’ REPORT
Board of Trustees of Hays Consolidated Independent School District Kyle, Texas
We have audited the accompanying financial statements of the governmental activities, the business-type activities, each major fund, and the aggregate remaining fund information of Hays Consolidated Independent School District (the “District”), as of and for the year ended August 31, 2012, which collectively comprise the District’s basic financial statements as listed in the table of contents. These financial statements are the responsibility of District’s management. Our responsibility is to express opinions on these financial statements based on our audit.
We conducted our audit in accordance with auditing standards generally accepted in the United
States of America and the standards applicable to financial audits contained in Government Auditing Standards, issued by the Comptroller General of the United States. Those standards require that we plan and perform the audit to obtain reasonable assurance about whether the financial statements are free of material misstatement. An audit includes examining, on a test basis, evidence supporting the amounts and disclosures in the financial statements. An audit also includes assessing the accounting principles used and the significant estimates made by management, as well as evaluating the overall financial statement presentation. We believe that our audit provides a reasonable basis for our opinions.
In our opinion, the financial statements referred to above present fairly, in all material respects,
the respective financial position of the governmental activities, the business-type activities, each major fund, and the aggregate remaining fund information of the District, as of August 31, 2012, and the respective changes in financial position, and, where applicable, cash flows, thereof for the year then ended in conformity with accounting principles generally accepted in the United States of America.
In accordance with Government Auditing Standards, we have also issued our report dated
January 14, 2013, on our consideration of the District’s internal control over financial reporting and on our tests of its compliance with certain provisions of laws, regulations, contracts, and grant agreements and other matters. The purpose of that report is to describe the scope of our testing of internal control over financial reporting and compliance and the results of that testing, and not to provide an opinion on internal control over financial reporting or on compliance. That report is an integral part of an audit performed in accordance with Government Auditing Standards and should be considered in assessing the results of our audit.
1
401 WEST HIGHWAY 6 P. O. BOX 20725 WACO, TX 76702-0725 (254) 772-4901 FAX: (254) 772-4920 www.pbhcpa.com AFFILIATE OFFICES: BROWNSVILLE, TX (956) 544-7778 HILLSBORO, TX (254) 582-2583
TEMPLE, TX (254) 791-3460 ALBUQUERQUE, NM (505) 266-5904

2
Accounting principles generally accepted in the United States of America require that the management’s discussion and analysis and budgetary comparison information on pages 3 through 10 and 48 through 49 be presented to supplement the basic financial statements. Such information, although not a part of the basic financial statements, is required by the Governmental Accounting Standards Board, who considers it to be an essential part of financial reporting for placing the basic financial statements in an appropriate operational, economic, or historical context. We have applied certain limited procedures to the required supplementary information in accordance with auditing standards generally accepted in the United States of America, which consisted of inquiries of management about the methods of preparing the information and comparing the information for consistency with management’s responses to our inquiries, the basic financial statements, and other knowledge we obtained during our audit of the basic financial statements. We do not express an opinion or provide any assurance on the information because the limited procedures do not provide us with sufficient evidence to express an opinion or provide any assurance.
Our audit was conducted for the purpose of forming opinions on the financial statements that
collectively comprise the District’s financial statements as a whole. The introductory section, combining and individual nonmajor fund financial statements and schedules, required TEA schedules, and statistical section, are presented for purposes of additional analysis and are not a required part of the financial statements. The accompanying schedule of expenditures of federal awards is presented for purposes of additional analysis as required by U. S. Office of Management and Budget Circular A133, Audits of States, Local Governments, and Nonprofit Organizations, and is also not a required part of the financial statements. The combining and individual nonmajor fund financial statements and schedules and the Schedule of Expenditures of Federal Awards are the responsibility of management and were derived from and relate directly to the underlying accounting and other records used to prepare the financial statements. The information has been subjected to the auditing procedures applied in the audit of the financial statements and certain additional procedures, including comparing and reconciling such information directly to the underlying accounting and other records used to prepare the financial statements or to the financial statements themselves, and other additional procedures in accordance with auditing standards generally accepted in the United States of America. In our opinion, the information is fairly stated in all material respects in relation to the financial statements as a whole. The introductory and statistical sections have not been subjected to the auditing procedures applied in the audit of the basic financial statements and, accordingly, we do not express an opinion or provide any assurance on them.
Pattillo, Brown & Hill, L.L.P. January 14, 2013

3
HAYS CONSOLIDATED INDEPENDENT SCHOOL DISTRICT MANAGEMENT’S DISCUSSION AND ANALYSIS
AUGUST 31, 2012
As Management of the Hays Consolidated Independent School District, we offer readers of the District’s financial statements this narrative overview and analysis of the financial activities of the Hays Consolidated Independent School District for the fiscal year ended August 31, 2012. We encourage readers to consider the information presented here in conjunction with the District’s financial statements, which follow this section.
FINANCIAL HIGHLIGHTS
The Texas Legislature cut funding to public schools for the 2011-2013 biennium. Hays CISD eliminated $7.2 million from the 2011-2012 budget through cuts to staffing, increasing student-to-teacher ratios, energy savings initiatives, and operational budget reductions.
The Hays Consolidated Independent School District maintains an “AAA” rating from Standard & Poor’s and Fitch for general obligation debt based upon the guarantee from the State of Texas Permanent School Fund (PSF). In November 2012, Standard & Poor’s and Fitch Ratings affirmed their underlying ratings of AA- for Hays CISD.
The District maintained its property tax rate of $1.4613 for 2012-13. The tax rate for Hays CISD has remained constant since 2007-08. Prior to that, the 2006-07 total tax rate was $1.7780 and the 2005-06 rate was $1.8763.
At the end of the current fiscal year, fund balance for the General Fund was $34,090,212, which represents 28.8% percent of total fiscal year 2012-13 General Fund budgeted expenditures.
For the 10th year in a row, Hays CISD earned a rating of Superior Achievement by the Texas Education Agency under its Financial Integrity Rating System of Texas (FIR$T). Superior Achievement is the highest rating possible and is based on criteria used to determine the overall financial health and stability of school districts throughout Texas.
OVERVIEW OF THE FINANCIAL STATEMENTS
This discussion and analysis is intended to serve as an introduction to the Hays Consolidated Independent School District’s basic financial statements. The District’s basic financial statements comprise three components: 1) government-wide financial statements, 2) fund financial statements, and 3) notes to the financial statements. This report also contains other required supplementary information in addition to the basic financial statements themselves.
Government-wide financial statements. The government-wide financial statements are designed to provide readers with a broad overview of the Hays Consolidated Independent School District’s finances in a manner similar to a private-sector business.
The statement of net assets presents information on all of the District’s assets and liabilities, with the difference between the two reported as net assets. Over time, increases or decreases in net assets may serve as a useful indicator of whether the financial position of the District is improving or deteriorating.

4
The statement of activities presents information showing how the District’s net assets changed during the most recent fiscal year. All changes in net assets are reported as soon as the underlying event giving rise to the change occurs, regardless of the timing of related cash flows. Thus revenues and expenses are reported in this statement for some items that will only result in cash flows in future fiscal periods (e.g. uncollected taxes). Both of the government-wide financial statements distinguish functions of the District that are principally supported by taxes and intergovernmental revenues (governmental activities). The governmental activities of the District are designed to educate and benefit the children of the community. Functional codes for Texas school districts are uniform throughout the state. They include instruction and instructional-related services, instructional and school leadership, support services for students, administrative support services, non-student based support services, ancillary services, debt service and capital outlay for facilities and construction. Fund financial statements. A fund is a grouping of related accounts that is used to maintain control over resources that have been segregated for specific activities or objectives. The Hays Consolidated Independent School District, like other state and local governments, uses fund accounting to ensure and demonstrate compliance with finance-related legal requirements. The fund financial statements provide more detailed information about the District’s most significant funds and not the District as a whole.
Some funds are required by State law and/or bond covenants.
Other funds may be established by the Board to control and manage money for particular purposes or to show that it is properly using certain taxes or grants.
All of the funds of the Hays Consolidated Independent School District can be divided into three categories: governmental funds, proprietary funds, and fiduciary funds. Governmental funds. Governmental funds are used to account for essentially the same functions reported as governmental activities in the government-wide financial statements. However, unlike the government-wide financial statements, governmental fund financial statements focus on near-term inflows and outflows of expendable resources, as well as on balances of spendable resources available at the end of the fiscal year. Such information may be useful in evaluating a government’s near-term financing requirements. Because the focus of governmental funds is narrower than that of the government-wide financial statements, it is useful to compare the information presented for governmental funds with similar information presented for governmental activities in the government-wide financial statements. By doing so, readers may better understand the long-term impact of the government’s near-term financial decisions. Both the governmental fund balance sheet and the governmental fund statement of revenues, expenditures, and changes in fund balance provide a reconciliation to facilitate this comparison between governmental funds and governmental activities. The District maintains individual governmental funds. Information is presented separately in the governmental fund balance sheet and in the governmental fund statement of revenues, expenditures, and changes in fund balances for the General Fund, the Debt Service Fund, and the Capital Projects Fund that are considered to be major funds. Data from the other individual governmental funds are combined into a single, aggregated presentation. Individual fund data for each of these non-major governmental funds is provided in the form of combining statements elsewhere in this report.

5
Proprietary funds. Proprietary funds provide the same type of information as the government-wide financial statements, only in more detail. There are two proprietary fund types. Enterprise Funds are used to report the same functions presented as business-type activities in the government-wide financial statements. The District uses Enterprise Funds for child care operations, community education, and health clinic services. The second type of proprietary fund is the Internal Service Fund. Internal Service Funds are an accounting device used to accumulate and allocate costs internally among the various functions. The District uses Internal Service Funds for printing services and to report activities outstanding from its previously self-funded workers’ compensation program. Fiduciary funds. Fiduciary funds are used to account for resources held for the benefit of parties outside the government. Fiduciary funds are not reflected in the government-wide financial statements because the resources of those funds are not available to support the District’s own programs. The District is the trustee, or fiduciary, for these funds and is responsible for ensuring that the assets reported in these funds are used for their intended purpose. All of the District’s fiduciary activities are reported in a separate statement of fiduciary net assets. These activities are excluded from the District’s government-wide financial statements because the District cannot use these assets to finance its operations. Notes to the financial statements. The notes provide additional information that is essential to a complete understanding of the data provided in the government-wide and fund financial statements. GOVERNMENT-WIDE FINANCIAL ANALYSIS As noted earlier, net assets may serve over time as a useful indicator of a government’s financial position. In the case of the Hays Consolidated Independent School District, assets exceeded liabilities by $14,425,900 as of August 31, 2012. The District’s total net assets increased $2,690,243 from the prior year. The District’s financial position has improved with an increase to general operating fund balance (please refer to the fund balance discussion in this report). The overall financial status of the District is stable, but with education funding in Texas still in the courts, the financial outlook for all Texas school districts is uncertain beyond the current biennium.

6
2012 2011 2012 2011 2012 2011
Current and other assets 63,759,280$ 75,008,591$ 444,419$ 300,419$ 64,203,699$ 75,309,010$
Capital assets 282,997,501 285,259,265 - - 282,997,501 285,259,265
Total assets 346,756,781 360,267,856 444,419 300,419 347,201,200 360,568,275
Long-term liabilities 304,019,465 315,669,169 - - 304,019,465 315,669,169
Other liabilities 28,710,389 33,099,323 45,446 64,126 28,755,835 33,163,449
Total liabilities 332,729,854 348,768,492 45,446 64,126 332,775,300 348,832,618
Net assets: Invested in capital assets, net of related debt 26,435,336)( 21,042,851)( - - 26,435,336)( 21,042,851)( Restricted 5,233,663 5,465,331 - - 5,233,663 5,465,331
Unrestricted 35,228,600 27,076,884 398,973 236,293 35,627,573 27,313,177
Total net assets 14,026,927$ 11,499,364$ 398,973$ 236,293$ 14,425,900$ 11,735,657$
TABLE 1
HAYS CONSOLIDATED INDEPENDENT SCHOOL DISTRICTNET ASSETS
Governmental Activities Business-type Activities Totals
A portion of the District’s net assets reflects its investment in capital assets (e.g. land, buildings, machinery, and equipment) less any related debt used to acquire those assets that are still outstanding. The District uses these capital assets to provide services to students; consequently, these assets are not available for future spending. Although the District’s investment in its capital assets is reported net of related debt, it should be noted that the resources needed to repay this debt must be provided from other sources, since the capital assets themselves cannot be used to liquidate these liabilities. An additional portion of the District’s net assets represents resources that are subject to external restrictions on how they may be used (e.g. debt service). This surplus is not an indication that the District has significant resources available to meet financial obligations next year, but rather the result of having long-term commitments that are less than currently available resources. Governmental activities. Program and general revenues for the year totaled $155,002,264, a 1% decrease from the prior year. Expenses for the year totaled $152,474,701 which is a decrease of 1% from the prior year. Key elements of the increase or decrease are shown in the following table:

2012 2011 2012 2011 2012 2011
REVENUES
Program revenues:
Charges for services 3,841,558$ 3,560,859$ 1,313,721$ 1,260,811$ 5,155,279$ 4,821,670$
Operating grants and contributions 27,401,927 29,192,386 - - 27,401,927 29,192,386
General revenues:
Maintenance and operations taxes 39,819,191 38,578,301 - - 39,819,191 38,578,301
Debt service taxes 16,162,668 15,653,990 - - 16,162,668 15,653,990
Grants and contributions not restricted 67,630,168 68,905,361 - - 67,630,168 68,905,361
Investment earnings 100,693 109,408 - - 100,693 109,408
Miscellaneous local and intermediate 46,059 - - - 46,059 -
Total revenues 155,002,264 156,000,305 1,313,721 1,260,811 156,315,985 157,261,116
EXPENSES
Instruction 77,074,761 78,585,619 - - 77,074,761 78,585,619
Instructional resources and
media services 2,156,431 2,302,667 - - 2,156,431 2,302,667
Curriculum and staff development 1,379,454 1,438,232 - - 1,379,454 1,438,232
Instructional leadership 1,790,933 1,792,866 - - 1,790,933 1,792,866
School leadership 7,225,406 7,043,969 - - 7,225,406 7,043,969
Guidance, counseling and
evaluation services 4,114,542 4,354,786 - - 4,114,542 4,354,786
Social work services 147,551 271,138 - - 147,551 271,138
Health services 1,706,732 1,621,964 20,025 26,714 1,726,757 1,648,678
Student (pupil) transportation 9,487,052 8,567,071 - - 9,487,052 8,567,071
Food services 7,571,737 6,638,266 - - 7,571,737 6,638,266
Co-curricular/extracurricular activities 2,873,827 2,850,112 - - 2,873,827 2,850,112
General administration 3,192,563 3,000,312 - - 3,192,563 3,000,312
Plant maintenance and operations 14,210,868 14,304,982 - - 14,210,868 14,304,982
Security and monitoring services 1,055,392 1,041,113 - - 1,055,392 1,041,113
Data processing services 2,379,850 2,531,665 - - 2,379,850 2,531,665
Community services 268,038 224,209 32,435 9,942 300,473 234,151
Debt service - interest and fees 15,257,020 15,956,049 - - 15,257,020 15,956,049
Payments to fiscal agent/SSA 17,947 141,513 - - 17,947 141,513
Other intergovernmental charges 564,597 543,641 - - 564,597 543,641
Childcare services - - 1,098,581 1,200,777 1,098,581 1,200,777
Total expenses 152,474,701 153,210,174 1,151,041 1,237,433 153,625,742 154,447,607
INCREASE (DECREASE) IN
NET ASSETS 2,527,563 2,790,131 162,680 23,378 2,690,243 2,813,509
NET ASSETS, BEGINNING 11,499,364 8,490,503 236,293 212,915 11,735,657 8,703,418
Prior period adjustment - 218,730 - - - 218,730
NET ASSETS, ENDING 14,026,927$ 11,499,364$ 398,973$ 236,293$ 14,425,900$ 11,735,657$
Governmental Activities Business-type Activities
TABLE 2
HAYS CONSOLIDATED INDEPENDENT SCHOOL DISTRICTCHANGES IN NET ASSETS
Totals
7

8
Property taxes, including penalties and interest, increased 3% and accounted for 36% of total 2011-2012 revenues. This revenue increase was the result of additional property values related to new businesses and residential construction. The District tax rate of $1.4613 has not increased since 2007. Business-type Activities. Revenues of the District’s business-type activities represent $1,258,656 from child care operations at District campuses, $34,766 from community education programs, and $20,299 from health clinic operations. FINANCIAL ANALYSIS OF THE DISTRICT’S FUNDS As noted earlier, the Hays Consolidated Independent School District uses fund accounting to ensure and demonstrate compliance with finance-related legal requirements, bond covenants, and segregation for particular purposes. Governmental funds. The focus of the District’s governmental funds is to provide information on near-term inflows, outflows, and balances of expendable resources. Such information is useful in assessing the District’s financing requirements. In particular, unallocated fund balance may serve as a useful measure of a government’s net resources available for spending at the end of the fiscal year. As of the end of the current fiscal year, the District’s governmental funds reported combined ending fund balances of $45,639,561. A complete listing of fund balances at August 31, 2012, is shown in the following table:
Fiscal YearFund Balances 2012
General Fund, Committed 1,320,000$ General Fund, Assigned 3,205,862 General Fund, Unassigned 29,564,350 Food Service, Restricted 1,439,117 2008 Capital Projects, Restricted 4,875,453 2006 Capital Projects, Restricted 239,970 2004 Capital Projects, Restricted 404,620 Local Capital Projects, Assigned 677,114 Debt Service, Restricted 3,913,075
Total Fund Balances 45,639,561$
The General Fund increased its total fund balance by $2,569,683. Revenues received from tax collections and federal funding was greater than anticipated. Expenditures were less than anticipated in the areas of payroll costs and maintenance. The Debt Service Fund increased its total fund balance by $42,709 due to the receipt of tax collections being slightly greater than anticipated. The 2008 Bond is the District’s major Capital Project Fund with a remaining balance of $4,875,453 at August 31, 2012. The funds remaining are being used for ongoing construction projects, District-wide improvements, and upgrades.

9
GENERAL FUND BUDGETARY HIGHLIGHTS Over the course of the year, actual expenditures were less than final budget amounts for the General Fund. In addition, total revenues were $1,703,186 above the final budgeted amount. The District consistently budgets conservatively, estimating low on revenue estimates and high on its expenditure estimates. Due to this conservative approach to budgeting, positive variances were widespread, including the functional categories of instruction and maintenance. The maintenance budget includes all utilities for the District, which are budgeted with a reserve to allow for utility rate and usage fluctuations throughout the school year. Instruction budgets include classroom teachers and other instructional professionals, of which payroll is a large portion of the District’s overall budget. Various timing differences in hiring and health insurance choices resulted in positive budget variances during 2011-2012. CAPITAL ASSETS AND DEBT ADMINISTRATION Capital Assets. At the end of 2012, the District had invested $282,997,501 in a broad range of capital assets, including land, equipment, buildings, and vehicles. This amount represents a net decrease (including depreciation, additions and deductions) of $2,261,764 from last year. Additional information on the District’s capital assets can be found in Note III, D on pages 36 and 37 of this report. Long-term Debt. At year-end, the District had $314,961,832 in bonds outstanding. Additional information about the District’s debt is presented in Note III, E through H on pages 37 through 42 of this report. The Hays Consolidated Independent School District maintains a “AAA” rating from Standard & Poor’s and Fitch for general obligation debt based upon the guarantee from the State of Texas Permanent School Fund (PSF). In November 2012, Standard & Poor’s and Fitch Ratings affirmed their underlying ratings of AA- for Hays CISD. ECONOMIC FACTORS AND NEXT YEAR’S BUDGETS AND RATES
The Texas Legislature experienced a significant budget shortfall as it worked toward adoption of the 2011-2012 and 2012-2013 budgets, cutting approximately $4 billion from education funding. The 83rd Legislature convenes in January 2013 to layout education funding for the 2013-2014 and 2014-2015 school years. A number of school districts filed suit against the State seeking increased funding for public education.
The District’s 2012-13 enrollment for budget purposes was 16,450, an increase of 3.9% from 2011-12. Enrollment for 2012-13 was 16,517 on December 5, 2012.
The 2012-2013 adopted budget included a step increase for teachers and an increase to other employee compensation of approximately one percent, an $11/month increase to the District’s employee health insurance contribution, and funding for a physical education pilot program.
The District’s 2012-13 total tax rate remained unchanged at $1.4613 per $100/valuation, with a Maintenance and Operations tax of $1.04 and Interest and Sinking of $0.4213.

10
The District is in its third year of implementation of its strategic plan. The District approved a strategic plan in April 2010 that involved over 200 community members, parents, students, and staff. The strategic plan was designed to focus attention on specific areas of operation and is intended to guide the allocation of resources for the next five years and beyond.
While the operating budget held steady for 2012-13, the largest increases in the budget were for additional teachers to address enrollment growth and employee compensation. If budget estimates are realized, the District’s General Fund balance is expected to hold steady by the close of 2012-13. CONTACTING THE DISTRICT’S FINANCIAL MANAGEMENT This financial report is designed to provide our citizens, taxpayers, customers, and investors and creditors with a general overview of the District’s finances and to demonstrate the District’s accountability for the money it receives. If you have questions about this report or need additional financial information, contact the District’s Financial Services Department at (512) 268-2141, or log on to www.hayscisd.net.

BASIC FINANCIAL STATEMENTS

EXHIBIT A-1
1 2 3
Data
Control Governmental Business-typeCodes Activities Activities Total
ASSETS1110 Cash and cash equivalents 5,626,903$ 437,357$ 6,064,260$ 1120 Current investments 49,970,556 - 49,970,556 1225 Property taxes receivables (net) 1,432,360 - 1,432,360 1240 Due from other governments 4,338,878 - 4,338,878 1250 Accrued interest 226,535 - 226,535 1290 Other receivables (net) 119,695 7,062 126,757 1300 Inventories 43,918 - 43,918 1410 Deferred expenses 2,259 - 2,259 1420 Capital bond and other debt issuance costs 1,998,176 - 1,998,176
Capital assets:
1510 Land 17,039,265 - 17,039,265 1520 Buildings and improvements, net 249,762,855 - 249,762,855 1530 Furniture and equipment, net 8,971,661 - 8,971,661
1580 Construction in progress 7,223,720 - 7,223,720
1000 Total assets 346,756,781 444,419 347,201,200
LIABILITIES2110 Accounts payable 2,567,074 2,807 2,569,881 2140 Interest payable 584,457 - 584,457 2150 Payroll deductions and withholdings 1,902,077 - 1,902,077 2160 Accrued wages payable 4,550,228 42,639 4,592,867 2180 Due to other governments 5,604,260 - 5,604,260 2190 Due to student groups 15,923 - 15,923 2300 Unearned revenue 136,570 - 136,570
Noncurrent liabilities: 2501 Due within one year 13,349,800 - 13,349,800
2502 Due in more than one year 304,019,465 - 304,019,465
2000 Total liabilities 332,729,854 45,446 332,775,300
NET ASSETS3200 Invested in capital assets, net of related debt 26,435,336)( - 26,435,336)(
Restricted for:3820 Federal and state programs 1,439,117 - 1,439,117 3850 Debt service 3,794,546 - 3,794,546
3900 Unrestricted 35,228,600 398,973 35,627,573
3000 Total net assets 14,026,927$ 398,973$ 14,425,900$
HAYS CONSOLIDATED INDEPENDENT SCHOOL DISTRICTSTATEMENT OF NET ASSETS
AUGUST 31, 2012
Primary Government
The accompanying notes are an integral part of this financial statement.
11
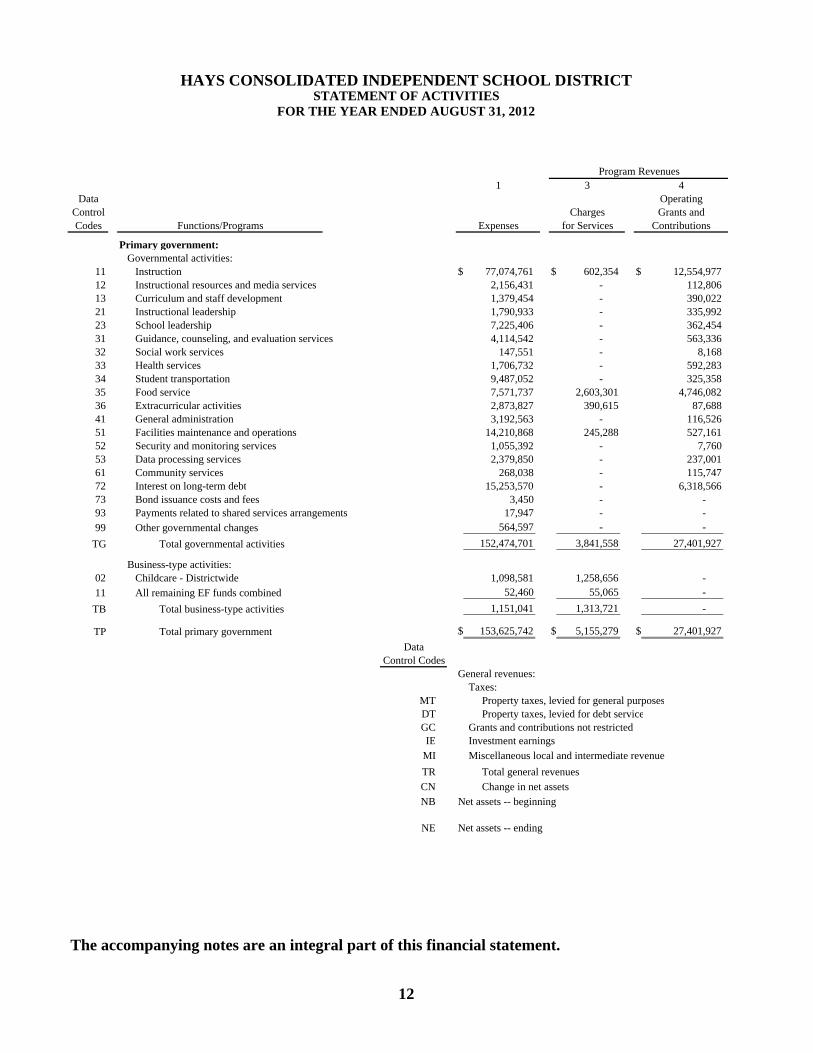
1 3 4Data Operating
Control Charges Grants andCodes Functions/Programs Expenses for Services Contributions
Primary government: Governmental activities:
11 Instruction 77,074,761$ 602,354$ 12,554,977$ 12 Instructional resources and media services 2,156,431 - 112,806 13 Curriculum and staff development 1,379,454 - 390,022 21 Instructional leadership 1,790,933 - 335,992 23 School leadership 7,225,406 - 362,454 31 Guidance, counseling, and evaluation services 4,114,542 - 563,336 32 Social work services 147,551 - 8,168 33 Health services 1,706,732 - 592,283 34 Student transportation 9,487,052 - 325,358 35 Food service 7,571,737 2,603,301 4,746,082 36 Extracurricular activities 2,873,827 390,615 87,688 41 General administration 3,192,563 - 116,526 51 Facilities maintenance and operations 14,210,868 245,288 527,161 52 Security and monitoring services 1,055,392 - 7,760 53 Data processing services 2,379,850 - 237,001 61 Community services 268,038 - 115,747 72 Interest on long-term debt 15,253,570 - 6,318,566 73 Bond issuance costs and fees 3,450 - - 93 Payments related to shared services arrangements 17,947 - -
99 Other governmental changes 564,597 - -
TG Total governmental activities 152,474,701 3,841,558 27,401,927
Business-type activities:02 Childcare - Districtwide 1,098,581 1,258,656 -
11 All remaining EF funds combined 52,460 55,065 -
TB Total business-type activities 1,151,041 1,313,721 -
TP Total primary government 153,625,742$ 5,155,279$ 27,401,927$
DataControl Codes
General revenues: Taxes:
MT Property taxes, levied for general purposesDT Property taxes, levied for debt serviceGC Grants and contributions not restrictedIE Investment earnings
MI Miscellaneous local and intermediate revenue
TR Total general revenues
CN Change in net assets
NB Net assets -- beginning
NE Net assets -- ending
The accompanying notes are an integral part of this financial statement.
Program Revenues
STATEMENT OF ACTIVITIESFOR THE YEAR ENDED AUGUST 31, 2012
HAYS CONSOLIDATED INDEPENDENT SCHOOL DISTRICT
12

EXHIBIT B-1
6 7 8
Governmental Business-typeActivities Activities Total
63,917,430)$( -$ 63,917,430)$( 2,043,625)( - 2,043,625)(
989,432)( - 989,432)( 1,454,941)( - 1,454,941)( 6,862,952)( - 6,862,952)( 3,551,206)( - 3,551,206)(
139,383)( - 139,383)( 1,114,449)( - 1,114,449)( 9,161,694)( - 9,161,694)(
222,354)( - 222,354)( 2,395,524)( - 2,395,524)( 3,076,037)( - 3,076,037)(
13,438,419)( - 13,438,419)( 1,047,632)( - 1,047,632)( 2,142,849)( - 2,142,849)(
152,291)( - 152,291)( 8,935,004)( - 8,935,004)(
3,450)( - 3,450)( 17,947)( - 17,947)(
564,597)( - 564,597)(
121,231,216)( - 121,231,216)(
- 160,075 160,075 - 2,605 2,605
- 162,680 162,680
121,231,216)( 162,680 121,068,536)(
39,819,191 - 39,819,191 16,162,668 - 16,162,668 67,630,168 - 67,630,168
100,693 - 100,693 46,059 - 46,059
123,758,779 - 123,758,779
2,527,563 162,680 2,690,243 11,499,364 236,293 11,735,657
14,026,927$ 398,973$ 14,425,900$
Primary Government
Changes in Net AssetsNet (Expenses) Revenue and
13

EXHIBIT C-1
10 50 60 98Data Total
Control Debt Capital Other GovernmentalCodes General Service Projects Governmental Funds
ASSETS1110 Cash and cash equivalents 5,043,737$ -$ -$ 510,359$ 5,554,096$ 1120 Current investments 36,572,466 4,550,405 5,776,302 3,036,649 49,935,822 1220 Delinquent property taxes receivable 1,470,977 715,565 - - 2,186,542 1230 Allowance for uncollectible taxes 545,186)( 208,996)( - - 754,182)( 1240 Due from other governments 2,893,122 5,484 - 1,440,272 4,338,878 1250 Accrued interest 226,535 - - - 226,535 1260 Due from other funds 1,247,933 - - - 1,247,933 1290 Other receivables 64,623 - - 47,147 111,770
1410 Deferred expenditures 1,346 - - 913 2,259
1000 Total assets 46,975,553$ 5,062,458$ 5,776,302$ 5,035,340$ 62,849,653$
LIABILITIES AND FUND BALANCES Liabilities:
2110 Accounts payable 930,307$ -$ 825,394$ 727,708$ 2,483,409$ 2150 Payroll deductions and withholdings 1,902,077 - - - 1,902,077 2160 Accrued wages payable 4,309,140 - - 238,103 4,547,243 2170 Due to other funds - - 75,455 1,172,138 1,247,593 2180 Due to other governments 4,915,507 688,753 - - 5,604,260 2190 Due to student groups 15,923 - - - 15,923
2300 Deferred revenue 812,387 460,630 - 136,570 1,409,587
2000 Total liabilities 12,885,341 1,149,383 900,849 2,274,519 17,210,092
Fund balances:3450 Restricted - grants funds - - - 1,439,117 1,439,117 3470 Restricted - capital acquisition
and contractual obligations - - 4,875,453 644,590 5,520,043 3480 Restricted - debt service - 3,913,075 - - 3,913,075 3510 Committed - construction 800,000 - - - 800,000 3530 Committed - capital equipment 500,000 - - - 500,000 3545 Committed - band uniforms 20,000 - - - 20,000 3550 Assigned - construction - - - 677,114 677,114 3590 Assigned - other 868,780 - - - 868,780 3590 Assigned - appropriation
for adopted budget 2,337,082 - - - 2,337,082
3600 Unassigned 29,564,350 - - - 29,564,350
3000 Total fund balances 34,090,212 3,913,075 4,875,453 2,760,821 45,639,561
4000 Total liabilities and fund balances 46,975,553$ 5,062,458$ 5,776,302$ 5,035,340$ 62,849,653$
The accompanying notes are an integral part of this financial statement.
HAYS CONSOLIDATED INDEPENDENT SCHOOL DISTRICTBALANCE SHEET - GOVERNMENTAL FUNDS
AUGUST 31, 2012
14

EXHIBIT C-2
Total Fund Balances- Governmental Funds 45,639,561$
The District uses internal service funds to charge the costs of certain activities, such asself-insurance and printing, to appropriate functions in other funds. The assets andliabilities of the internal service funds are included in governmental activities in thestatement of net assets. The net effect of this consolidation is to increase net assets. 75,236
Capital assets used in governmental activities are not financial resources and thereforeare not reported in the funds. 282,994,659
Long-term liabilities, including bonds and loans payable, are not due and payable inthe current period and therefore are not reported in the funds. Losses on refunding ofbonds and the premium on issuance of bonds payable are netted against the long-termliabilities in the statement of net assets. 317,369,265)(
Interest payable is not due and payable in the current period and, therefore, is notreported as a liability in the governmental funds. 678,106)(
Bond issuance costs are reported in the governmental funds as an expenditure and thecosts, net of amortization, are reported as an asset in the statement of net assets. 2,091,825
Uncollected property taxes are reported as deferred revenue in the governmental fundsbalance sheet, but are recognized as revenue in the statement of activities. 1,273,017
Net assets of governmental activities 14,026,927$
The accompanying notes are an integral part of this financial statement.
FOR THE YEAR ENDED AUGUST 31, 2012
HAYS CONSOLIDATED INDEPENDENT SCHOOL DISTRICTRECONCILIATION OF THE GOVERNMENTAL FUNDS BALANCE SHEET TO THE
STATEMENT OF NET ASSETS
15

EXHIBIT C-3
10 50 60 98
Data Total
Control Debt Capital Other GovernmentalCodes General Service Projects Governmental Funds
REVENUES5700 Local and intermediate sources 41,300,379$ 16,194,405$ 11,729$ 2,765,524$ 60,272,037$ 5800 State program revenues 72,957,442 6,318,566 - 1,155,082 80,431,090
5900 Federal program revenues 2,522,484 - - 11,905,222 14,427,706
5020 Total revenues 116,780,305 22,512,971 11,729 15,825,828 155,130,833
EXPENDITURES Current:
0011 Instruction 63,322,827 - 1,391 7,250,464 70,574,682 0012 Instructional resources and media services 1,954,062 - - 6,407 1,960,469 0013 Curriculum and staff development 994,073 - - 342,372 1,336,445 0021 Instructional leadership 1,753,730 - - 36,278 1,790,008 0023 School leadership 6,695,458 - - 9,926 6,705,384 0031 Guidance, counseling, and evaluation services 3,608,542 - - 298,885 3,907,427 0032 Social work services 147,362 - - 189 147,551 0033 Health services 1,611,904 - - - 1,611,904 0034 Student transportation 8,107,454 - - - 8,107,454 0035 Food service 69,000 - - 7,483,630 7,552,630 0036 Extracurricular activities 2,813,710 - - - 2,813,710 0041 General administration 3,028,963 - - - 3,028,963 0051 Facilities maintenance and operations 12,883,096 - 11,004 174,766 13,068,866 0052 Security and monitoring services 1,012,142 - - - 1,012,142 0053 Data processing services 2,038,091 - 50,096 65,713 2,153,900 0061 Community services 255,413 - - 12,625 268,038 0071 Principal on long-term debt 316,051 11,405,000 - - 11,721,051 0072 Interest on long-term debt 24,341 13,875,895 - - 13,900,236 0073 Bond issuance costs and fees - 249,914 - - 249,914 0081 Facilities acqusition and construction - - 6,487,242 1,715,223 8,202,465 0093 Payments related to shared services arrangements 17,947 - - - 17,947
0099 Other intergovernmental charges 564,597 - - - 564,597
6030 Total expenditures 111,218,763 25,530,809 6,549,733 17,396,478 160,695,783
1100 EXCESS (DEFICIENCY) OF REVENUES
OVER (UNDER) EXPENDITURES 5,561,542 3,017,838)( 6,538,004)( 1,570,650)( 5,564,950)(
OTHER FINANCING SOURCES (USES)7901 Refunding bonds issued - 16,540,000 - - 16,540,000 7912 Sale of real or personal property 8,141 - - - 8,141 7915 Transfers in - 3,000,000 - - 3,000,000 7916 Premium or discount on issuance of bonds - 2,387,320 - - 2,387,320 8911 Transfers out 3,000,000)( - - - 3,000,000)(
8940 Payment to bond refunding escrow agent - 18,866,773)( - - 18,866,773)(
7080 Total other financing sources (uses) 2,991,859)( 3,060,547 - - 68,688
1200 NET CHANGE IN FUND BALANCES 2,569,683 42,709 6,538,004)( 1,570,650)( 5,496,262)(
0100 FUND BALANCES, BEGINNING 31,520,529 3,870,366 11,413,457 4,331,471 51,135,823
3000 FUND BALANCES, ENDING 34,090,212$ 3,913,075$ 4,875,453$ 2,760,821$ 45,639,561$
FOR THE YEAR ENDED AUGUST 31, 2012
The accompanying notes are an integral part of this financial statement.
HAYS CONSOLIDATED INDEPENDENT SCHOOL DISTRICTSTATEMENT OF REVENUES, EXPENDITURES AND CHANGES IN FUND BALANCES
GOVERNMENTAL FUNDS
16

EXHIBIT C-4
Net change in fund balances - total governmental funds 5,496,262)$(
Governmental funds report capital outlays as expenditures. However, in the statementof activities, the cost of those assets is allocated over their estimated useful lives asdepreciation expense. This is the amount by which capital outlays exceededdepreciation in the current period. 2,342,406)(
In the statement of activities, only the gain or loss on the sale of capital assets isreported, whereas in the governmental funds, the proceeds from the sale increasefinancial resources. Thus, the change in net assets differs from the change in fundbalance by the cost of the capital assets sold. 70,719
Revenues in the statement of activities that do not provide current financial resourcesare not reported as revenues in the funds. 136,710)(
Repayment of bond principal is an expenditure in the governmental funds, but therepayment reduces long-term liabilities in the statement of net assets. This is theamount of repayments. 11,660,504
Some expenses reported in the statement of activities do not require the use of currentfinancial resources and therefore are not reported as expenditures in governmentalfunds. 1,236,315)(
Internal service funds are used by management to charge the costs of certain activities,such as insurance and telecommunications, to individual funds. The net revenue(expense) of the internal service funds is reported with governmental activities. 8,033
Change in net assets of governmental activities 2,527,563$
The accompanying notes are an integral part of this financial statement.
Amounts reported for governmental activities in the statement of activities are differentbecause:
HAYS CONSOLIDATED INDEPENDENT SCHOOL DISTRICTRECONCILIATION OF THE STATEMENT OF REVENUES,EXPENDITURES AND CHANGES IN FUND BALANCES OF
GOVERNMENTAL FUNDS TO THE STATEMENT OF ACTIVITIESFOR THE YEAR ENDED AUGUST 31, 2012
17

EXHIBIT D-1
Business-type GovernmentalActivities Activities
Enterprise InternalFunds Service Funds
ASSETS Current assets: Cash and cash equivalents 437,357$ 72,807$ Investments - current - 34,734 Other receivables 7,062 7,925 Inventory - 43,918
Total current assets 444,419 159,384
Noncurrent assets: Furniture and equipment - 23,418 Depreciation on furniture and equipment - 10,653)(
Total noncurrent assets - 12,765
Total assets 444,419 172,149
LIABILITIES Current liabilities: Accounts payable 2,807 83,665 Accrued wages payable 42,639 2,985
Due to other funds - 340
Total liabilities 45,446 86,990
NET ASSETS Invested in capital assets - 12,765 Unrestricted 398,973 72,394
Total net assets 398,973$ 85,159$
The accompanying notes are an integral part of this financial statement.
HAYS CONSOLIDATED INDEPENDENT SCHOOL DISTRICTSTATEMENT OF NET ASSETS
PROPRIETARY FUNDSAUGUST 31, 2012
18

EXHIBIT D-2
Business-type GovernmentalActivities ActivitiesEnterprise Internal
Funds Service Funds
OPERATING REVENUES Local and intermediate sources 1,313,721$ 402,549$
Total operating revenues 1,313,721 402,549
OPERATING EXPENSES Payroll costs 1,052,943 136,983 Professional and contracted services 54,303 147,598 Supplies and materials 35,726 98,769 Other operating costs 8,069 11,166
Total operating expenses 1,151,041 394,516
INCOME 162,680 8,033
NET ASSETS, BEGINNING 236,293 77,126
NET ASSETS, ENDING 398,973$ 85,159$
The accompanying notes are an integral part of this financial statement.
AND CHANGES IN FUND NET ASSETS
HAYS CONSOLIDATED INDEPENDENT SCHOOL DISTRICTSTATEMENT OF REVENUES, EXPENSES
PROPRIETARY FUNDSFOR THE YEAR ENDED AUGUST 31, 2012
19

EXHIBIT D-3
Business-type GovernmentalActivities Activities Enterprise Internal
Funds Service Funds
CASH FLOWS FROM OPERATING ACTIVITIES Receipts from customers 1,310,142$ 415,177$ Payments to suppliers 88,167)( 136,367)( Payments to employees 1,073,485)( 224,336)( Claims paid - 26,095)(
Other receipts (payments) 8,069)( 5,184)(
Net cash provided by operating activities 140,421 23,195
CASH FLOWS FROM CAPITAL AND RELATED FINANCING ACTIVITIES Purchase of capital assets - 14,892)(
Net cash used by capital and
related financing activities - 14,892)(
CASH FLOWS FROM INVESTING ACTIVITIES Proceeds from sales and maturities of investments - 23,044
Net cash flows provided by investing activities - 23,044
NET INCREASE IN CASH AND CASH EQUIVALENTS 140,421 31,347
CASH, BEGINNING 296,936 41,460
CASH, ENDING 437,357$ 72,807$
RECONCILIATION OF OPERATING INCOME (LOSS) TO NET CASH PROVIDED (USED) BY OPERATING ACTIVITIES Operating income 162,680$ 8,033$ Adjustments to reconcile operating income to net cash provided (used) by operating activities: Cash flows reported in other categories: Depreciation expense - 4,969 Change in assets and liabilities: Receivables, net 3,579)( 398 Due from other funds - 12,230 Inventories - 12,642)( Accounts and other payables 1,862 9,251 Accrued wages payable 20,542)( 616
Due to other funds - 340
Net cash provided by operating activities 140,421$ 23,195$
The accompanying notes are an integral part of this financial statement.
HAYS CONSOLIDATED INDEPENDENT SCHOOL DISTRICTSTATEMENT OF CASH FLOWS
PROPRIETARY FUNDSFOR THE YEAR ENDED AUGUST 31, 2012
20

EXHIBIT E-1
PrivatePurpose AgencyTrusts Funds
ASSETS Cash and cash equivalents 36,693$ 1,083,877$
Total assets 36,693 1,083,877
LIABILITIES Accounts payable 75 - Due to student groups - 1,083,877
Total liabilities 75 1,083,877
NET ASSETS
Unrestricted net assets 36,618 -
Total net assets 36,618$ -$
The accompanying notes are an integral part of this financial statement.
HAYS CONSOLIDATED INDEPENDENT SCHOOL DISTRICTSTATEMENT OF FIDUCIARY NET ASSETS
FIDUCIARY FUNDSAUGUST 31, 2012
21

EXHIBIT E-2
PrivatePurposeTrusts
ADDITIONS Local and intermediate sources 81,042$
Total additions 81,042
DEDUCTIONS Payroll costs 6,784 Professional and contracted services 35,645 Supplies and materials 4,862 Other operating costs 26,552
Total deductions 73,843
CHANGE IN NET ASSETS 7,199
NET ASSETS, BEGINNING 29,419
NET ASSETS, ENDING 36,618$
The accompanying notes are an integral part of this financial statement.
HAYS CONSOLIDATED INDEPENDENT SCHOOL DISTRICTSTATEMENT OF CHANGES IN FIDUCIARY NET ASSETS
FIDUCIARY FUNDSFOR THE YEAR ENDED AUGUST 31, 2012
22

23
HAYS CONSOLIDATED INDEPENDENT SCHOOL DISTRICT NOTES TO THE BASIC FINANCIAL STATEMENTS
AUGUST 31, 2012 I. SUMMARY OF SIGNIFICANT ACCOUNTING POLICIES
A. Reporting Entity
The Hays Consolidated Independent School District (the “District”) is a public educational agency operating under the applicable laws and regulations of the State of Texas. It is governed by a seven-member Board of Trustees (the “Board”) elected by registered voters of the District. The District prepares its basic financial statements in conformity with generally accepted accounting principles and it complies with the requirements of the appropriate version of Texas Education Agency’s Financial Accountability System Resource Guide (the “Resource Guide”) and the requirements of contracts and grants of agencies from which it receives funds.
In determining the financial reporting entity, Hays Consolidated Independent School District complies with the provisions of GASB Statement No. 14, The Financial Reporting Entity, and GASB Statement No. 39, Determining Whether Certain Organizations are Component Units, and includes all component units of which the District appointed a voting majority of the units’ board and the District is either able to impose its will on the unit, or a financial benefit or burden relationship exists. Blended component units, although legally separate entities, are in substance, part of the District’s operations and so data from these units are combined with data of the District. Each discretely presented component unit on the other hand, is reported in a separate column under component unit on the government-wide statements to emphasize that it is legally separate from the primary government. Under these standards, the District has no component units which are required to be reported, discretely or blended, in combination with the primary government.
B. Government-wide and Fund Financial Statements
The Statement of Net Assets and the Statement of Activities are government-wide financial statements. They report information on all of the Hays Consolidated Independent School District’s nonfiduciary activities with most of the interfund activities removed. Governmental activities include programs supported primarily by taxes, state foundation funds, grants and other intergovernmental revenues. Business-type activities include operations that rely to a significant extent on fees and charges for support.
(continued)

24
I. SUMMARY OF SIGNIFICANT ACCOUNTING POLICIES (Continued)
B. Government-wide and Fund Financial Statements (Continued)
The Statement of Activities demonstrates how other people or entities that participate in programs the District operates have shared in the payment of the direct costs. The “charges for services” column includes payments made by parties that purchase, use, or directly benefit from goods or services provided by a given function or segment of the District. Examples include tuition paid by students not residing in the District, school lunch charges, etc. The “grants and contributions” column includes amounts paid by organizations outside the District to help meet the Secondary Education Act. Interfund activities between governmental funds and between governmental funds and proprietary funds appear as “due to/due from” on the governmental fund Balance Sheet and proprietary fund Statement of Net Assets and as “other resources and other uses” on the governmental fund Statement of Revenues, Expenditures and Changes in Fund Balance and on the proprietary fund Statement of Revenues, Expenses and Changes in Fund Net Assets. All interfund transactions between governmental funds and between governmental funds and internal service funds are eliminated on the government-wide statements. Interfund activities between governmental funds and enterprise funds remain on the government-wide statements and appear on the government-wide Statement of Net Assets as internal balances and on the Statement of Activities as interfund transfers. Interfund activities between governmental funds and fiduciary funds remain as “due to/due from” on the government-wide Statement of Activities. The fund financial statements provide reports on the financial condition and results of operations for three fund categories – governmental, proprietary and fiduciary. Since the resources in the fiduciary funds cannot be used for District operations, they are not included in the government-wide statements. The District considers some governmental funds major and reports their financial condition and results of operations in a separate column.
C. Measurement Focus, Basis of Accounting, and Financial Statement Presentation
The accounting and financial reporting treatment is determined by the applicable measurement focus and basis of accounting. Measurement focus indicates the type of resources being measured such as current financial resources or economic resources. The basis of accounting indicates the timing of transactions or events for recognition in the financial statements. Amounts reported as program revenues include 1) charges to customers or applicants for goods, services, or privileges provided, 2) operating grants and contributions, and 3) capital grants and contributions, including special assessments. Internally dedicated resources are reported as general revenues rather than as program revenues. Likewise, general revenues include all taxes.
(continued)

25
I. SUMMARY OF SIGNIFICANT ACCOUNTING POLICIES (Continued)
C. Measurement Focus, Basis of Accounting, and Financial Statement Presentation (Continued)
The government-wide financial statements use the economic resources measurement focus and the accrual basis of accounting. Revenue is recorded when earned and expenses are recorded when a liability is incurred, regardless of the timing of related cash flows. Property taxes are recognized as revenue in the year for which they are levied. Grants and similar items are recognized as revenue as soon as all eligibility requirements imposed by the provider have been met.
The governmental fund financial statements are reporting using the current financial resources measurement focus and the modified accrual basis of accounting. Revenues are recognized as soon as they are both measurable and available. Revenues are considered to be available when they are collectible within the current period or soon enough thereafter to pay liabilities of the current period. For this purpose, the government considers revenues to be available if they are collected within 60 days of the end of the current fiscal period. Expenditures generally are recorded when a liability is incurred, as under accrual accounting. However, debt service expenditures, as well as expenditures related to compensated absences, and claims and judgments, are recorded only when payment is due. General capital asset acquisitions are reported as expenditures in governmental funds. Issuance of long-term debt and acquisitions under capital leases are reported as other financing sources. Grant funds are considered to be earned to the extent of expenditures made under the provisions of the grant. Accordingly, when such funds are received, they are recorded as deferred revenue until related and authorized expenditures have been made. If balances have not been expended by the end of the project period, grantors sometimes require the District to refund all or part of the unused amount. Proprietary funds distinguish operating revenues and expenses from non-operating items. Operating revenues and expenses generally result from providing services and producing and delivering goods in connection with a proprietary fund’s principal ongoing operations. The principal operating revenues of the District’s Enterprise Funds and of the District’s Internal Service Funds are charges to customers for daycare services and printing costs. Operating expenses for Enterprise Funds and Internal Service Funds include the cost of daycare services, printing costs and administrative expenses. All revenues and expenses not meeting this definition are reported as non-operating revenues and expenses.
(continued)

26
I. SUMMARY OF SIGNIFICANT ACCOUNTING POLICIES (Continued)
C. Measurement Focus, Basis of Accounting, and Financial Statement Presentation (Continued)
The proprietary fund types and the private-purpose trust fund are accounted for on a flow of economic resources measurement focus and utilize the accrual basis of accounting. This basis of accounting recognizes revenue in the accounting period in which it is earned and becomes measurable, and expenses in the accounting period in which they are incurred and become measurable. The District applies all GASB pronouncements, as well as the Financial Accounting Standards Board pronouncements issued on or before November 30, 1989, unless these pronouncements conflict or contradict GASB pronouncements. The District has elected not to follow subsequent private-sector guidance. With this measurement focus, all assets and all liabilities associated with the operation of these funds are included on the Statement of Net Assets. The fund equity is segregated into invested in capital assets net of related debt, restricted net assets, and unrestricted net assets. The agency fund has no measurement focus, but utilizes the accrual basis of accounting for reporting its assets and liabilities.
When both restricted and unrestricted resources are available for use, it is the government’s policy to use restricted resources first, then unrestricted resources as they are needed.
D. Fund Accounting
The District reports the following major governmental funds:
The General Fund is the District’s primary operating fund. It accounts for all financial resources except those required to be accounted for in another fund. Debt Service Fund – The District accounts for resources accumulated and payments made for principal and interest on long-term general obligation debt of governmental funds in a Debt Service Fund.
Capital Projects Funds – The proceeds from long-term debt financing and revenue and expenditures related to authorized construction and other capital asset acquisitions are accounted for in a Capital Projects Fund.
The District has no major Enterprise Funds.
(continued)
27
I. SUMMARY OF SIGNIFICANT ACCOUNTING POLICIES (Continued)
D. Fund Accounting (Continued)
Additionally, the District reports the following fund types: Governmental Funds:
Special Revenue Funds – The District accounts for resources restricted to, or committed for, specific purposes by the District or a grantor in a Special Revenue Fund. Most federal and some state financial assistance is accounted for in a Special Revenue Fund, and sometimes unused balances must be returned to the grantor at the close of specified project periods.
Capital Projects Fund – The proceeds from long-term debt financing and revenue and expenditures related to authorized construction and other capital asset acquisitions are accounted for in a Capital Projects Fund.
Proprietary Funds:
Enterprise Funds – The District’s activities for which outside users are charged a fee roughly equal to the cost of providing the goods or services of those activities are accounted for in an Enterprise Fund. The District’s non-major Enterprise Funds consist of the Campus Childcare Funds, the School Based Health Clinic, and the Community Education Program.
Internal Service Fund – Revenue and expenses related to services provided to organizations inside the District on a cost reimbursement basis are accounted for in an Internal Service Fund. The District’s Internal Service Funds are the Workers’ Compensation Fund and Print Shop.
Fiduciary Funds:
Private Purpose Trust Fund – The District uses this fund to sponsor a training seminar for music instruction and to award scholarships to students of the District. Revenues for this fund are fees paid by seminar participants and donations from employees to fund scholarships. Expenses associated with the seminar are paid from this fund, as are scholarships awarded to students.
Agency Fund – The District accounts for resources held for others in a custodial capacity in an Agency Fund. The District’s Agency Fund is the Student Activity Fund.
E. Other Accounting Policies 1. The District’s cash and cash equivalents are considered to be cash on hand, demand
deposits and short-term investments with original maturities of three months or less from the date of acquisition. Investments for the District are reported at fair value.
(continued)

28
I. SUMMARY OF SIGNIFICANT ACCOUNTING POLICIES (Continued)
E. Other Accounting Policies (Continued)
2. For purposes of the statement of cash flows for proprietary and similar fund types, the District considers highly liquid investments to be cash equivalents if they have a maturity of three months or less when purchased.
3. The District records purchases of supplies as expenditures. Supplies are used for almost
all functions of activity, while food commodities received from the Texas Department of Human Services are used only in the food service program. Although the food commodities are received at no cost, their fair market value is supplied by the Texas Department of Human Services and recorded as expenditures when received.
4. In the government-wide financial statements, and proprietary fund types in the fund
financial statements, long-term debt and other long-term obligations are reported as liabilities in the applicable governmental activities, business-type activities, or proprietary fund type statement of net assets. Bond premiums and discounts, as well as issuance costs, are deferred and amortized over the life of the bonds using the effective interest method. Bonds payable are reported net of the applicable bond premium or discount. Bond issuance costs are reported as deferred charges and amortized over the term of the related debt.
5. It is the District’s policy to permit some employees to accumulate earned but unused
vacation and sick pay benefits. All vacation pay is accrued when incurred in the government-wide, proprietary, and fiduciary fund financial statements. A liability for these amounts is reported in governmental funds only if they have matured, for example, as a result of employee resignations and retirements.
6. Capital assets, which include land, buildings, furniture and equipment, are reported in the
applicable governmental or business-type activities columns in the government-wide financial statements. Capital assets are defined by the District as assets with an initial, individual cost of more than $5,000 and an estimated useful life in excess of two years. Such assets are recorded at historical cost or estimated historical cost if purchased or constructed. Donated capital assets are recorded at estimated fair market value at the date of donation.
The costs of normal maintenance and repairs that do not add to the value of the asset or materially extend assets lives are not capitalized. Major outlays for capital assets and improvements are capitalized as projects are constructed.
(continued)

29
I. SUMMARY OF SIGNIFICANT ACCOUNTING POLICIES (Continued)
E. Other Accounting Policies (Continued) Buildings, furniture and equipment of the District are depreciated using the straight-line method over the following estimated useful lives:
Assets Years
Buildings 39Building improvements 20Vehicles 10Office equipment 5 - 15Computer equipment 5
7. As of September 1, 2004, the District is no longer self-insured for its workers’
compensation insurance. All outstanding claims prior to the switch are handled by the District and are accounted for in the Workers’ Compensation Internal Service Fund.
The District also provides health care benefits to its employees under a health care insurance plan. The insurance is provided by a licensed insurer.
8. Fund Balance Classification
The governmental fund financial statements present fund balances based on classifications that comprise a hierarchy that is based primarily on the extent to which the District is bound to honor constraints on the specific purposes for which amounts in the respective governmental funds can be spent. The classifications used in the governmental fund financial statements are as follows: Nonspendable: This classification includes amounts that cannot be spent
because they are either (a) not in spendable form or (b) are legally or contractually required to be maintained intact. Nonspendable items are not expected to be converted to cash or are not expected to be converted to cash within the next year.
Restricted: This classification includes amounts for which constraints have been placed on the use of the resources either (a) externally imposed by creditors, grantors, contributors, or laws or regulations of other governments, or (b) imposed by law through constitutional provisions or enabling legislation.
(continued)

30
I. SUMMARY OF SIGNIFICANT ACCOUNTING POLICIES (Continued)
E. Other Accounting Policies (Continued)
8. Fund Balance Classification (Continued)
Committed: This classification includes amounts that can be used only for specific purposes pursuant to constraints imposed by board resolution of the School Board, the District’s highest level of decision making authority. These amounts cannot be used for any other purpose unless the School Board removes or changes the specified use by taking the same type of action that was employed when the funds were initially committed. This classification also includes contractual obligations to the extent that existing resources have been specifically committed for use in satisfying those contractual requirements.
Assigned: This classification includes amounts that are constrained by the District’s intent to be used for a specific purpose but are neither restricted nor committed. This intent can be expressed by the School Board or Superintendent’s designee.
Unassigned: This classification includes the residual fund balance for the General Fund. The unassigned classification also includes negative residual fund balance of any other governmental fund that cannot be eliminated by offsetting of assigned fund balance amounts.
When an expenditure is incurred for purposes for which both restricted and unrestricted fund balance is available, the District considers restricted funds to have been spent first. When an expenditure is incurred for which committed, assigned, or unassigned fund balances are available, the District considers amounts to have been spent first out of committed funds, then assigned funds, and finally unassigned funds.
9. The Data Control Codes refer to the account code structure prescribed by TEA in the
Financial Accountability System Resource Guide. Texas Education Agency requires school districts to display these codes in the financial statements filed with the Agency in order to insure accuracy in building a statewide database for policy development and funding plans.
10. Estimates – The preparation of financial statements in conformity with accounting principles generally accepted in the United States of America requires management to make estimates and assumptions that affect certain reported amounts and disclosures. Accordingly, actual results could differ from those estimates.
The amount of state foundation revenue a school district earns for a year can and does vary until the time when final values for each of the factors in the formula become available. Availability can be as late as midway into the next fiscal year. It is at least reasonably possible that the foundation revenue estimates as of August 31, 2012, will change. The amount of such a change cannot be estimated at this time.
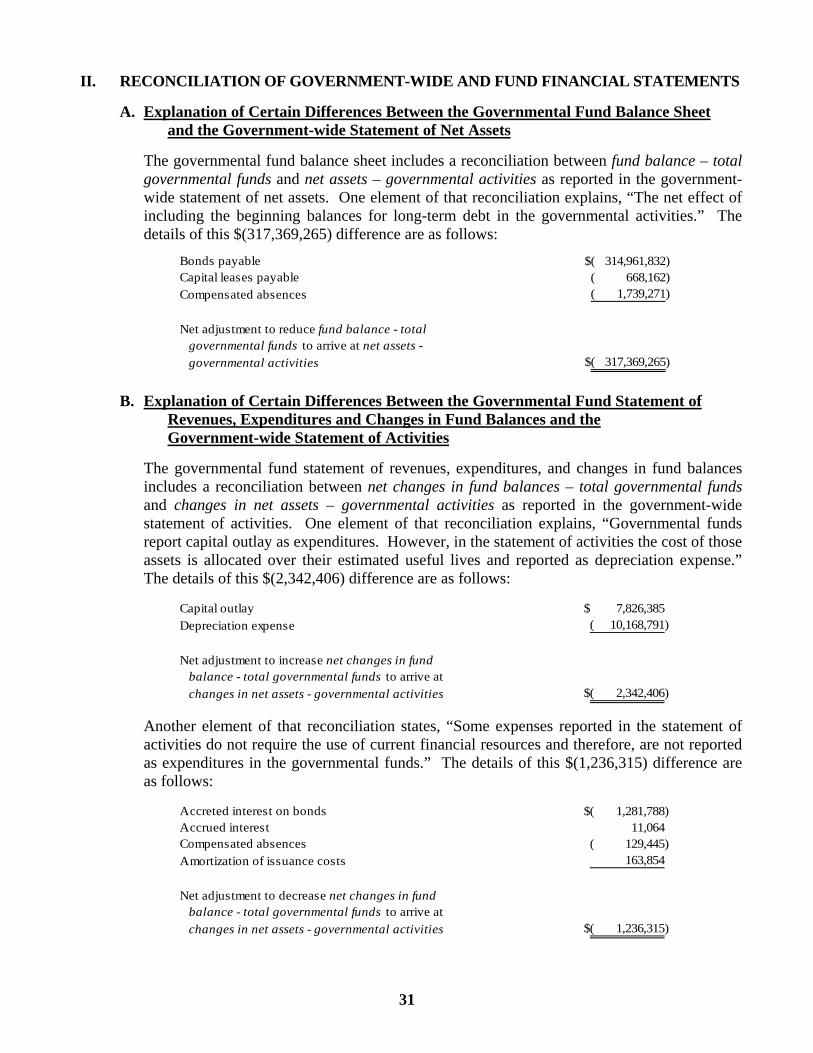
31
II. RECONCILIATION OF GOVERNMENT-WIDE AND FUND FINANCIAL STATEMENTS
A. Explanation of Certain Differences Between the Governmental Fund Balance Sheet and the Government-wide Statement of Net Assets
The governmental fund balance sheet includes a reconciliation between fund balance – total governmental funds and net assets – governmental activities as reported in the government-wide statement of net assets. One element of that reconciliation explains, “The net effect of including the beginning balances for long-term debt in the governmental activities.” The details of this $(317,369,265) difference are as follows:
Bonds payable 314,961,832)$( Capital leases payable 668,162)( Compensated absences 1,739,271)(
Net adjustment to reduce fund balance - total governmental funds to arrive at net assets - governmental activities 317,369,265)$(
B. Explanation of Certain Differences Between the Governmental Fund Statement of
Revenues, Expenditures and Changes in Fund Balances and the Government-wide Statement of Activities
The governmental fund statement of revenues, expenditures, and changes in fund balances includes a reconciliation between net changes in fund balances – total governmental funds and changes in net assets – governmental activities as reported in the government-wide statement of activities. One element of that reconciliation explains, “Governmental funds report capital outlay as expenditures. However, in the statement of activities the cost of those assets is allocated over their estimated useful lives and reported as depreciation expense.” The details of this $(2,342,406) difference are as follows:
Capital outlay 7,826,385$
Depreciation expense 10,168,791)(
Net adjustment to increase net changes in fund balance - total governmental funds to arrive at
changes in net assets - governmental activities 2,342,406)$(
Another element of that reconciliation states, “Some expenses reported in the statement of activities do not require the use of current financial resources and therefore, are not reported as expenditures in the governmental funds.” The details of this $(1,236,315) difference are as follows:
Accreted interest on bonds 1,281,788)$( Accrued interest 11,064 Compensated absences 129,445)(
Amortization of issuance costs 163,854
Net adjustment to decrease net changes in fund balance - total governmental funds to arrive at
changes in net assets - governmental activities 1,236,315)$(
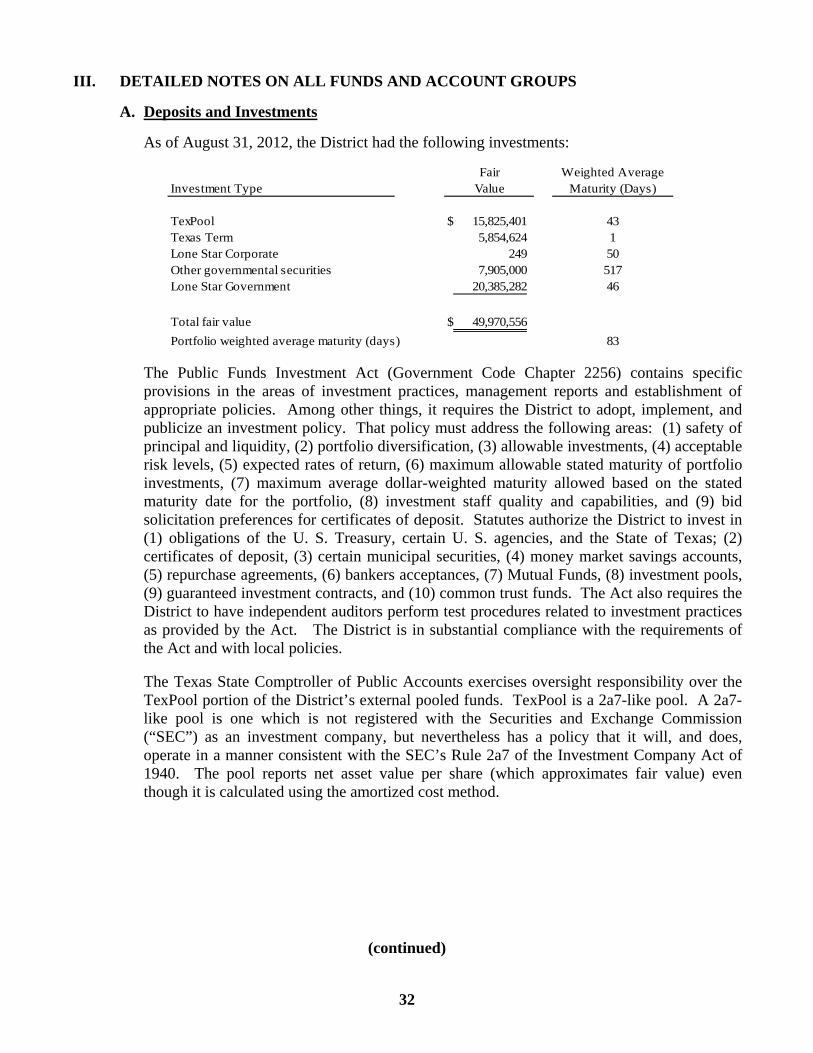
32
III. DETAILED NOTES ON ALL FUNDS AND ACCOUNT GROUPS
A. Deposits and Investments
As of August 31, 2012, the District had the following investments:
Fair Weighted AverageInvestment Type Value Maturity (Days)
TexPool 15,825,401$ 43Texas Term 5,854,624 1Lone Star Corporate 249 50Other governmental securities 7,905,000 517Lone Star Government 20,385,282 46
Total fair value 49,970,556$
Portfolio weighted average maturity (days) 83
The Public Funds Investment Act (Government Code Chapter 2256) contains specific provisions in the areas of investment practices, management reports and establishment of appropriate policies. Among other things, it requires the District to adopt, implement, and publicize an investment policy. That policy must address the following areas: (1) safety of principal and liquidity, (2) portfolio diversification, (3) allowable investments, (4) acceptable risk levels, (5) expected rates of return, (6) maximum allowable stated maturity of portfolio investments, (7) maximum average dollar-weighted maturity allowed based on the stated maturity date for the portfolio, (8) investment staff quality and capabilities, and (9) bid solicitation preferences for certificates of deposit. Statutes authorize the District to invest in (1) obligations of the U. S. Treasury, certain U. S. agencies, and the State of Texas; (2) certificates of deposit, (3) certain municipal securities, (4) money market savings accounts, (5) repurchase agreements, (6) bankers acceptances, (7) Mutual Funds, (8) investment pools, (9) guaranteed investment contracts, and (10) common trust funds. The Act also requires the District to have independent auditors perform test procedures related to investment practices as provided by the Act. The District is in substantial compliance with the requirements of the Act and with local policies.
The Texas State Comptroller of Public Accounts exercises oversight responsibility over the TexPool portion of the District’s external pooled funds. TexPool is a 2a7-like pool. A 2a7-like pool is one which is not registered with the Securities and Exchange Commission (“SEC”) as an investment company, but nevertheless has a policy that it will, and does, operate in a manner consistent with the SEC’s Rule 2a7 of the Investment Company Act of 1940. The pool reports net asset value per share (which approximates fair value) even though it is calculated using the amortized cost method.
(continued)

33
III. DETAILED NOTES ON ALL FUNDS AND ACCOUNT GROUPS (Continued)
A. Deposits and Investments (Continued)
Interest Rate Risk
To reduce exposure to changes in interest rates that could adversely affect the value of investments, the District shall use final and weighted-average-maturity limits and diversification. The District shall monitor interest rate risk using weighted average maturity and specific identification.
Custodial Credit Risk
In the case of deposits, this is the risk that in the event of a bank failure, the District’s deposits may not be returned to it. As of August 31, 2012, all of the District’s deposit balance was covered by FDIC insurance under the Frank Dodd Act.
Credit Risk
It is the District’s policy to limit its investments to investment types with an investment quality rating not less than A or its equivalent by a nationally recognized statistical rating organization.
The District’s investment pools are rated as follows by Standard & Poor’s Investors Service.
TexPool AAAmLone Star Liquidity Plus AAALone Star Liquidity AAAAIM AAATexas Term AAAm
Concentration of Credit Risk
The District’s policy on concentration of credit risk states that the investment portfolio shall be diversified in terms of investment instruments, maturity scheduling and financial institutions to reduce risk of loss resulting from over concentration of assets in a specific class of investments, specific maturity or specific issuer.
(continued)

34
III. DETAILED NOTES ON ALL FUNDS AND ACCOUNT GROUPS (Continued) B. Receivables
Receivables as of year-end for the District’s individual major funds and nonmajor, internal service and fiduciary funds in the aggregate, including the applicable allowances for uncollectible accounts, are as follows:
Debt Nonmajor Nonmajor
General Service Governmental Proprietary Total
Receivables: Taxes 1,470,977$ 715,565$ -$ -$ 2,186,542$
Intergovernmental 2,893,122 5,484 1,440,272 - 4,338,878
Other receivables 64,623 - 47,147 7,062 118,832
Gross receivables 4,428,722 721,049 1,487,419 7,062 6,644,252 Less: allowance for
uncollectibles 545,186)( 208,996)( - - 754,182)(
Net total receivables 3,883,536$ 512,053$ 1,487,419$ 7,062$ 5,890,070$ Governmental funds report deferred revenue in connection with receivables for revenue that is not considered to be available to liquidate liabilities of the current period. Governmental funds also defer revenue recognition in connection with resources that have been received, but not yet earned. At the end of the current fiscal year, the various components of deferred revenue and unearned revenue reported in the governmental funds were as follows:
Unavailable Unearned
Delinquent property taxes receivable (General Fund) 812,387$ -$ Delinquent property taxes receivable (Debt Service Fund) 460,630 - Grants drawn down prior to meeting all eligibility requirements - 136,570
Total deferred/unearned revenue for governmental funds 1,273,017$ 136,570$
Property taxes are levied by October 1 on the assessed value listed as of the prior January 1 for all real and business personal property located in the District in conformity with Subtitle E, Texas Property Tax Code. Taxes are due on receipt of the tax bill and are delinquent if not paid before February 1 of the year following the year in which imposed. On January 31 of each year, a tax lien attaches to property to secure the payment of all taxes, penalties and interest ultimately imposed. Property tax revenue is considered available (1) when it becomes due or past due and receivable within the current period and (2) when it is expected to be collected during a 60-day period after the close of the school fiscal year.
(continued)

35
III. DETAILED NOTES ON ALL FUNDS AND ACCOUNT GROUPS (Continued)
B. Receivables (Continued) Delinquent taxes are prorated between maintenance and debt service based on rates adopted for the year of the levy. Allowances for uncollectible tax receivables within the General and Debt Service Funds are based on historical experience in collecting property taxes. Uncollectible personal property taxes are periodically reviewed and written off, but the District is prohibited from writing off real property taxes without specific statutory authority from the Texas Legislature.
C. Interfund Transactions
Interfund receivables and payables at August 31, 2012, consisted of the following:
Due From/To Other Funds
Receivable Fund Payable Fund Amount
General Nonmajor governmental 1,172,138$
General Capital projects 75,455
General Internal service 340
Total 1,247,933$ Balances resulted from the time lag between the dates that 1) interfund goods and services are provided on reimbursable expenditures occur, and 2) transactions are recorded in the accounting system, and 3) payments between funds are made.
Interfund transfers at August 31, 2012, consisted of the following:
Transfers In/Out
Transfer in Transfer out Amount
Debt service General 3,000,000$
Total 3,000,000$ The General Fund transferred money to various nonmajor funds for the following:
$3,000,000 to support debt service requirements.
(continued)

36
III. DETAILED NOTES ON ALL FUNDS AND ACCOUNT GROUPS (Continued)
D. Capital Asset Activity
Capital asset activity for the District for the year ended August 31, 2012, was as follows:
Beginning Ending
Balance Balance
08/31/11 Increases Decreases Adjustments 08/31/12
Governmental activities: Capital assets, not being depreciated:
Land 17,015,317$ 4,372$ -$ 19,576$ 17,039,265$
Construction in progress 318,813 6,908,405 3,498)( - 7,223,720
Total capital assets,
not being depreciated 17,334,130 6,912,777 3,498)( 19,576 24,262,985
Capital assets, being depreciated:
Buildings and improvements 339,549,520 - - 123,354 339,672,874
Furniture and equipment 21,522,856 927,029 177,470)( - 22,272,415
Total capital assets,
being depreciated 361,072,376 927,029 177,470)( 123,354 361,945,289
Less accumulated depreciation for:
Buildings and improvements 81,699,535 8,138,273 - 72,211 89,910,019
Furniture and equipment 11,447,706 2,030,518 177,470)( - 13,300,754
Total accumulated
depreciation 93,147,241 10,168,791 177,470)( 72,211 103,210,773
Total capital assets,
being depreciated, net 267,925,135 9,241,762)( - 51,143 258,734,516
Governmental activit ies
capital assets, net 285,259,265$ 2,328,985)$( 3,498)$( 70,719$ 282,997,501$
Primary Government
(continued)

37
III. DETAILED NOTES ON ALL FUNDS AND ACCOUNT GROUPS (Continued)
D. Capital Asset Activity (Continued)
Depreciation expense was charged to functions/programs of the primary government as follows:
Governmental activities: Instruction 6,508,887$ Instructional resources and media services 195,962 Curriculum and instructional staff development 43,009 Instructional leadership 925 School leadership 520,022 Guidance, counseling and evaluation services 207,115 Health services 94,828 Student (pupil) transportation 1,379,598 Food services 19,107 Extracurricular activities 130,836 General administration 34,155 Plant maintenance and operations 765,922 Security monitoring service 43,250
Data processing services 225,175
Total depreciation expense - governmental activities 10,168,791$ E. Changes in Long-term Liabilities
Long-term activity for the year ended August 31, 2012, was as follows:
Be ginning EndingBa la nc e Ba la nc e Due Within08/31/11 Additions Re duc tions Re funding Ac c re tion 08/31/12 One Ye a r
Go ve rn me n ta l a c tivitie s : Bonds a nd ge ne ra l obliga tion bonds 325,118,146$ 18,927,320$ 11,409,671$ 18,960,422$ 1,286,459$ 314,961,832$ 12,675,000$ Ca pita l le a se s 984,213 - 316,051 - - 668,162 326,946
Compe nsa te d a bse nc e 1,609,826 303,298 173,853 - - 1,739,271 347,854
Tota l gove rnme nta l a c tivitie s long- te rm
lia bilitie s 327,712,185$ 19,230,618$ 11,899,575$ 18,960,422$ 1,286,459$ 317,369,265$ 13,349,800$
The Debt Service Fund and the General Fund are utilized to repay long-term liabilities. Also for the governmental activities, compensated absences are generally liquidated by the General Fund.
(continued)

38
III. DETAILED NOTES ON ALL FUNDS AND ACCOUNT GROUPS (Continued)
F. Capital Leases
The District acquired school buses and financed HVAC renovations through a lease purchase agreement in May 2004. The amount of the original issue was for $2,900,000 with an interest rate of 3.39%. This agreement qualifies as a capital lease for accounting purposes and, therefore, has been recorded at the present value of future minimum lease payments as of the date of inception.
The assets acquired through capital leases are as follows:
GovernmentalActivities
Asset: Buildings and improvement 1,924,745$ Furniture and equipment 1,000,128 Less: accumulated depreciation 1,194,922)(
Total 1,729,951$
Capital lease obligations:
Year EndedAugust 31, Principal Interest Requirements
2013 326,946$ 18,496$ 345,442$
2014 338,217 7,225 345,442
2015 2,999 26 3,025
Totals 668,162$ 25,747$ 693,909$
G. Bonds Payable
All of the individual bonds are for capital assets or are refunding debt issues. Current requirements for principal and interest expenditures are accounted for in the Debt Service Fund.
(continued)
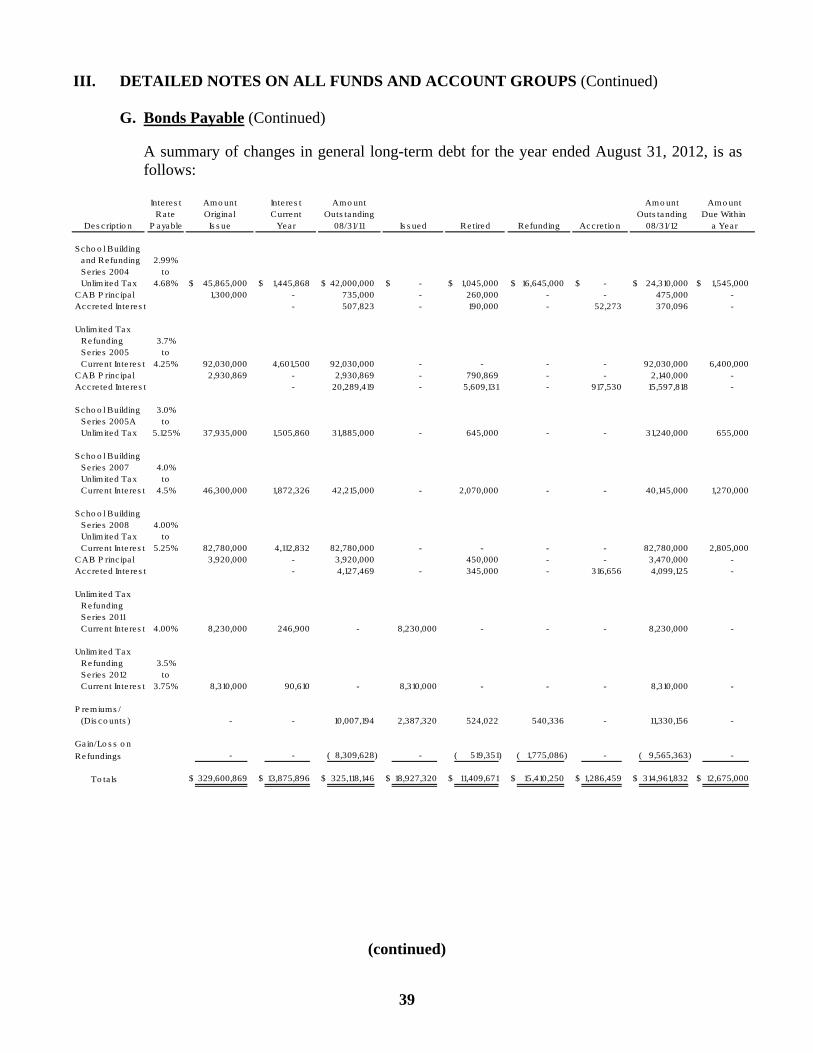
39
III. DETAILED NOTES ON ALL FUNDS AND ACCOUNT GROUPS (Continued)
G. Bonds Payable (Continued) A summary of changes in general long-term debt for the year ended August 31, 2012, is as follows:
Inte res t Amo unt Inte re s t Amo unt Amo unt Amo unt
Rate Origina l Current Outs tanding Outs tanding Due Within Des criptio n P ayable Is s ue Year 08/31/11 Is s ued Re tired Refunding Accre tio n 08/31/12 a Year
Scho o l Building and Refunding 2.99% Series 2004 to Unlimited Tax 4.68% 45,865,000$ 1,445,868$ 42,000,000$ -$ 1,045,000$ 16,645,000$ -$ 24,310,000$ 1,545,000$ CAB P rinc ipa l 1,300,000 - 735,000 - 260,000 - - 475,000 - Accre ted Inte re s t - 507,823 - 190,000 - 52,273 370,096 -
Unlimited Tax Re funding 3.7% Series 2005 to Current Inte res t 4.25% 92,030,000 4,601,500 92,030,000 - - - - 92,030,000 6,400,000 CAB P rinc ipa l 2,930,869 - 2,930,869 - 790,869 - - 2,140,000 - Accre ted Inte re s t - 20,289,419 - 5,609,131 - 917,530 15,597,818 -
Scho o l Building 3.0% Series 2005A to Unlimited Tax 5.125% 37,935,000 1,505,860 31,885,000 - 645,000 - - 31,240,000 655,000
Scho o l Building Series 2007 4.0% Unlimited Tax to Current Inte res t 4.5% 46,300,000 1,872,326 42,215,000 - 2,070,000 - - 40,145,000 1,270,000
Scho o l Building Series 2008 4.00% Unlimited Tax to Current Inte res t 5.25% 82,780,000 4,112,832 82,780,000 - - - - 82,780,000 2,805,000 CAB P rinc ipa l 3,920,000 - 3,920,000 450,000 - - 3,470,000 - Accre ted Inte re s t - 4,127,469 - 345,000 - 316,656 4,099,125 -
Unlimited Tax Re funding Series 2011 Current Inte res t 4.00% 8,230,000 246,900 - 8,230,000 - - - 8,230,000 -
Unlimited Tax Re funding 3.5% Series 2012 to Current Inte res t 3.75% 8,310,000 90,610 - 8,310,000 - - - 8,310,000 -
P remiums / (Dis co unts ) - - 10,007,194 2,387,320 524,022 540,336 - 11,330,156 -
Ga in/Lo s s o n
Refundings - - 8,309,628)( - 519,351)( 1,775,086)( - 9,565,363)( -
To ta ls 329,600,869$ 13,875,896$ 325,118,146$ 18,927,320$ 11,409,671$ 15,410,250$ 1,286,459$ 314,961,832$ 12,675,000$
(continued)

40
III. DETAILED NOTES ON ALL FUNDS AND ACCOUNT GROUPS (Continued)
G. Bonds Payable (Continued)
Accretion on Capital Appreciation Bonds A portion of the bonds sold in the Unlimited Tax School Building and Refunding Bonds Series 2004 were capital appreciation bonds. The obligations have par values of $475,000 and maturity values of $900,000. The interest on these obligations will be paid upon maturity in the fiscal years ending August 31, 2013 and 2014. The accreted values of these bonds at August 31, 2012, are approximately $845,096 which has been allocated to the governmental activities. A portion of the bonds sold in the Unlimited Tax Refunding Bonds Series 2005 were capital appreciation bonds. The obligations have par values of $2,140,000 and maturity values of $19,200,000. The interest on these obligations will be paid upon maturity in the fiscal years ending August 31, 2013 to 2015. The accreted values of these bonds at August 31, 2012, are approximately $17,737,818 which has been allocated to the governmental activities. A portion of the bonds sold in the Unlimited Tax School Building and Refunding Bonds Series 2008 were capital appreciation bonds. The obligations have par values of $3,470,000 and maturity values of $8,290,000. The interest on these obligations will be paid upon maturity in the fiscal years ending August 31, 2013 to 2016. The accreted values of these bonds at August 31, 2012, are approximately $7,569,125 which has been allocated to the governmental activities.
Debt service requirements are as follows:
Year Ended TotalAugust 31, Principal Interest Requirements
2013 12,675,000$ 13,805,018$ 26,480,018$ 2014 11,880,000 13,688,587 25,568,587 2015 11,920,000 13,559,637 25,479,637 2016 12,095,000 13,393,966 25,488,966 2017 12,580,000 12,920,191 25,500,191
2018-2022 72,535,000 55,197,316 127,732,316 2023-2027 92,680,000 35,968,621 128,648,621 2028-2032 46,500,000 15,736,376 62,236,376 2033-2037 34,580,000 7,252,875 41,832,875
2038-2041 7,990,000 379,525 8,369,525
Total 315,435,000 181,902,112$ 497,337,112$
Less: accretion of interest on CABs 2,237,961
Par value of bonds outstanding 313,197,039$
General Obligations
(continued)

41
III. DETAILED NOTES ON ALL FUNDS AND ACCOUNT GROUPS (Continued)
G. Bonds Payable (Continued)
Accretion on Capital Appreciation Bonds (Continued)
There are a number of limitations and restrictions contained in the general obligation bond indenture. Management has indicated that the District is in compliance with all significant limitations and restrictions at August 31, 2012.
H. Advance Refunding The government issued $8,230,000 of unlimited tax refunding bonds to provide resources to purchase U. S. Government State and Local Government securities that were placed in an irrevocable trust for the purchase of generating resources for all future debt service payments of $8,305,000 of school building and refunding bonds. As a result, the refunded bonds are considered to be defeased and the liability has been removed from the governmental activities column of the statement of net assets. The reacquisition price exceeded the net carrying amount of the old debt by $983,614. This amount is being netted against the new debt and amortized over the remaining life of the new debt, which is shorter than the life of the new debt issued. This advance refunding was undertaken to reduce total debt service payments over the next 11 years by $1,075,347 and resulted in an economic gain of $966,009. The government issued $8,310,000 of unlimited tax refunding bonds to provide resources to purchase U. S. Government State and Local Government securities that were placed in an irrevocable trust for the purchase of generating resources for all future debt service payments of $8,340,000 of school building and refunding bonds. As a result, the refunded bonds are considered to be defeased and the liability has been removed from the governmental activities column of the statement of net assets. The reacquisition price exceeded the net carrying amount of the old debt by $791,472. This amount is being netted against the new debt and amortized over the remaining life of the new debt, which is shorter than the life of the new debt issued. This advance refunding was undertaken to reduce total debt service payments over the next 15 years by $1,736,998 and resulted in an economic gain of $1,508,558. Defeased Bonds In FY 2012, the District defeased certain general obligation bonds by placing proceeds of the new bonds in an irrevocable trust to provide for all future debt payments on the old bonds. Accordingly, the trust account assets and liabilities for the defeased bonds are not included in the District’s financial statements. As of August 31, 2012, the District had $16,645,000 of bonds considered defeased and still outstanding.
(continued)

42
III. DETAILED NOTES ON ALL FUNDS AND ACCOUNT GROUPS (Continued)
H. Advance Refunding (Continued) Issuance of Debt On November 11, 2011, the District issued $8,230,000 in Unlimited Tax Refunding Bonds, Series 2011. The bonds carry and interest rate of 4% with a final maturity date of August 15, 2022. The bonds were issued to refund a portion of the Unlimited Tax School Building and Refunding Bonds, Series 2004. On April 19, 2012, the District issued $8,310,000 in Unlimited Tax Refunding Bonds, Series 2012. The bonds carry and interest rate of 3.5% - 3.75% with a final maturity date of August 15, 2026. The bonds were issued to refund a portion of the Unlimited Tax School Building and Refunding Bonds, Series 2004.
I. Accumulated Unpaid Vacation and Sick Leave Benefits
The District pays employees, who have been employed in the District for a minimum of five years, for the number of unused local days equal to the number of unused State days accumulated, up to sixty days, upon resignation. The District also pays employees in positions that require twelve months of service for vacation days accumulated, up to thirty days, upon resignation. A summary of changes in the accumulated sick leave and vacation leave liability follows:
Sick Leave Vacation Leave
Balance, August 31, 2011 600,759$ 1,009,067$ Additions - new entrants and salary increments 179,102 124,196 Deductions - payments to participants 72,944 100,909
Balance, August 31, 2012 706,917$ 1,032,354$
(continued)

43
III. DETAILED NOTES ON ALL FUNDS AND ACCOUNT GROUPS (Continued)
J. Defined Benefit Pension Plan Plan Description. Hays Consolidated Independent School District contributes to the Teacher Retirement System of Texas (TRS), a cost-sharing multiple employer defined benefit pension plan. TRS administers retirement and disability annuities, and death and survivor benefits to employees and beneficiaries of employees of the public school systems of Texas. It operates primarily under the provisions of the Texas Constitution, Article XVI, Sec. 67, and Texas Government Code, Title 8, Subtitle C. TRS also administers proportional retirement benefits and service credit transfer under Texas Government Code, Title 8, Chapters 803 and 805, respectively. The Texas state legislature has the authority to establish and amend benefit provisions of the pension plan and may, under certain circumstances, grant special authority to the TRS Board of Trustees. TRS issues a publicly available financial report that includes financial statements and required supplementary information for the defined benefit pension plan. That report may be obtained by downloading the report from the TRS internet website, www.trs.state.tx.us, under the TRS Publications heading, by calling the TRS Communications Department at 1-800-223-8778, or by writing to the TRS Communications Department, 1000 Red River Street, Austin, Texas 78701. Funding Policy. Contribution requirements are not actuarially determined but are established and amended by the Texas state legislature. The state funding policy is as follows: (1) The state constitution requires the legislature to establish a member contribution rate of not less than 6.0% of the member’s annual compensation and a state contribution rate of not less than 6.0% and not more than 10% of the aggregate annual compensation of all members of the system during the fiscal year; (2) state statute prohibits benefit improvements, if as result of a particular action, the time required to amortize TRS’ unfunded actuarial liabilities would be increased to a period that exceeds 31 years, or, if the amortization period already exceeds 31 years, the period would be increased by such action. Contribution rates and contributions for fiscal years 2010-2012 are shown in the table below. These rates are set by the General Appropriations Act. In certain instances, the reporting district is required to make all or a portion of the state’s and/or member’s contribution and on the portion of the employee’s salaries that exceeded the statutory minimum.
StatutoryYear Rate Amount Rate Amount Amount
2012 6.4% 5,454,941$ 6.0% 4,096,508$ 1,008,131$ 2011 6.4% 5,516,563 6.644% 4,569,494 1,157,389 2010 6.4% 5,316,250 6.644% 4,360,660 1,145,141
Contribution Rates and Contribution Amounts
Member State
(continued)

44
III. DETAILED NOTES ON ALL FUNDS AND ACCOUNT GROUPS (Continued)
K. Health Care Coverage
During the year ended August 31, 2012, employees of the District were covered by a health insurance plan (the Plan). The District paid premiums of $287 per month per employee to the Plan. Employees, at their option, authorized payroll withholdings to pay for any amount above the District contribution. All premiums were paid to TRS acting on behalf of the licensed insurer. The Plan was authorized by Article 3.51-2, Texas Insurance Code and was documented by contractual agreement.
L. Retiree Health Plan
Plan Description. The Hays Consolidated Independent School District contributes to the Texas Public School Retired Employees Group Insurance Program (TRS-Care), a cost-sharing multiple-employer defined benefit post-employment health care plan administered by the Teacher Retirement System of Texas. TRS-Care Retired Plan provides health care coverage for certain persons (and their dependents) who retired under the Teacher Retirement System of Texas. The statutory authority for the program is Texas Insurance Code, Chapter 1575. Section 1575.052 grants the TRS Board of Trustees the authority to establish and amend basic and optional group insurance coverage for participants. The TRS issues a publicly available financial report that includes financial statements and required supplementary information for TRS-Care. That report may be obtained by visiting the TRS website at www.trs.state.tx.us, by writing to the Communications Department of the Teacher Retirement System of Texas at 1000 Red River Street, Austin, Texas 78701, or by calling 1-800-223-8778. Funding Policy. Contribution requirements are not actuarially determined but are legally established each biennium by the Texas Legislature. Texas Insurance Code, Sections 1575.202, 203, and 204 establish state, active employee, and public school contributions, respectively. Funding for free basic coverage is provided by the program based upon public school district payroll. Per Texas Insurance Code, Chapter 1575, the public school contribution may not be less than 0.25% or greater than 0.75% of the salary of each active employee of the public school. Funding for optional coverage is provided by those participants selecting the optional coverage. Contribution rates and amounts are shown in the table below for fiscal years 2010-2012.
Year Rate Amount Rate Amount Rate Amount
2012 0.65% 553,003$ 1.0% 850,773$ 0.55% 467,925$ 2011 0.65% 560,277 1.0% 861,963 0.55% 474,079 2010 0.65% 539,932 1.0% 830,664 0.55% 456,865
Contribution Rates
Active Member State School District
(continued)

45
III. DETAILED NOTES ON ALL FUNDS AND ACCOUNT GROUPS (Continued) L. Retiree Health Plan (Continued)
Medicare Part D – On-behalf Payments. The Medicare Prescription Drug, Improvement, and Modernization Act of 2003, which was effective January 1, 2006, established prescription drug coverage for Medicare beneficiaries known as Medicare Part D. One of the provisions of Medicare Part D allows for the Texas Public School Retired Employee Group Insurance Program (TRS-Care) to receive retiree drug subsidy payments from the federal government to offset certain prescription drug expenditures for eligible TRS-Care participants. These on-behalf payments of $223,366, $199,214, and $201,352 were recognized for the years ended August 31, 2012, 2011, and 2010, respectively, as equal revenues and expenditures. Early Retiree Reinsurance Program – On-behalf Payments. The Early Retiree Reinsurance Program (ERRP) is a provision of the Patient Protection and Affordable Care Act (PPAVA). A provision of the PPAVA allows the Texas Public School Retired Employee Group Insurance Program (TRS-Care) to receive a reimbursement from the Federal government for a portion of the cost to provide health benefits to retirees between the ages of 55-64 and their covered dependents regardless of age. The on-behalf payment of $211,232 was recognized for the year ended August 31, 2012, as equal revenues and expenditures.
M. Revenue from Local and Intermediate Sources
During the current year, revenue from local and intermediate sources consisted of the following:
De bt Ca pita l Inte rna lGe ne ra l S e rvic e P roje c ts Othe r Ente rprise S e rvic e Tota l
P rope rty ta xe s 39,623,218$ 16,029,762$ -$ -$ -$ -$ 55,652,980$ P e na ltie s , inte re s t a nd o the r ta x- re la te d inc ome 334,282 131,307 - - - - 465,589 Inve s tme nt inc ome 59,491 16,799 11,729 4,533 - - 92,552 Food sa le s - - - 2 ,522,401 - - 2 ,522,401 Co- c urric ula r s tude nt a c tivitie s 390,636 - - - - - 390,636 Re nt 245,288 - - - - - 245,288 Gifts a nd be que s ts 15,609 - - 123,103 - - 138,712
Othe r 631,855 16,537 - 115,487 1,313,721 402,549 2 ,480,149
41,300,379$ 16,194,405$ 11,729$ 2,765,524$ 1,313,721$ 402,549$ 61,988,307$
(continued)

46
III. DETAILED NOTES ON ALL FUNDS AND ACCOUNT GROUPS (Continued)
N. Joint Venture Shared Service Arrangements
The District is the fiscal agent for a Shared Services Arrangement (“SSA”) (Juvenile Justice Alternative Education Program) which provides alternative education programs for certain students of member districts. In addition to the District, other members are San Marcos CISD, and Hays County. All services are provided by the fiscal agent. The member districts provide the funds to the fiscal agent. According to guidance provided in TEA’s Resource Guide, the District has accounted for the fiscal agent’s activities of the SSA in Special Revenue Fund No. 458, Shared Services Arrangements – JJAEP, and will be accounted for using Model 3 in the SSA section of the Resource Guide. Expenditures of the SSA are summarized below:
Hays Consolidated Independent School District** 34,587$ San Marcos Consolidated Independent School District 34,587
Hays County 190,896
Total 260,070$
** Value of use of local HCISD facilities
O. Commitments and Contingencies
The District participates in grant programs which are governed by various rules and regulations of the grantor agencies. Costs charged to the respective grant programs are subject to audit and adjustment by the grantor agencies; therefore, to the extent that the District has not complied with the rules and regulations governing the grants, refunds of any money received may be required and the collectibility of any related receivable may be impaired. In the opinion of the District, there are no significant contingent liabilities relating to compliance with the rules and regulations governing the respective grants; therefore, no provision has been recorded in the accompanying combined financial statements for such contingencies. At August 31, 2012, the District is committed under construction contracts with remaining balances of approximately $969,044. These commitments are payable from Capital Projects Funds and Grant Funds.
P. Risk Management
The District is exposed to various risks of loss related to torts; theft of, damage to and destruction of assets; errors and omissions; and natural disasters. During fiscal 2012, the District purchased commercial insurance to cover general liabilities. There were no significant reductions in coverage in the current fiscal year, and there were no settlements exceeding insurance coverage for each of the past three fiscal years.
(continued)

47
III. DETAILED NOTES ON ALL FUNDS AND ACCOUNT GROUPS (Continued)
Q. Subsequent Event
Subsequent to the year-end, the District refunded $93 million in outstanding bonds in a taxable transaction. The District refunded $965,000 of the Unlimited Tax School Building and Refunding Bonds, Series 2004 and $92,030,000 of the Unlimited Tax Refunding Bonds, Series 2005. The refunding priced on Thursday, November 15, 2012, through a negotiated sale and achieved a net present value savings of $13.1 million. The table presents results of the refunding.
ActualDescription 11/15/12
Total savings 15,309,480$ Present value savings 13,119,234 Percent of present value savings 14.1%Refunded par amount 92,995,000

REQUIRED SUPPLEMENTARY INFORMATION

EXHIBIT G-1
Actual Variance with
Data Amounts Final Budget
Control (Budgetary PositiveCodes Original Final Basis) (Negative)
REVENUES5700 Local and intermediate sources 39,920,237$ 39,915,158$ 41,300,379$ 1,385,221$ 5800 State program revenues 73,193,033 74,453,033 72,957,442 1,495,591)(
5900 Federal program revenues 2,632,526 708,928 2,522,484 1,813,556
5020 Total revenues 115,745,796 115,077,119 116,780,305 1,703,186
EXPENDITURES Current:
0011 Instruction 65,650,224 65,654,524 63,322,827 2,331,697 0012 Instructional resources and
media sources 1,922,931 2,002,168 1,954,062 48,106 0013 Curriculum and staff development 1,280,964 1,128,405 994,073 134,332 0021 Instructional leadership 1,658,216 1,917,920 1,753,730 164,190 0023 School leadership 6,524,760 7,026,678 6,695,458 331,220 0031 Guidance, counseling, and
evaluation services 3,935,637 3,866,937 3,608,542 258,395 0032 Social work services 195,495 196,351 147,362 48,989 0033 Health services 1,610,703 1,648,011 1,611,904 36,107 0034 Student transportation 7,767,063 8,582,782 8,107,454 475,328 0035 Food service - 69,000 69,000 - 0036 Extracurricular activities 2,916,489 3,028,795 2,813,710 215,085 0041 General administration 3,284,462 3,364,867 3,028,963 335,904 0051 Facilities maintenance and operations 13,580,998 14,327,728 12,883,096 1,444,632 0052 Security and monitoring services 988,040 1,107,296 1,012,142 95,154 0053 Data processing services 1,960,928 2,134,153 2,038,091 96,062 0061 Community services 198,217 291,723 255,413 36,310 0071 Principal on long-term debt 341,827 327,486 316,051 11,435 0072 Interest on long-term debt - 24,341 24,341 - 0093 Payments related to shared
services arrangements 41,517 41,517 17,947 23,570
0099 Other governmental charges 594,370 594,370 564,597 29,773
6030 Total expenditures 114,452,841 117,335,052 111,218,763 6,116,289
1100 EXCESS (DEFICIENCY) OF
REVENUES OVER EXPENDITURES 1,292,955 2,257,933)( 5,561,542 7,819,475
OTHER FINANCING SOURCES (USES)7912 Sale of real or personal property - - 8,141 8,141
8911 Transfers out - 3,000,000)( 3,000,000)( -
7080 Total other financing sources (uses) - 3,000,000)( 2,991,859)( 8,141
1200 NET CHANGE IN FUND BALANCES 1,292,955 5,257,933)( 2,569,683 7,827,616
0100 FUND BALANCES, BEGINNING 31,520,529 31,520,529 31,520,529 -
3000 FUND BALANCES, ENDING 32,813,484$ 26,262,596$ 34,090,212$ 7,827,616$
Budgeted Amounts
HAYS CONSOLIDATED INDEPENDENT SCHOOL DISTRICTBUDGETARY COMPARISON SCHEDULE
GENERAL FUNDFOR THE YEAR ENDED AUGUST 31, 2012
48

49
HAYS CONSOLIDATED INDEPENDENT SCHOOL DISTRICT NOTES TO REQUIRED SUPPLEMENTARY INFORMATION
AUGUST 31, 2012 Budgetary Information The Board of Trustees adopts an “appropriated budget” for the General Fund, Debt Service Fund and the Food Service Fund (which is included in the Special Revenue Funds). The District is required to present the adopted and final amended budgeted revenue and expenditures for each of these funds. The District compares the final amended budget to actual revenue and expenditures. The General Fund Budget report appears in Exhibit G-1, and the other two reports are in Exhibits J-4 and J-5. The following procedures are followed in establishing the budgetary data reflected in the basic financial statements:
1. Prior to August 20, the District prepares a budget for the next succeeding fiscal year beginning September 1. The operating budget includes proposed expenditures and the means of financing them. The annual budget is prepared on the modified accrual basis of accounting.
2. A meeting of the Board is then called for the purpose of adopting the proposed
budget. At least 10 days’ public notice of the meeting must be given. 3. Prior to September 1, the budget is legally enacted through passage of a resolution by
the Board. Once a budget is approved, it can only be amended at the function and fund level by approval of a majority of the members of the Board. Amendments are presented to the Board at its regular meetings. Each amendment must have Board approval. As required by law, such amendments made before the fact, are reflected in the official minutes of the Board, and are not made after fiscal year-end. Because the District has a policy of careful budgetary control, several amendments were necessary during the year. However, none of these were significant.
4. Each budget is controlled by the budget coordinator at the revenue and expenditure
function/object level. Budgeted amounts are as amended by the Board. All budget appropriations lapse at year-end.
5. Encumbrances for goods or purchased services are documented by purchase orders or
contracts. Under Texas law, appropriations lapse at August 31, and encumbrances outstanding at that time are to be either canceled or appropriately provided for in the subsequent year’s budget.

COMBINING STATEMENTS

NONMAJOR GOVERNMENTAL FUNDS ESEA, Title X, Subtitle C – Education for the Homeless Children and Youth – Staff development and supplemental services, including in-service training, counseling, psychological services and tutoring aimed at supporting homeless students. ESEA, Title I, Part A – Improving Basic Programs – Provide opportunities for children served to acquire the knowledge and skills to meet the challenging State performance standards developed for all children. Adult Education (ABE) – Federal – Provide programs for adult education and literacy services to adults. IDEA – Part B, Formula – Operate educational programs for children with disabilities. IDEA – Part B, Preschool – Support programs for preschool children with disabilities. National School Breakfast and Lunch Program – Support programs using federal reimbursement revenues from the United States Department of Agriculture (USDA). Vocational Education – Basic Grant – Provide career and technology education to develop new and/or improved marketable skills for paid and unpaid employment. ESEA II, A, Training and Recruiting – Provide programs for improvement for school principals and recruiting teachers. Title III, Part A – English Language Acquisition – Improve the education of children with limited English proficiency, by assisting the children to learn English. Title XIV – State Fiscal Stabilization – ARRA (Stimulus) – Funds granted to improve basic programs authorized by the Elementary and Secondary Education Act of 1965, as amended by the No Child Left Behind Act of 2001; the Individuals with Disabilities Education Act (IDEA); the Adult and Family Literacy Act; the Carl D. Perkins and Technical Education Act of 2006; or for the modernization, renovation, or repair of public school facilities, including modernization, renovation, and repairs that are consistent with a recognized green building rating system (84.394). This grant is funded by the American Recovery and Reinvestment Act (ARRA) of 2009, Title XIV. IDEA – Part B, Formula – ARRA (Stimulus) – Operate educational programs for children with disabilities. Title I SIP Academy Grant – ARRA (Stimulus) – Address the needs of campuses in improvement, corrective action and restructuring in order to improve student achievement.

Education Job Fund – Provides funds to retain, recall or rehire school-level employees, and to hire new school-level employees, in order to provide early childhood, elementary or secondary educational and related services. Early LEP Summer School – This fund classification is to be used to account, on a project basis, for funds allocated to local educational agencies to enable them to address the unique needs limited English proficient students during the summer months. Other Federal Special Revenue Funds – This fund classification is to be used to account, on a project basis for federally funded Special Revenue Funds that have not been specified. Visually Impaired – This fund classification is to be used to account for State Supplemental Visually Impaired funds. This fund is to be used by single school districts, on a project basis, to account for any of these funds received from the ESC or district fiscal agent of a shared services arrangement. Non-Ed. Community Based Support – This fund classification is used to account for funds used for community based support. Advanced Placement Incentives – This fund classification is to be used to account, on a project basis, for funds awarded to school districts under the Texas Advanced Placement Award Incentive Program, Chapter 28, Subchapter C, TEC. Student Success Initiative – This fund classification is to be used to account, on a project basis, for funds granted for teacher training and allocations to schools to implement scientific, research-based programs for students who have been identified as unlikely to achieve the third grade TAAS reading standard by the end of the third grade. Instructional Materials Allotment – This fund is used to account for the purchase of instructional materials, technological equipment, and technology-related services purchased through the Texas Education Agency online requisition system. Other State Special Revenue Funds – This fund classification is used to account for various state special revenue funds. Included are funds awarded to schools for mentors, teacher advancement and to recognize and reward those students, teachers and schools that demonstrate success in achieving the state’s advanced academic standards. Hays County JJAEP – Juvenile Justice Alternative Education Program is a disciplinary program for students in Hays County. Education Foundation Grant – Teacher grants provided by the Hays CISD Foundation. Local Special Revenue Funds (489) – Grants awarded by outside foundations, corporations or other entities for a specific purpose.

Locally Defined Special Revenue Funds (499) – Provides additional resources for middle school students to meet high standards for college and career – readiness by enhancing teaching and learning across all content areas and providing integrated tiered intervention for struggling students. 2006 Bond Construction Fund – Capital projects funded by the 2006 bond. 2004 Bond Construction Fund – Capital projects funded by the 2004 bond. Capital Project – Local – This fund is used to account for projects funded by an operating transfer from the General Fund.

THIS PAGE LEFT BLANK INTENTIONALLY

206 211ESEA I, A
Data ESEA ImprovingControl Title X, C BasicCodes Homeless Program
ASSETS1110 Cash and cash equivalents -$ -$ 1120 Investments - - 1240 Due from other governments 2,648 196,468 1290 Other receivables - 11
1410 Deferred expenditures - -
1000 Total assets 2,648$ 196,479$
LIABILITIES AND FUND BALANCES Liabilities:
2110 Accounts payable 957$ -$
2160 Accrued wages payable - 18,574
2170 Due to other funds 1,691 177,905
2300 Deferred revenues - -
2000 Total liabilities 2,648 196,479
Fund balances:3400 Restricted - grants funds - -
3470 Restricted - capital acquisition
and contractual - -
3550 Assigned - construction - -
3000 Total fund balances - -
Total liabilities
4000 and fund balances 2,648$ 196,479$
HAYS CONSOLIDATED INDEPENDENT SCHOOL DISTRICTCOMBINING BALANCE SHEET
NONMAJOR GOVERNMENTAL FUNDS
AUGUST 31, 2012
Special Revenue Funds
50

EXHIBIT H-1
220 224 225 240 244 255 263 266National Title XIV
Adult IDEA - IDEA - Breakfast Vocational ESEA II, A Title III, A ARRA Education Part B Part B and Lunch Ed Basic Training and English Lang. State Fiscal
Federal Formula Preschool Program Grant Recruiting Acquisition Stabilization
-$ -$ -$ 366,983$ -$ -$ -$ -$ - - - 1,613,336 - - - - - 302,118 - 110,087 4,841 42,001 32,688 - - - - 42,939 - - - - - - - 913 - - - -
-$ 302,118$ -$ 2,134,258$ 4,841$ 42,001$ 32,688$ -$
-$ -$ -$ 553,360$ -$ 1,100$ -$ -$
- 88,037 - 122,649 142 2,957 1,565 -
- 214,081 - 19,132 4,699 37,944 31,123 - - - - - - - - -
- 302,118 - 695,141 4,841 42,001 32,688 -
- - - 1,439,117 - - - -
- - - - - - - - - - - - - - - -
- - - 1,439,117 - - - -
-$ 302,118$ -$ 2,134,258$ 4,841$ 42,001$ 32,688$ -$
Special Revenue Funds
51

283 286
Data IDEA, Pt. B Title I SIPControl ARRA AcademyCodes Formula Grant ARRA
ASSETS1110 Cash and cash equivalents -$ -$ 1120 Investments - - 1240 Due from other governments - 54,454 1290 Other receivables - 42
1410 Deferred expenditures - -
1000 Total assets -$ 54,496$
LIABILITIES AND FUND BALANCES Liabilities:
2110 Accounts payable -$ 43,588$
2160 Accrued wages payable - 2,904
2170 Due to other funds - 8,004
2300 Deferred revenues - -
2000 Total liabilities - 54,496
Fund balances:3400 Restricted - grants funds - -
3470 Restricted - capital acquisition
and contractual - -
3550 Assigned - construction - -
3000 Total fund balances - -
Total liabilities
4000 and fund balances -$ 54,496$
HAYS CONSOLIDATED INDEPENDENT SCHOOL DISTRICT
Special Revenue Funds
COMBINING BALANCE SHEETNONMAJOR GOVERNMENTAL FUNDS
AUGUST 31, 2012
52

EXHIBIT H-1
(Continued)
287 288 289 385 392 397 404 410Non-Ed.
Early LEP Community Advanced StudentEducation Summer Other Visually Based Placement Success Instructional
Job School Federal Impaired Support Incentives Initiative Materials
-$ -$ -$ -$ 5,111$ 56,986$ -$ -$ - - - - - - - -
156,223 21,243 500,000 1,645 - - 15,856 - - - - - - - - - - - - - - - - -
156,223$ 21,243$ 500,000$ 1,645$ 5,111$ 56,986$ 15,856$ -$
-$ -$ 27,789$ -$ -$ -$ -$ -$
- - - - - - - -
156,223 21,243 472,211 1,645 - - 15,856 - - - - - 5,111 56,986 - -
156,223 21,243 500,000 1,645 5,111 56,986 15,856 -
- - - - - - - -
- - - - - - - - - - - - - - - -
- - - - - - - -
156,223$ 21,243$ 500,000$ 1,645$ 5,111$ 56,986$ 15,856$ -$
Special Revenue Funds
53

429 458 481
DataControl Other Hays EducationCodes State County JJAEP Foundation
ASSETS1110 Cash and cash equivalents 7,757$ 27,117$ 26,177$ 1120 Investments - - - 1240 Due from other governments - - - 1290 Other receivables - - -
1410 Deferred expenditures - - -
1000 Total assets 7,757$ 27,117$ 26,177$
LIABILITIES AND FUND BALANCES Liabilities:
2110 Accounts payable 782$ -$ 4,749$
2160 Accrued wages payable - 1,275 -
2170 Due to other funds - - -
2300 Deferred revenues 6,975 25,842 21,428
2000 Total liabilities 7,757 27,117 26,177
Fund balances:3400 Restricted - grants funds - - -
3470 Restricted - capital acquisition
and contractual - - -
3550 Assigned - construction - - -
3000 Total fund balances - - -
Total liabilities
4000 and fund balances 7,757$ 27,117$ 26,177$
HAYS CONSOLIDATED INDEPENDENT SCHOOL DISTRICTCOMBINING BALANCE SHEET
NONMAJOR GOVERNMENTAL FUNDS
AUGUST 31, 2012
Special Revenue Funds
54

EXHIBIT -H-1
(Continued)
489 499 Total 606 634 699 TotalNonmajor Nonmajor Total
Special 2006 2004 Capital NonmajorLocally Revenue Bond Bond Projects Governmental
Local Defined Funds Construction Construction Local Funds Funds
20,228$ -$ 510,359$ -$ -$ -$ -$ 510,359$ - - 1,613,336 341,579 404,620 677,114 1,423,313 3,036,649 - - 1,440,272 - - - - 1,440,272 - 4,155 47,147 - - - - 47,147 - - 913 - - - - 913
20,228$ 4,155$ 3,612,027$ 341,579$ 404,620$ 677,114$ 1,423,313$ 5,035,340$
-$ -$ 632,325$ 95,383$ -$ -$ 95,383$ 727,708$
- - 238,103 - - - - 238,103
- 4,155 1,165,912 6,226 - - 6,226 1,172,138 20,228 - 136,570 - - - - 136,570
20,228 4,155 2,172,910 101,609 - - 101,609 2,274,519
- - 1,439,117 - - - - 1,439,117
- - - 239,970 404,620 - 644,590 644,590 - - - - - 677,114 677,114 677,114
- - 1,439,117 239,970 404,620 677,114 1,321,704 2,760,821
20,228$ 4,155$ 3,612,027$ 341,579$ 404,620$ 677,114$ 1,423,313$ 5,035,340$
Capital Projects FundsSpecial Revenue Funds
55

206 211ESEA I, A
Data ESEA ImprovingControl Title X, C BasicCodes Homeless Program
REVENUES5700 Total local and intermediate sources -$ -$ 5800 State program revenues - - 5900 Federal program revenues 2,648 1,012,096
5020 Total revenues 2,648 1,012,096
EXPENDITURES Current:
0011 Instruction 2,648 905,652 0012 Instructional resources and media services - 2,498 0013 Curriculum and staff development - 56,116 0021 Instructional leadership - 32,121 0023 School leadership - 4,667 0031 Guidance, counseling, and evaluation services - - 0032 Social work services - - 0035 Food service - - 0051 Facilities maintenance and operations - - 0053 Data processing services - - 0061 Community services - 11,042
Capital outlay0081 Facilities acquisition and construction - -
6030 Total expenditures 2,648 1,012,096
1100 EXCESS (DEFICIENCY) OF REVENUES OVER (UNDER) EXPENDITURES - -
1200 NET CHANGE IN FUND BALANCES - -
0100 FUND BALANCES, BEGINNING - -
3000 FUND BALANCES, ENDING -$ -$
HAYS CONSOLIDATED INDEPENDENT SCHOOL DISTRICTCOMBINING STATEMENT OF REVENUES, EXPENDITURES
AND CHANGES IN FUND BALANCES NONMAJOR GOVERNMENTAL FUNDS
FOR THE YEAR ENDED AUGUST 31, 2012
Special Revenue Funds
56
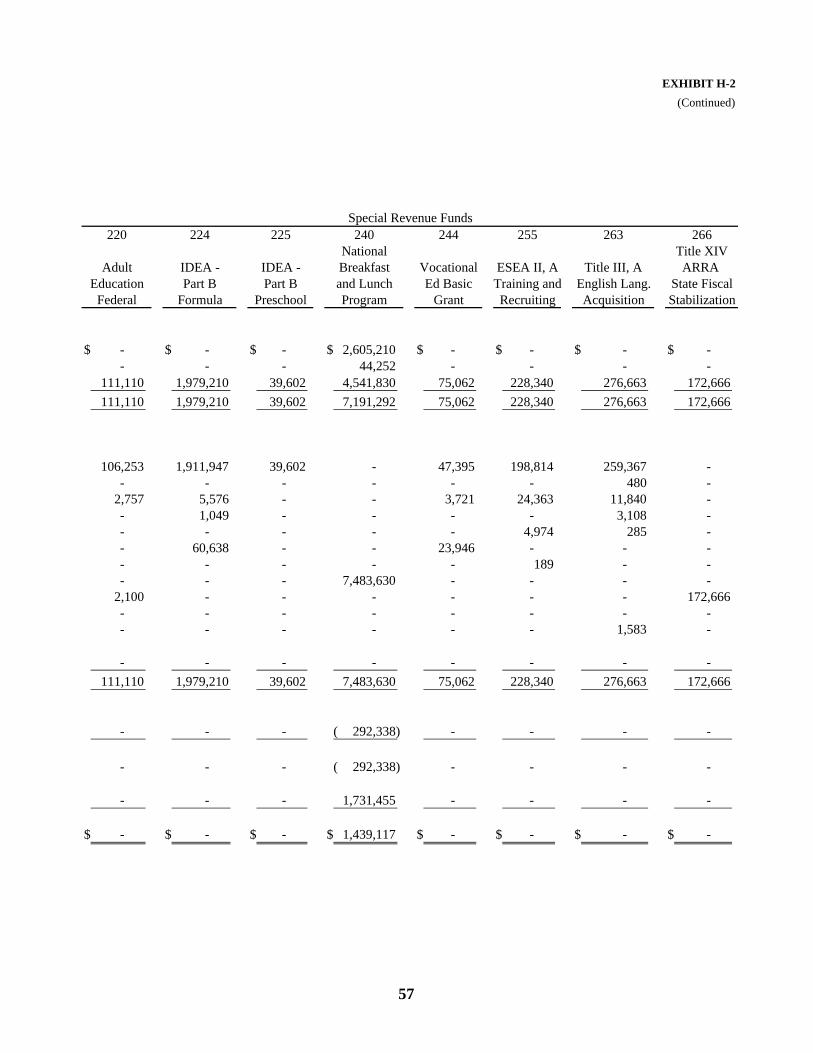
EXHIBIT H-2
(Continued)
220 224 225 240 244 255 263 266National Title XIV
Adult IDEA - IDEA - Breakfast Vocational ESEA II, A Title III, A ARRA Education Part B Part B and Lunch Ed Basic Training and English Lang. State Fiscal
Federal Formula Preschool Program Grant Recruiting Acquisition Stabilization
-$ -$ -$ 2,605,210$ -$ -$ -$ -$ - - - 44,252 - - - -
111,110 1,979,210 39,602 4,541,830 75,062 228,340 276,663 172,666
111,110 1,979,210 39,602 7,191,292 75,062 228,340 276,663 172,666
106,253 1,911,947 39,602 - 47,395 198,814 259,367 - - - - - - - 480 -
2,757 5,576 - - 3,721 24,363 11,840 - - 1,049 - - - - 3,108 - - - - - - 4,974 285 - - 60,638 - - 23,946 - - - - - - - - 189 - - - - - 7,483,630 - - - -
2,100 - - - - - - 172,666 - - - - - - - - - - - - - - 1,583 -
- - - - - - - -
111,110 1,979,210 39,602 7,483,630 75,062 228,340 276,663 172,666
- - - 292,338)( - - - -
- - - 292,338)( - - - -
- - - 1,731,455 - - - -
-$ -$ -$ 1,439,117$ -$ -$ -$ -$
Special Revenue Funds
57

283 286
Data IDEA, Pt. B Title I SIPControl ARRA AcademyCodes Formula Grant ARRA
REVENUES5700 Total local and intermediate sources -$ -$ 5800 State program revenues - - 5900 Federal program revenues 169,329 351,789
5020 Total revenues 169,329 351,789
EXPENDITURES Current:
0011 Instruction 152,092 138,351 0012 Instructional resources and media services - - 0013 Curriculum and staff development - 213,438 0021 Instructional leadership - - 0023 School leadership - - 0031 Guidance, counseling, and evaluation services 17,237 - 0032 Social work services - - 0035 Food service - - 0051 Facilities maintenance and operations - - 0053 Data processing services - - 0061 Community services - -
Capital outlay0081 Facilities acquisition and construction - -
6030 Total expenditures 169,329 351,789
1100 EXCESS (DEFICIENCY) OF REVENUES OVER (UNDER) EXPENDITURES - -
1200 NET CHANGE IN FUND BALANCES - -
0100 FUND BALANCES, BEGINNING - -
3000 FUND BALANCES, ENDING -$ -$
FOR THE YEAR ENDED AUGUST 31, 2012
Special Revenue Funds
HAYS CONSOLIDATED INDEPENDENT SCHOOL DISTRICTCOMBINING STATEMENTS OF REVENUES, EXPENDITURES
AND CHANGES IN FUND BALANCESNONMAJOR GOVERNMENTAL FUNDS
58

EXHIBIT H-2
(Continued)
287 288 289 385 392 397 404 410Non-Ed.
Early LEP Community Advanced StudentEducation Summer Other Visually Based Placement Success Instructional
Job School Federal Impaired Support Incentives Initiative Materials
-$ -$ -$ -$ -$ -$ -$ -$ - - - 1,345 850 3,497 84,636 1,018,617
2,422,488 22,389 500,000 - - - - -
2,422,488 22,389 500,000 1,345 850 3,497 84,636 1,018,617
2,225,424 19,064 - 1,345 850 2,957 84,636 1,018,617 - 3,325 - - - - - - - - - - - 540 - - - - - - - - - - - - - - - - - -
197,064 - - - - - - - - - - - - - - - - - - - - - - - - - - - - - - - - - - - - - - - - - - - - - - -
- - 500,000 - - - - -
2,422,488 22,389 500,000 1,345 850 3,497 84,636 1,018,617
- - - - - - - -
- - - - - - - -
- - - - - - - -
-$ -$ -$ -$ -$ -$ -$ -$
Special Revenue Funds
59

429 458 481
DataControl Other Hays EducationCodes State County JJAEP Foundation
REVENUES5700 Total local and intermediate sources -$ 34,587$ 40,513$ 5800 State program revenues 1,885 - - 5900 Federal program revenues - - -
5020 Total revenues 1,885 34,587 40,513
EXPENDITURES Current:
0011 Instruction - 34,587 40,513 0012 Instructional resources and media services 104 - - 0013 Curriculum and staff development 1,781 - - 0021 Instructional leadership - - - 0023 School leadership - - - 0031 Guidance, counseling, and evaluation services - - - 0032 Social work services - - - 0035 Food service - - - 0051 Facilities maintenance and operations - - - 0053 Data processing services - - - 0061 Community services - - -
Capital outlay0081 Facilities acquisition and construction - - -
6030 Total expenditures 1,885 34,587 40,513
1100 EXCESS (DEFICIENCY) OF REVENUES OVER (UNDER) EXPENDITURES - - -
1200 NET CHANGE IN FUND BALANCES - - -
0100 FUND BALANCES, BEGINNING - - -
3000 FUND BALANCES, ENDING -$ -$ -$
HAYS CONSOLIDATED INDEPENDENT SCHOOL DISTRICTCOMBINING STATEMENT OF REVENUES, EXPENDITURES
AND CHANGES IN FUND BALANCES NONMAJOR GOVERNMENTAL FUNDS
FOR THE YEAR ENDED AUGUST 31, 2012
Special Revenue Funds
60

EXHIBIT H-2
(Continued)
489 499 Total 606 634 699 TotalNonmajor Nonmajor Total
Special 2006 2004 Capital Nonmajor Locally Revenue Bond Bond Projects Governmental
Local Defined Funds Construction Construction Local Funds Funds
43,464$ 39,126$ 2,762,900$ 1,339$ 481$ 804$ 2,624$ 2,765,524$ - - 1,155,082 - - - - 1,155,082 - - 11,905,222 - - - - 11,905,222
43,464 39,126 15,823,204 1,339 481 804 2,624 15,825,828
21,224 39,126 7,250,464 - - - - 7,250,464 - - 6,407 - - - - 6,407
22,240 - 342,372 - - - - 342,372 - - 36,278 - - - - 36,278 - - 9,926 - - - - 9,926 - - 298,885 - - - - 298,885 - - 189 - - - - 189 - - 7,483,630 - - - - 7,483,630 - - 174,766 - - - - 174,766 - - - 65,713 - - 65,713 65,713 - - 12,625 - - - - 12,625
- - 500,000 1,213,823 1,400 - 1,215,223 1,715,223
43,464 39,126 16,115,542 1,279,536 1,400 - 1,280,936 17,396,478
- - 292,338)( 1,278,197)( 919)( 804 1,278,312)( 1,570,650)(
- - 292,338)( 1,278,197)( 919)( 804 1,278,312)( 1,570,650)(
- - 1,731,455 1,518,167 405,539 676,310 2,600,016 4,331,471
-$ -$ 1,439,117$ 239,970$ 404,620$ 677,114$ 1,321,704$ 2,760,821$
Capital Projects FundsSpecial Revenue Funds
61

INTERNAL SERVICE FUNDS Print Shop – Printing services to other organizational units of the school district, other school districts or governmental units. Self-Insurance – Self-insurance claims for workers’ compensation.

EXHIBIT H-3
752 753 TotalInternal
Print Shop Insurance Service Funds
ASSETS Current assets: Cash and cash equivalents 72,807$ -$ 72,807$ Investments - current - 34,734 34,734 Other receivable 7,925 - 7,925 Inventory 43,918 - 43,918 Total current assets 124,650 34,734 159,384
Noncurrent assets:
Furniture and equipment 23,418 - 23,418
Depreciation on furniture and equipment 10,653)( - 10,653)(
Total noncurrent assets 12,765 - 12,765
Total assets 137,415 34,734 172,149
LIABILITIES Current liabilities: Accounts payable 55,109 28,556 83,665 Accrued wages payable 2,985 - 2,985 Due to other funds - 340 340
Total liabilities 58,094 28,896 86,990
NET ASSETS Invested in capital assets 12,765 - 12,765 Unrestricted net assets 66,556 5,838 72,394
Total net assets 79,321$ 5,838$ 85,159$
HAYS CONSOLIDATED INDEPENDENT SCHOOL DISTRICTCOMBINING STATEMENT OF NET ASSETS
INTERNAL SERVICE FUNDSAUGUST 31, 2012
62

EXHIBIT H-4
752 753 TotalInternal
Print Shop Insurance Service Funds
OPERATING REVENUES Local and intermediate sources 402,494$ 55$ 402,549$
Total operating revenues 402,494 55 402,549
OPERATING EXPENSES Payroll costs 136,983 - 136,983 Professional and contracted services 146,305 1,293 147,598 Supplies and materials 85,418 13,351 98,769 Other operating costs 5,184 5,982 11,166
Total operating expenses 373,890 20,626 394,516
INCOME (LOSS) 28,604 20,571)( 8,033
NET ASSETS, BEGINNING 50,717 26,409 77,126
NET ASSETS, ENDING 79,321$ 5,838$ 85,159$
FOR THE YEAR ENDED AUGUST 31, 2012
HAYS CONSOLIDATED INDEPENDENT SCHOOL DISTRICTCOMBINING STATEMENT OF REVENUES, EXPENSES
AND CHANGES IN FUND NET ASSETSINTERNAL SERVICE FUNDS
63

EXHIBIT H-5
752 753 TotalInternal
Print Shop Insurance Service Funds
CASH FLOWS FROM OPERATING ACTIVITIES Receipts from customers 415,122$ 55$ 415,177$ Payments to suppliers 136,367)( - 136,367)( Payments to employees 224,336)( - 224,336)( Claims paid - 26,095)( 26,095)(
Other receipts (payments) 5,184)( - 5,184)(
Net cash provided (used) by operating activities 49,235 26,040)( 23,195
CASH FLOWS FROM CAPITAL AND RELATED FINANCING ACTIVITIES Purchases of capital assets 14,892)( - 14,892)(
Net cash flows used from capital and related financing activities 14,892)( - 14,892)(
CASH FLOWS FROM INVESTING ACTIVITIES Proceeds from sales and maturities of investments - 23,044 23,044
Net cash flows provided by investing activities - 23,044 23,044
NET INCREASE (DECREASE) IN CASH AND CASH EQUIVALENTS 34,343 2,996)( 31,347
CASH, BEGINNING 38,464 2,996 41,460
CASH, ENDING 72,807$ -$ 72,807$
RECONCILIATION OF OPERATING INCOME (LOSS) TO NET CASH PROVIDED (USED) BY OPERATING ACTIVITIES Operating income (loss) 28,604 20,571)( 8,033 Adjustments to reconcile operating income to net cash provided (used) by operating activities: Cash flows reported in other categories: Depreciation expense 4,969 - 4,969 Change in assets and liabilities: Receivables, net 398 - 398 Due from other funds 12,230 - 12,230 Inventories 12,642)( - 12,642)( Accounts and other payables 15,060 5,809)( 9,251 Due to other funds - 340 340
Accrued wages payable 616 - 616
Net cash provided (used) by operating activities 49,235$ 26,040)$( 23,195$
HAYS CONSOLIDATED INDEPENDENT SCHOOL DISTRICTCOMBINING STATEMENT OF CASH FLOWS
INTERNAL SERVICE FUNDSFOR THE YEAR ENDED AUGUST 31, 2012
64

NONMAJOR ENTERPRISE FUNDS School Based Health Clinic – Health care clinic for students of the District. District Wide Child Care – Provide childcare services for children of school district employees at various District campuses. Community Education – Provides a range of quality, affordable educational opportunities to fulfill personal and practical aspirations for community members.

EXHIBIT H-6
719 727 748 TotalNonmajor
School Based District Wide Community EnterpriseHealth Clinic Child Care Education Funds
ASSETS Current assets: Cash and cash equivalents 61,271$ 373,671$ 2,415$ 437,357$ Other receivables 342 6,720 - 7,062
Total assets 61,613 380,391 2,415 444,419
LIABILITIES AND FUND BALANCES Current liabilities: Accounts payable 804 1,921 82 2,807 Accrued wages payable - 42,639 - 42,639
Total liabilities 804 44,560 82 45,446
NET ASSETS Unrestricted net assets 60,809 335,831 2,333 398,973
Total net assets 60,809$ 335,831$ 2,333$ 398,973$
HAYS CONSOLIDATED INDEPENDENT SCHOOL DISTRICTCOMBINING STATEMENT OF NET ASSETS
NONMAJOR ENTERPRISE FUNDSAUGUST 31, 2012
65

EXHIBIT H-7
719 727 748 TotalNonmajor
School Based District Wide Community EnterpriseHealth Clinic Child Care Education Funds
REVENUES Local and intermediate sources 20,299$ 1,258,656$ 34,766$ 1,313,721$
Total operating revenues 20,299 1,258,656 34,766 1,313,721
OPERATING EXPENSES Payroll costs - 1,045,812 7,131 1,052,943 Professional and contracted services 13,644 20,040 20,619 54,303 Supplies and materials 1,827 32,008 1,891 35,726 Other operating costs 4,554 721 2,794 8,069
Total operating expenses 20,025 1,098,581 32,435 1,151,041
OPERATING INCOME 274 160,075 2,331 162,680
TOTAL NET ASSETS, BEGINNING 60,535 175,756 2 236,293
TOTAL NET ASSETS, ENDING 60,809$ 335,831$ 2,333$ 398,973$
HAYS CONSOLIDATED INDEPENDENT SCHOOL DISTRICTCOMBINING STATEMENT OF REVENUES, EXPENSES
AND CHANGES IN FUND NET ASSETSNONMAJOR ENTERPRISE FUNDS
FOR THE YEAR ENDED AUGUST 31, 2012
66

EXHIBIT H-8
719 727 748 Total
School Based District Wide Community Enterprise
Health Clinic Child Care Education Funds
CASH FLOWS FROM OPERATING ACTIVITIES Receipts from customers 19,957$ 1,255,419$ 34,766$ 1,310,142$ Payments to suppliers 15,214)( 50,525)( 22,428)( 88,167)( Payments to employees - 1,066,354)( 7,131)( 1,073,485)(
Other receipts (payments) 4,554)( 721)( 2,794)( 8,069)(
Net cash provided by operating activities 189 137,819 2,413 140,421
NET INCREASE IN CASH AND CASH EQUIVALENTS 189 137,819 2,413 140,421
CASH, BEGINNING 61,082 235,852 2 296,936
CASH, ENDING 61,271$ 373,671$ 2,415$ 437,357$
RECONCILIATION OF OPERATING INCOME (LOSS) TO NET CASH PROVIDED (USED) BY OPERATING ACTIVITIES Operating income 274$ 160,075$ 2,331$ 162,680$ Change in assets and liabilities: Receivables, net 342)( 3,237)( - 3,579)( Accounts and other payables 257 1,523 82 1,862
Accrued wages payable - 20,542)( - 20,542)(
Net cash provided by operating activities 189$ 137,819$ 2,413$ 140,421$
NONMAJOR ENTERPRISE FUNDSFOR THE YEAR ENDED AUGUST 31, 2012
HAYS CONSOLIDATED INDEPENDENT SCHOOL DISTRICTCOMBINING STATEMENT OF CASH FLOWS
67

THIS PAGE LEFT BLANK INTENTIONALLY

REQUIRED TEA SCHEDULES

1 2 3 10 20Net Assessed/
Appraised Beginning CurrentLast Ten Years Ended Value for School Balance Year'sAugust 31, Maintenance Debt Service Tax Purpose 09/01/11 Total Levy
2003 and prior years Various Various Various 523,069$ -$
2004 1.368200 0.361300 1,781,001,119 89,779 -
2005 1.433200 0.361300 1,965,325,861 117,885 -
2006 1.485000 0.391300 2,236,970,232 69,044 -
2007 1.356700 0.421300 2,586,447,002 76,860 -
2008 1.040000 0.421300 2,911,022,745 263,776 -
2009 1.040000 0.421300 3,401,651,203 8,099)( -
2010 1.040000 0.421300 3,620,543,198 526,901 -
2011 1.040000 0.421300 3,662,838,637 655,045 -
2012 1.040000 0.421300 3,791,892,082 - 55,410,919
1000 Totals 2,314,260$ 55,410,919$
Tax Rates
HAYS CONSOLIDATED INDEPENDENT SCHOOL DISTRICTSCHEDULE OF DELINQUENT TAXES RECEIVABLE
FISCAL YEAR ENDED AUGUST 31, 2012
68
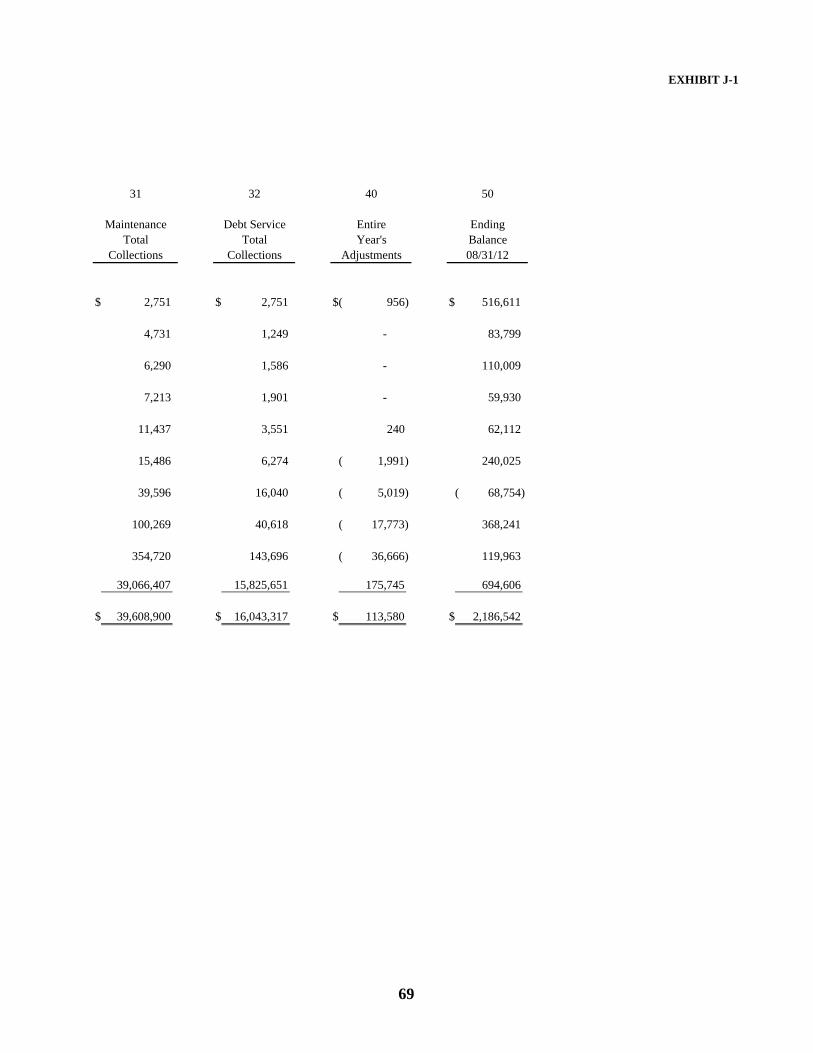
EXHIBIT J-1
31 32 40 50
Maintenance Debt Service Entire EndingTotal Total Year's Balance
Collections Collections Adjustments 08/31/12
2,751$ 2,751$ 956)$( 516,611$
4,731 1,249 - 83,799
6,290 1,586 - 110,009
7,213 1,901 - 59,930
11,437 3,551 240 62,112
15,486 6,274 1,991)( 240,025
39,596 16,040 5,019)( 68,754)(
100,269 40,618 17,773)( 368,241
354,720 143,696 36,666)( 119,963
39,066,407 15,825,651 175,745 694,606
39,608,900$ 16,043,317$ 113,580$ 2,186,542$
69

EXHIBIT J-2
FUNCTION 41 AND RELATED FUNCTION 53 - GENERAL ADMINISTRATION, 99 - APPRAISAL DISTRICT COST1 2 3 4 5 6 7
(702) (703) (701) (750) (720) (other)Account Account School Tax Supt's Indirect DirectNumber Name Board Collections Office Cost Cost Miscellaneous Total
611X-6146 PAYROLL COSTS -$ -$ 327,467$ 1,703,972$ 1,312,439$ 185,009$ 3,528,887$ 6149 Fringe benefits - - - - - - - 6149 Fringe benefits - - - - - - - 6211 Legal services - - - 100,976 - - 100,976 6212 Audit services - - - 30,600 - - 30,600 6213 Tax appraisal and collection - 564,565 - - - - 564,565 621X Other professional services - - - - - - - 6220 Tuition and transfer
payments - - - - - - - 6230 Education service centers - - - - - - - 6240 Contractor maintenance
and repair - - - 65,570 152,115 - 217,685 6250 Utilities - - - - - - - 6260 Rentals - - 10,166 17,507 23 - 27,696 6290 Miscellaneous contractors 12,769 - - 123,931 194,291 - 330,991 6320 Textbooks and reading 226 - - 16,100 287 - 16,613 6330 Testing materials - - - - - - -
63XX Other supplies materials 12,549 - 1,553 73,296 95,667 - 183,065 6410 Travel, subsistence, stipends 13,592 - 3,389 24,878 9,382 1,142 52,383 6420 Insurance and bonding costs - - - 42,501 - - 42,501 6430 Election costs - - - - - - - 6490 Miscellaneous operating 35,224 1,004 948 44,633 7,492 - 89,301 6500 Debt service - - - - - - -
6600 Capital outlay - - - 13,454 38,182 - 51,636
6000 Total 74,360$ 565,569$ 343,523$ 2,257,418$ 1,809,878$ 186,151$ 5,236,899$
Total expenditures/expenses for General and Special Revenue Funds 9 127,334,305$
Less: Deductions of unallowable costsFISCAL YEAR
Total capital outlay (6600) 10 4,787,979$ Total debt and lease (6500) 11 340,391 Plant maintenance (Function 51, 6100-6400) 12 12,724,067 Food (Function 35, 6341 and 6499) 13 2,697,305 Stipends (6413) 14 -
Column 4 (above) - Total indirect cost 2,257,418
Subtotal 22,807,160
Net allowed direct cost 104,527,145
CUMULATIVETotal cost of buildings before depreciation (1520) 15 339,672,874 Historical cost of buildings over 50 years old 16 4,631,527 Amount of federal money in building cost (net of #16) 17 - Total cost of furniture and equipment before depreciation (1530 & 1540) 18 22,272,415 Historical cost of furniture and equipment over 16 years old 19 308,410 Amount of federal money in furniture and equipment (net of #19) 20 -
(8) Note A - 1,643,339$ in Function 53 expenditures are included in this report on administrative costs.564,597$ in Function 99, expenditures for appraisal district costs are included in this report on
administrative costs.
AUGUST 31, 2012
HAYS CONSOLIDATED INDEPENDENT SCHOOL DISTRICTSCHEDULE OF EXPENDITURES FOR COMPUTATIONS
OF INDIRECT COST FOR 2012 - 2013GENERAL AND SPECIAL REVENUE FUNDS
70

EXHIBIT J-4
Actual Variance with
Amounts Final Budget
(Budgetary Positive
Original Final Basis) (Negative)
REVENUES5700 Local and intermediate sources 2,703,689$ 2,703,689$ 2,605,210$ 98,479)$( 5800 State program revenues 40,743 40,743 44,252 3,509
5900 Federal program revenues 4,020,508 4,020,508 4,541,830 521,322
5020 Total revenues 6,764,940 6,764,940 7,191,292 426,352
EXPENDITURES Current:
0035 Food service 6,764,940 7,764,940 7,483,630 281,310
6030 Total expenditures 6,764,940 7,764,940 7,483,630 281,310
1200 NET CHANGE IN FUND BALANCES - 1,000,000)( 292,338)( 707,662
0100 FUND BALANCES, BEGINNING 1,731,455 1,731,455 1,731,455 -
3000 FUND BALANCES, ENDING 1,731,455$ 731,455$ 1,439,117$ 707,662$
Budgeted Amounts
HAYS CONSOLIDATED INDEPENDENT SCHOOL DISTRICTBUDGETARY COMPARISON SCHEDULE - NONMAJOR FUND
CHILD NUTRITION PROGRAM FUNDAUGUST 31, 2012
71

EXHIBIT J-5
Actual Variance with
Amounts Final Budget
(Budgetary Positive
Original Final Basis) (Negative)
REVENUES5700 Local and intermediate sources 16,138,867$ 16,138,867$ 16,194,405$ 55,538$
5800 State program revenues 6,213,546 6,213,545 6,318,566 105,021
5020 Total revenues 22,352,413 22,352,412 22,512,971 160,559
EXPENDITURES Current:
0071 Principal on long-term debt 5,260,869 5,260,869 11,405,000 6,144,131)( 0072 Interest on long-term debt 20,336,440 20,336,440 13,875,895 6,460,545
0073 Bond issuance costs and fees 10,000 10,000 249,914 239,914)(
6030 Total expenditures 25,607,309 25,607,309 25,530,809 76,500
1100 EXCESS (DEFICIENCY) OF REVENUES
OVER (UNDER) EXPENDITURES 3,254,896)( 3,254,897)( 3,017,838)( 237,059
OTHER FINANCING SOURCES (USES)7901 Refunding bonds issued - - 16,540,000 16,540,000 7915 Transfers in - 3,000,000 3,000,000 - 7916 Premium or discount on issuance of bonds - - 2,387,320 2,387,320
8940 Payment to bond refunding escrow agent - - 18,866,773)( 18,866,773)(
7080 Total other financing sources (uses) - 3,000,000 3,060,547 60,547
1200 NET CHANGE IN FUND BALANCES 3,254,896)( 254,897)( 42,709 297,606
0100 FUND BALANCES, BEGINNING 3,870,366 3,870,366 3,870,366 -
3000 FUND BALANCES, ENDING 615,470$ 3,615,469$ 3,913,075$ 297,606$
HAYS CONSOLIDATED INDEPENDENT SCHOOL DISTRICTBUDGETARY COMPARISON SCHEDULE
DEBT SERVICE FUNDAUGUST 31, 2012
Budgeted Amounts
72

THIS PAGE LEFT BLANK INTENTIONALLY
STATISTICAL SECTION

STATISTICAL SECTION This part of the District statistical comprehensive annual financial report presents detailed information as a context for understanding the information in the financial statements, note disclosures, and required supplementary information. The statistical section includes 19 schedules. These schedules fall within the following categories: Contents Page Financial Trend Data 73
These schedules contain trend information on how the District’s financial performance and well-being have changed over time.
Revenue Capacity Data 87
These schedules contain information on the District’s most significant local revenue source, the property tax.
Debt Capacity Data 92
These schedules present information to help assess the affordability of the District’s current levels of outstanding debt and the District’s ability to issue additional debt in the future.
Demographic and Economic Information 96
These schedules offer demographic and economic indicators to help understand the environment within which the District’s financial activities take place.
Operating Information 101
These schedules contain service and infrastructure data to help the reader understand how the information in the District’s financial report relates to the service the District provides and the activities it performs.
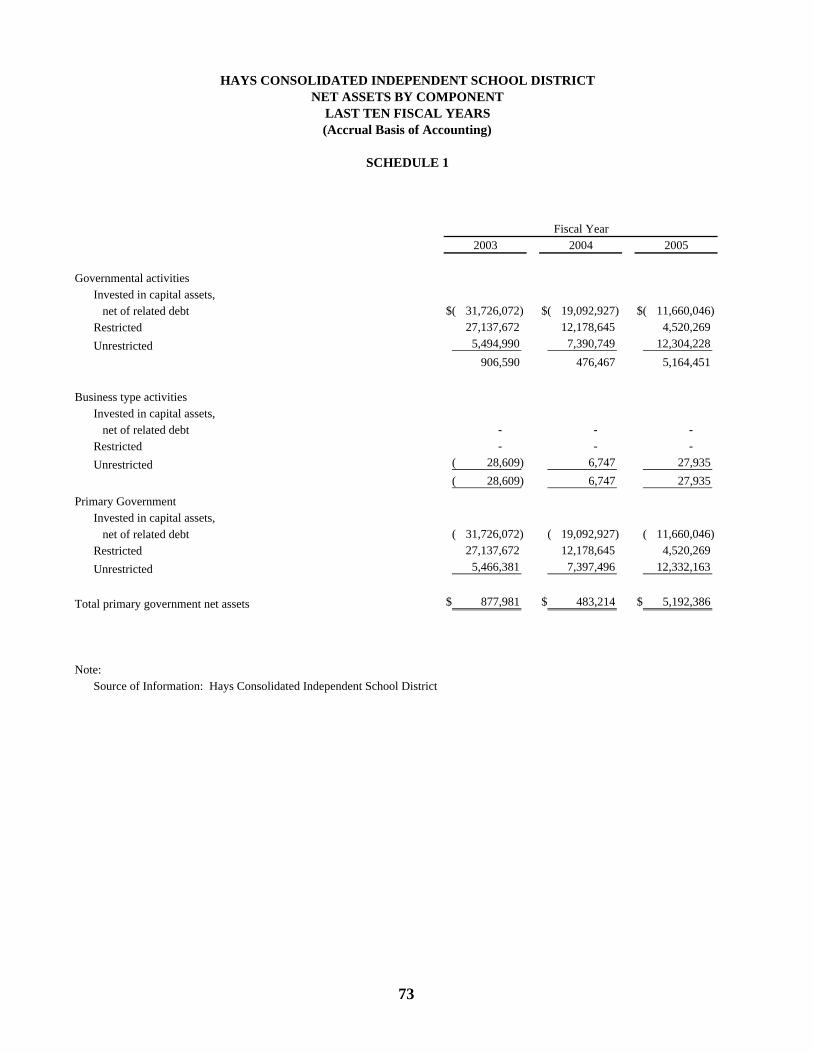
2003 2004 2005
Governmental activitiesInvested in capital assets, net of related debt 31,726,072)$( 19,092,927)$( 11,660,046)$(
Restricted 27,137,672 12,178,645 4,520,269
Unrestricted 5,494,990 7,390,749 12,304,228
906,590 476,467 5,164,451
Business type activitiesInvested in capital assets, net of related debt - - -
Restricted - - -
Unrestricted 28,609)( 6,747 27,935
28,609)( 6,747 27,935
Primary GovernmentInvested in capital assets, net of related debt 31,726,072)( 19,092,927)( 11,660,046)(
Restricted 27,137,672 12,178,645 4,520,269
Unrestricted 5,466,381 7,397,496 12,332,163
Total primary government net assets 877,981$ 483,214$ 5,192,386$
Note:
Source of Information: Hays Consolidated Independent School District
SCHEDULE 1
Fiscal Year
HAYS CONSOLIDATED INDEPENDENT SCHOOL DISTRICTNET ASSETS BY COMPONENT
LAST TEN FISCAL YEARS(Accrual Basis of Accounting)
73

2006 2007 2008 2009 2010 2011 2012
10,615,784)$( 9,955,381)$( 23,956,161)$( 25,448,406)$( 23,127,605)$( 21,042,851)$( 26,435,336)$( 6,296,418 4,544,331 199,357 573,209 1,202,998 5,465,331 5,233,663
12,565,606 15,161,472 37,791,293 38,907,787 30,415,110 27,076,884 35,228,600
8,246,240 9,750,422 14,034,489 14,032,590 8,490,503 11,499,364 14,026,927
- - - - - - - - - - - - - -
81,126 114,727 142,430 184,160 212,915 236,293 398,973
81,126 114,727 142,430 184,160 212,915 236,293 398,973
10,615,784)( 9,955,381)( 2,307,570 10,685,595 3,222,453 21,042,851)( 26,435,336)( 6,296,418 4,544,331 199,357 573,209 1,202,998 5,465,331 5,233,663
12,646,732 15,276,199 11,669,992 2,957,946 4,277,967 27,313,177 35,627,573
8,327,366$ 9,865,149$ 14,176,919$ 14,216,750$ 8,703,418$ 11,735,657$ 14,425,900$
Fiscal Year
74

2003 2004 2005ExpensesGovernmental activities:
Instruction 36,136,144$ 36,202,052$ 41,489,028$
Instruction resources and media services 1,166,049 1,212,829 1,332,404
Curriculum and staff development 717,389 741,324 787,500
Instructional leadership 824,640 776,013 753,070
School leadership 3,188,084 3,233,670 3,702,641
Guidance, counseling and evaluation services 2,600,435 2,700,874 2,930,926
Social work services 874,336 972,856 943,639
Health services 922,554 1,016,128 940,825
Student (pupil) transportation 4,258,001 4,406,403 6,076,399
Food services 2,602,642 2,962,492 3,490,258
Cocurricular/extracurricular activities 1,188,788 1,402,853 1,718,562
General administration 2,511,958 2,137,724 2,369,053
Plant maintenance and operations 6,492,731 6,775,631 7,629,338
Security and monitoring services 161,121 356,750 458,230
Data processing services 963,633 1,062,114 1,066,515
Community services 284,785 311,100 297,441
Debt Service - Interest on long-term debt 9,232,589 10,324,202 7,457,462
Debt Service - Bond issuance cost and fees 185,103 37,821 498,718
Facilities acquisition and construction - 2,849,212 -
Payments to fiscal agent/SSA - - 143,912
Other intergovernmental charges - - -
Total governmental activities expenses 74,310,982 79,482,048 84,085,921 Business-type activities:
Childcare expenses 269,308 309,243 348,770
All remaining EF funds combined - - -
Total business-type activities expenses 269,308 309,243 348,770
Total primary government expenses 74,580,290 79,791,291 84,434,691
Program RevenuesGovernmental activities:
Charges for services
Instruction 167,825 1,007,595 525,504
Health services - - -
Food services 1,430,817 718,420 1,419,110
Cocurricular/extracurricular activities 145,006 206,951 204,512
General administration - - -
Plant maintenance and operations - - 57,799
Community services - - -
Operating grants and contributions 11,172,167 10,003,141 10,925,498
Total governmental activities revenues 12,915,815 11,936,107 13,132,423
Business-type activities:
Childcare 238,988 344,600 369,958
School-based Health Clinic - - -
Total business-type activities revenues 238,988 344,600 369,958
Total primary government program revenues 13,154,803$ 12,280,707$ 13,502,381$
Note:
Source of Information: Hays Consolidated Independent School District
Fiscal Year
HAYS CONSOLIDATED INDEPENDENT SCHOOL DISTRICTEXPENSES, PROGRAM REVENUES AND NET (EXPENSE)/REVENUE
LAST TEN FISCAL YEARS(Accrual Basis of Accounting)
SCHEDULE 2
75

2006 2007 2008 2009 2010 2011 2012
47,675,482$ 56,522,152$ 65,519,854$ 70,698,911$ 80,618,607$ 78,585,619$ 77,074,761$
1,993,106 1,814,280 1,945,468 2,405,631 2,566,676 2,302,667 2,156,431
1,184,792 1,193,496 1,631,962 1,480,294 1,489,355 1,438,232 1,379,454
840,654 884,280 1,021,230 1,206,655 1,608,192 1,792,866 1,790,933
4,372,678 4,963,450 5,597,283 5,881,895 6,918,077 7,043,969 7,225,406
2,701,353 3,011,415 3,369,494 3,591,055 4,091,883 4,354,786 4,114,542
432,158 162,647 143,600 276,329 294,564 271,138 147,551
1,037,442 1,147,922 1,392,086 1,472,429 1,616,042 1,621,964 1,706,732
5,938,352 6,509,510 8,185,517 7,774,751 9,044,934 8,567,071 9,487,052
3,807,573 4,841,647 5,398,699 5,489,368 6,187,199 6,638,266 7,571,737
1,903,644 2,321,266 2,674,290 2,884,748 3,003,572 2,850,112 2,873,827
2,760,690 2,805,515 2,991,317 2,796,386 2,951,010 3,000,312 3,192,563
9,244,488 10,421,098 12,200,011 12,488,161 14,223,697 14,304,982 14,210,868
613,700 756,268 846,175 939,220 1,061,627 1,041,113 1,055,392
1,902,403 1,647,012 1,791,751 2,231,685 2,626,280 2,531,665 2,379,850
328,163 322,546 472,218 421,358 357,718 224,209 268,038
11,092,367 12,285,423 12,730,248 16,943,725 16,317,433 15,951,849 15,253,570
47,108 59,035 123,539 10,184 6,560 4,200 3,450
- 3,368 3,369 - - - -
129,471 91,045 115,284 166,125 134,505 141,513 17,947
- - - 514,226 534,306 543,641 564,597
98,005,624 111,763,375 128,153,395 139,673,136 155,652,237 153,210,174 152,474,701
358,118 648,796 760,167 1,003,147 1,178,032 1,200,777 1,098,581
10,518 16,465 22,638 26,325 22,511 36,656 52,460
368,636 665,261 782,805 1,029,472 1,200,543 1,237,433 1,151,041
98,374,260 112,428,636 128,936,200 140,702,608 156,852,780 154,447,607 153,625,742
431,572 458,879 576,449 806,242 777,298 519,260 602,354
- - - - - - -
1,640,764 1,910,754 2,156,296 2,354,933 2,276,444 2,588,377 2,603,301
235,385 266,141 259,194 274,927 255,103 287,851 390,615
- - - - - - -
84,067 108,664 156,713 199,898 174,706 165,371 245,288
- - - - - - -
10,780,092 11,989,104 13,761,277 15,048,930 28,105,630 29,192,386 -
13,171,880 14,733,542 16,909,929 18,684,930 31,589,181 32,753,245 3,841,558
389,449 673,257 778,170 1,044,857 1,201,179 1,225,762 1,258,656
32,378 25,605 32,338 26,345 28,119 35,049 55,065
421,827 698,862 810,508 1,071,202 1,229,298 1,260,811 1,313,721
13,593,707$ 15,432,404$ 17,720,437$ 19,756,132$ 32,818,479$ 34,014,056$ 5,155,279$
Fiscal Year
76

2003 2004 2005
Net (Expense)/RevenueGovernmental activities 61,395,167)$( 67,545,941)$( 70,953,498)$( Business-type activities 30,320)( 35,357 21,188
Total primary government net expense 61,425,487)( 67,510,584)( 70,932,310)(
General Revenues and Other Changes in Net Assets Governmental activities:
TaxesProperty taxes, levied for general purposes 19,655,939 24,377,242 28,989,391 Property taxes, levied for debt service 5,865,555 6,505,873 7,359,527
Grants and contributions not restricted 32,319,163 32,371,753 32,521,524 Investment earnings 2,310,487 682,628 1,532,226 Miscellaneous 2,664,872 2,575,996 5,238,815 Transfers - - - Special item - - -
Total government activities 62,816,016 66,513,492 75,641,483
Change in Net AssetsGovernmental activities 1,420,849 1,032,449)( 4,687,985 Business-type activities 30,320)( 35,357 21,188
Total primary government 1,390,529$ 997,092)$( 4,709,173$
Note:
Source of Information: Hays Consolidated Independent School District
Fiscal Year
HAYS CONSOLIDATED INDEPENDENT SCHOOL DISTRICTGENERAL REVENUES AND TOTAL CHANGE IN NET ASSETS
LAST TEN FISCAL YEARS(Accrual Basis of Accounting)
SCHEDULE 3
77
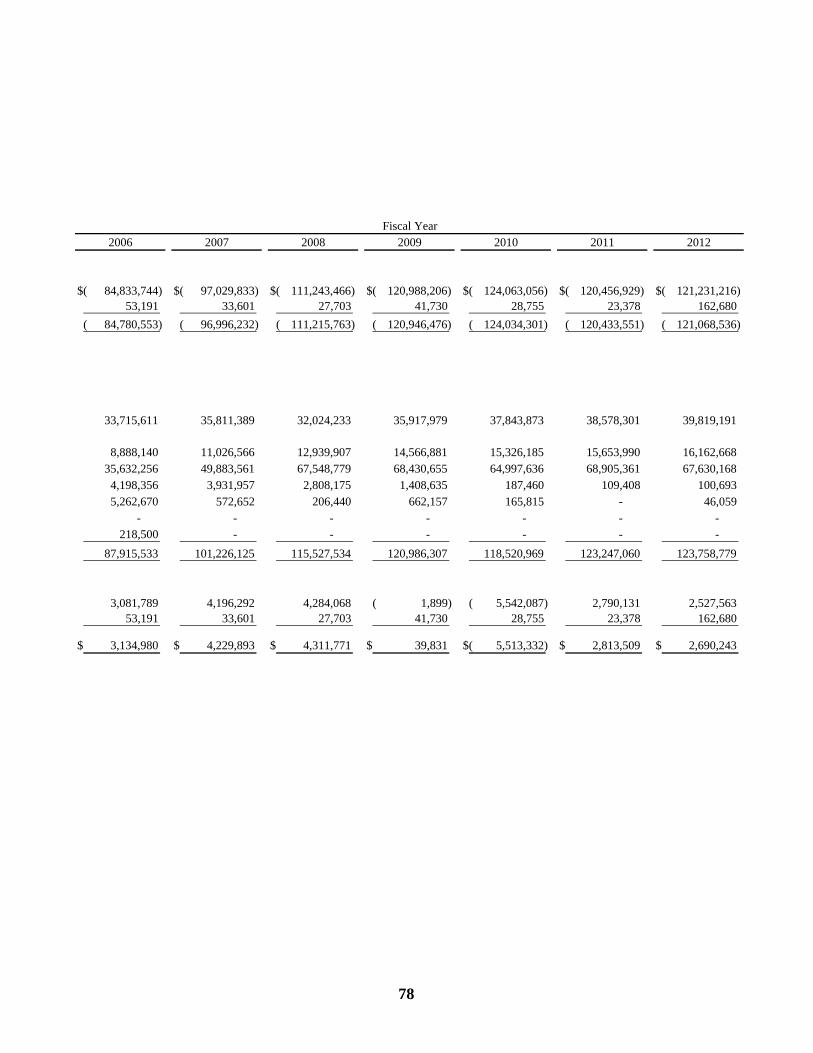
2006 2007 2008 2009 2010 2011 2012
84,833,744)$( 97,029,833)$( 111,243,466)$( 120,988,206)$( 124,063,056)$( 120,456,929)$( 121,231,216)$( 53,191 33,601 27,703 41,730 28,755 23,378 162,680
84,780,553)( 96,996,232)( 111,215,763)( 120,946,476)( 124,034,301)( 120,433,551)( 121,068,536)(
33,715,611 35,811,389 32,024,233 35,917,979 37,843,873 38,578,301 39,819,191
8,888,140 11,026,566 12,939,907 14,566,881 15,326,185 15,653,990 16,162,668 35,632,256 49,883,561 67,548,779 68,430,655 64,997,636 68,905,361 67,630,168
4,198,356 3,931,957 2,808,175 1,408,635 187,460 109,408 100,693 5,262,670 572,652 206,440 662,157 165,815 - 46,059
- - - - - - - 218,500 - - - - - -
87,915,533 101,226,125 115,527,534 120,986,307 118,520,969 123,247,060 123,758,779
3,081,789 4,196,292 4,284,068 1,899)( 5,542,087)( 2,790,131 2,527,563 53,191 33,601 27,703 41,730 28,755 23,378 162,680
3,134,980$ 4,229,893$ 4,311,771$ 39,831$ 5,513,332)$( 2,813,509$ 2,690,243$
Fiscal Year
78

2003 2004 2005
General FundReserved -$ -$ -$ Unreserved, designated 517,682 622,840 2,478,043 Unreserved 3,997,340 5,884,537 9,225,682 Committed - - - Assigned - - - Unassigned - - -
Total general fund 4,515,022 6,507,377 11,703,725
All Other Governmental FundsUnreserved, reported in: Special revenue funds 239,128 252,442 330,316 Capital projects funds 23,944,423 7,181,843 73,018,413
Debt service funds 3,432,891 4,987,235 4,609,514 Restricted:
Grant funds - - - Capital acquisition and contractual obligations - - - Debt service funds - - -
Assigned:Construction - - -
Total all other governmental funds 27,616,442 12,421,520 77,958,243
Total Governmental Funds 32,131,464$ 18,928,897$ 89,661,968$
Note:
* 2011 was the first year of implementation of GASB 54. The 2011 column includes the new fund balance categories.
Source of Information: Hays Consolidated Independent School District
Fiscal Year
HAYS CONSOLIDATED INDEPENDENT SCHOOL DISTRICT
LAST TEN FISCAL YEARS(Modified Accrual Basis of Accounting)
FUND BALANCES - GOVERNMENTAL FUNDS
SCHEDULE 4
79

2006 2007 2008 2009 2010 2011* 2012
-$ -$ -$ -$ -$ -$ -$ 731,095 876,341 1,109,350 1,029,801 1,238,808 - -
12,767,719 14,148,083 17,155,383 21,068,679 23,945,354 - - - - - - - 930,000 1,320,000 - - - - - 1,588,920 3,205,862 - - - - - 29,001,609 29,564,350
13,498,814 15,024,424 18,264,733 22,098,480 25,184,162 31,520,529 34,090,212
409,056 177,721 199,357 573,209 1,202,998 - - 26,887,804 39,707,674 88,991,475 53,417,992 17,555,175 - -
4,725,794 4,474,866 8,642,258 6,577,117 3,746,700 - -
- - - - - 1,731,455 1,439,117 - - - - - 13,337,163 5,520,043 - - - - - 3,870,366 3,913,075
- - - - - 676,310 677,114
32,022,654 44,360,261 97,833,090 60,568,318 22,504,873 19,615,294 11,549,349
45,521,468$ 59,384,685$ 116,097,823$ 82,666,798$ 47,689,035$ 51,135,823$ 45,639,561$
Fiscal Year
80

2003 2004 2005
Local and intermediate sources 32,218,776$ 35,907,788$ 45,417,787$
State programs revenues 37,846,524 35,961,626 37,004,532
Federal programs revenues 5,643,156 6,411,409 6,621,036
Total Revenues 75,708,456$ 78,280,823$ 89,043,355$
Fiscal year-end is August 31.
This table includes all governmental fund types of the Hays Consolidated Independent School District.
Revenue classifications are in accordance with those prescribed by the Texas Education Agency.
SCHEDULE 5
Fiscal Year
HAYS CONSOLIDATED INDEPENDENT SCHOOL DISTRICT
LAST TEN FISCAL YEARS(Modified Accrual Basis of Accounting)
CHANGES IN FUND BALANCES - GOVERNMENTAL FUNDS
81
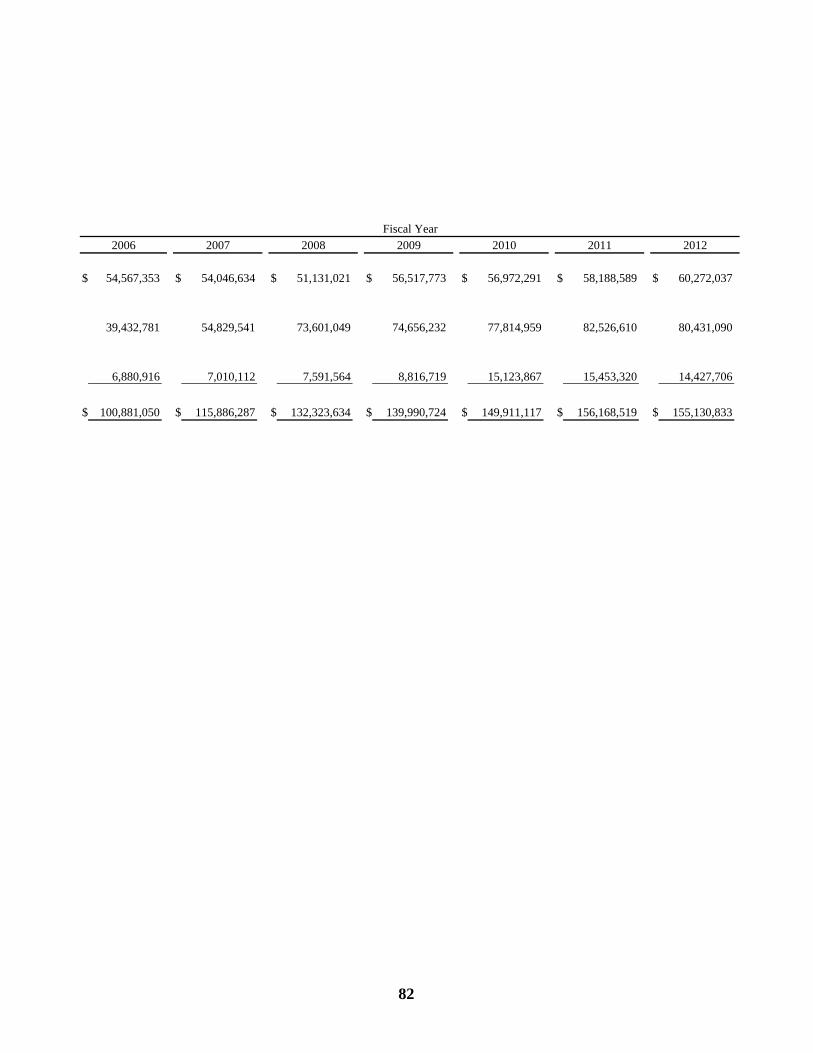
2006 2007 2008 2009 2010 2011 2012
54,567,353$ 54,046,634$ 51,131,021$ 56,517,773$ 56,972,291$ 58,188,589$ 60,272,037$
39,432,781 54,829,541 73,601,049 74,656,232 77,814,959 82,526,610 80,431,090
6,880,916 7,010,112 7,591,564 8,816,719 15,123,867 15,453,320 14,427,706
100,881,050$ 115,886,287$ 132,323,634$ 139,990,724$ 149,911,117$ 156,168,519$ 155,130,833$
Fiscal Year
82

2003 2004 2005
Expenditures by FunctionInstruction 33,548,943$ 33,968,118$ 38,077,753$ Instruction resources and media services 1,088,880 1,146,606 1,239,385 Curriculum and staff development 717,389 741,324 787,500 Instructional leadership 824,640 776,625 751,276 School leadership 2,969,464 3,044,827 3,426,339 Guidance, counseling and evaluation services 2,507,104 2,622,669 2,806,731 Social work services 874,336 995,665 943,639 Health services 888,350 986,620 899,343 Student (pupil) transportation 5,676,923 5,122,384 5,351,534 Food services 2,594,374 2,962,422 3,475,753 Cocurricular/extracurricular activities 1,159,155 1,367,778 1,662,538 General administration 2,492,519 2,135,674 2,336,788 Plant maintenance and operations 6,235,064 6,569,949 7,537,221 Security and monitoring services 141,441 340,777 430,555 Data processing services 891,712 953,111 911,165 Community services 284,785 311,100 297,441 Debt service - principal on long-term debt 5,670,094 5,568,167 5,943,422 Debt service - interest on long-term debt 5,282,556 5,828,403 7,037,093 Debt service - bond issuance cost and fees 185,103 2,234 1,890,169 Facilities acquisition and construction 46,273,606 18,938,937 20,672,843 Payments to fiscal agent/members of SSA - - 143,912 Other intergovernmental charges - - -
Total Expenditures by Function 120,306,438$ 94,383,390$ 106,622,400$
Debt service as a % of noncapital expenditures 15.17% 14.82% 15.15%
Note:
*
HAYS CONSOLIDATED INDEPENDENT SCHOOL DISTRICTCHANGES IN FUND BALANCES - GOVERNMENTAL FUNDS
LAST TEN FISCAL YEARS(Modified Accrual Basis of Accounting)
(Continued)SCHEDULE 5
Fiscal Year
The amount of capital outlay used to calculate the ratio is shown in the Reconciliation of Government-wide and Fund FinancialStatements, Note II. B.
83

2006 2007 2008 2009 2010 2011 2012
43,568,627$ 48,797,017$ 60,549,270$ 64,163,970$ 73,832,563$ 72,075,839$ 70,574,682$ 1,868,062 1,679,550 1,795,833 2,231,125 2,372,092 2,106,736 1,960,469 1,184,792 1,151,293 1,601,454 1,453,841 1,446,346 1,395,223 1,336,445
840,654 884,280 1,021,230 1,205,730 1,607,267 1,791,941 1,790,008 4,001,323 4,578,804 5,187,503 5,414,333 6,402,817 6,524,056 6,705,384 2,536,035 2,845,649 3,200,401 3,402,453 3,887,257 4,147,729 3,907,427
432,158 162,647 143,600 276,329 294,564 271,138 147,551 983,041 1,082,928 1,319,297 1,387,725 1,521,761 1,527,148 1,611,904
6,689,688 6,950,235 9,541,571 8,436,839 8,756,288 7,199,099 8,107,454 3,828,875 4,836,216 5,429,225 5,490,931 6,175,266 6,620,780 7,552,630 1,834,677 2,211,656 2,639,903 2,783,128 2,868,053 2,723,082 2,813,710 2,718,923 2,789,896 2,949,207 2,785,878 2,924,289 2,933,490 3,028,963 9,414,695 10,539,593 12,212,953 12,783,620 13,475,420 13,493,434 13,068,866
578,224 718,363 806,795 898,504 1,016,818 995,739 1,012,142 2,067,550 1,388,413 1,554,392 1,981,694 2,331,190 2,309,567 2,153,900
328,163 322,546 472,218 421,358 357,718 224,209 268,038 5,651,753 7,879,808 9,490,981 9,310,496 9,290,337 9,812,519 11,721,051
10,005,345 11,038,630 11,301,713 15,295,233 14,740,425 14,332,942 13,900,236 47,108 431,363 815,414 10,184 6,560 4,200 249,914
46,579,386 38,127,352 35,439,576 33,031,823 30,965,450 1,785,471 8,202,465 129,471 91,045 115,284 166,125 134,505 141,513 17,947
- - - 514,226 534,306 543,641 564,597
145,288,550$ 148,507,284$ 167,587,820$ 173,445,545$ 184,941,292$ 152,959,496$ 160,695,783$
16.36% 17.00% 16.14% 17.85% 15.71% * 15.97% * 16.76% *
Fiscal Year
84
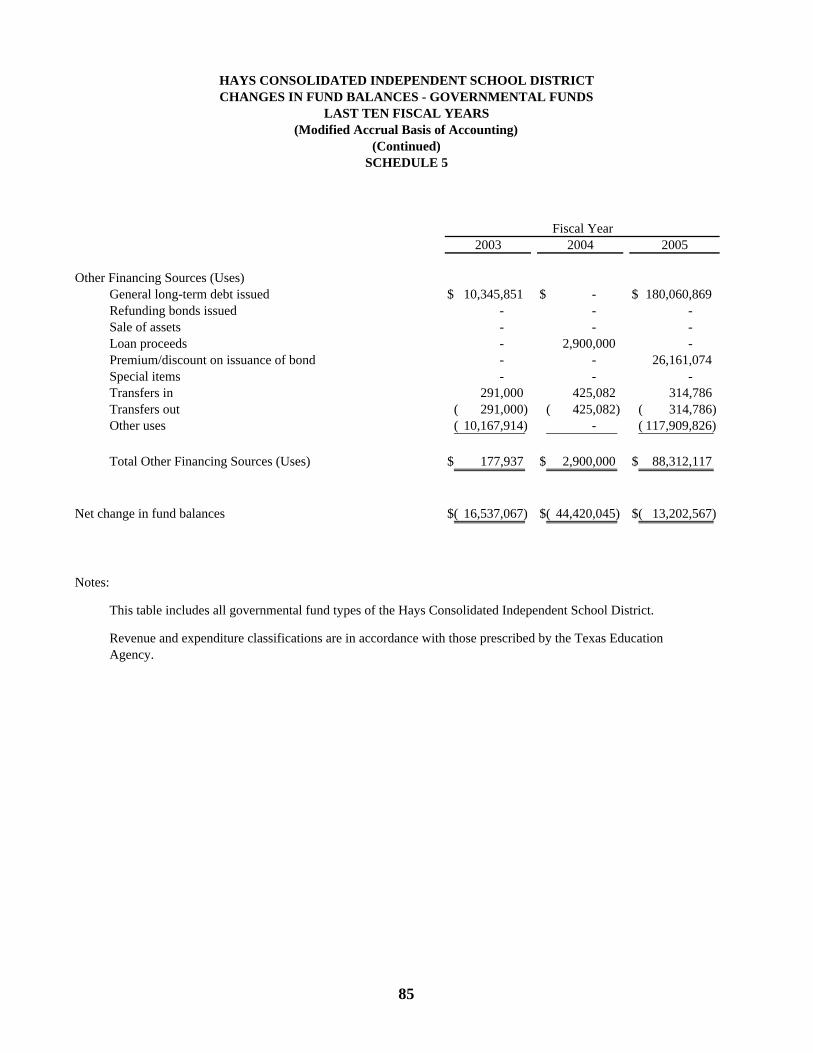
2003 2004 2005
Other Financing Sources (Uses)General long-term debt issued 10,345,851$ -$ 180,060,869$ Refunding bonds issued - - - Sale of assets - - - Loan proceeds - 2,900,000 - Premium/discount on issuance of bond - - 26,161,074 Special items - - - Transfers in 291,000 425,082 314,786 Transfers out 291,000)( 425,082)( 314,786)( Other uses 10,167,914)( - 117,909,826)(
Total Other Financing Sources (Uses) 177,937$ 2,900,000$ 88,312,117$
Net change in fund balances 16,537,067)$( 44,420,045)$( 13,202,567)$(
Notes:
This table includes all governmental fund types of the Hays Consolidated Independent School District.
Revenue and expenditure classifications are in accordance with those prescribed by the Texas EducationAgency.
Fiscal Year
HAYS CONSOLIDATED INDEPENDENT SCHOOL DISTRICTCHANGES IN FUND BALANCES - GOVERNMENTAL FUNDS
LAST TEN FISCAL YEARS(Modified Accrual Basis of Accounting)
(Continued)SCHEDULE 5
85

2006 2007 2008 2009 2010 2011 2012
-$ 46,300,000$ 86,700,000$ -$ -$ -$ -$ - - - - - - 16,540,000 - 11,336 - 58,334 52,412 19,035 8,141 - - - - - - - - 1,138,159 5,277,325 - - - 2,387,320
267,000 - - - - - - 386,104 4,004,840 646,465 467,788 533,907 3,033,907 3,000,000 386,104)( 4,004,840)( 646,465)( 502,326)( 533,907)( 3,033,907)( 3,000,000)(
- - - - - - 18,866,773)(
267,000$ 47,449,495$ 91,977,325$ 23,796$ 52,412$ 19,035$ 68,688$
70,733,072$ 44,140,500)$( 14,828,408$ 56,713,139$ 33,431,025)$( 3,228,058$ 5,496,262)$(
Fiscal Year
86

Total Total Exemptions Net Maintenance Interest Total
Fiscal Assessed and Taxable and Operations and Sinking DirectYear Value Freeze Value Rate Rate Rate
2003 1,534,790,781$ 18,006,084$ 1,516,784,697$ 1.2937$ 0.3863$ 1.6800$
2004 1,772,091,423 58,824,483 1,713,266,940 1.3682 0.3613 1.7295
2005 2,015,296,347 75,982,714 1,939,313,633 1.4332 0.3613 1.7945
2006 2,265,620,894 90,178,978 2,175,441,916 1.4850 0.3913 1.8763
2007 2,643,191,336 191,440,131 2,451,751,205 1.3567 0.4213 1.4613
2008 3,035,620,846 152,133,424 2,883,487,422 1.0400 0.4213 1.4613
2009 3,449,289,743 192,197,561 3,257,092,182 1.0400 0.4213 1.4613
2010 3,630,154,901 218,673,286 3,411,481,615 1.0400 0.4213 1.4613
2011 3,689,035,058 236,348,172 3,452,686,886 1.0400 0.4213 1.4613
2012 3,885,200,709 322,181,051 3,563,019,658 1.0400 0.4213 1.4613
Notes: Assessed Valuation for 2012 represents 9.5% personal property and 90.5% real/other property, before exemptions.
The major components of real property for 2012 are $1,398,570,702 of land and $2,977,596,457 of improvements before any exemptions.
A maintenance and operations tax rate may be set above $1.04 through a tax ratification election.
Source of Information: Hays Central Appraisal District, Caldwell Central Appraisal District, and Travis Central Appraisal District.
SCHEDULE 6
HAYS CONSOLIDATED INDEPENDENT SCHOOL DISTRICTTOTAL ASSESSED AND NET TAXABLE VALUE OF TAXABLE PROPERTY
LAST TEN FISCAL YEARS
87

THIS PAGE LEFT BLANK INTENTIONALLY

Hays Cons. Hays Cons. Hays Cons.Independent Independent Independent
School School School City City City City of CityFiscal District District District of of of Mountain ofYear M/O I & S Total Buda Kyle Hays City Niederwald
2003 1.2937$ 0.3863$ 1.68000$ 0.21990$ 0.35450$ 0.08200$ 0.10000$ N/A
2004 1.3682 0.3613 1.72950 0.16300 0.31900 0.07850 0.10000 0.30000$
2005 1.4332 0.3613 1.79450 0.16300 0.28710 0.08340 0.10000 0.30000
2006 1.4850 0.3913 1.87630 0.16700 0.27770 0.09060 0.10000 0.30000
2007 1.3567 0.4213 1.77800 0.18700 0.27070 0.09880 0.11000 0.30000
2008 1.0400 0.4213 1.46130 0.22500 0.37310 0.10740 0.11000 0.30000
2009 1.0400 0.4213 1.46130 0.22500 0.42400 0.10610 0.11000 0.29760
2010 1.0400 0.4213 1.46130 0.25760 0.41540 0.11600 0.11000 0.30000
2011 1.0400 0.4213 1.46130 0.26660 0.48450 0.11640 0.11000 0.29540
2012 1.0400 0.4213 1.46130 0.27130 0.52440 0.11640 0.11000 0.28750
* - Per $100 of assessed valuation.
A maintenance and operations tax rate may be set above $1.04 through tax ratification election.
N/A = not available
Source of Information: Hays County Tax Office, Caldwell County Tax Office and Travis County Tax Office
HAYS CONSOLIDATED INDEPENDENT SCHOOL DISTRICTPROPERTY TAX RATES * - DIRECT AND MAJOR OVERPLAPPING GOVERNMENTS
LAST TEN FISCAL YEARS
SCHEDULE 7
88

City City Austin North Haysof of Caldwell Hays Travis Community Greenhawe County South Buda Sunfield
San Marcos Uhland County County County College WICD #2 MUD #1 WICD #1 MUD #1
0.47100$ N/A 0.54090$ 0.44610$ 0.46600$ N/A N/A N/A N/A N/A
0.47100 N/A 0.56740 0.44610 0.49180 N/A N/A N/A N/A N/A
0.47100 N/A 0.59920 0.46300 0.48720 N/A N/A 0.90000$ N/A N/A
0.47020 N/A 0.64370 0.38440 0.44990 N/A 0.85000$ 0.90000 0.85000$ N/A
0.53020 0.17000$ 0.68330 0.37140 0.42160 N/A 0.85000 0.90000 0.85000 N/A
0.53020 0.17000 0.69070 0.37490 0.41220 N/A 0.85000 0.90000 0.85000 N/A
0.53020 0.17000 0.69080 0.41810 0.42150 N/A 0.85060 0.90000 0.90000 0.90000$
0.53020 0.17000 0.69090 0.42480 0.46580 N/A 0.85000 0.90000 0.90000 0.90000
0.53020 0.17000 0.69090 0.42510 0.48550 0.09480$ 0.85000 0.90000 0.90000 0.90000
0.53020 0.17000 0.69070 0.42520 0.50010 0.09510$ 0.85000 0.90000 0.90000 0.90000
89

Percentage ofType Taxable Total Taxable
of Assessed Assessed# Principal Taxpayers Property Valuation Valuation
1 Texas Lehigh Cement Co. Industrial 64,005,993$ 1.80%
2 CFAN Co. Industrial 57,339,524 1.61%
3 Goodrich Corp. Industrial 55,372,491 1.55%
4 Pedernales Electric Coop Inc. Utility 24,867,632 0.70%
5 Vista Del Blanco, Ltd. Commercial 21,686,380 0.61%
6 DDR DB Kyle LP Commercial 21,059,490 0.59%
7 Cabela's Retail TX, L.P. Commercial 20,400,751 0.57%
8 Cole MT Kyle TX, LLC Commercial 19,791,940 0.56%
9 US Foodservice, Inc. Commercial 18,143,502 0.51%
10 Settlement Apartments, L.P. Commercial 16,895,160 0.47%
Total 319,562,863$ 8.97%
Total Net Taxable Value 3,563,019,658$ 100.00%
Notes:
The principal property taxpayers from ten (10) years prior is not available.
Source of Information: Hays Central Appraisal District
2012
HAYS CONSOLIDATED INDEPENDENT SCHOOL DISTRICTPRINCIPAL PROPERTY TAXPAYERS
FISCAL YEAR 2012
SCHEDULE 8
90

TotalPercent of Tax Total Tax Collections
Levy Year Levy Collections in Collections to Date asFiscal Tax Tax Collected in Subsequent to Date PercentYear Levy Collections Levy Year Years 2012 of Levy
2003 26,097,601$ 24,871,288$ 95.30% 1,167,679$ 26,038,967$ 99.78%
2004 30,620,703 29,166,753 95.25% 1,370,151 30,536,904 99.73%
2005 35,702,230 34,441,700 96.47% 1,150,521 35,592,221 99.69%
2006 41,972,272 40,886,984 97.41% 1,025,358 41,912,342 99.86%
2007 45,987,027 44,915,790 97.67% 1,009,125 45,924,915 99.86%
2008 44,478,878 43,582,919 97.99% 655,934 44,238,853 99.46%
2009 50,263,283 50,088,765 99.65% 119,228 50,332,037 99.89%
2010 52,413,824 51,791,041 98.81% 254,542 52,045,583 99.30%
2011 53,525,061 53,234,940 99.46% 170,158 53,405,098 99.78%
2012 55,410,919 54,716,313 98.75% - 54,716,313 98.75%
Source of Information: Hays Consolidated Independent School District; Hays County Tax Office
HAYS CONSOLIDATED INDEPENDENT SCHOOL DISTRICTPROPERTY TAX LEVIES AND COLLECTIONS
LAST TEN FISCAL YEARS
SCHEDULE 9
91
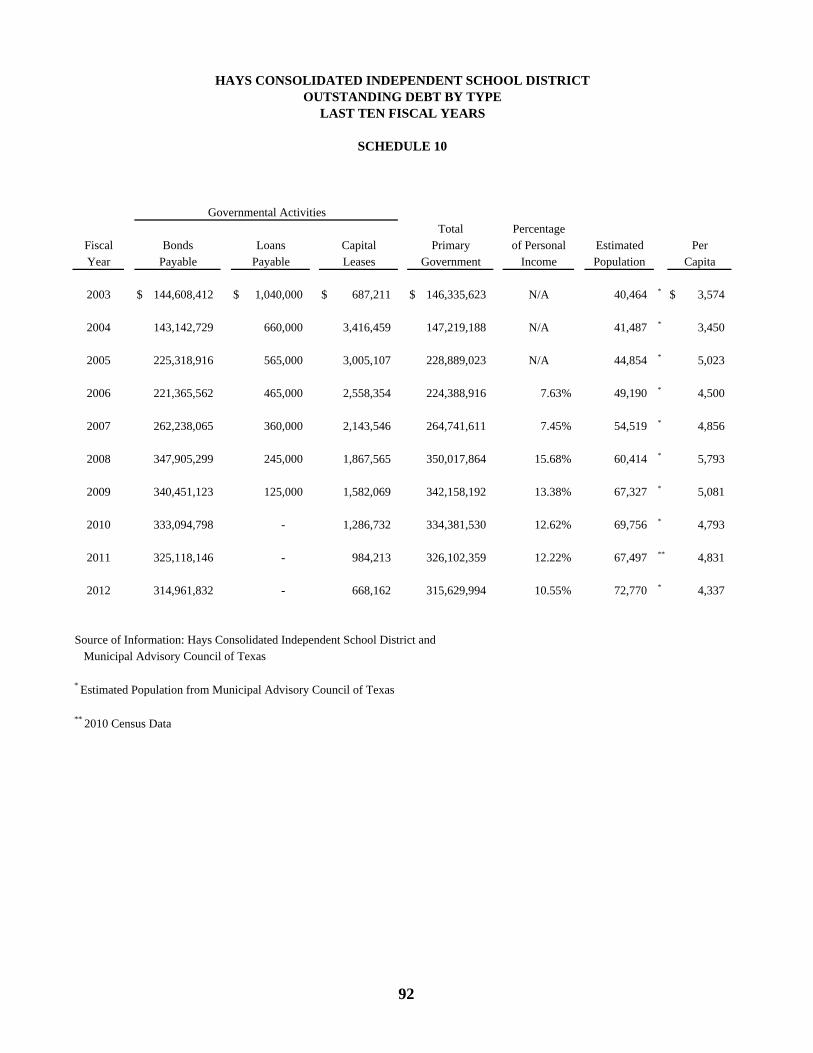
Total PercentageFiscal Bonds Loans Capital Primary of Personal Estimated PerYear Payable Payable Leases Government Income Population Capita
2003 144,608,412$ 1,040,000$ 687,211$ 146,335,623$ N/A 40,464 * 3,574$
2004 143,142,729 660,000 3,416,459 147,219,188 N/A 41,487 * 3,450
2005 225,318,916 565,000 3,005,107 228,889,023 N/A 44,854 * 5,023
2006 221,365,562 465,000 2,558,354 224,388,916 7.63% 49,190 * 4,500
2007 262,238,065 360,000 2,143,546 264,741,611 7.45% 54,519 * 4,856
2008 347,905,299 245,000 1,867,565 350,017,864 15.68% 60,414 * 5,793
2009 340,451,123 125,000 1,582,069 342,158,192 13.38% 67,327 * 5,081
2010 333,094,798 - 1,286,732 334,381,530 12.62% 69,756 * 4,793
2011 325,118,146 - 984,213 326,102,359 12.22% 67,497 ** 4,831
2012 314,961,832 - 668,162 315,629,994 10.55% 72,770 * 4,337
Source of Information: Hays Consolidated Independent School District and Municipal Advisory Council of Texas
* Estimated Population from Municipal Advisory Council of Texas
** 2010 Census Data
Governmental Activities
HAYS CONSOLIDATED INDEPENDENT SCHOOL DISTRICTOUTSTANDING DEBT BY TYPE
LAST TEN FISCAL YEARS
SCHEDULE 10
92

THIS PAGE LEFT BLANK INTENTIONALLY

Gross Bonded Reserve forDebt Retirement
Fiscal Taxable Assessment Outstanding ofYear Assessed Value Ratio at Year-end Bonded Debt
2003 1,516,784,697$ 100% 144,608,412$ 3,432,891$
2004 1,713,266,940 100% 143,142,729 4,987,235
2005 1,939,313,633 100% 225,318,916 4,609,514
2006 2,175,441,916 100% 221,365,562 4,725,794
2007 2,451,751,205 100% 262,238,065 4,474,866
2008 2,883,487,422 100% 347,905,299 8,642,258
2009 3,257,092,182 100% 340,451,123 6,577,117
2010 3,411,481,615 100% 333,094,798 3,746,700
2011 3,452,686,886 100% 325,118,146 3,870,366
2012 3,563,019,658 100% 314,961,832 3,913,075
Source of Information: Hays Central Appraisal District and District Debt Schedules
* Estimated Population from Municipal Advisory Council of Texas
** 2010 Census Data
HAYS CONSOLIDATED INDEPENDENT SCHOOL DISTRICTRATIO OF NET GENERAL BONDED DEBT TO TAXABLE ASSESSED VALUATION
AND NET BONDED DEBT PER CAPITALAST TEN FISCAL YEARS
SCHEDULE 11
93

Net Ratio TaxableBonded Debt Net Bonded Net Bonded AssessedOutstanding Debt to Taxable Estimated Debt Valuationat Year-end Assessed Valuation Population per Capita per Capita
141,175,521$ 9.31% 40,464 * 3,489$ 37,485$
138,155,494 8.06% 41,487 * 3,330 41,296
220,709,402 11.38% 44,854 * 4,921 43,236
216,639,768 9.96% 49,190 * 4,404 44,225
257,763,199 10.51% 54,519 * 4,728 44,971
339,263,041 11.77% 60,414 * 5,616 47,729
333,874,006 10.25% 67,327 * 4,959 48,377
329,348,098 9.65% 69,756 * 4,721 48,906
321,247,780 9.30% 67,497 ** 4,759 51,153
311,048,757 8.73% 72,770 * 4,274 48,963
94
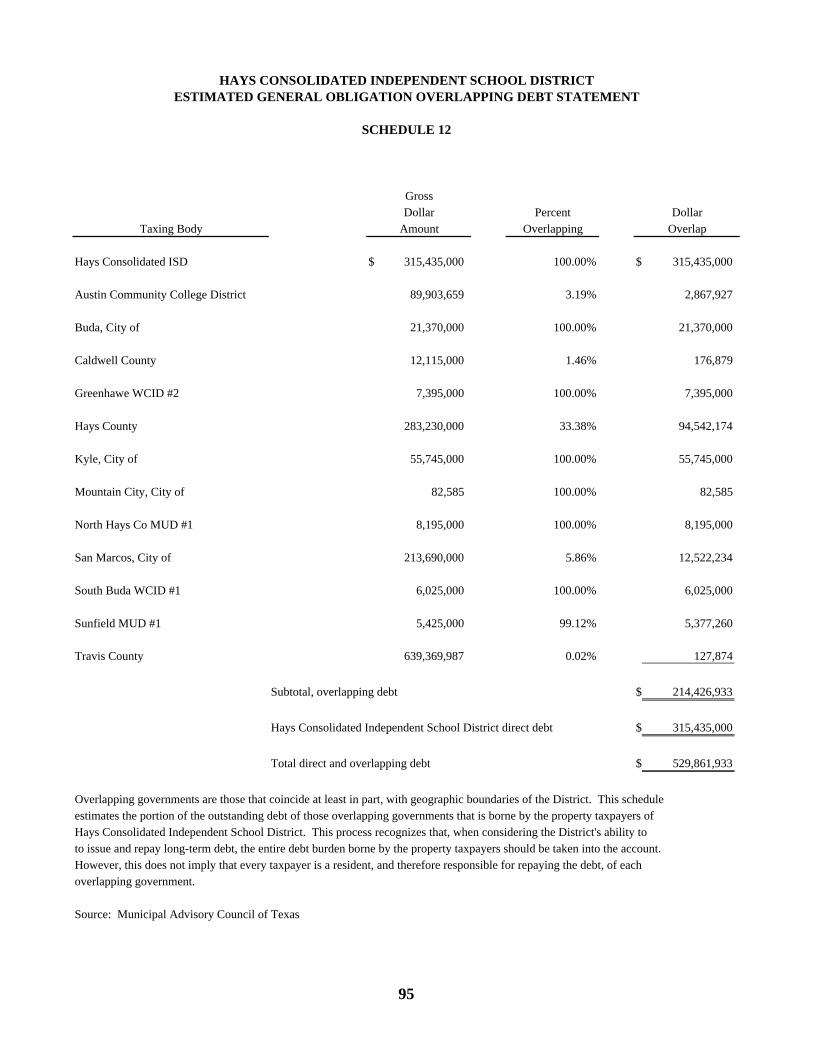
GrossDollar Percent Dollar
Taxing Body Amount Overlapping Overlap
Hays Consolidated ISD 315,435,000$ 100.00% 315,435,000$
Austin Community College District 89,903,659 3.19% 2,867,927
Buda, City of 21,370,000 100.00% 21,370,000
Caldwell County 12,115,000 1.46% 176,879
Greenhawe WCID #2 7,395,000 100.00% 7,395,000
Hays County 283,230,000 33.38% 94,542,174
Kyle, City of 55,745,000 100.00% 55,745,000
Mountain City, City of 82,585 100.00% 82,585
North Hays Co MUD #1 8,195,000 100.00% 8,195,000
San Marcos, City of 213,690,000 5.86% 12,522,234
South Buda WCID #1 6,025,000 100.00% 6,025,000
Sunfield MUD #1 5,425,000 99.12% 5,377,260
Travis County 639,369,987 0.02% 127,874
Subtotal, overlapping debt 214,426,933$
Hays Consolidated Independent School District direct debt 315,435,000$
Total direct and overlapping debt 529,861,933$
Overlapping governments are those that coincide at least in part, with geographic boundaries of the District. This schedule estimates the portion of the outstanding debt of those overlapping governments that is borne by the property taxpayers ofHays Consolidated Independent School District. This process recognizes that, when considering the District's ability to to issue and repay long-term debt, the entire debt burden borne by the property taxpayers should be taken into the account. However, this does not imply that every taxpayer is a resident, and therefore responsible for repaying the debt, of eachoverlapping government.
Source: Municipal Advisory Council of Texas
HAYS CONSOLIDATED INDEPENDENT SCHOOL DISTRICTESTIMATED GENERAL OBLIGATION OVERLAPPING DEBT STATEMENT
SCHEDULE 12
95
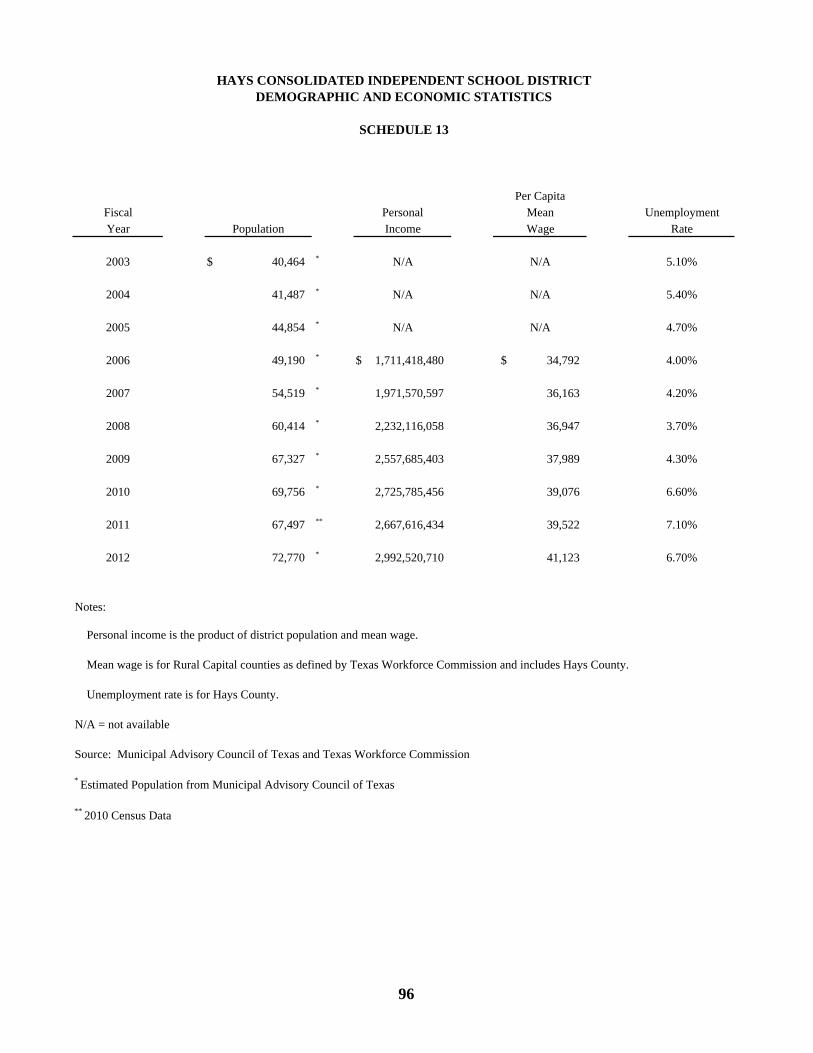
Per CapitaFiscal Personal Mean UnemploymentYear Population Income Wage Rate
2003 40,464$ * N/A N/A 5.10%
2004 41,487 * N/A N/A 5.40%
2005 44,854 * N/A N/A 4.70%
2006 49,190 * 1,711,418,480$ 34,792$ 4.00%
2007 54,519 * 1,971,570,597 36,163 4.20%
2008 60,414 * 2,232,116,058 36,947 3.70%
2009 67,327 * 2,557,685,403 37,989 4.30%
2010 69,756 * 2,725,785,456 39,076 6.60%
2011 67,497 ** 2,667,616,434 39,522 7.10%
2012 72,770 * 2,992,520,710 41,123 6.70%
Notes:
Personal income is the product of district population and mean wage.
Mean wage is for Rural Capital counties as defined by Texas Workforce Commission and includes Hays County.
Unemployment rate is for Hays County.
N/A = not available
Source: Municipal Advisory Council of Texas and Texas Workforce Commission
* Estimated Population from Municipal Advisory Council of Texas
** 2010 Census Data
HAYS CONSOLIDATED INDEPENDENT SCHOOL DISTRICTDEMOGRAPHIC AND ECONOMIC STATISTICS
SCHEDULE 13
96

Estimated Range of PercentageEmployer Employees of Total
Hays CISD 2,138 48%
Cabela's 100-499 2%
H E B Foods 100-499 11%
Home Depot 100-499 2%
Kohl's Department Store 100-499 2%
Lowe's Home Improvement 100-499 2%
Seton Medical Center Hays 500-999 12%
Target 100-499 2%
Texas-Lehigh Cement Co. 100-499 2%
THARCO 100-499 2%
US Foods 100-499 3%
Wal-Mart Super Center 100-499 9%
Xtreme Power 100-499 3%
100%
Notes:
Employers represent zip codes 78610 and 78640.
Principal employer information from ten (10) years prior is not available.
Source: Texas Workforce Commission and Kyle Economic Development
2012
HAYS CONSOLIDATED INDEPENDENT SCHOOL DISTRICTMAJOR EMPLOYERS
CURRENT YEAR
SCHEDULE 14
97

Fiscal Professional Campus Central Educational Auxiliary TotalYear Teachers Support Administration Administration Aides Staff FTEs
2003 565.3 98.3 29.9 16.3 92.1 368.7 1,170.6
2004 588.7 106.0 30.0 16.0 86.8 425.5 1,253.0
2005 624.1 138.1 32.7 14.0 95.6 419.2 1,323.7
2006 676.0 156.8 36.7 14.0 101.6 448.7 1,433.8
2007 773.1 178.6 44.9 19.0 114.5 523.0 1,653.1
2008 863.5 188.7 49.9 25.5 125.1 562.2 1,814.9
2009 938.7 196.3 53.9 32.5 128.0 609.8 1,959.2
2010 991.8 195.5 49.8 43.0 128.0 687.0 2,095.1
2011 1,043.0 214.6 53.6 36.0 136.1 728.4 2,211.7
2012 1,005.9 177.1 65.2 34.5 133.5 721.5 2,137.7
Source: Hays Consolidated Independent School District and Texas Education Agency
HAYS CONSOLIDATED INDEPENDENT SCHOOL DISTRICTFULL-TIME-EQUIVALENT DISTRICT EMPLOYEES BY TYPE
SCHEDULE 15
98

2003 2004 2005 2006 2007
Total Number of Teachers 565.3 588.7 624.1 676.0 773.1
Teachers by Highest Degree HeldNo Degree 1.0 2.0 2.0 2.0 4.2 Bachelors 435.6 445.0 472.7 517.9 593.3 Masters 125.7 138.7 144.3 150.0 170.5 Doctorate 3.0 3.0 5.0 6.0 5.0
Teachers by Years of ExperienceBeginning Teachers 46.6 43.6 49.8 77.3 71.9 1-5 Years Experience 203.2 222.4 229.8 245.8 296.2 6-10 Years Experiences 88.8 89.3 109.5 116.7 156.5 11-20 Years Experience 131.6 135.0 147.8 144.9 142.5 Over 20 Years Experience 95.1 98.4 87.2 91.2 105.9
Average Salary by Years ExperienceBeginning Teachers 31,583 32,568 33,265 34,646 36,150 1-5 Years Experience 31,755 32,827 33,787 34,758 37,503 6-10 Years Experiences 34,276 34,863 35,319 36,121 38,841 11-20 Years Experience 41,464 41,307 41,228 41,581 44,585 Over 20 Years Experience 47,760 48,713 48,905 50,415 52,661
Overall Average Years with District 5.3 5.5 5.1 4.9 4.7
Overall Average Years Experience 10.5 10.3 9.9 9.5 9.2
Overall Average Teacher Salary 37,089 37,716 37,889 38,555 41,030
Turnover Rate for Teachers 16.6% 13.2% 18.5% 17.7% 12.4%
Source: Academic Excellence Indicator System (AEIS) Report published by the Texas Education Agency
Fiscal Year
HAYS CONSOLIDATED INDEPENDENT SCHOOL DISTRICTTEACHER DATA
SCHEDULE 16
99

2008 2009 2010 2011 2012
863.5 938.7 991.8 1,043.0 1,005.9
2.0 3.2 4.5 3.0 3.0 668.5 730.6 751.5 783.4 734.7 185.0 196.9 226.8 247.6 260.2
8.0 8.0 9.0 9.0 8.0
90.7 85.2 75.3 74.7 28.4 321.6 382.4 407.5 423.0 363.1 177.1 182.6 197.5 217.8 261.1 160.1 179.4 200.6 216.7 233.3 114.0 109.1 110.9 110.8 120.1
37,929 38,775 39,447 39,876 39,194 38,778 39,859 40,747 40,706 41,796 40,257 40,805 41,696 41,877 43,687 46,232 46,469 47,433 47,477 48,443 53,085 53,784 54,769 54,876 56,153
4.7 4.6 5.0 5.3 6.0
9.0 8.7 8.9 9.1 10.0
42,263 42,827 43,758 43,803 45,469
14.9% 17.1% 10.7% 10.6% 12.5%
Fiscal Year
100
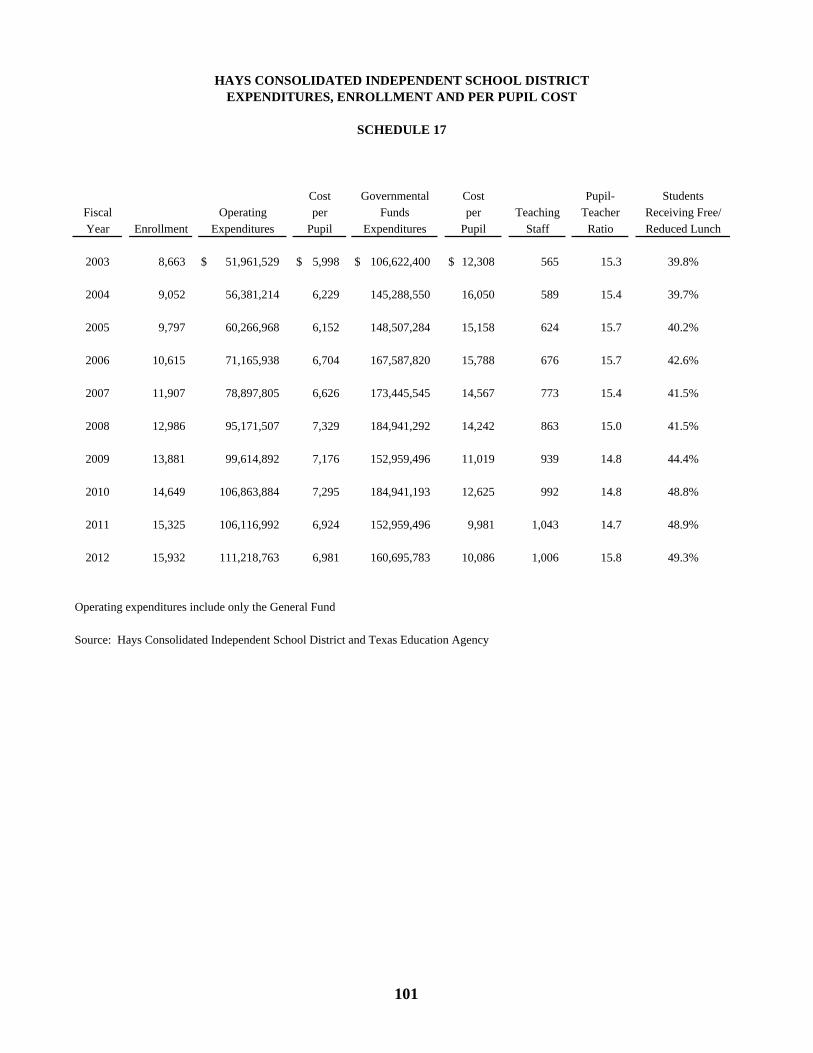
Cost Governmental Cost Pupil- StudentsFiscal Operating per Funds per Teaching Teacher Receiving Free/Year Enrollment Expenditures Pupil Expenditures Pupil Staff Ratio Reduced Lunch
2003 8,663 51,961,529$ 5,998$ 106,622,400$ 12,308$ 565 15.3 39.8%
2004 9,052 56,381,214 6,229 145,288,550 16,050 589 15.4 39.7%
2005 9,797 60,266,968 6,152 148,507,284 15,158 624 15.7 40.2%
2006 10,615 71,165,938 6,704 167,587,820 15,788 676 15.7 42.6%
2007 11,907 78,897,805 6,626 173,445,545 14,567 773 15.4 41.5%
2008 12,986 95,171,507 7,329 184,941,292 14,242 863 15.0 41.5%
2009 13,881 99,614,892 7,176 152,959,496 11,019 939 14.8 44.4%
2010 14,649 106,863,884 7,295 184,941,193 12,625 992 14.8 48.8%
2011 15,325 106,116,992 6,924 152,959,496 9,981 1,043 14.7 48.9%
2012 15,932 111,218,763 6,981 160,695,783 10,086 1,006 15.8 49.3%
Operating expenditures include only the General Fund
Source: Hays Consolidated Independent School District and Texas Education Agency
HAYS CONSOLIDATED INDEPENDENT SCHOOL DISTRICTEXPENDITURES, ENROLLMENT AND PER PUPIL COST
SCHEDULE 17
101
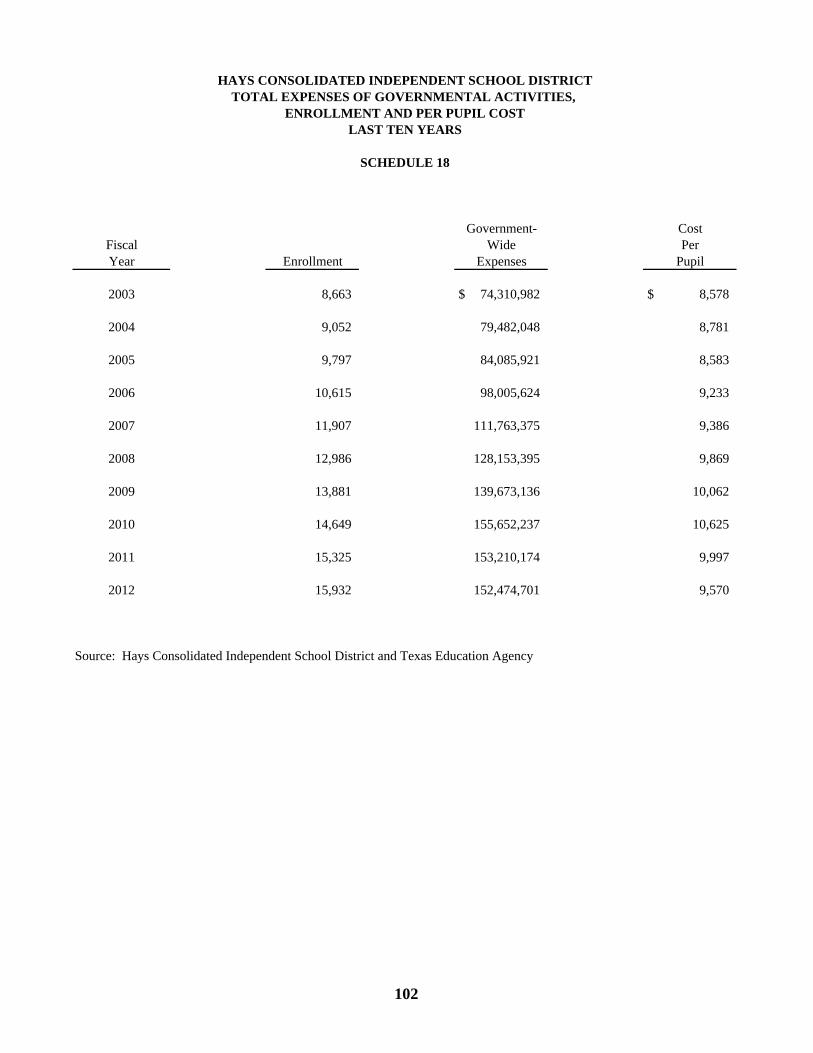
Government- CostFiscal Wide PerYear Enrollment Expenses Pupil
2003 8,663 74,310,982$ 8,578$
2004 9,052 79,482,048 8,781
2005 9,797 84,085,921 8,583
2006 10,615 98,005,624 9,233
2007 11,907 111,763,375 9,386
2008 12,986 128,153,395 9,869
2009 13,881 139,673,136 10,062
2010 14,649 155,652,237 10,625
2011 15,325 153,210,174 9,997
2012 15,932 152,474,701 9,570
Source: Hays Consolidated Independent School District and Texas Education Agency
SCHEDULE 18
HAYS CONSOLIDATED INDEPENDENT SCHOOL DISTRICTTOTAL EXPENSES OF GOVERNMENTAL ACTIVITIES,
ENROLLMENT AND PER PUPIL COSTLAST TEN YEARS
102

PercentYear Grades Building of CapacityBuilt Served Capacity Enrollment Used
HIGH SCHOOLSHays High School 1967 9-12 2,250 2,148 95.5%Lehman High School 2004 9-12 2,250 2,143 95.2%Live Oak Academy 1973 9-12 175 95 54.3%
MIDDLE SCHOOLSBarton Middle School 1993 6-8 900 906 100.7%Chapa Middle School 2006 6-8 765 668 87.3%Dahlstrom Middle School 1985 6-8 855 816 95.4%Simon Middle School 2009 6-8 765 559 73.1%Wallace Middle School 1987 6-8 765 855 111.8%
ELEMENTARY SCHOOLSBlanco Vista Elementary School 2008 K-5 800 711 88.9%Buda Elementary School 1928 EE-5 702 462 65.8%Camino Real Elementary School 2008 K-5 800 734 91.8%Carpenter Hill Elementary School 2010 K-5 800 641 80.1%Elm Grove Elementary School 2000 K-5 720 543 75.4%Fuentes Elementary School 2000 EE-5 720 622 86.4%Green Elementary School 1985 PK-5 714 567 79.4%Hemphill Elementary School 2000 EE-5 720 809 112.4%Kyle Elementary School 1950 EE-5 770 686 89.1%Negley Elementary School 2006 EE-5 780 766 98.2%Pfluger Elementary School 2010 K-5 800 548 68.5%Science Hall Elementary School 2006 K-5 720 646 89.7%Tobias Elementary School 2003 K-5 720 609 84.6%
OTHER PROGRAMSImpact Center (DAEP) 1998 6-12 50 8 16.0%
Notes:
Enrollment as of October 25, 2012. Building capacity does not include portable buildings.
Source of Information: Hays Consolidated Independent School District
SCHEDULE 19
HAYS CONSOLIDATED INDEPENDENT SCHOOL DISTRICTSCHOOL BUILDING INFORMATION
CURRENT YEAR
103

FEDERAL AWARDS SECTION

REPORT ON INTERNAL CONTROL OVER FINANCIAL REPORTING AND ON COMPLIANCE AND OTHER MATTERS BASED ON AN AUDIT OF FINANCIAL
STATEMENTS PERFORMED IN ACCORDANCE WITH GOVERNMENT AUDITING STANDARDS
Board of Trustees Hays Consolidated Independent School District Kyle, Texas Members of the Board:
We have audited the financial statements of the governmental activities, the business-type
activities, each major fund, and the aggregate remaining fund information of Hays Consolidated Independent School District (the “District’), as of and for the year ended August 31, 2012, which collectively comprise the District’s basic financial statements and have issued our report thereon dated January 14, 2013. We conducted our audit in accordance with auditing standards generally accepted in the United States of America and the standards applicable to financial audits contained in Government Auditing Standards, issued by the Comptroller General of the United States. Internal Control Over Financial Reporting
Management of the District is responsible for establishing and maintaining effective internal control over financial reporting. In planning and performing our audit, we considered District’s internal control over financial reporting as a basis for designing our auditing procedures for the purpose of expressing our opinions on the financial statements, but not for the purpose of expressing an opinion on the effectiveness of District’s internal control over financial reporting. Accordingly, we do not express an opinion on the effectiveness of the District’s internal control over financial reporting.
A deficiency in internal control exists when the design or operation of a control does not allow
management or employees, in the normal course of performing their assigned functions, to prevent, or detect and correct misstatements on a timely basis. A material weakness is a deficiency, or a combination of deficiencies, in internal control such that there is a reasonable possibility that a material misstatement of the entity’s financial statements will not be prevented, or detected and corrected on a timely basis.
Our consideration of internal control over financial reporting was for the limited purpose
described in the first paragraph of this section and was not designed to identify all deficiencies in internal control over financial reporting that might be deficiencies, significant deficiencies, or material weaknesses. We did not identify any deficiencies in internal control over financial reporting that we consider to be material weaknesses, as defined above.
104
401 WEST HIGHWAY 6 P. O. BOX 20725 WACO, TX 76702-0725 (254) 772-4901 FAX: (254) 772-4920 www.pbhcpa.com AFFILIATE OFFICES: BROWNSVILLE, TX (956) 544-7778 HILLSBORO, TX (254) 582-2583
TEMPLE, TX (254) 791-3460 ALBUQUERQUE, NM (505) 266-5904
105
Compliance and Other Matters
As part of obtaining reasonable assurance about whether District’s financial statements are free of material misstatement, we performed tests of its compliance with certain provisions of laws, regulations, contracts, and grant agreements, noncompliance with which could have a direct and material effect on the determination of financial statement amounts. However, providing an opinion on compliance with those provisions was not an objective of our audit, and accordingly, we do not express such an opinion. The results of our tests disclosed no instances of noncompliance or other matters that are required to be reported under Government Auditing Standards.
This report is intended solely for the information and use of management, the Board of Trustees,
others within the entity, and federal awarding agencies and pass-through entities and is not intended to be and should not be used by anyone other than these specified parties. Pattillo, Brown & Hill, L.L.P. January 14, 2013

INDEPENDENT AUDITORS’ REPORT ON COMPLIANCE WITH REQUIREMENTS THAT COULD HAVE A DIRECT AND MATERIAL EFFECT ON EACH MAJOR
PROGRAM AND ON INTERNAL CONTROL OVER COMPLIANCE IN ACCORDANCE WITH OMB CIRCULAR A-133
Board of Trustees Hays Consolidated Independent School District Kyle, Texas 78640 Members of the Board: Compliance
We have audited Hays Consolidated Independent School District’s (the “District”) compliance with the types of compliance requirements described in the OMB Circular A-133 Compliance Supplement that could have a direct and material effect on each of the District’s major federal programs for the year ended August 31, 2012. The District’s major federal programs are identified in the summary of auditor’s results section of the accompanying schedule of findings and questioned costs. Compliance with the requirements of laws, regulations, contracts, and grants applicable to each of its major federal programs is the responsibility of the District’s management. Our responsibility is to express an opinion on the District’s compliance based on our audit.
We conducted our audit of compliance in accordance with auditing standards generally accepted in the United States of America; the standards applicable to financial audits contained in Government Auditing Standards, issued by the Comptroller General of the United States; and OMB Circular A-133, Audits of States, Local Governments, and Non-Profit Organizations. Those standards and OMB Circular A-133 require that we plan and perform the audit to obtain reasonable assurance about whether noncompliance with the types of compliance requirements referred to above that could have a direct and material effect on a major federal program occurred. An audit includes examining, on a test basis, evidence about the District’s compliance with those requirements and performing such other procedures as we considered necessary in the circumstances. We believe that our audit provides a reasonable basis for our opinion. Our audit does not provide a legal determination of the District’s compliance with those requirements.
In our opinion, the District complied, in all material respects, with the compliance requirements referred to above that could have a direct and material effect on each of its major federal programs for the year ended August 31, 2012.
106
401 WEST HIGHWAY 6 P. O. BOX 20725 WACO, TX 76702-0725 (254) 772-4901 FAX: (254) 772-4920 www.pbhcpa.com AFFILIATE OFFICES: BROWNSVILLE, TX (956) 544-7778 HILLSBORO, TX (254) 582-2583
TEMPLE, TX (254) 791-3460 ALBUQUERQUE, NM (505) 266-5904
107
Internal Control Over Compliance
Management of the District is responsible for establishing and maintaining effective internal control over compliance with the requirements of laws, regulations, contracts, and grants applicable to federal programs. In planning and performing our audit, we considered the District’s internal control over compliance with the requirements that could have a direct and material effect on a major federal program to determine the auditing procedures for the purpose of expressing our opinion on compliance and to test and report on internal control over compliance in accordance with OMB Circular A-133, but not for the purpose of expressing an opinion on the effectiveness of internal control over compliance. Accordingly, we do not express an opinion on the effectiveness of the District’s internal control over compliance.
A deficiency in internal control over compliance exists when the design or operation of a control over compliance does not allow management or employees, in the normal course of performing their assigned functions, to prevent, or detect and correct, noncompliance with a type of compliance requirement of a federal program on a timely basis. A material weakness in internal control over compliance is a deficiency, or combination of deficiencies, in internal control over compliance, such that there is a reasonable possibility that material noncompliance with a type of compliance requirement of a federal program will not be prevented, or detected and corrected, on a timely basis.
Our consideration of internal control over compliance was for the limited purpose described in
the first paragraph of this section and was not designed to identify all deficiencies in internal control over compliance that might be deficiencies, significant deficiencies or material weaknesses. We did not identify any deficiencies in internal control over compliance that we consider to be material weaknesses, as defined above.
The purpose of this report is solely to describe the scope of our testing of compliance with the
types of compliance requirements applicable to each of the District’s major programs and our testing of internal control over compliance and the results of our testing, and to provide an opinion on the District’s compliance but not to provide an opinion on the effectiveness of the District’s internal control over compliance. This report is an integral part of an audit performed in accordance with Government Auditing Standards in considering the District’s compliance with requirements applicable to each major program and its internal control over compliance. Accordingly, this report is not suitable for any purpose. Pattillo, Brown & Hill, L.L.P. January 14, 2013

EXHIBIT K-1
(1) (2) (2A) (3)Federal Grantor/ Federal Pass-through
Pass-through Grantor/ CFDA Entity Identifying FederalGrantor/Program Title Number Number Expenditures
U. S. DEPARTMENT OF DEFENSE
Direct Programs
NJROTC & MJROTOC 12.xxx TRNMX-09R09CX0 21,387$
Total Direct Programs 21,387
TOTAL DEPARTMENT OF DEFENSE 21,387
U. S. DEPARTMENT OF AGRICULTURE
Passed through State Department of Education
School Breakfast Program 10.553 71401201 1,037,401 National School Lunch Program 10.555 71301201 3,238,058
Subtotal 4,275,459
Total Passed through State Department of Education 4,275,459
Passed through Texas Department of Agriculture
National School Lunch Program - non cash assistance 10.555 105001A 426,371
Subtotal 426,371
Total Passed through Texas Department of Agriculture 426,371
Total Child Nutrition Cluster 4,701,830
TOTAL DEPARTMENT OF AGRICULTURE 4,701,830
U. S. DEPARTMENT OF EDUCATION
Passed through State Department of Education
Adult Education (ABE) - Federal 84.002 124100087110421 111,110
FOR THE YEAR ENDED AUGUST 31, 2012
(continued)
HAYS CONSOLIDATED INDEPENDENT SCHOOL DISTRICTSCHEDULE OF EXPENDITURE OF FEDERAL AWARDS
108

EXHIBIT K-1
(1) (2) (2A) (3)Federal Grantor/ Federal Pass-through
Pass-through Grantor/ CFDA Entity Identifying FederalGrantor/Program Title Number Number Expenditures
U. S. DEPARTMENT OF EDUCATION (Continued)
Passed through State Department of Education (Continued)
IDEA Part- B, Formula 84.027 126600011059066600 2,013,190$ IDEA Part-B, Formula, ARRA 84.391A 10554001105906 169,329 IDEA Part- B, Preschool 84.173 12661001105906610 39,602
Subtotal IDEA, Part-B Cluster 2,222,121
ESEA Title I, Part A 84.010A 12610101105906 1,029,951
Title II, Part A, Teacher & Principal Training 84.367 12694501105906 232,375
Career and Technical - Basic Grant 84.048 12420006105906 76,331
Title III, Part A - English Language Acquisition 84.365 12671001105906 281,571
Title VI - Part A - Summer LEP 84.369 69551102 22,389
Texas Title I Priority School 84.388 105520017110032 357,259
Title XIV, State Stabilization, ARRA 84.394 11557001105906 172,666
Education Jobs Fund 84.410A 11550101105906 2,422,488
Total Passed through State Department of Education 6,928,261
Passed through Region XIII
Title III, Subtitle B - Education for the Homeless Children and Youth 84.196 124600017110001 2,648
Total Passed through Region XIII 2,648
TOTAL DEPARTMENT OF EDUCATION 6,930,909
HAYS CONSOLIDATED INDEPENDENT SCHOOL DISTRICTSCHEDULE OF EXPENDITURE OF FEDERAL AWARDS
FOR THE YEAR ENDED AUGUST 31, 2012
(continued)109

EXHIBIT K-1
(1) (2) (2A) (3)Federal Grantor/ Federal Pass-through
Pass-through Grantor/ CFDA Entity Identifying FederalGrantor/Program Title Number Number Expenditures
U. S. DEPARTMENT OF HEALTH AND HUMAN SERVICES
Passed through Health Resources and Services Administration
Affordable Care Act 93.501 C12CS21841 500,000$
Total Passed through Health Resources and Services Administration 500,000
Passed through Texas State Department of Health and Human Services
Medicaid Administrative Claiming Program - MAC 93.778 105906 21,399
Total Passed through Texas State Department of Health and Human Services 21,399
TOTAL DEPARTMENT OF HEALTH AND HUMAN SERVICES 521,399
TOTAL EXPENDITURES OF FEDERAL AWARDS 12,175,525$
HAYS CONSOLIDATED INDEPENDENT SCHOOL DISTRICTSCHEDULE OF EXPENDITURE OF FEDERAL AWARDS
FOR THE YEAR ENDED AUGUST 31, 2012
110

111
HAYS CONSOLIDATED INDEPENDENT SCHOOL DISTRICT NOTES TO SCHEDULE OF EXPENDITURES OF FEDERAL AWARDS
AUGUST 31, 2012
1. For all federal programs, the District uses the fund types specified in Texas Education Agency’s Financial Accountability System Resource Guide. Special Revenue Funds are used to account for resources restricted to, or designated for, specific purposes by a grantor. Federal and state financial assistance generally is accounted for in a Special Revenue Fund.
2. The accounting and financial reporting treatment applied to a fund is determined by its measurement focus. The Governmental Fund types are accounted for using a current financial resources measurement focus. With this measurement focus, only current assets and current liabilities and the fund balance are included on the balance sheet. Operating statements of these funds present increases and decreases in net current assets.
The modified accrual basis of accounting is used for the governmental fund types. This basis of accounting recognizes revenues in the accounting period in which they become susceptible to accrual, i.e., both measurable and available, and expenditures in the accounting period in which the fund liability is incurred, if measurable, except for unmatured interest on General Long-term Debt, which is recognized when due, and certain compensated absences and claims and judgments, which are recognized when the obligations are expected to be liquidated with expendable available resources.
Federal grant funds are considered to be earned to the extent of expenditures made under the provisions of the grant, and, accordingly, when such funds are received, they are recorded as deferred revenues until earned.
3. The following is the reconciliation of federal revenues and the Schedule of Expenditures of Federal
Awards for the year ended August 31, 2012: Federal revenues per the Statement of Revenues,
Expenditures and Changes in Fund Balance -
Governmental Funds (Exhibit C-3) 14,427,706$
Less:
E-rate reimbursements 157,981
School health and related services revenue 2,094,200
Federal expenditures per the Schedule of
Expenditures of Federal Awards
(Exhibit K-1) 12,175,525$

Summary of Auditors' Results
Financial Statements: Type of auditors' report issued Unqualified
Internal control over financial reporting: Material weakness(es) identified? No
Significant deficiency(ies) identified? None reported
Noncompliance material to financial statements noted? None
Federal Awards: Internal control over major programs: Material weakness(es) identified? No
Significant deficiency(ies) identified? None reported
Type of auditors' report issued on compliance for major programs Unqualified
Any audit findings disclosed that are required to be reported in accordance with Section 510(a) of OMB Circular A-133? None
Identification of major programs:
CFDA Number(s) Name of Federal Program or Cluster:
10.553, 10.555 Child Nutrition Cluster 84.010A Title I, Part A Cluster 84.394 Title XIV, State Fiscal Stabilization Fund 84.410A Education Job Fund 93.501 Affordable Care Act
Dollar threshold used to distinguish between type A and type B programs $365,266
Auditee qualified as low-risk auditee? No
Findings Relating to the Financial Statements Which are Required to be Reported in Accordance With Generally Accepted Government Auditing Standards
None
Findings and Questioned Costs for Federal Funds
None
FOR THE YEAR ENDED AUGUST 31, 2012
HAYS CONSOLIDATED INDEPENDENT SCHOOL DISTRICT
SCHEDULE OF FINDINGS AND QUESTIONED COSTS
112

113
HAYS CONSOLIDATED INDEPENDENT SCHOOL DISTRICT SUMMARY SCHEDULE OF PRIOR AUDIT FINDINGS
FOR THE YEAR ENDED AUGUST 31, 2012 Findings and Questioned Costs for Federal Funds
Item 2011-1: Title IV, State Stabilization, ARRA, CFDA #84.394 Compliance Requirement: Allowable Costs/Costs Principles Criteria: Documentation of allowable costs in accordance with OMB
Circular A-87 includes the following:
Not be included as a cost or used to meet cost sharing or matching requirements of any other federal award in either the current or a prior period, except as specifically provided by federal law or regulation.
Condition: The District charged communications expenditures to grants
that were being reimbursed through the E-Rate Grant program. Effect: As noted earlier, costs used to meet requirements of another
federal award program cannot be included. Cause: We selected a sample of 55 transactions to test the
allowability of cost charged to Title IV. Of these, we noted instances where communication expenses that were being reimbursed by E-Rate were being requested as allowable expenditures.
Recommendation: Management should implement policies and procedures to
ensure all expenditures charged to the grant program are in accordance with the requirements of OMB Circular A-87.
Management’s Response: The District moved communication expenditures that
normally would be allowable in the normal course of the grant; however, E-Rate reimbursements were not taken into account when moving expenditures due to the time lapse of the reimbursements. The District removed communication expenditures charged to the grant and replaced with electricity expenditures that are allowable under OMB A-87.
Contact Person Responsible for Corrective Action: Annette Folmar, Executive Finance Director Anticipated Completion Date: September 1, 2011
Current Status: This matter has been resolved.
(continued)

114
HAYS CONSOLIDATED INDEPENDENT SCHOOL DISTRICT
SUMMARY SCHEDULE OF PRIOR AUDIT FINDINGS (Continued)
FOR THE YEAR ENDED AUGUST 31, 2012 Findings and Questioned Costs for Federal Funds (Continued)
Item 2011-2: ESEA, Title I, Part A, CFDA #84.010A Compliance Requirement: Allowable Costs/Costs Principles Criteria: Documentation of allowable salaries and wages in accordance
with OMB Circular A-87 include the following:
Where employees work on multiple activities or cost objectives, a distribution of their salaries or wages will be supported by personnel activity reports or equivalent documentation. Such documentary support will be required where employees work on:
o More than one federal award; o A federal award and a non-federal award; o An indirect cost activity and a direct cost
activity; o Two or more indirect activities which are
allocated using different allocation basis; or o An allowable activity and a direct or indirect
cost activity. Personnel activity reports must reflect an after-the-fact
distribution of the actual activity of each employee. Budget estimates or other distribution percentages determined before the services are performed do not qualify as support for the charges to federal awards.
Condition: Employee charging salaries to grant based on a predetermined
budgeted split. Effect: As noted earlier, personnel activity reports must reflect an
after-the-fact distribution of the actual activity of each employee. Budget estimates or other distribution percentages determined before the services are performed do not qualify as support for the charges to federal awards.
Cause: We selected a sample of 40 employees to test the allowability
of salaries charged to Title I. Of these, we noted one employee that for 4 months certified her time incorrectly without using a time sheet. The other 8 months of time sheets were completed but the budget percentages were used to charge the grant instead of the actual time from the time sheets.
(continued)

115
HAYS CONSOLIDATED INDEPENDENT SCHOOL DISTRICT
SUMMARY SCHEDULE OF PRIOR AUDIT FINDINGS (Continued)
FOR THE YEAR ENDED AUGUST 31, 2012 Findings and Questioned Costs for Federal Funds (Continued)
Item 2011-2: ESEA, Title I, Part A, CFDA #84.010A Recommendation: Management should implement policies and procedures to
ensure all employees certify time and effort in accordance with the requirements of OMB Circular A-87.
Management’s Response: The District was keeping time sheets on the employee, but
was still charging time based on the split within the system. The District will begin charging time based on the time sheet going forward.
Contact Person Responsible for Corrective Action: Annette Folmar, Executive Finance Director Anticipated Completion Date: September 1, 2011
Current Status: This matter has been resolved.

THIS PAGE LEFT BLANK INTENTIONALLY