hashing out hashrates - sydney bitcoin meetup - december 2014
TRANSCRIPT
Hashing Out Hashrates
Understanding Bitcoin’s Network Hashrate as a Market In Its Own Right
All data as at December 1 2014

Introduction• This presentation will focus on the economics of
Bitcoin’s Network Hashrate – glossing over the technological complexities
• Give viewers an idea on the make-up of the network, and how this may evolve in the future due to underlying economic and business fundamentals

Understanding Hashrate• What is Network Hashrate, and what does it
tell us?
• Nature & Drivers of Growth
• Nature of Competition
• The Profit Motive: To mine or not to mine
What is “Network Hashrate”?• In the simplest terms, it is the amount of incentivised
computing power currently administering and securing the Bitcoin Blockchain
• Hashrate change is proportionately tied to difficulty changes every 2016 generated blocks (around two-weeks), to ensure a consistent and predictable block generation cycle of around 10 minutes.
• E.g. if Hashrate rises 10% during a 2016 block cycle, difficulty will rise 10%. If Hashrate decreases by 5%, difficulty will decrease by 5%, etc.

Recent Growth History• Since the November 2012 Reward-Halving, the
network has seen 62 difficulty changes, with an average difficulty change of +16.95%, with a standard deviation of +11.51%.
• Average time between difficulty changes has been 11.98 days, with a standard deviation of 1.26 days
• The difficulty has decreased 3 times since the halving, with the most recent time being in January 2013

Recent Growth History

Nature & Drivers of Growth• Main Inter-dependent Drivers
– Prevailing Market Price of BTC (Supply/Demand-Driven)– Prevailing Cost to Mine BTC– Competition in the Mining Industry– State of Mining Technology ($/GH, J/GH)
• This does not differ meaningfully from traditional physical commodities markets, like Gold and Iron Ore Mining

Supply & Demand / Cost & Price• In Short-term Equilibrium…
– If Cost to Mine < Cost to Buy, Mine -------> Hashrate Increase– If Cost to Mine > Cost to Buy, Buy --------> Hashrate Decrease
• In Medium-to-Long-term Equilibrium…– If Demand Exceeds Supply -> Price Increases -> Hashrate Increases– If Supply Exceeds Demand -> Price Decreases -> Hashrate
Decreases
• Sustained periods of increases or decreases in hashrate may indicate the strength of supply and demand forces / health of the market

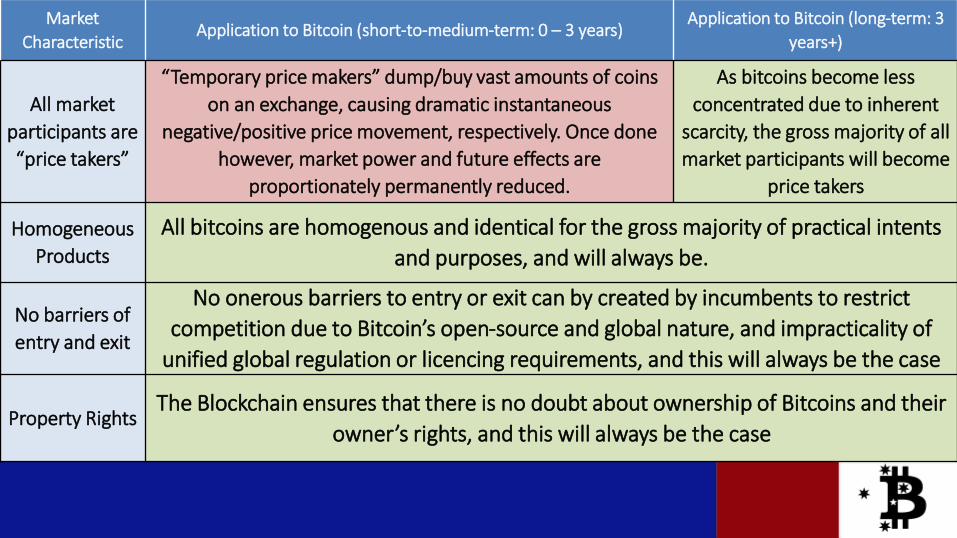
Perfect Competition & Bitcoin Mining
Market
CharacteristicApplication to Bitcoin (short-to-medium-term: 0 – 3 years)
Application to Bitcoin (long-term: 3
years+)
All market
participants are
“price takers”
“Temporary price makers” dump/buy vast amounts of coins
on an exchange, causing dramatic instantaneous
negative/positive price movement, respectively. Once done
however, market power and future effects are
proportionately permanently reduced.
As bitcoins become less
concentrated due to inherent
scarcity, the gross majority of all
market participants will become
price takers
Homogeneous
Products
All bitcoins are homogenous and identical for the gross majority of practical intents
and purposes, and will always be.
No barriers of
entry and exit
No onerous barriers to entry or exit can by created by incumbents to restrict
competition due to Bitcoin’s open-source and global nature, and impracticality of
unified global regulation or licencing requirements, and this will always be the case
Property RightsThe Blockchain ensures that there is no doubt about ownership of Bitcoins and their
owner’s rights, and this will always be the case
Market Characteristic Application to Bitcoin (short-to-medium-term: 0 – 3 years)Application to Bitcoin (long-term: 3
years+)
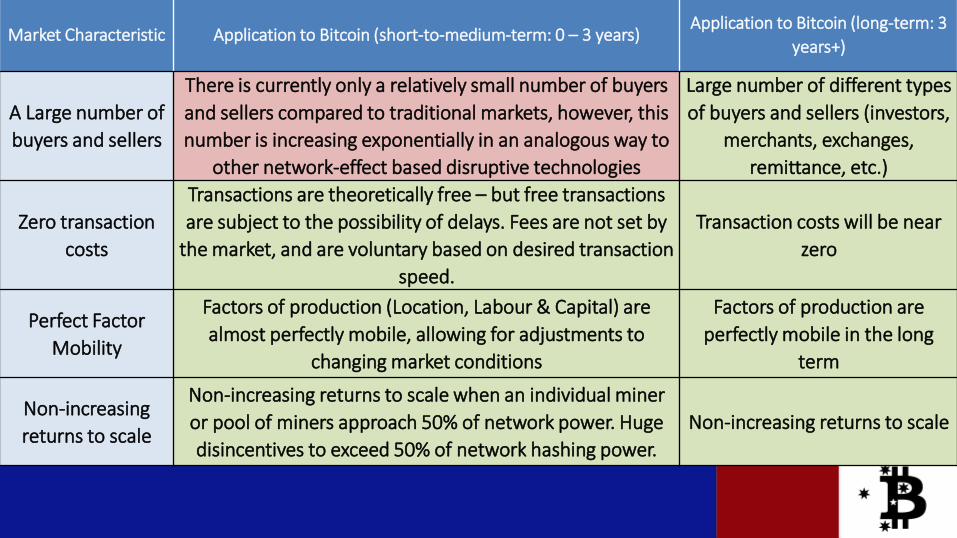
A Large number of
buyers and sellers
There is currently only a relatively small number of buyers
and sellers compared to traditional markets, however, this
number is increasing exponentially in an analogous way to
other network-effect based disruptive technologies
Large number of different types
of buyers and sellers (investors,
merchants, exchanges,
remittance, etc.)
Zero transaction
costs
Transactions are theoretically free – but free transactions
are subject to the possibility of delays. Fees are not set by
the market, and are voluntary based on desired transaction
speed.
Transaction costs will be near
zero
Perfect Factor
Mobility
Factors of production (Location, Labour & Capital) are
almost perfectly mobile, allowing for adjustments to
changing market conditions
Factors of production are
perfectly mobile in the long
term
Non-increasing
returns to scale
Non-increasing returns to scale when an individual miner
or pool of miners approach 50% of network power. Huge
disincentives to exceed 50% of network hashing power.
Non-increasing returns to scale

Market CharacteristicApplication to Bitcoin (short-to-medium-term: 0 – 3
years)Application to Bitcoin (long-term: 3 years+)
Profit
Maximisation
Miners will sell at the intersection of
Marginal Cost and Marginal Revenue, except
during positive/negative hype cycles, where
sales strategy differs wildly across the
industry
Miners will sell at the intersection of Marginal
Cost and Marginal Revenue
Perfect
Information
In the short term, “Price Makers” prevent the
overall market from having access to perfect
information, as they can individually
influence market price.
Due to the open-source nature of Bitcoin, in
the long term, all consumers and producers
are assumed to have perfect knowledge of
price, utility, quality and mining methods.
No externalities
The only externalities are emissions due to
proportion of network using fossil-fuel to
provide electricity for mining, and waste
produced by obsolete mining equipment.
Externalities trending to zero due to
decentralised low-emission electricity (Solar,
Fuel Cell), and improvements in recycling

Trends & Heuristics• It suggested that in a
competitive market place, there is a natural tendency for the market to be dominated by three or four players – known as “The Rule of Three” (Henderson, 1976).
• This hypothesis was tested by observing the evolution of roughly 200 competitive markets (Sheth & Sisodia, 2002).

Trends & Heuristics
• Typical S&P500 Tech-Sector profit margin > 20%
– Semiconductor Businesses = 18-22% (source: http://www.businessinsider.com.au/sector-profit-margins-sp-500-2012-8)
• Profits are typically high in new markets
– Apple’s Original iPhone (2007) helped Apple achieve profits >16% for long periods of time until smartphone competition intensified.

The Cutting Edge –The Difference 6 Months Can Make
June 2014 December 2014 % Change
Hashrate 100,000,000 GH/s 300,000,000 GH/s + 300%
Retail-Best Miner Cointerra Terraminer IV Bitmain Antminer S4*
$/GH $2.99 $0.41 - 87.3%
W/GH 1.1 0.69 - 32.5%
* - Spondoolies-Tech SP-20 and ASICMiner Prisma have very similar $/GH and W/GH performance

Trends & Heuristics• Moore’s Law (and it’s
several variations) -> $/GH will become cheaper at a non-linear rate for the foreseeable future
• Koomey’s Law: GH/J has been doubling approx. every 1.5 years since the 1950s, and has been faster than Moore’s law.

Trends & Heuristics
• “Our goal is to get to 0.05 W/GHs, 0.03 $/GHs miners by mid 2015 and power more than 30% of the bitcoin network," Corem explained, adding that he believes these figures will help the company match its rival firms in the US and China”
- Guy Corem, CEO, Spondoolies-Tech

The Mining Mix
* Cloud miners sampled include PBMining (4.2PH/s), Cloudhashing.com ( 3.5PH/s @ $0.59/GH), Hashnest (3PH/s @ $0.44), Cex.io (2PH/s @ $0.63/GH)
Miner Type% of Network
HashrateTypical $/GH Typical W/GH
Cloud-Miners* ~5% $0.63 ~ 0.7
Retail-Miners 30% (+/- 10%) $0.4 0.69
Manufacturer-Miners 65% (+/- 10%) ~$0.30 ~0.50
The Mining Mix• The “Weighted Network-Average Miner” would mine for
between $0.3365 to $0.3565/GH and 0.548 to 0.586 W/GH
• This heuristic allows us to estimate the following, within a range of +/- 20%:
– Approximate cost to attempt sustained 51% attack
– Approximate cost to mine a Bitcoin

Conclusion• It’s not rocket science! Understanding it is just a mix of
understanding disruptive evolutionary technologies and managerial economics.
• Perfectly Competitive Markets tend to stay that way in the long-term – so expect more groundbreakingtechnological improvements, more competition, and more of the same old managerial economics at work!