harvested forages || soil fertility and forage production
TRANSCRIPT

11
S O I L FERTILITY AND
F O R A G E P R O D U C T I O N
I. Introduction II. Determinants of Soil Fertility
A. Parent Material B. Geologic Classification of Parent Material
III. Soils A. Soil Acidity B. Lime Requirements of Acid Soils C. Nutrient Availability and Soil pH D. Response to Lime Application
IV. Nutrients and Plant Growth A. Nitrogen B. Phosphorus C. Potassium D. Calcium and Magnesium E. Sulfur F. Micronutrients
V. Soil Nutrients and Dinitrogen Fixation A. Nitrogen B. Potassium C Calcium D. Sulfur E. Boron F. Molybdenum
VI. Aluminum Toxicity VII. Soil Sampling and Testing
187

188 I I I . G R O W I N G A N D P R O D U C I N G F O R A G E C R O P S
I. INTRODUCTION
Soil fertility refers to the power or ability of soil to supply nutrients required for optimum growth of crops. Soil productivity refers to the ability of the soil to sustain and produce a crop; low productivity equals a poor crop or low yield and high productivity means a good crop or high yield. To maintain a high-producing forage stand, nutrient removing power of the crop, especially P and K for legumes and N, P, and K for grasses, must be considered. Remedial actions must replace nutrients removed, especially on soils with low nutrient supplying power.
When the United States was first settled the soils were very fertile. However, by the 1930s, soils in many temperate humid areas of the United States were depleted of their native fertility, and economical production of crops was impossible. This was particularly true throughout much of the area east of the Mississippi River. Agronomists at the time, under the leadership of Emil Truog, raUied to the call and began promoting the use of fertilizers to enhance and restore production capabilities of the soils (Truog, 1938). Sixty years later, however, the great need for use of massive amounts of fertilizer in these areas may not exist because fertilizer practices have built up the nutrient-supplying power of many of these soils (Thomas, 1989).
In the arid west, many soils are high in their ability to supply P and K; thus, neither have ever been applied as a fertilizer in some areas. However, after 75 to 150 years of such practices, some of these soils are beginning to show deficiencies of P and K (James et al.y 1995). Whether in arid, semiarid, or in temperate, humid regions, economic discretion requires that fertilizer be used only where required, but not to excess. It is, therefore, important to recognize these potential nutrient-supplying differences of various soils and to use soil tests to establish a baseline for each element and then manage accordingly.
Knowledge of the amount of a nutrient available to plants in a soil is important. A quantitative estimate may be obtained through accepted soil-sampling and laboratory procedures. These measures must be correlated with yield response (Fisher, 1974) in a given area to be reliable. The technique and protocol followed in taking the soil sample from the field is as important as the chemical analyses performed in the laboratory. Improper soil sampling techniques will invahdate laboratory results. Soil testing protocol is discussed in the last section of this chapter.
I I . D E T E R M I N A N T S OF SOIL FERTIL ITY
Soil fertility is determined by (1) parent material; (2) climate, particularly temperature and precipitation; (3) living organisms (native vegetation, mi-

1 1 . SOIL FERTILITY AND FORAGE PRODUCTION 1 8 9
crobes, soil animals, human beings); and (4) duration of time the parent materials are subjected to soil formation (Brady, 1990).
A. PARENT MATERIAL
Parent material, along with climate, determines the kind and quality of soil and, with the exception of N, the majority of the elements in a soil are inherited from the parent material (Jenny, 1980). The chemical and mineral composition of parent material can influence weathering directly, and at the same time can affect naturally occurring vegetation. Parent material can also influence quantity and type of clay minerals present in the soil profile (Brady, 1990). Quartz-rich rocks are acid igneous rocks (silicon forms very weak acids) and rock low in quartz is basic igneous rock, and in the extreme it is low in Al, Ca, K, and Na, but high in Mg. In basic igneous rock, the profusion of black biotite, blackish horneblende and augite, and green olivine results in dark soils. Their high base and P concentrations favor the genesis of productive soils (Jenny, 1980). The difference between soils formed from acid igneous and basic igneous rocks is shown in Table 11.1. Soils in humid, temperate regions formed from basic rocks are usually more fertile when compared to soils formed from acid rocks. They are commonly higher in organic matter, P (much of it fixed), clay, silt, montmorillonite, and reddish-brown "chroma and hue" (color) (Buol et al, 1989).
Igneous rock has an average P2O5 concentration of 0.37%, or 162 mg kg"^ P (Clarke, 1924). Phosphorus is present mostly in the mineral apatite. Basic igneous soils average 0.89% P2O5 (390 mg kg-^ P) (Jenny, 1980). Sedimentary rocks have P associated with Al and Fe oxides, which lower
TABLE 11.1 Mean Composition of Soils Formed from Acid and Basic Igneous Rock
Soil properties
Clay (%)
Silt (%)
Sand (%)
C(%)
N(%)
Bases (me/lOOg)
1st principle components of clays
Acid igneous
11.6
21.2
58.0
1.74
0.074
5.33
Vermiculite niite Quartz
soils
Montmorillonite
Basic igneous soils
21.2
33.0
34.5
2.88
0.121
10.86
Montmorillonite niite Gibbsite Haloysite
Source: Jenny, 1980, p. 254.

190 I I I . GROWING AND PRODUCING FORAGE CROPS
solubility. Shales average 0.27% P2O5 (87 mg kg"^ P) and limestones average 0.04% P2O5 (17 mg kg"^ P). As CaCOs weathers, P concentration in the residual increases, thus benefitting plant growth (Jenny, 1980). In the pre-fertilizer era, soils from limestones were valued for their high productivity. Such soils may have as much as 5.34% P2O5 in the B2 horizon. The bedrock of this soil has 2.76% P2O5 (Jenny, 1980). However, not all carbonate-derived soils are endowed with lasting fertility, as the Ozark highly weathered cherty limestone soils showed ( Jenny, 1980). In Scotland, basaltic soils have almost twice the P as the granitic soils (Jenny, 1980). Quartzite, a metamorphic, acid, pure quartz, is essentially infertile. Ultrabasic rocks, such as serpentine, give rise to "barrens," soils with an imbalance of nutrients and a higher than normal Mg concentration (Buol et al., 1989).
The high annual precipitation and temperatures in the humid tropics provide ideal conditions for weathering, and soils will likely be thoroughly oxidized and low in organic matter, leached, and comparatively low in Ca and Mg (i.e., the primary siHcates have weathered and only highly weathered material remains). Products of intense weathering, oxides of Fe and Al, dominate these soils (Brady, 1990). Order of resistance of silt and sand-sized particles to weathering in tropical conditions is as follows: quartz > muscovite and potassium feldspars > sodium and calcium feldspars > biotite, horneblende, and augite > olivine > dolomite and calcite > gypsum. This order accounts for the absence of dolomite, calcite, and gypsum in tropical areas, and for the predominance of quartz in the courser fraction of tropical topsoils (Barshad, 1955).
In cooler, drier climates, weathering is much less drastic; oxidation and hydration of Fe are hardly noticeable, and Ca content is much higher, especially in drier regions. These types of soils are found in the Great Plains, the western United States, and other semiarid and arid areas of the world. Areas with sufficient precipitation to support lush plant growth will, over long periods of time, produce the richest soils. An example of such an area is the tallgrass prairie of North America. The interaction of the moderate summer temperatures, precipitation, high organic-matter levels from the decaying grass roots, and the teeming micro- and macro-organisms living in these soils combined to produce very deep, high organic-matter soils with high water-holding capacity and a high initial level of fertility.
B. GEOLOGIC CLASSIFICATION OF PARENT MATERIAL
There are two groups of inorganic parent material: sedentary (formed in place) and transported. The latter are divided according to means of transport: gravity (coUuvial), water (alluvial), ice (glacial), and wind (eo-lian). Water-transported soils are further divided into marine (ocean) and

1 1 . SOIL FERTILITY AND FORAGE PRODUCTION 191
lucustrine (lake) origin (Brady, 1990). Residual or sedentary parent materials have experienced long and intense weathering.
Three types of alluvial parent material exist: flood plains, alluvial fans, and deltas. Flood plain soils are usually rich in nutrients and are sometimes poorly drained. Alluvial fans are generally gravelly and stoney, somewhat porous and well drained. They may be very productive even though they may be quite course in texture. Delta soils consist of the finer sediments carried by streams into lakes, reservoirs, or oceans. They are a continuation of a flood plain and are usually clayey in nature and quite likely to be swampy (Brady, 1990).
Soils of arid regions are remarkably similar to their parent materials because primary minerals are more prominent. This is due to dominance of physical rather than chemical forces in the weathering process. Minerals requiring water for formation are not formed as readily as they are in a humid climate. In humid areas, the forces of weathering are more varied, and vigorous chemical change accompanies the physical changes. Thus, new minerals, such as silicate clays and oxides of Fe and Al, are more abundant in the soil. These processes are intensified and accelerated by large quantities of organic matter (Brady, 1990).
Glaciation is important agriculturally in much of the United States because of the "leveling" effect. This made agricultural operations more easily accomplished, and the fact that the parent material is ''young" or less leached leads to greater inherent fertility. In eastern Canada and New England, however, near the glaciation center, the moving ice picked up and transported much of the weathered parent material southward, leaving shaUow, unproductive soils (Brady, 1990).
III. SOILS
A. SOIL ACIDITY
Acidic soils have a pH of less than 7.0 and basic soils have a pH of greater than 7.0. Soil acidity in humid regions develops as water percolates through the soil, removing Ca, Mg, and other basic cations, replacing them with hydrogen (H) ions. The measure of acidity, pH, is the logarithm of the inverse of the hydrogen concentration [i.e., log (1/[H^])]. Thus, as the H^ ion concentration increases, the pH is reduced.
Neutral and alkaline soils lack extensive leaching. Thus, the concentration of base-forming cations is usually high with a pH higher than 7.0. Positively charged Al+^ and AlOH^^ ions are absent and H+ is extremely low. Absorbed Ca^^ and Mg+ dominate and Na^^ and K+ are also higher than in acid soils. Organic matter is usually low. According to their proper-

1 9 2 I. GROWING AND PRODUCING FORAGE C R O P S
T A B L E 1 1 . 2 Properties of Different Kinds of Soils as Dictated by Their Chemical Constituents
Soil
Normal
Acid
Saline
Saline-Sodic
Sodic
Source: Brady,
pH
6.5-7.2
<6.5
<8.5
<8.5
>8.5
1990.
Ec (dS/m)
<4
<4
>4
>4
<4
SAR
<13-15
<13-15
<13-15
>13-15
>13-15
ties, soils are classified as normal, acid, saline, saline-sodic, and sodic (Table 11.2).
Tolerance of most crops to salt is low; thus, saline-sodic and sodic soils present challenges in determining crops that are adapted to such conditions. Relative tolerance of some crop plants to salty soils is presented in Table 11.3.
B. LIME REQUIREMENTS OF ACID SOILS
pH is used as an indicator of the need for lime in soils; however, no one pH level is indicative of the lime needs for all soils (Foy, 1964; Pearson
T A B L E 1 1.3 Relative Tolerance of Certain Plants Used as Forages to Salty Soils
Tolerant Moderately tolerant Moderately sensitive
Barley, grain
Bermudagrass
Bougainvillea
Mutall alkahgrass
Rescuegrass
Sugarbeet
Saltgrass
Wheatgrass, crested
Wheatgrass, fairway
Wildrye, Altai
Wildrye, Russian
Barley, forage
Bromegrass
Clover, berseem
Orchardgrass
Oat
Rye, hay
Ryegrass, perennial
Sorghum
Sudangrass
Trefoil, birdsfoot
Wheat
Wheatgrass, western
Clover, alsike, Ladino, red, strawberry
Corn
Cowpea
Cucumber
Pea
Soybean
Sweetclover
Timothy
Source: Brady, 1990; modified from Carter, 1981.

1. SOIL FERTILITY AND FORAGE PRODUCTION 1 9 3
and Hoveland, 1974). As Ca+^ and Mg^^ ions are removed from the soil by the growing crop, by leaching, or by a combination of both, the percentage of base saturation decreases and eventually another application of limestone is required (Fig. 11.1). Thus, the purpose of liming is twofold: (1) increase the base saturation and (2) adjust the soil pH so that the availability of essential nutrients is maximized and elements that may be toxic at high concentrations are minimized. Lime requirements of soils depend on several factors: (1) magnitude of the pH change required, (2) buffering capacity of the soil, (3) chemical composition of the limestone, and (4) fineness of the liming materials (Brady, 1990).
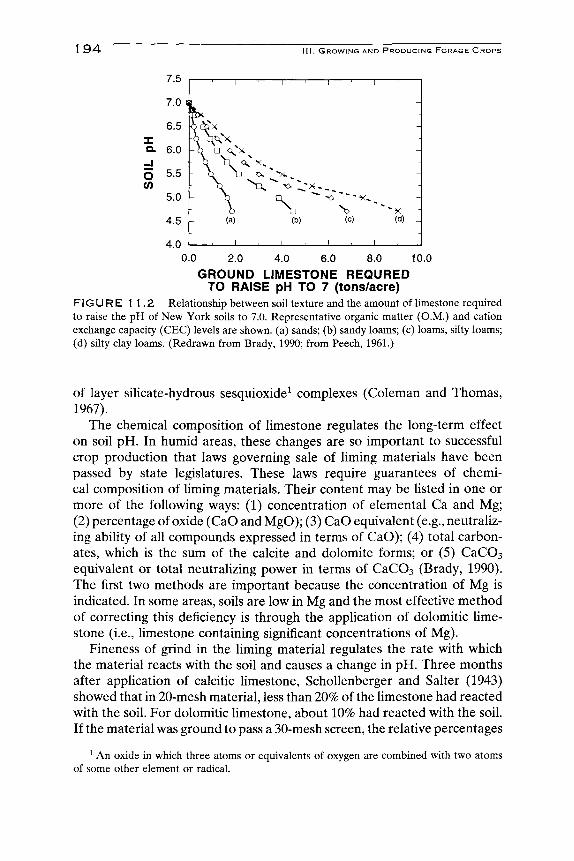
The range of pH optimum for the crop being considered dictates the magnitude of the pH change required. Grasses and most clovers can be grown at a lower pH (more acidic conditions) than can alfalfa. Buffering capacity refers to the resistance to change in pH of the soil solution (Brady, 1990). It is explained in terms of equilibrium existing among the active, salt-replaceable, and residual acidity of H^ and Al^^ of a given soil. (The reader is referred to a basic soil text for further discussion of these relationships.) The general relationship of buffering to limestone requirements as a function of soil texture are shown in Fig. 11.2. Fine-textured soils require several times the amount of limestone to raise the pH to 7.0 as do sandy soils. Some soils have particularly high buffering capacities and enormous amounts of limestone are required to adjust the soil pH. This buffering capacity occurs largely between soil pH values of 5.5 and 8.0, and can be attributed to organic matter and the hydroxy-aluminum interlayers or surface coatings. A soil with a very large buffer capacity indicates the presence
X
O 0)
YEARS F I G U R E 1 1.1 Influence of limestone on pH of a cropped soil. The initial rate of limestone application was assumed to be 3.5-4.5 tons/acre. It takes about 1 year for most of the limestone to react, and crop use and leaching requires 3-4 years to deplete the calcium and magnesium to a point at which additional limestone is needed. (Redrawn from Brady, 1990. Reprinted by permission of Prentice-Hall, Inc., Upper Saddle River, NJ.)
1 9 4 I I I . GROWING AND PRODUCING FORAGE CROPS
7.5
7.0
6.5 X Q. 6.0
- J
O 5.5 CO
5.0
4.5
4.0 0.0 2.0 4.0 6.0 8.0 10.0
GROUND LIMESTONE REQURED TO RAISE pH TO 7 (tons/acre)
FIGURE 1 1.2 Relationship between soil texture and the amount of limestone required to raise the pH of New York soils to 7.0. Representative organic matter (O.M.) and cation exchange capacity (CEC) levels are shown, (a) sands; (b) sandy loams; (c) loams, silty loams; (d) silty clay loams. (Redrawn from Brady, 1990; from Peech, 1961.)
i
' V °v^^ :\V: - \ ^
V
(a)
1.., _ 1 1
1 '"
^"X>
\ •
(b)
1
T — ' 1
^ __
(c)
1 , l._
J
-
^ ^
^ " X ] (d) J
1
of layer silicate-hydrous sesquioxide^ complexes (Coleman and Thomas, 1967).
The chemical composition of limestone regulates the long-term effect on soil pH. In humid areas, these changes are so important to successful crop production that laws governing sale of liming materials have been passed by state legislatures. These laws require guarantees of chemical composition of liming materials. Their content may be listed in one or more of the following ways: (1) concentration of elemental Ca and Mg; (2) percentage of oxide (CaO and MgO); (3) CaO equivalent (e.g., neutralizing abiUty of all compounds expressed in terms of CaO); (4) total carbonates, which is the sum of the calcite and dolomite forms; or (5) CaCOs equivalent or total neutralizing power in terms of CaCOa (Brady, 1990). The first two methods are important because the concentration of Mg is indicated. In some areas, soils are low in Mg and the most effective method of correcting this deficiency is through the application of dolomitic limestone (i.e., limestone containing significant concentrations of Mg).
Fineness of grind in the liming material regulates the rate with which the material reacts with the soil and causes a change in pH. Three months after application of calcitic limestone, SchoUenberger and Salter (1943) showed that in 20-mesh material, less than 20% of the limestone had reacted with the soil. For dolomitic limestone, about 10% had reacted with the soil. If the material was ground to pass a 30-mesh screen, the relative percentages
^ An oxide in which three atoms or equivalents of oxygen are combined with two atoms of some other element or radical.

1 1 . SOIL FERTILITY AND FORAGE PRODUCTION 1 9 5
reacting with the soil were about 30 and 12%, and grinding the material to pass a 100-mesh screen resulted in approximately 70 and 47% of the limestone and dolostone, respectively, reacting with the soil after 3 months. The work of Adams (1971) clearly shows the relationship of limestone fineness and its effectiveness. Material passing through a 60- to 100-mesh screen has a relative value of 100%, whereas 4- to 10-mesh material has a relative value of 8 to 10% (Fig. 11.3).
When applied to in-place forage crops, calcium neutralizes residual acidity near the soil surface by forming Ca and Mg nitrates. These are residually basic, and when the plant preferentially absorbs the NO3 ion from such salt solutions, the Ca+^ and the Mg^ are left, making the solution more basic (Pearson and Hoveland, 1974).
C. NUTRIENT AVAILABILITY AND SOIL pH
Soil pH plays an important role in availability of nutrients essential for plant growth. In general, optimum availability occurs between a soil pH of 6.0 and 7.0 (Brady, 1990). Low pH results in lower rates of N mineralization, a process dependent on active, viable microbial populations in the soil. Thus, ammonium accumulation has been shown at low soil pH (Cornfield, 1952). Rhizobium populations usually increase after liming (Pearson and Hoveland, 1974; Van Keuren, 1980).
Time required to correct soil pH to one favorable for plant growth depends on the initial pH, liming material used, fineness of grind, and extent of mixing with the soil (Barber, 1984). Most situations require appU-cation only 2 or 3 weeks before seeding. No-till planting would require surface application at least 26 weeks prior to seeding.
^ 100
UJ 80
- J
< 60
UJ > 40
LU 20
0 90-100 60-80 20-60 10-20 4-10
LIMESTONE FINENESS, MESH FIGURE 1 1.3 Relationship of limestone fineness to its relative value in neutralizing soil acidity. (Redrawn from Adams, 1971.)

1 9 6 I I I . GROWING AND PRODUCING FORAGE CROPS
Standard recommendation for a large lime requirement application is to plowdown half of the limestone and apply the remaining half after plowing but before planting, so it can be incorporated into the soil.
D. RESPONSE TO LIME APPLICATION
Acidity of soil is generally detrimental to plant growth because of the following factors: (1) increased solubility of toxic elements, (2) lowered availability of essential nutrients, and (3) repressed activity of desirable soil microorganisms (Follett and Wilkinson, 1985; Pearson and Hoveland, 1974).The amount of limestone applied should be geared to reflect the initial soil pH and the crops being grown. If alfalfa is in the rotation, soil pH values > 6.0 should be maintained. If, however, the crops being grown in the rotation are all tolerant of pH values in the range of 5.5 to 6.0, there is no reason to apply additional limestone.
1. Legumes
There is a difference among forage crops in the ability to grow, survive, and produce acceptable yields under acidic soil conditions. Crops most sensitive to acid soils are alfalfa, sainfoin, and sweet clover, each of which responds well to lime application (Whyte etal, 1953; Rorison, 1958; Adams and Pearson, 1967). Relative tolerance of major forage legume crops to acid soils is as follows: alfalfa < white clover < arrowleaf and ball clover < red and crimson clover < birdsfoot trefoil < alsike and subterranean clover (Hoveland et ai, 1969; Weeks and Lathwell, 1967; Ozanne and Howes, 1970; Pearson and Hoveland, 1974). The last two may not respond to liming, except in extreme cases of soil acidity. Fergus and Hollowell (1960) reported no response of red and crimson clover to liming at soil pH values > 5.5. Morley (1961) showed that subterranean clover flourishes at pH 4.5 if N is provided. The rhizobia required for symbiotic dinitrogen fixation do not function at this pH.
Birdsfoot trefoil is generally considered to be acid tolerant (Seany and Henson, 1970), although Canadian research has shown optimum yields were obtained on various soils with pH values ranging from 5.2 to 7.5 (Dione, 1969). Crownvetch does not respond with increased yields to lime on soils with a pH > 5.5. However, a pH of 6.5 to 7 is required for rapid growth and stand persistence (McKee and Langille, 1967). Brazihan research has shown a clear response by Stylosanthus and Phaseolus on eight latosolic^ soils at pH 4.0 to 5.2, with maximum yields occurring at pH 6.1 to 6.4 (de Freitas and Pratt, 1969). Mean response for the two afore-
^ A latosolic soil is one with a lateritic layer or iron-rich subsoil layer found in some highly weathered humid tropical soils that, when exposed and allowed to dry, becomes very hard and will not soften when rewetted. When erosion removes the overlaying layers, the laterite is exposed and a virtual pavement results (Brady, 1990).

1 1 . SOIL FERTILITY AND FORAGE PRODUCTION 1 9 7
mentioned forages was 146 and 93%, respectively. Yields of forages decreased above pH 6.4. Other tropical legumes such as kudzu, centro, Towns-ville stylo^ {Stylosanthus humilis Kunth.), and phasey bean have given only a slight response to lime according to Norris (1958, 1970) and Hutton (1970). This disparity, with respect to Townsville stylo and phasey bean, points to the importance of understanding the characteristics of specific soils, before it is decided that limestone, and how much, is or is not needed.
Mahler (1983) reported that alfalfa yield response to liming was curvihn-ear between pH 4.8 and 7.4. The yield response was described by this equation: Y = 0.009x ' \ r^ = 0.981. Maximum alfalfa yield in six western Oregon soils was achieved at pH 6.0 (Janghorbani et al, 1975). Addition of limestone resulted in acceptable yields only after the soil pH was amended to at least 6.6 from 4.8. The highest alfalfa yield was achieved at pH 7.4 (Mahler, 1983).
Application of limestone has been noted to reduce yields of subterranean clover and white clover (Helyer and Anderson, 1971). When adequate N was applied, however, Al toxicity depressed growth of alfalfa and phalaris. The other species (subterranean clover, white clover, and perennial ryegrass) were resistant to Al toxicity.
2. Grasses Grasses are generally more capable of performing satisfactorily in acid
soils than are alfalfa and sweet clover {Melilotus sp.). Forage crops most able to grow under acid soil conditions of 4.5 to 6 pH are red top, bentgrass (excepting creeping), and red and sheep's fescue (Brady, 1990). In a 7-year study in Georgia, bermudagrass produced maximum yields at pH 4.8 (Adams et al, 1967) and the minimum or optimum pH was set at 5.5 by Sanford et al (1968), who found that roots of bermudagrass are capable of extending deep into the soil, even though the subsoil pH values are 4.0 to 4.5. Other tropical grasses—napiergrass, guineagrass, and pangolagrass, have shown similar adaptation to low soil pH. A coastal bermudagrass-arrowleaf clover sward showed a response to liming (Cripps et al, 1988). Application of limestone, 17.9 Mg ha~^ (8 ton acre"^), resulted in yield increases of 11, 26, and 33% in the second, third, and fourth years after application. Pearl millet is relatively tolerant to acid soils, providing only a 20% increase in yield to applications of lime on a sandy soil of pH 5.1 (Adams, 1968). Contrasted to this, sorghum-sudangrass hybrid yields were tripled on the same soil with application of limestone. Johnsongrass has been reported to give responses to liming similar to the sorghum-sudangrass hybrids (Adams, 1956). Cool-season grasses show similar adaptation (e.g., tall fescue is tolerant of soil pH values of 4.6 to 4.7; Follett and Wilkinson, 1985). A general
^ Commonly called Townsville lucerne prior to 1970, but since changed to Townsville stylo to avoid confusion with the Medicago species.

1 9 8 I I I . GROWING AND PRODUCING FORAGE CROPS
rule to follow is that most crops produce best in the range of pH 6.0 to 7.0 (Wilkinson and Mays, 1979). Low yield in persisting stands of these species is often related to low nutrient availabihty. Thus, liming usually provides a favorable response (Pearson and Hoveland, 1974).
3. Soil Microorganisms
Application of lime can also influence survival of native and introduced species of rhizobium (Mahler, 1983; Mulder and Van Veen, 1960). An important reason for reduced growth of some legumes in acid soils may be that they grow less favorably in acid media because of less N availability due to less N fixation. Under such conditions, addition of N has resulted in increased plant growth, even though the soil pH was not changed (Virtanen, 1928; cited by Mulder and Van Veen, 1960). Dinitrogen fixation is affected by such factors as nodulation (Andrew, 1976; Munns, 1970), nodule effectiveness (Munns etal, 1977), and nodule occupancy (Dughri and Bottomly, 1983; Jones and Morley, 1981). Each of these factors can be influenced by soil acidity-increased when pH is in the normal or favorable range compared to the acid (less than 6.0) range (Doerge et ai, 1985).
According to Munns (1965), most yield response in alfalfa from addition of limestone is due to increased nodulation. In solution culture studies, a pH < 5.5 reduced nodule numbers and a pH < 4.5 prevented nodulation (Munns, 1968a). Root-hair curling, a precursor to infection, and infection did not occur below pH 5.4. Studies have shown that low pH, or acid soil conditions, are detrimental to Rhizobium melilotii (Mahler, 1983). At pH adjustment time, the number of organisms per gram of soil was approximately 2.5 X 10^. At the time of planting, the number of R. melilotii at pH 7.0 had increased to 5 X 10" per gram of soil. After 3 months, the number had risen to more than 35 X 10" per gram of soil (Fig. 11.4). Doerge et al. (1985) also studied the response of N fixation to soil pH. At soil pH values of 5.3, 5.8, and 6.5, the nodules per plant were 33.2, 62.3, and 67.3, respectively, a 203% increase as the pH changed from 5.3 to 6.5. Total N uptake by the plants was as follows (g pot"^): 0.052,0.127, and 0.286 (550% increase) at pH 5.3,5.8, and 6.5, respectively. Other work by Andrew (1976) showed that compared to the reduced nodulation at pH 4.0, Desmodium uncinatum and T. repens exhibited reduced nodulation at soil pH values of 4.0 and 5.0, respectively (de Freitas and Pratt, 1969). All Medicago spp., including alfalfa, showed reduced nodulation at soil pH < 6.0. pH had little effect on growth of plants well supphed with N, regardless of the source.
Red clover grown in acid soils, both under field conditions and in greenhouse pot experiments, was poorly nodulated or lacked nodules. Thus, red clover suffered severely from N deficiency and provided low yields (Mulder and Van Veen, 1960). Although addition of limestone in quantities sufficient to reduce the Al concentration to subtoxic levels restored yield potential of a soil in which alfalfa was grown, additional inoculum resulted in in-

1 1 . SOIL FERTILITY AND FORAGE PRODUCTION
O)
o ^ X
O - J
3 CD O N X
35
30
25
20
15
10
5
0 4
-
-
5
1 ' 1 ' 1 ' 1
3 months after planting
\
prior to pH adjustment /
1 . 0^ /
5.0 5.5 6.0 6.5
' 11 1
^ 1
/
1
at planting
\ —^3P= : o
1 < 1
7.0 7.5
-
-
8.0
1 9 9
SOIL pH FIGURE 1 1.4 Relationship between soil pH (X) and populations of Rhizobium melilotii (Y) to soil pH adjustment at planting and 3 months later. (Redrawn from Mahler, 1983.)
creased yields (Rice, 1975). This points to the importance of using inoculum when planting a legume crop, even though a resident rhizobial population may be in the soil.
Without pH amendment, inoculation of acid soils with Rhizobium trifolii resulted in nodulated plants that grew vigorously. However, greater than 60,000 rhizobium cells had to be introduced per 500 g of acid soil to attain normal nodulation (Mulder and Van Veen, 1960).
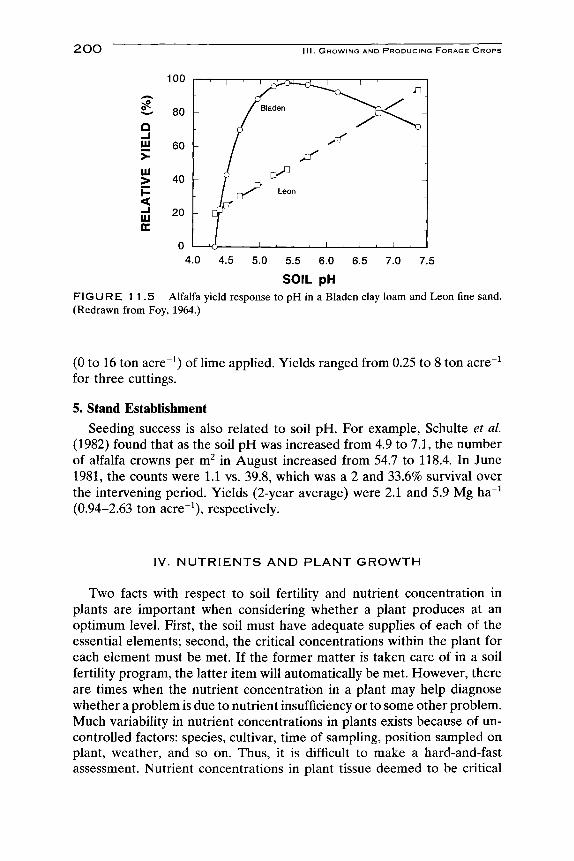
4, Effect of soil
The response of plants to pH also differs from soil to soil. "Buffalo" alfalfa yield was maximum at about pH 5.0 on a Bladen clay loam, but increased on a Leon fine sand until the soil pH had reached at least 7 (Fig. 11.5). Plant symptoms and soil analyses indicated that Al toxicity was chief among the reasons for limited growth on the Bladen soil. On the Leon fine sand, Ca deficiency was the primary cause. For a third soil. Rains sandy loam (not shown in Fig. 11.5), Ca deficiency, Mn toxicity, and Al toxicity were all likely involved in reduced alfalfa yield on unlimed soil. The response to liming may simply be one of making nutrients available to the plant that were unavailable before. For example, increased yields of alfalfa to lime application were found to be associated with increased P and Mn availability ( Janghorbani et al, 1975).
The lime requirement in acid soils is absolute if alfalfa stands and yields are to be maintained. The importance of lime to acid-sensitive crops like alfalfa is shown in the work of Moscher et al. (1961). Stand survival at the end of three seasons of growth ranged from 0 to 95% for 0 to 36 Mg ha~^
2 0 0 I I I . GROWING AND PRODUCING FORAGE CROPS
100
^ 80
liJ
>-LU > H < LU CC
60
40
20
1 ' ' ' ~ ^2>- o^—<i J[~'"'—'
1 A Bladen
L / ^ f / ^ [ I ^ 1 / ry^ Leon
: X L . . 1 , 1 , 1 , 1
' • 1 ' •
^ ^ J
1
j
1 , 1 0 4.0 4.5 5.0 5.5 6.0 6.5 7.0 7.5
SOIL pH FIGURE 11.5 Alfalfa yield response to pH in a Bladen clay loam and Leon fine sand. (Redrawn from Foy, 1964.)
(0 to 16 ton acre ) of lime applied. Yields ranged from 0.25 to 8 ton acre ^ for three cuttings.
5. Stand Establishment
Seeding success is also related to soil pH. For example, Schulte et al (1982) found that as the soil pH was increased from 4.9 to 7.1, the number of alfalfa crowns per m^ in August increased from 54.7 to 118.4. In June 1981, the counts were 1.1 vs. 39.8, which was a 2 and 33.6% survival over the intervening period. Yields (2-year average) were 2.1 and 5.9 Mg ha"^ (0.94-2.63 ton acre"^), respectively.
IV. N U T R I E N T S A N D PLANT GROWTH
Two facts with respect to soil fertility and nutrient concentration in plants are important when considering whether a plant produces at an optimum level. First, the soil must have adequate supplies of each of the essential elements; second, the critical concentrations within the plant for each element must be met. If the former matter is taken care of in a soil fertihty program, the latter item will automatically be met. However, there are times when the nutrient concentration in a plant may help diagnose whether a problem is due to nutrient insufficiency or to some other problem. Much variability in nutrient concentrations in plants exists because of uncontrolled factors: species, cultivar, time of sampling, position sampled on plant, weather, and so on. Thus, it is difficult to make a hard-and-fast assessment. Nutrient concentrations in plant tissue deemed to be critical

1 1 . SOIL FERTILITY AND FORAGE PRODUCTION 2 0 1
for two forage crops (maize and alfalfa) are given in Table 11.4. Generally, grasses contain a lower nutrient concentration than do legumes. These crops may be somewhat indicative of legume and grass species in general; however, it should be recognized that there is variability among the various grass forage crops as well as among the various legume forage crops. An extent of this variation is provided in plant analysis handbooks published in 1991 (Jones, Wolf, and Mills) and 1996 (Mills and Jones). These works list survey and/or sufficiency ranges for many forage crops.
Nutrients are removed from soils by forage crops in much larger quantities than by row crops. The reason is obvious—the entire top growth is removed as the harvestable portion of the crop in forages, but only the grain or seed is removed in most agronomic row crops. Of course, corn removed for grain plus removal of the stalks as fodder has the same effect on soil nutrient status as does removal for silage. In the United States, harvest of the alfalfa crop alone removes approximately 1.7 miUion tons of K annually. This is approximately 40% of all the K appUed annually for all purposes (Lanyon and Griffith, 1988). In the Pennsylvania Alfalfa Growers Program, uptake of 11 nutrients is given at yield levels from 9 to 18 Mg ha-^ (4.0-8.0 ton acre-^ Table 11.5).
TABLE 1 1 .4 Sufficiency Range in Plant Tissues for Nutrient Concentrations of Several Elements in Alfalfa and Corn
Nutrient
N(%)
P(%)
K(%)
Ca(%)
Mg(%)
Fe (mg kg-i)
B (mg kg-i)
Cu (mg kg-i)
Zn (mg kg-i)
Mo (mg kg"^)
Mn (mg kg"^)
Corn^ <30 cm tall
3.00-3.50
0.30-0.50
2.50-4.00
0.30-0.70
0.15-0.45
50-250
5-25
5-20
10-60
0.10-10.00
20-300
Corn^ prior to tasseling
3.00-3.50
0.25-.045
2.00-2.50
0.20-0.50
0.13-0.30
10-200
4-25
3-15
15-60
0.10-0.30
15-300
Corn^ at silking
2.70-4.00
0.25-0.50
1.70-3.00
0.21-1.00
0.20-1.00
20-250
5-25
6-20
25-100
0.10-0.20
20-200
Alfalfa^
4.50-5.00
0.26-0.70
2.00-3.50
1.80-3.00
0.30-1.00
30-250
30-80
7-30
21-70
1.00-5.00
31-100
^ Sample whole tops. ^ Sample leaf below the whorl. ^ Sample leaf subtending the ear. ^ Sample top 15 cm of new growth. Source: Mills and Jones, 1996.

202 I I I . GROWING AND PRODUCING FORAGE CROPS
TABLE 11.5 Removal of Eleven Elements from the Soil by an Alfalfa Crop Yielding from 9 to 18 Mg ha-^
Yield group
M g ha-i <9
9-11.2 11.2-13.4 13.4-15.7 15.7-17.9 >17.9
N
227 253 351 418 480 559
P
25 32 38 45 53 61
K
205 270 315 379 451 524
Ca
99 121 148 162 187 226
Nutrient
Mg
17 21 27 29 34 39
S
18 22 28 32 38 47
(kg ha-i)
B
0.22 0.28 0.34 0.37 0.41 0.48
Cu
0.06 0.07 0.08 0.09 0.10 0.12
Zn
0.18 0.24 0.29 0.31 0.34 0.40
Mn
0.40 0.53 0.57 0.74 0.90 0.87
Fe
1.09 1.16 1.58 1.76 1.80 2.15
Source: Lanyon, Baylor, and Waters, 1983.
A. NITROGEN
Nitrogen in soil solutions exists in the reduced, stable form as ammonium (NH4) or in the oxidized form as the NO3 ion. The NO3 form is very mobile and is readily leached by percolating water; thus the general concern for degradation of the environment through groundwater contamination by leached NO3. Ammonium is adsorbed as an exchangeable cation on soil colloids, and is therefore not readily leached by percolating water, but it is readily replaced, under soil temperatures conducive to plant growth, by potassium. The NH4 form, under normal soil temperatures, is converted readily to the nitrate form (FoUett and Wilkinson, 1985). Plant roots absorb N from the soil solution as inorganic NH4 and NO3 ion (Mengel and Kirkby, 1982). Ammonium-N accumulation in soils at low pH has been shown to occur, indicating that the microbes that effect nitrate production are inhibited at low pH values (Cornfield, 1952). Organic matter is the major source of soil N. Thus, a great reservoir exists when the organic matter concentration is high (Follett and Wilkinson, 1985).
Nitrogen is an integral part of all amino acids and proteins in plants. It is also part of the puric and pyrimidic bases, which makes it and essential component of deoxyribonucleic acid (DNA) and ribonucleic acid (RNA). Nitrogen is also a component of the tetra-pyrole ring of chlorophyll, nicotinamide dinucelotides (NAD+, NADH, NADPH), choline, and indolacetic acid, a growth regulator (Mills and Jones, 1996).
Nitrogen fertilizers, because they can form nitric acid in the soil, will under some conditions result in soils becoming more acid (Adams and Pearson, 1967). For example, after 4 years of fertilizing tropical grasses with 896 kg N ha" annually, a response to lime application was reported, whereas at the beginning of the study no response was measured. The initial soil pH was 4.0 (Vicente-Chandler et al, 1964).

1 1 . SOIL FERTILITY AND FORAGE PRODUCTION 2 0 3
Forms of N fertilizer include urea, 46% N; NH4NO3, 33% N; NH4SO4, 21% N; Ca(N03)2,15.5% N; NaNOs, 16.5% N; anhydrous ammonia (NH3), 82% N; and N solutions, 27 to 53% N (FoUett and Wilkinson, 1985). Some crops such as legumes have the ability to fix, convert dinitrogen to nitrate, in a symbiotic relationship with various Rhizobium species. Alfalfa has been identified as a crop than can fix 50 to 200 kg N ha"^ Nitrogen uptake may range from 90 to 211 kg N ha~\ with yields ranging from 1.9 to 10.5 Mg ha-i (Nuttall, 1980; Nuttall et al, 1980). Very high yields of alfalfa under intensive management (18 Mg ha"^) may remove as much as 500 kg N ha" (Table 11.4) indicating that under high-yield management, earlier estimates of N fixation are too low (Griffith, 1974). Other legumes fix lesser amounts of dinitrogen.
Attempts to augment the symbiotically fixed N in an alfalfa field with the application of N have not proved to be successful, however. It has been demonstrated that N appUcation is deleterious, causing stand reduction, decreased longevity, and greater invasion of weeds (Markus and Battle, 1965; Gerwig and Ahlgren, 1958). In postemergence studies, application of 100 kg N ha"^ tended to increase weeds and decrease alfalfa plants when weeds were present (Kunelius, 1974). When up to 363 kg N ha~^ as NH4NO3 per year was applied, it did not affect protein concentration over a 3-year period (Rhykerd et al, 1970). Therefore, there is no need to apply N to legume crops, because this practice is simply counterproductive. In addition to the deleterious effects Hsted previously, N concentration in the soil of more than 25 to 50 mg kg"\ causes inefficiencies in N fixation, and eventual shutdown of the N-fixing mechanism as 50 mg kg"^ is approached (Mussel-man, 1978).
The extent of volatilization of applied N depends on placement, soil, and environmental conditions. Ammonium nitrate usually has the highest recovery rate or uptake of applied N by the crop. Urea surface appUcation results in considerable N loss to volatilization. Liquid N sources result in some loss when surface applied. Anhydrous ammonia, which is the least expensive source of N, results in very low N volatilization losses if it is properly injected into the soil; otherwise, losses are extensive (Follett and Wilkinson, 1985). However, injection of anhydrous ammonia into soils planted to forage crops is not a practical option.
Nitrogen required to maintain production of forage crops must be geared to production goals, crop type, soil organic matter concentration, inorganic N in the soil, and soil-test results. Grasses on inorganic soils always require additions of N fertilizer, either in the commercial or organic manure form. Carbon-4-pathway grasses appear to be more efficient users of N that do C3 grasses. Legumes fix sufficient N for their needs and the needs of grasses grown in association with them if the legume makes up at least 40% of the plants in the sward.

2 0 4 I I I . GROWING AND PRODUCING FORAGE CROPS
B. PHOSPHORUS
Phosphorus deficiency in crops occurs worldwide. Sanchez and SaUnas (1981) reported that deficiency symptoms occur in 82% of the tropical soils in the Western hemisphere. Depending on parent material and amount removed, reserves can accumulate if overapplication is practiced (Thomas, 1989).
Roots absorb P mainly as H2P04^ Soil P concentrations are very low (0.007-1 mg kg"^) and are maintained by dissolution of inorganic P and mineralization of organic P. Uptake is thus influenced or regulated by fixed P in the soil, organic matter, and pH. Critical levels for soil extractable P concentration is between 17 and 37 mg kg'^ in humid regions and 6 to 10 mg kg" in less humid and arid regions. Desirable levels in the soil are crop dependent (Follett and Wilkinson, 1985). In the plant, minimum P concentration for alfalfa growth is 0.25% at the 1/10-bloom stage of development. Similar concentrations (0.23-0.29%) (Van Riper and Smith, 1959) are common for other legumes in the humid temperate zones (Reid et al.y 1970; Nelson and Barber, 1964).
Phosphorus is important in plants as integral components of enzymes, proteins, nucleic acids, adenosine triphosphate (ATP), lipids, and esters. In photosynthesis, light energy absorbed by the chlorophyll reduces nicotine adenine diphosphate (NADP) and synthesizes ATP. These two compounds serve as energy donors in energy transfer processes and numerous biosynthesis processes. Phosphorus enhances cell division, fat formation, flowering, fruiting, seed formation, and development of lateral and fibrous root systems (Follett and Wilkinson, 1985).
Phosphorus is readily fixed or made unavailable to the plant in some soils. Fixation depends on soil texture and acidity. Addition of P in extremely acid soils may not be profitable because a large share of the appUed P is fixed by Fe and Al compounds. Apphcation of lime usually improves this situation. The response of phosphate apphcation increased as the level of applied lime increased; pointing to the positive effect of P availability at high soil pH values (Helyar and Anderson, 1971). Species used in this study were Phalaris tuberosum, alfalfa, white and subterranean clovers, and perennial ryegrass, indicating that both grasses and legumes respond similarly.
The finer the soil texture and the more acid the soil, the greater is the fixation of P (Griffith, 1974). Movement of inorganic P in the soil, because of this fixation, is rather limited. The affect of soil pH on P uptake is linear in the pH range of approximately 4.8 to 7.4 (Y = -101.71 + 22.83X, r^ = 0.983, where X = soil pH and Y = F uptake). This study showed uptake amounts of 8.5 mg pot~^ at pH 4.8 to 65 mg P pot"^ at pH 7.4 (Mahler, 1983). Dry-matter production is also hnearly related to P uptake, ranging from 2.3 g pot"^ at a soil P concentration of 7 mg P pot'^ to 13 g pot"^ at 65 mg of soil P pot"^ (Fig. 11.6). Soils planted to alfalfa are depleted of P

1 1 . SOIL FERTILITY AND FORAGE PRODUCTION 205
o
2 0) (0
< o h-> •
X a.
O
14
12
10
8
6
4
2
0
n — ^ — \ — ^ — ^ — ' — r
0 10 20 30 40 50 60 70
PHOSPHORUS UPTAKE (mg pof^) Relationship between total P uptake (X axis) by alfalfa and total phyto-FIGURE 1 1.6
mass production (Y axis). (Redrawn from Mahler, 1983.)
at a more rapid rate than if the soil was planted to other crops. The greatest depletion is in the 15- to 30-cm zone, which, in one study (Lipps and Fox, 1956), was reduced 60.8%. The 30- to 45-cni zone was reduced 54%j 45 to 60, by 37%; 60 to 75, by 24%; and 79 to 90, by 16%. The zone 0 to 15 cm was reduced by 43%.
Phosphorus, as a fertilizer, is available in the following sources: (1) superphosphate, which contains 9% water-soluble P (derived from rock phosphate treated with H2SO4); (2) triple superphosphate, 20% water-soluble P (from rock phosphate treated with phosphoric acid); (3) ammonium phosphates, 7 to 33% watersoluble P (made by reacting ammonia and phosphoric acid); and (4) less soluble forms of P (e.g., basic slag or ground rock phosphate; FoUett and Wilkinson, 1985).
Phosphorus is very immobile, causing concern about surface-applied P and its effectiveness. Hanson and MacGregor (1966) demonstrated, in a 10-year study in which surface application was practiced, that P had moved below the 7.5 cm level in a Port Byron silt-loam soil. Jacobs et al (1970) found that there was a slight advantage with respect to production over a 4-year period, if P was incorporated. In a study where P was applied at 0, 48, 98, and 195 kg P ha~^ on ladino clover at planting time, annual surface supplemental application of 24 kg P ha"^ on the 98-kg treatment over a 7-year period was superior (Woodhouse, 1964). The 7-year average yield was not better than the 7-year average from plots receiving 195 kg P ha"^ However, by the time the seventh year was reached, the annual P treatment was yielding significantly more ladino hay. Similar results in a four-state alfalfa study were reported by Terman et al, (1960). In their Austrahan research, Ozanne and Petch (1978) found that the P fertilizer requirement

206 IN. GROWING AND PRODUCING FORAGE CROPS
for 90% maximum yield for subclover was 49 kg P ha~^ if the soil surface was cultivated to a depth of 20 cm, but only 28 kg P ha"^ if the P was surface apphed. Wolfe and Lazenby (1973), working in Austraha, reported tall fescue seedlings to be less dependent than white clover seedlings on banding of superphosphate. Banding has proved superior in seeding estab-hshment (see Chapter 9). Because of high fixation and the deep alfalfa rooting patterns, at least part of the requirement should be plowed down, with the remainder being placed on the surface (Griffith, 1974).
It is important to keep the P : K ratio of soils in balance. For soils testing low in both P and K, it appears that a P : K ratio of 1:4 should be apphed to maintain fertihty (Griffith, 1974). The removal ratio is, however, from 1:10 to 1:12.
C. POTASSIUM
Much has been written about potassium (K) and it role in forage production. The primary role of K in the plant is nutritional and metabohc (FoUett and Wilkinson, 1985). Potassium is not a constituent of any plant component, although it is vital to plant functions such as formation and translocation of sugars and starches, protein synthesis, stomatal action, and the cations associated with organic anions (Epstein, 1972). Mengel and Kirkby (1980) wrote an excellent review article on the role of K. They hst the various roles of K^ as transport across membranes, cell turgor and water economy of plants, energy metabohsm, long-distant transport, and enzyme activation.
Potassium is in three general forms in the soil (Follett and Wilkinson, 1985): (1) soluble K, which is free to move with soil water; (2) exchangeable K, held on soil colloids in equilibrium with soluble K; and (3) nonexchange-able K, held within the clay lattice or in primary minerals, which is thus not readily available to plants. Soluble and exchangeable K make up a very low percentage of total K in most soils. A limited amount of the total soil K is available annually in most soils. This amount may be adequate for relatively low-yielding forages, but crops such as alfalfa, a high-K requiring crop, or higher yields in all crops, require more K than can be released by the soil.
All K salts used as fertilizer are water soluble and have little effect on soil pH. Potassium chloride (KCl) is 40 to 52% K; KMgS04 is 19 to 25% and may be used where Mg is also required; KNO3 is 37% K and is an excellent source of both K and N for grasses, but cost limits its use (Follett and Wilkinson, 1985).
Potassium deficiency in orchardgrass was reported to be severe at a plant concentration of 1% (Kresge and Younts, 1962). In conjunction with N fertilization, the concentration of K required for optimum growth and yield increased as the amount of applied N increased. For example, at 56 kg N

1 1 . SOIL FERTILITY AND FORAGE PRODUCTION 207
ha"\ K was 2.15% and at 112 kg N ha"^ application, 2.68% K was required for optimum yields. In ladino clover (Brown, 1957), plant concentrations below 0.7% K resulted in deficiency symptoms. Other work (Blaser et al, 1958) showed that deficiency symptoms were expressed by plants with less than 1.0% K. Optimum yields were achieved if K percentage was greater than 2.6%. Near maximum growth was attained in experiments by Mc-Naught (1958) when plant K was at 1.81% in the leaves (all of them) and optimum concentrations of K in grasses is reported to be about 1.6% (McNaught, 1958). Blaser and Kimbrough (1968) reported that maximum yield of alfalfa could be achieved if plant K was between 2% and 2.5%.
There is a tendency for some plants to absorb far more K than is required for its metabolic processes. It is particularly a problem with legumes, especially alfalfa. From 2% to 3% K is usually sufficient for forages such as alfalfa, ladino clover, orchardgrass, and smooth bromegrass. Yet it is common for these plants to have K concentrations from 3.5% to 4.5%. Thus, fertilization of pure stands should not exceed that level required to raise the soil K concentration to the medium to high level, depending on the yield (FoUett and Wilkinson, 1985). Annual summer applications of K greatly reduce the trend toward luxury consumption by alfalfa, which is a particular problem in spring growth (Blaser and Kimbrough, 1968). When soils not needing fertilizer are fertilized, no increase in yield occurs; but luxury consumption is prevalent. Thus, economical considerations and common sense must dictate fertilizing practices.
Stand longevity and yield of alfalfa is closely tied to K nutrition. At rates of K ranging from 0 to 1792 kg K ha"\ residual yields and stand maintenance among treatments receiving either KCl or K2SO4 did not differ (Rominger et al.y 1976). Compared to the check, zero K applied, residual yields and stands after 2 years of treatment were significantly greater if K was appUed. Residual stands ranged from 50% (check) to 64 to 81% for the K treatments. Residual yields ranged from 3.43 Mg ha~^ (check) to 4.89 for the highest K treatment. Proper soil liming and K application (179 kg K ha"^ annually) increased the stand life of alfalfa grown in imperfectly drained soil. In the fifth year, plots receiving the K appUcation produced 4.0 Mg ha"^ more than those receiving no K (Brown, 1963). If a soil is low to medium in exchangeable K, maintenance of a vigorous, high-producing stand of alfalfa requires fertilizer applications high in K (Blaser and Kimbrough, 1968). In this 9-year study, they showed that maintaining a pure stand of alfalfa that was productive required 186 kg K ha"^ annually. With no K applied, 2.5 Mg ha~^ was produced from a stand that included 0.75 alfalfa plants m" . Applying 186 kg K ha"^ resulted in dry-matter production of 8.1 Mg ha"^ from a stand of 4.5 plants m~ . At 280 kg K ha"\ K accumulated in the surface soil layer. Parks and Safley (1961) reported increases in dry-matter production with annual appUcations of up to 279 kg K ha"^ Initial
208 I I I . GROWING AND PRODUCING FORAGE CROPS
soil tests showed K at 178 kg ha"^ Soil K depletion did not occur at annual K application rates above 279 kg K ha ^
In humid areas, K depletion may occur within 2 to 3 years without addition of fertilizer. Initial apphcation of 135 kg K ha"^ was not sufficient to maintain soil fertihty because annual removal of K averaged 164 kg ha~^ yr"^ (Peck et ai, 1969). In two northwestern Pennsylvania soils prone to wetness, (Alva et al., 1986), K apphcation resulted in an increase in alfalfa dry-matter production. Economic rates for the 3-year period ranged from 137 to 263 kg K ha~^ Herbage K concentrations of 16 to 19.5 g kg"^ were necessary to produce 90% of the maximum yield the first harvest year. Response of bermudagrass to K applications of 140 kg ha"^ was 36 and 129% in 1983 and 1984, respectively, but above 280 kg ha"^ no significant response to K apphcation was measured (Cripps et al., 1988).
In arid, irrigated soils, Barberick (1985) showed that even though the soil K was high, small but significant responses could be attained from application of K in Colorado. However, the economics related to fertilization would dictate that one should not practice K application on such soils. He postulated that K addition suppressed Na uptake, which possibly resulted in greater dinitrogen fixation and dry-matter production. This postulation is supported by the work of Huffaker and Wallace (1959), who reported K inhibition of Na uptake in corn, soybean, and radish in solution culture. Inhibition was greater when Na concentration was at its highest concentration.
Whether to use KCl or K2SO4 is a question that is sometimes asked. Both are equally effective in supplying K needs of crops. Deleterious effects of high concentrations of CI in soils have been shown to result in lowered dry-matter yields (Eaton, 1972; Griffith, 1974; Hall, 1971; Smith, 1971; Smith and Peterson, 1975). Concentrations of chlorine greater than 1.5% in the first harvest weakened alfalfa by killing young stems and resulted in a slight decrease in yield (Smith and Peterson, 1975). Concentrations this high may be reached with apphcations of KCl of more than 675 kg K ha~^ (603 lb acre"^); therefore, if large levels of K are required to amend the soil K status, it may be wise to split the apphcation among 2 years (Smith and Peterson, 1975). Application of up to 111 kg CI ha"^ (100 lb acre"^) from KCl had no negative affect on alfalfa or birdsfoot trefoil yields over a 3-year period. In the third year, a significant increase in yield was shown by alfalfa (Moyer et al., 1994), indicating that under normal conditions CI toxicity is not a problem. In association with harsh winters, similar to those that occur in the northcentral states of Wisconsin, Minnesota, and Michigan, an increase in plant death has been reported to occur in association with high CI applications (LeCroix, 1969). In a study by Rominger et al (1976), in which the two forms were compared, it was shown that at rates above 448 kg K ha"^ yr~^ (400 lb acre"^) as KCl resulted in a reduction in yield. This is a response by the plants to the higher concentrations of CI in the
1 1 . SOIL FERTILITY AND FORAGE PRODUCTION 2 0 9
soil, but it only influenced yields during the application year. Soils containing 205 kg ha"^ of exchangeable K that received 672 kg K ha"^ (600 lb acre"^) as KCl resulted in damage to the alfalfa. In the sulfate form, however, equivalent amounts of K did not damage the stand, presumably because of the absence of CI in the second case (Smith, 1971). Movement of the chloride ion ( C I ) in soils is rapid. Thus, the effect of high CI concentration in the soil does not affect alfalfa in the second year, or the first year after application of large amounts of KCl (Smith and Peterson, 1975). When K was apphed as K2SO4, however, modest yield increases continued to occur at 896,1344, and 1792 kg K ha"^ yr'^ (800,1200, and 1600 lb K acre'^ yr '^ Rominger et al, 1976).
Potassium may be lost through leaching, particularly in sandy soils. Kilmer (1974) concluded that although such losses probably do not exceed 10 to 12 kg ha-i (8.9-10.1 lb acre'^), Truog and Jones (1938) reported that K leaching losses from cultivated soils may exceed 27 to 41 kg ha"^ (24-37 lb acre-i).
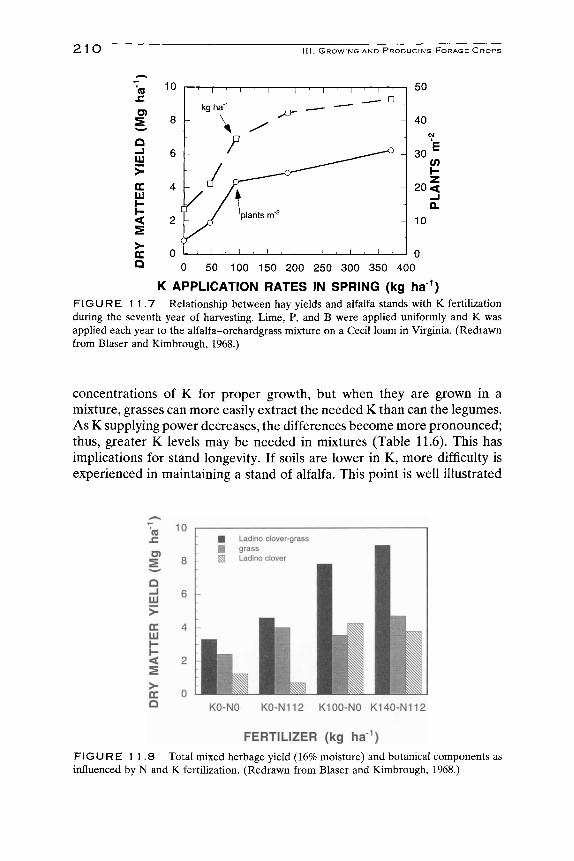
If adequate amounts of K are supphed for growth, time of apphcation is generally not important (Griffith, 1974). In the fall after the last harvest is an ideal time because of weather, work load, and price received from industry, to apply K. On soils low in K, at least annual applications of K are required to maintain production (Overdahl, 1972; Hanson and MacGregor, 1966) and assure stand longevity (Markus and Battle, 1965). If high rates of K are required, split apphcations after the first and last harvests may be advisable. Rhykerd and Overdahl (1972) showed some temporary injury to the plants when very high rates of K are apphed early in the spring. Legumes grown on light, sandy soils, under irrigation, or with extended growing seasons require more than one K application for sustained crop growth (Griffith, 1974). Kresge and Younts (1962) and Brown (1957) have shown that for soils requiring regular apphcation of K, improved yields result from more than one application per year. Benefits of such practices must, however, be weighed against added cost of application. There is some advantage to applying the annual apphcation after the first harvest (Blaser and Kimbrough, 1968). For example, spring application resulted in only 8.5 Mg ha"^ (3.8 ton acre"^); spring and after second cutting produced 8.6 Mg ha~^; after the first harvest, yield was 9 Mg ha~^ (4.0 ton acre"^). This concept is illustrated by Fig. 11.7. Soils with low cation exchange capacity (CEC) and low release rates of residual and nonexchangeable K require frequent, relatively smaU K applications, (i.e., sandy soils). Soils with high CECs and high release rates of residual and nonexchangeable K can be fertilized less frequently (FoUett et al, 1985).
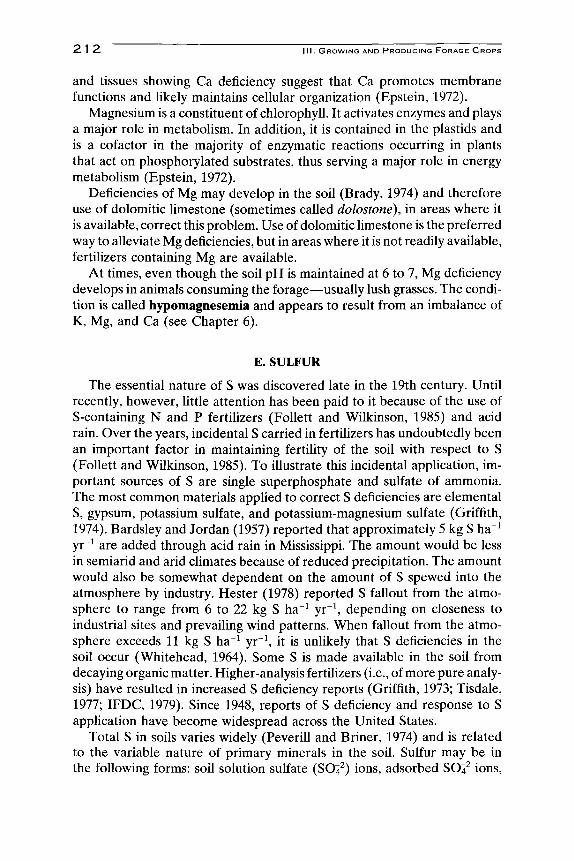
In grass-legume mixtures, it is important to keep the K concentration in the soil at adequate levels. In situations in which soil K is low, grasses dominate and legumes are lost from the stand because they are not able to obtain sufficient K (Fig. 11.8). Legumes and grasses require similar
2 1 0 I I . GROWING AND PRODUCING FORAGE CROPS
(0
O)
UJ >-
LU
>-
Q 100 150 200 250 300 350 400
K APPLICATION RATES IN SPRING (kg ha ) FIGURE 1 1.7 Relationship between hay yields and alfalfa stands with K fertilization during the seventh year of harvesting. Lime, P, and B were applied uniformly and K was applied each year to the alfalfa-orchardgrass mixture on a Cecil loam in Virginia. (Redrawn from Blaser and Kimbrough, 1968.)
concentrations of K for proper growth, but when they are grown in a mixture, grasses can more easily extract the needed K than can the legumes. As K supplying power decreases, the differences become more pronounced; thus, greater K levels may be needed in mixtures (Table 11.6). This has implications for stand longevity. If soils are lower in K, more difficulty is experienced in maintaining a stand of alfalfa. This point is well illustrated
(0 SI O)
o -J UJ
>-cc liJ h-I -<
> cc o KO-NO K0-N112 K100-N0 K140-N112
FERTILIZER (kg ha"") FIGURE 1 1.8 Total mixed herbage yield (16% moisture) and botanical components as influenced by N and K fertilization. (Redrawn from Blaser and Kimbrough, 1968.)

1 1 . SOIL FERT
T A B L E 1 1
K applied
iLiTY AND F O R A G E
. 6 Percentage
K
Grass
PRODUCTION
of K in Orchardgrass-
(% of DW)
Alfalfa
-Alfalfa Stands
% K i n
21 1
alfalfa relative to grass
0 2.71 0.70 26 46.5 3.46 1.21 35 93 4.01 1.78 42
372 3.85 3.53 92
Source: Blaser and Kimbrough, 1968.
by the work cited by Griffith (1973; Table 11.7). For mixed stands of grasses and legumes, split application of fertilizer, generally in the fall and after first grazing or harvest in the spring, improve overall yield and quality (Griffith, 1973).
D. CALCIUM AND MAGNESIUM
Humid area soils are generally low in Ca because leaching has occurred over the years. Liming readily corrects this problem. Plant concentration is usually far in excess of the metabolic needs (0.2 to several percent; Epstein, 1972), whereas the requirement is only 2 mg kg~ (Wallace et al, 1966). Arid region soils are high in Ca.
Calcium is the major cation of the middle lamella of cell walls and calcium pectate is a principal constituent of cell walls. Calcium is required for normal growth in the growing points of plants; without it they cease proper growth and, in extreme cases, die. General disorganization of cells
TABLE 1 1.7 Influence of K Application on Maintaining a Legume in a Grass-Legume Stand
Fertilizer rate Yield Forage mixture (kg ha"^) (Mg ha~ ) Legume (%)
Alfalfa-bromegrass
Alfalfa-orchardgrass
Ladino-orchardgrass
Ladino-tall fescue
0 279
0 279
0 279
0 279
4.45 9.15
4.60 6.25
4.19 6.79
4.57 5.96
73 90
27 46
7 12
8 28
Source: Griffith, 1973.
2 1 2 I I I . GROWING AND PRODUCING FORAGE CROPS
and tissues showing Ca deficiency suggest that Ca promotes membrane functions and Ukely maintains cellular organization (Epstein, 1972).
Magnesium is a constituent of chlorophyll. It activates enzymes and plays a major role in metaboUsm. In addition, it is contained in the plastids and is a cofactor in the majority of enzymatic reactions occurring in plants that act on phosphorylated substrates, thus serving a major role in energy metabolism (Epstein, 1972).
Deficiencies of Mg may develop in the soil (Brady, 1974) and therefore use of dolomitic limestone (sometimes called dolostone), in areas where it is available, correct this problem. Use of dolomitic limestone is the preferred way to alleviate Mg deficiencies, but in areas where it is not readily available, fertilizers containing Mg are available.
At times, even though the soil pH is maintained at 6 to 7, Mg deficiency develops in animals consuming the forage—usually lush grasses. The condition is called hypomagnesemia and appears to result from an imbalance of K, Mg, and Ca (see Chapter 6).
E. SULFUR
The essential nature of S was discovered late in the 19th century. Until recently, however, little attention has been paid to it because of the use of S-containing N and P fertilizers (FoUett and Wilkinson, 1985) and acid rain. Over the years, incidental S carried in fertilizers has undoubtedly been an important factor in maintaining fertility of the soil with respect to S (Follett and Wilkinson, 1985). To illustrate this incidental application, important sources of S are single superphosphate and sulfate of ammonia. The most common materials applied to correct S deficiencies are elemental S, gypsum, potassium sulfate, and potassium-magnesium sulfate (Griffith, 1974). Bardsley and Jordan (1957) reported that approximately 5 kg S ha~^ yr~^ are added through acid rain in Mississippi. The amount would be less in semiarid and arid climates because of reduced precipitation. The amount would also be somewhat dependent on the amount of S spewed into the atmosphere by industry. Hester (1978) reported S fallout from the atmosphere to range from 6 to 22 kg S ha~^ yr"\ depending on closeness to industrial sites and prevaihng wind patterns. When fallout from the atmosphere exceeds 11 kg S ha"^ yr~\ it is unlikely that S deficiencies in the soil occur (Whitehead, 1964). Some S is made available in the soil from decaying organic matter. Higher-analysis fertilizers (i.e., of more pure analysis) have resulted in increased S deficiency reports (Griffith, 1973; Tisdale, 1977; IFDC, 1979). Since 1948, reports of S deficiency and response to S application have become widespread across the United States.
Total S in soils varies widely (Peverill and Briner, 1974) and is related to the variable nature of primary minerals in the soil. Sulfur may be in the following forms: soil solution sulfate (S04^) ions, adsorbed S04^ ions.

1 1 . SOIL FERTILITY AND FORAGE PRODUCTION 2 1 3
organically bound ester S04^, and organic S compounds (FoUett and Wilkinson, 1985). In warmer areas (subtropics and tropics), soil-adsorbed S is higher and temperate regions show a predominance of organic S and esters (IFDC, 1979; Laughlin et al, 1981). Surface soils (plow layer) in the southeastern United States are commonly low in extractable S (Bardsley and Jordan, 1957). A regional study has shown that most soils release approximately 6.7 kg S ha"^ or less with extraction by sodium acetate-acetic acid (Morgan's solution). However, just below the plow layer in most of these soils, S accumulates. Sulfur deficiencies often occur in grasses grown in southcentral Alaska (Laughlin et al, 1981). Deficiencies have also been reported in Nebraska on highly leached, sandy, and low organic-matter soils (Fox et al, 1964). Six years of continuous alfalfa also resulted in development of S deficiencies in other soil types. Griffith (1974) stated that although many soils appear to have sufficient S, they may be expected to show S deficiency when managed for high-forage yields.
Sulfur is taken up by plants in the sulfate (S04^) form (Follett and Wilkinson, 1985). Most legumes are particularly high users of sulfur (S) when compared with grasses (Bardsley and Jordan, 1957). Alfalfa and clovers cut for hay remove 22 to 28 kg S ha'^ annually.
Expression of deficiency is usually expressed as leaf chlorosis (Bardsley and Jordan, 1957). Deficiency results in incomplete N assimilation and, consequently, affects protein metabolism (Bardsley and Jordan, 1957). The main effect of S appears not to be on nodulation of legumes or N supply, but on N assimilation (Cairns and Carson, 1961). Nutrient deficiencies affect plant yield and forage quality through changes in the synthesis of the amino acids, the building blocks of proteins, cystine, cysteine, and methionine. Chlorophyll formation and synthesis of vitamins such as biotin, thiamine, and vitamin B are also affected by S deficiency (Follett and Wilkinson, 1985). Soils low in S provide greater yield and increased quality in response to S application.
Conrad et al (1948) reported a fourfold increase in alfalfa dry matter with appUcation of S in California. On two soils that gave a positive response to S application in Nebraska, it was shown by Sorenson et al. (1968) that N percentage also increased when compared to the control. Plants were at the l/lO-fuU bloom stage of development. Bardsley and Jordan (1957), in a study including seven soils on the effects of S apphcation, found that whiteclover produced without added S was lower in S and N concentrations, and the concentration of methionine and cystine in the forage was lower. Soils considered to be sufficient in S have been shown by Caldwell et al (1969) and Seim et al (1969) to yield twice as much alfalfa when S was applied as elemental S or gypsum (4.0 vs. 9.5 Mg ha"^).
A survey of soils in Wisconsin revealed a response of alfalfa to S application on 6 of 9 sandy loam soils (Hoeft and Walsh, 1970; Rand et al, 1968). The sulfate form of S was more effective than was the elemental form in
2 1 4 I I I . GROWING AND PRODUCING FORAGE CROPS
eliciting a response. In Minnesota, soils with less than 7.0 mg kg"^ usually show S deficiency; 7 to 12 mg kg"^ concentrations in the soil may possibly show S deficiencies; and more than 12 mg kg~^ shows no deficiencies (Grava, 1971; Beaton et ai, 1968). Beaton indicates that no response to S application may be expected when the soil S is in the 10 to 12 mg kg"^ range.
Losses of S from soils can be rather large. Sandy soils and soils low in organic matter need more frequent S fertilization than do heavier-textured soils. Soils low in S but capable of high yields may respond more favorably, and more efficiently, to annual S applications. Incorporation of S into the soil has not been found to be important (Griffith, 1974).
An in-plant S concentration of approximately 0.16% is considered to be the critical level (Martin and Matocha, 1973). Rominger et al (1976) suggested that a plant concentration of 0.2% could serve as a guidehne for S needs. In whiteclover, the seventh harvest, without S apphcation, showed tissue concentrations of 0.08 to 0.14% and 0.20 to 0.30% with S application (Bardsley and Jordan, 1957). Bear and Wallace (1950) and Harward et al (1962) suggest that S concentration should be between 0.20% and 0.22% of dry weight. Sorenson et al. (1968) and Caldwell et al (1969) have identified the favorable concentration to be higher—0.3% or more. Westerman (1975), on 13 sites in southern Idaho, found only one site produced optimum alfalfa with an S concentration in the tops of less than 0.20%. This indicates that there is some soil-dependent variabihty in response to S required for optimum yield. However, the majority of the soils held to the 0.20% dictate. In this study, the maximum forage yields were obtained when the tops of alfalfa plants contained 0.15 to 0.20% S. Alfalfa also showed a similar increase in yield as the S in the tops increased from 0.05 to 0.211%. At the lower S concentration yield was 40% of the yield at the higher concentration. Relative yield is expressed in the following equation:
RY = -190.73 - 1310.85(%S) + 1233.14 \ / % S (11.1)
where RY\^ relative yield. The coefficient of determination {R^) was 0.934. The N: S ratio in the plant could be used in conjunction with the soil
test to make a more accurate prediction of S requirements of alfalfa. There are times when soil S tests indicate a deficiency, but no response to applied S is observed; vice versa, a soil test may indicate that S is not needed, but a response is observed (Nuttall, 1985b). A N: S ratio of 12 in the plant tops produced optimum yields of dry matter; but no response of alfalfa to S fertilization was measured unless the N:S ratio was greater than 17 (Westerman, 1975). Under very severe S stress, the N: S ratio increased to 30 in this study. The work of Westerman (1975), Dijkshoorn et al (1960), and Stewart and Porter (1969) indicates that the N:S ratio for legume tissues is near 17.5:1, above which a response to S fertilization can provide a yield increase, but below which no increase generally is realized. Nuttall (1985a,b) showed that a range of 14:1 to 21:1, in plant N:S ratio, was
1 1 . SOIL FERTILITY AND FORAGE PRODUCTION 2 1 5
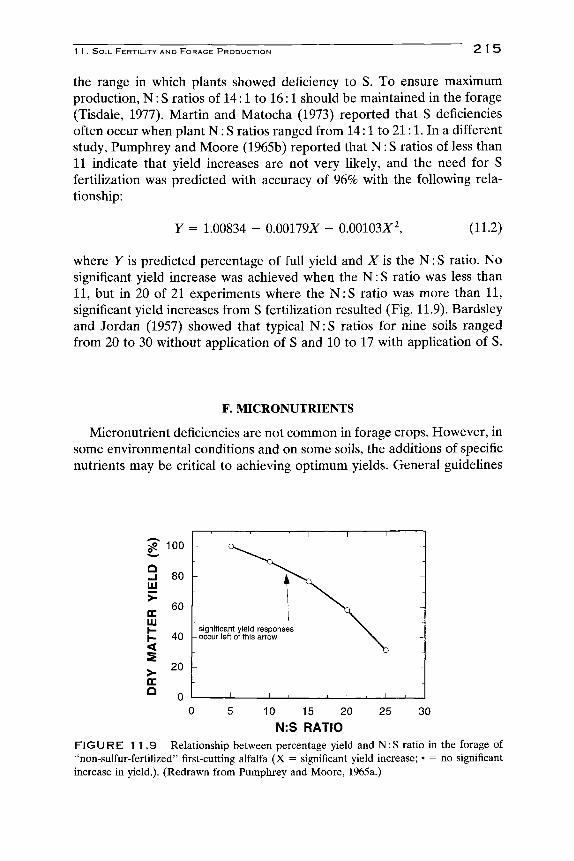
the range in which plants showed deficiency to S. To ensure maximum production, N: S ratios of 14:1 to 16:1 should be maintained in the forage (Tisdale, 1977). Martin and Matocha (1973) reported that S deficiencies often occur when plant N : S ratios ranged from 14:1 to 21:1. In a different study, Pumphrey and Moore (1965b) reported that N : S ratios of less than 11 indicate that yield increases are not very likely, and the need for S fertilization was predicted with accuracy of 96% with the following relationship:
Y = 1.00834 - 0.00179X - 0.00103^^, (11.2)
where Y is predicted percentage of full yield and X is the N: S ratio. No significant yield increase was achieved when the N : S ratio was less than 11, but in 20 of 21 experiments where the N :S ratio was more than 11, significant yield increases from S fertilization resulted (Fig. 11.9). Bardsley and Jordan (1957) showed that typical N : S ratios for nine soils ranged from 20 to 30 without application of S and 10 to 17 with application of S.
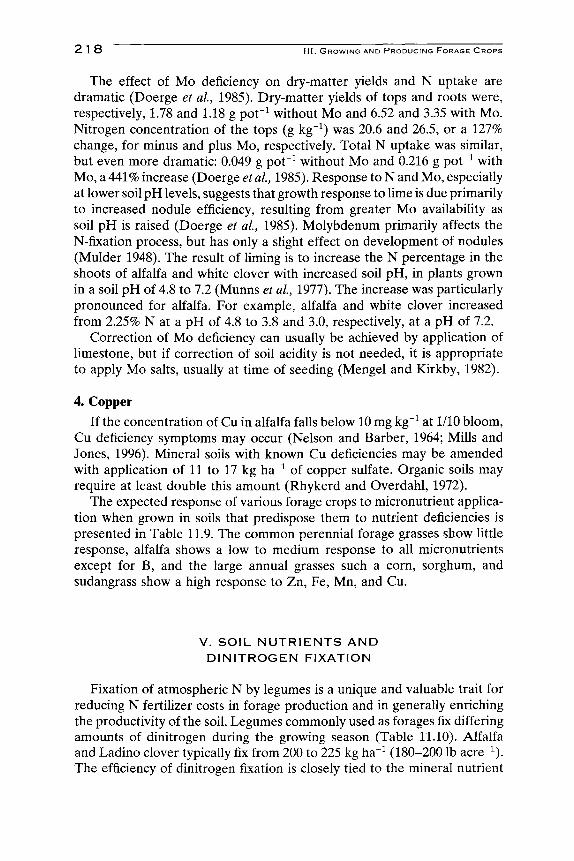
F. MICRONUTRIENTS
Micronutrient deficiencies are not common in forage crops. However, in some environmental conditions and on some soils, the additions of specific nutrients may be critical to achieving optimum yields. General guidehnes
^ 100
3 80 Ul
a: HI
a: o
60
40
20
significant yield responses -occur left of this arrow
10 15 20
N:S RATIO 25 30
FIGURE 1 1 . 9 Relationship between percentage yield and N : S ratio in the forage of "non-sulfur-fertilized" first-cutting alfalfa (X = significant yield increase; • = no significant increase in yield.). (Redrawn from Pumphrey and Moore, 1965a.)

2 1 6 Ml. GROWING AND PRODUCING FORAGE C R O P S
for deficient, normal, and toxic levels of six micronutrients are presented in Table 11.8.
In general, deficiency of micronutrients can be corrected by applying salts of the deficient nutrient to the soil or chelates sprayed on the plant. Rate of application must be watched carefully because an overdose will result in severe toxicity problems. Micronutrients should not be added unless their need can be clearly established (Follett and Wilkinson, 1985).
1. Boron
Boron (B) is frequently deficient in some soils and expresses itself in legumes in abnormal growth of the growing point. This is especially true for crops grown on light-colored, sandy soils in humid regions. Deficiency is sometimes associated with soil type, areas of moderate to heavy precipitation, neutral or alkaline soils, dry weather, and high light intensity (Lucus and Knezek, 1972). In general, among forage crops only the legumes consistently show B deficiencies. Mahler et al (1985) reported that a rotation rich in leguminous crops such as alfalfa, beans, and clover required more B than did a rotation high in cereal crops. Legumes, but especially alfalfa, are sensitive to low concentrations of B in the soil. Use of B in alfalfa fertilizers is a common practice, and B deficiency is easily corrected with application of 1 to 3 kg ha"^ of actual B (0.9-2.7 lb acre"^). Application with other fertilizers is preferable in both preplant and maintenance operations. Light-textured, permeable soils should receive annual applications of B because of the danger of leaching losses when large amounts are applied (Griffith, 1974).
Availability of B to plants is related to the decomposition of organic
T A B L E 1 1 . 8 Essential Trace Elements and Important Parameters for Soils, Plants, Deficiency, and Toxicity
Element
Boron
Cobalt
Copper
Manganese
Molybdenum
Zinc
Soil (mg k%-y
10 (2-100)
8 (1-40)
20 (2-100)
850 (100-4000)
2 (0.2-5)
50 (10-300)
Plant (mg kg-i)
0.05-0.5
4-15
15-100
1-100
8-15
Deficient (mg kg-i)
5-30
<4.0
<0.1
Toxic (mg kg-i)
>75
>20
>200
Comment
Wide species difference
Legumes require <0.02
Toxicity depends on Fe:Mn ratio
Low toxicity
^ Desirable (range) concentration in soils. Source: Allaway, 1968.

1 1 . SOIL FERTILITY AND FORAGE PRODUCTION 2 1 7
matter, soil texture, and soil pH (Griffith, 1974). Boron is held by the organic fraction of the soil and is released as decomposition occurs. Low pH inhibits activity of microorganisms and reduces the rate of B release. Clay fractions of soils also hold some B, but it is easily leached unless it is used by the plants. Excess lime may also reduce B availability (Wear and Patterson, 1962).
It is recommended that 21 to 80 mg kg'^ is a sufficient range in the top 7.5 cm of alfalfa sampled before flowering begins (Ohio State University, 1972). Generally, healthy alfalfa contains approximately 35 mg kg"^ B, and a response to B application is expected when B concentration drops below 20 mg kg~^ (Nelson and Barber, 1964). Boron is relatively immobile in the plant, and the youngest growth generally first show deficiency symptoms. Thus, in alfalfa and other legumes, it is expressed in the terminal bud. To correct B deficiency, the most commonly used material is borax, which contains 11% B. More concentrated forms, with up to 20% B, are also available.
2. Zinc Alfalfa is capable of absorbing zinc (Zn) from soils considered to be Zn
deficient for other crops (Brown et al, 1964). Thus, Zn deficiency has rarely been reported in alfalfa or clover (Nelson and Barber, 1964). Shitao and Reisnauer (1968) showed no response to Zn addition when plant-leaf Zn concentrations exceeded or equaled 6 mg kg"^ Their work caused them to conclude that alfalfa has a lower Zn requirement than do other crops. The range for Zn sufficiency in alfalfa is reported to be 21 to 70 mg kg"^ in the top 7.5 cm of growth when sampled prior to initial flowering (Ohio State University, 1972; Mills and Jones, 1996). Zinc deficiency in other legumes and in grasses other than corn and grain sorghum is not well documented.
3. Molybdenum Normal alfalfa plants contain about 2 mg kg~ of molybdenum (Mo),
and deficiency occurs at about 0.5 mg kg~ or less (Nelson and Barber, 1964; Mills and Jones, 1996). Deficiency symptoms appear similar to N deficiency in legumes. Molybdenum is required in N fixation and in protein formation; thus, Mo deficiency results in N starvation of the plant. Yield increases, in response to addition of Mo, of 482, 141, 25, and 6% at pH levels of 5.0,5.3,5.7, and 6.0, respectively, were reported in Virginia (Jones and Moschler, 1966), thus, showing the effect of pH on Mo availability. Nitrogen concentration of alfalfa also increased as pH increased. This suggests that the soil contained sufficient Mo for normal alfalfa growth, but Mo, due to the pH, was not available. This is a common circumstance in many acid soils for Mo. Thus, most Mo deficiency symptoms appear in crops grown on acid soils.
2, 1 O I I I . GROWING AND PRODUCING FORAGE CROPS
The effect of Mo deficiency on dry-matter yields and N uptake are dramatic (Doerge et al, 1985). Dry-matter yields of tops and roots were, respectively, 1.78 and 1.18 g pot"^ without Mo and 6.52 and 3.35 with Mo. Nitrogen concentration of the tops (g kg"^) was 20.6 and 26.5, or a 127% change, for minus and plus Mo, respectively. Total N uptake was similar, but even more dramatic: 0.049 g pot~^ without Mo and 0.216 g pot~^ with Mo, a 441% increase (Doerge etal, 1985). Response to N and Mo, especially at lower soil pH levels, suggests that growth response to lime is due primarily to increased nodule efficiency, resulting from greater Mo availability as soil pH is raised (Doerge et al., 1985). Molybdenum primarily affects the N-fixation process, but has only a slight effect on development of nodules (Mulder 1948). The result of liming is to increase the N percentage in the shoots of alfalfa and white clover with increased soil pH, in plants grown in a soil pH of 4.8 to 7.2 (Munns et al, 1977). The increase was particularly pronounced for alfalfa. For example, alfalfa and white clover increased from 2.25% N at a pH of 4.8 to 3.8 and 3.0, respectively, at a pH of 7.2.
Correction of Mo deficiency can usually be achieved by application of Umestone, but if correction of soil acidity is not needed, it is appropriate to apply Mo salts, usually at time of seeding (Mengel and Kirkby, 1982).
4. Copper
If the concentration of Cu in alfalfa falls below 10 mg kg"^ at 1/10 bloom, Cu deficiency symptoms may occur (Nelson and Barber, 1964; Mills and Jones, 1996). Mineral soils with known Cu deficiencies may be amended with application of 11 to 17 kg ha"^ of copper sulfate. Organic soils may require at least double this amount (Rhykerd and Overdahl, 1972).
The expected response of various forage crops to micronutrient application when grown in soils that predispose them to nutrient deficiencies is presented in Table 11.9. The common perennial forage grasses show little response, alfalfa shows a low to medium response to all micronutrients except for B, and the large annual grasses such a corn, sorghum, and sudangrass show a high response to Zn, Fe, Mn, and Cu.
V. SOIL N U T R I E N T S AND D IN ITROGEN FIXATION
Fixation of atmospheric N by legumes is a unique and valuable trait for reducing N fertilizer costs in forage production and in generally enriching the productivity of the soil. Legumes commonly used as forages fix differing amounts of dinitrogen during the growing season (Table 11.10). Alfalfa and Ladino clover typically fix from 200 to 225 kg ha'^ (180-200 lb acre^^). The efficiency of dinitrogen fixation is closely tied to the mineral nutrient
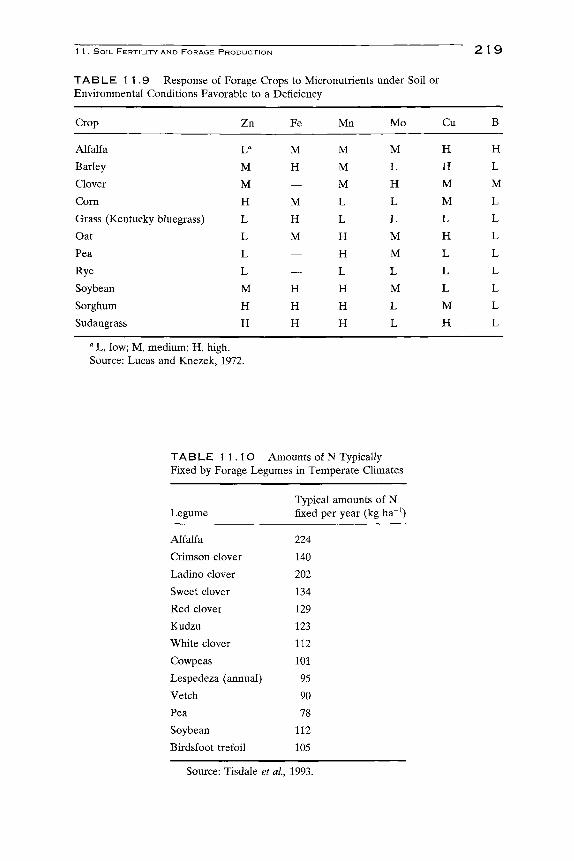
1 1 . SOIL FERTILITY AND FORAGE PRODUCTION 2 1 9
T A B L E 1 1 . 9 Response of Forage Crops to Micronutrients under Soil or Environmental Conditions Favorable to a Deficiency
Crop
Alfalfa
Barley
Clover
Corn
Grass (Kentucky bluegrass)
Oat
Pea
Rye
Soybean
Sorghum
Sudangrass
Zn
L«
M
M
H
L
L
L
L
M
H
H
Fe
M
H
— M
H
M
— — H
H
H
Mn
M
M
M
L
L
H
H
L
H
H
H
Mo
M
L
H
L
L
M
M
L
M
L
L
Cu
H
H
M
M
L
H
L
L
L
M
H
B
H
L
M
L
L
L
L
L
L
L
L
^ L, low; M, medium; H, high. Source: Lucas and Knezek, 1972.
T A B L E 11 .1 O Amounts of N Typically Fixed by Forage Legumes in Temperate Climates
Legume
Alfalfa
Crimson clover
Ladino clover
Sweet clover
Red clover
Kudzu
White clover
Cowpeas
Lespedeza (annual)
Vetch
Pea
Soybean
Birdsfoot trefoil
Typical amounts of N fixed per year (kg ha"^)
224
140
202
134
129
123
112
101
95
90
78
112
105
Source: Tisdale et al, 1993.

220 III. GROWING AND PRODUCING FORAGE CROPS
Status of the soil in which the legume is grown. The elements most critical are discussed in the following section.
A. NITROGEN
Nitrogen appHcation rates greater than 25 to 50 kg ha"^ (22.5-45 lb acre"^) apphed to alfalfa prior to stand estabhshment did not enhance yield during the first year (Kunehus, 1974). Nodule weight and number decreased significantly if more than 25 kg ha"^ was added. There were 1.6 nodules per plant at 0 N to 1.4 at 25 N and 0.3 at 50 and 100 kg N ha'^ (45-90 lb acre"^). Weight per nodule declined 35% when 25 kg N ha'^ was applied. Further significant decreases occurred with application of 50 or 100 kg N ha~^ over two experiments (Kunehus, 1974). A report by Munns (1968b) indicates that nitrate concentrations of 2 mMin the growth solution reduced the number of root hairs by 95%, curled root hairs by 99%, and nodules by 98% per plant.
B. POTASSIUM
Potassium concentration of the soil has a major effect on dinitrogen fixation. Collins et al (1986) demonstrated that dinitrogen fixation was increased 2.8 times with the addition of 224 kg K ha"^ (200 lb acre"^) on a sandy soil and 1.7 times on a loam soil. Over the K treatments of another study, Duke et al (1980) demonstrated that a linear correlation (P < 0.01) resulted between nodule number and N fixation (acetylene reduction rate) as K availabihty was increased. They also showed that high rates of K, as either sulfate or chloride, increased nodulation and dinitrogen fixation when compared to the control plants (approximately 2.5 times). On a per-plant basis, increases were shown to be due to increased nodule mass instead of greater activity per unit of nodule mass.
C. CALCIUM
Evidence suggests that the most calcium-demanding factor in dinitrogen fixation is infection initiation. It is also the most acid-sensitive stage of nodulation (Munns, 1970). In support of this, Mulder and Van Veen (1960) showed that addition of CaCOs (1 to 2 g) to 500 g of acid soil, after an incubation period of about 4 weeks, resulted in normal nodulation of red clover plants. This suggests that R. trifolii are unable to grow in acid soils.
D. SULFUR
Dinitrogen fixation may not respond to S appHcation alone, but when combined with other elements such as P or K, a significant response may

1 1 . SOIL FERTILITY AND FORAGE PRODUCTION 2 2 1
be realized. Collins et al (1986) showed that there was no response in nodule number when S was applied alone. However, when apphed with 56 kg P ha"^ (50 lb acre"^), the nodule number per core increased from 18.5 to 32.9—a 1.7-fold increase. High K application rates (448 kg K ha'^ or 400 lb acre-i) in conjunction with S at 28 kg S ha"^ (25 lb S acre'^) resulted in significantly higher dinitrogen fixation than did other treatments in which K apphcation was one-half the previously mentioned rate (Colhns et al, 1986). The increase was from 372 to 644 nmol core~^ hr"^
E. BORON
Boron deficiency inhibits dinitrogen fixation by preventing the growth of nodule tissue (Munns, 1977).
F. MOLYBDENUM
Molybdenum serves an essential role in N fixation (Mulder, 1948; Post-gate, 1985), and it is the only micronutrient that becomes more available as soil pH increases. As pH decreases, the decrease in Mo in the soil solution is due to absorption by acid, hydrated haloysite (Stout et al, 1951). Molybdenum deficiencies are associated with soil acidity or high free Fe (Lucus and Knezek, 1972). Rhizobium survival (Rice, 1975) and Mo (Mor-tvedt, 1981) deficiency at pH less than 6 can restrict symbiosis; thus, yield increases could be expected with application of either lime or N (Munns et al, 1977).
VI. A L U M I N U M TOXICITY
It is impossible to ascribe poor plant growth to one factor in an acid soil. For example, it may be that the plant or crop is suffering from each of the following simultaneously: Al and Mn toxicity and Mo and Ca deficiency. However, deleterious effects of soil acidity on plant growth are commonly due to excessive soil solution concentrations of exchangeable Al and Mn. In strongly acid soils, excess soluble or exchangeable Mn and Al produce toxicity in many crops (Jackson, 1967). There is considerable variabiUty in crops in response to these elements. Aluminum and Mn in the soil solution in increased amounts is usually of major importance in reduced plant growth in highly acid soils (Jackson, 1967). All soils have the potential for Al toxicity because Al is always present, making up 15 to 20% by weight of dry soil and it is an important part of clay mineralogy. The concentrations required for inhibition of plant growth are very low (Adams and Pearson, 1967; Pearson and Hoveland, 1974). Symptoms of Al toxicity are generally restricted root development—both rooting depth and fineness of root devel-
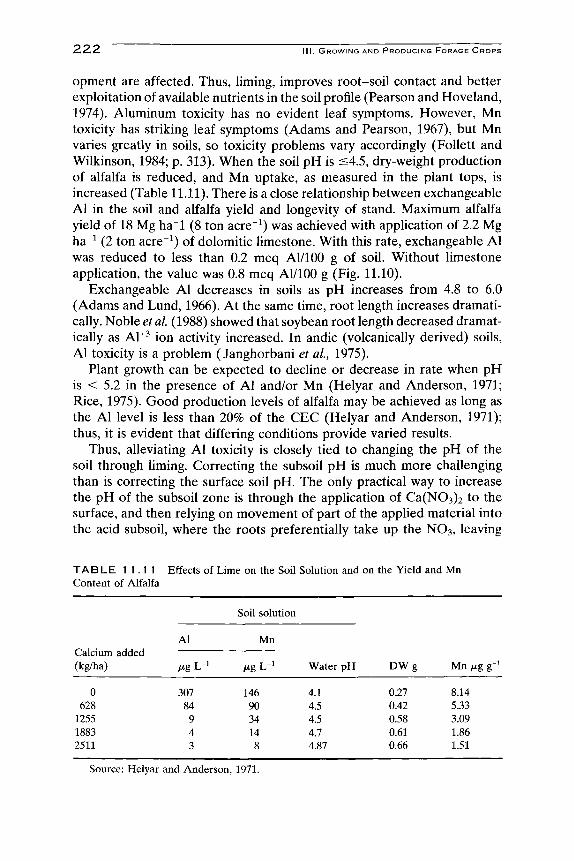
222 I. GROWING AND PRODUCING FORAGE CROPS
opment are affected. Thus, liming, improves root-soil contact and better exploitation of available nutrients in the soil profile (Pearson and Hoveland, 1974). Aluminum toxicity has no evident leaf symptoms. However, Mn toxicity has striking leaf symptoms (Adams and Pearson, 1967), but Mn varies greatly in soils, so toxicity problems vary accordingly (FoUett and Wilkinson, 1984; p. 313). When the soil pH is <4.5, dry-weight production of alfalfa is reduced, and Mn uptake, as measured in the plant tops, is increased (Table 11.11). There is a close relationship between exchangeable Al in the soil and alfalfa yield and longevity of stand. Maximum alfalfa yield of 18 Mg h a l (8 ton acre"^) was achieved with application of 2.2 Mg ha"^ (2 ton acre"^) of dolomitic limestone. With this rate, exchangeable Al was reduced to less than 0.2 meq Al/lOO g of soil. Without limestone application, the value was 0.8 meq Al/lOO g (Fig. 11.10).
Exchangeable Al decreases in soils as pH increases from 4.8 to 6.0 (Adams and Lund, 1966). At the same time, root length increases dramatically. Noble et al (1988) showed that soybean root length decreased dramatically as AV^ ion activity increased. In andic (volcanically derived) soils, Al toxicity is a problem (Janghorbani et al, 1975).
Plant growth can be expected to decline or decrease in rate when pH is < 5.2 in the presence of Al and/or Mn (Helyar and Anderson, 1971; Rice, 1975). Good production levels of alfalfa may be achieved as long as the Al level is less than 20% of the CEC (Helyar and Anderson, 1971); thus, it is evident that differing conditions provide varied results.
Thus, alleviating Al toxicity is closely tied to changing the pH of the soil through liming. Correcting the subsoil pH is much more challenging than is correcting the surface soil pH. The only practical way to increase the pH of the subsoil zone is through the apphcation of Ca(N03)2 to the surface, and then relying on movement of part of the applied material into the acid subsoil, where the roots preferentially take up the NO3, leaving
T A B L E 1 1 . 1 1 Effects of Lime on the Soil Solution and on the Yield and Mn Content of Alfalfa
Calcium added (kg/ha)
0 628
1255 1883 2511
Al
MgL-^
307 84
9 4 3
Soil solution
Mn
MgL-^
146 90 34 14 8
Water pH
4.1 4.5 4.5 4.7 4.87
D W g
0.27 0.42 0.58 0.61 0.66
Mn /xg g-i
8.14 5.33 3.09 1.86 1.51
Source: Helyar and Anderson, 1971.

1 1 . SOIL FERTILITY AND FC
'(0
O) ^ o J 111
>-< LL -J < U--J <
20
15
10
5
0 1
i/ n/
i \ J ) -J L
RAGE P
\ ^~
t-\ J
^ ^
—1 ^
RODUCTION
" 1 ^ 1 ^ \
—... J 1 \ i \
-1 \ ^ 1 1 1 r
0
."T ,~T- , - - |H ,
-
_ -
: -"
1.0
0.8
0.6
0.4
0.2
0.0
^^ b) o o •f^
a> E ^ -1 <
2 2 3
0 5 10 15 20 25 30 35 40
DOLOMITIC LIMESTONE (Mg ha"") FIGURE 1 1.1 O Relationship between applied lime, reduction in exchangeable Al, and alfalfa yields on a Tatum silt loam. (Redrawn from Moschler et al, 1960.)
the Ca or Mg, which will increase the pH of the soil. After 4 years of such treatment on bermudagrass, the soil pH at 30- to 45-cm depths had changed from 5.2 to 6.0 and at 60- to 75-cm depths the pH had changed from 5.2 to 5.5 (Adams and Pearson, 1969). Injecting hquid lime and deep plowing may be feasible in some situations, but the economics of these practices are suspect if the pH change is desired at the deeper levels within the soil profile.
Vll. SOIL SAMPLING AND TESTING
The fertility level of a field varies considerably from side to side and from one end to the other. This variability is due to variations in soil type, the soil forming processes, cropping patterns, and previous fertilization levels and patterns. Banding of fertilizers (James and Dow, 1972) can cause variability in soil samples simply because banded fertilizers such as phosphorus may not move very far from the original placement position.
A soil sample is intended to represent the fertility status of the field. Thus, the sample must consist of soil from numerous places in the field. The sample submitted to the soil testing laboratory must provide an accurate representation of the field's fertility variability and status. A poorly collected sample is essentially useless in assessing the fertilizer needs of the crop to be grown on the field.
The best protocol for sampling a field is disputed by the experts, largely because of insufficient and conflicting research. It is suggested by some researchers that the sample, representing a uniform field, should consist of approximately 20 to 30 cores taken randomly from the field. Once the

224 I I I . GROWING AND PRODUCING FORAGE CROPS
cores have been collected, they should be thoroughly crushed and mixed, subdivided to reduce the sample to a manageable size, and air dried before sending it to the laboratory. Others, however, suggest that systematic sampling may be superior to random sampling (Reuss et al., 1977). LeClerg et al (1962) drew two general conclusions from analysis of previously published uniformity trials: (1) variations in soil fertility are not distributed randomly, but to a degree they are systematic; and (2) soil fertility variabiUty is not so systematically distributed that it can be described mathematically. In nonuniform fields, a nonrandom, systematic sampling procedure is recommended. In nonrandom sampling, the objective is to understand both the average field conditions and the extremes encountered in the field (James and Wells, 1990). This requires placement of grid marks at regular intervals throughout the field and collecting the cores from the grid intersections. Spacing between the grids varies with the degree of detail required. At each grid intersection point, 8 to 10 cores should be taken within a 1-m radius. A soil analysis is then performed on each sample from each grid-intersection point. This procedure, however, becomes prohibitively expensive if the grids are too close together.
The practical approach, based on the premise that a random soil sample is a better indication of the field's fertility status than no soil sample at all, suggests that approximately 30 soil cores be taken from a field. Large fields or fields that show obvious nonuniformity should be divided into smaller units that represent the most obvious differences.
Generally, sampling the soil to the depth of the plow layer is sufficient.