harvest funds (cayman) · report and financial ... – a bangladesh tobacco company has seen its...
TRANSCRIPT
HARVEST FUNDS (CAYMAN)( A REGULATED MUTUAL FUND PURSUANT
TO THE MUTUAL FUNDSLAW(2009 REVISION) OF THE CAYMAN ISLANDS)
REPORT AND FINANCIAL STATEMENTS (UNAUDITED)FOR THE PERIOD ENDED 30 JUNE 2013
www.harvestglobal.com.hk

HARVEST FUNDS (CAYMAN)TABLE OF CONTENTS
Heading Page Number
DIRECTORY 1
MANAGER’S REPORT
ASIA FRONTIER EQUITY FUND 2
CHINA EQUITY FUND 3
STATEMENT OF FINANCIAL POSITION (UNAUDITED) 4
INVESTMENT PORTFOLIO (UNAUDITED)
ASIA FRONTIER EQUITY FUND 5
CHINA EQUITY FUND 9

1
HARVEST FUNDS (CAYMAN)DIRECTORY
Principal Office of the Fund in Cayman Islands
c/o BNP Paribas Bank & Trust Cayman Limited
3rd Floor, Royal Bank House, 24 Shedden Road
P.O.Box 10632, Grand CaymanKY1-1006, Cayman Islands
Manager and distributorHarvest Global Investments Limited
31/F, One Exchange Square8 Connaught Place
Central, Hong Kong
Administrator, Custodian and Registrar and Transfer Agent
BNP Paribas Securities Services, Singapore Branch
20 Collyer Quay#01-01, Tung CentreSingapore 049319
Legal Advisors- as to matters of Hong Kong and
International law:- Deacons5th Floor, Alexandra House
18 Chater RoadCentral, Hong Kong
- as to matters of Cayman Islands law:-Maples and Calder
53rd Floor, The Center99 Queen’s Road
Central, Hong Kong
Directors of the ManagerZHAO Xuejun-Chairman of the Board of
Directors and Non-Executive DirectorCHOY Peng Wah-Vice Chairman of the Board of
Directors and Executive DirectorWRIGHT Lindsay Megan-Vice Chairman of the Board of Directors and Non-Executive Director
BANG Michele Mi-Kyung-Non-Executive DirectorWANG Wei-Non-Executive Director
TrusteeBNP Paribas Bank &
Trust Cayman Limited3rd Floor, Royal Bank House,
24 Shedden RoadP.O.Box 10632, Grand Cayman
KY1-1006, Cayman Islands
AuditorsPricewaterhouseCoopers
P.O.Box 258Strathvale House, George Town
Grand Cayman KY1-1104Cayman Islands
2
HARVEST FUNDS (CAYMAN)MANAGER’S REPORT - ASIA FRONTIER EQUITY FUND
Asian frontier markets delivered positive returns of near 6% outperforming most emerging markets in the first half of 2013. Performance within the Asian frontier markets was however polarized. Vietnam was the key star-performer delivering more than 17% return. That was largely driven by the financial sector on expectations of easing monetary policies and government reforms. At the same time, Sri Lanka and Bangladesh also gained nearly 8% in USD term on robust earnings outlook in domestic sectors and improving macro outlook due to recovery in the export sector. In contrast, Mongolia was the worst performers falling more than 20% while Kazakhstan also fell 7%. Both markets suffered from the sell-down in the commodities related sectors on concerns of slowing China and the exit of US quantitative easing. Both onshore A and offshore H Chinese equities markets also declined near 10% during the period on both growth and interest rate concerns.
Our country allocation has detracted value primarily due to our underweight in Bangladesh and Vietnam versus our overweight in China frontiers. Our stock selection remains solid with main contributors coming from Sri Lanka and Bangladesh. Our core holdings – a brewer and a lubricant manufacturer of Sri Lanka were the top contributors gaining more than 40% as demand for their respective products was solid. The growth of motorization in Sri Lanka has been positive to the lubricant manufacturer. Our long term holding – a Bangladesh tobacco company has seen its share prices reaching a new high up nearly 36% on strong demand of cigarettes as well as its parent company raising its stake.
We are not fearful of the QE tampering. After all, Asian frontier markets have benefitted little from the global liquidity influx in the last 2 years. We remain very positive on consumption and infrastructure as demographics will be the key driver. Unlike some of the emerging economies in Asia, some of the frontier economies are in a “desynchronized” cycle with the global economies and liquidity. For instance, Sri Lanka and Vietnam are economies on an easing mode. The Central Bank of Sri Lanka recently reduced its statutory reserve ratio by 2% as inflationary pressure has decelerated in recent months. We found that many of the global apparel MNCs have been increasing their outsourcing allocation to Sri Lanka, Bangladesh, and Vietnam at the expense of China. That has reinforced our thesis of improving income and consumption in these economies. We have very strong conviction and commitment to the long term investing horizon of the Asian frontier markets. Our disciplined stock selection approach coupled with our structural themes will be able to continue delivering good value in the years to come.
3
HARVEST FUNDS (CAYMAN)MANAGER’S REPORT - CHINA EQUITY FUND
China shares dropped sharply during the period on concerns of slower economic growth while the new government did not intend to loosen monetary policy to boost growth. The worry on the tapering of QE in the US also led to a strengthening of US dollar as well as significant fund outflows from emerging markets and risky assets. Cyclical stocks underperformed the most, such as materials, consumer discretionary and energy. Utilities outperformed the most by rising in a down market, mainly due to the better earnings outlook for power plants as fuel prices fell. IT sector was also up driven by Internet and smart-phone related stocks for their strong growth outlook. Other defensive sectors such as healthcare and consumer staples also outperformed. Our underweight in energy and overweight in healthcare, as well as good stock selection in consumer sector contributed most positively to the performance of the portfolio in the first half of 2013.
Notwithstanding PBOC’s recent harsh message to the banking sector to tidy up its off-balance-sheet activities and liquidity management, we believe it is important to highlight the government’s intention to minimize systemic financial risk. Therefore, we expect the bank liquidity pressure to ease after the end of 2Q. The government also emphasized its target to keep GDP growth of at least 7.5% this year, which helped alleviate concerns on potential hard-landing of the economy. We anticipate the market to rebound as the most severe liquidity impact has peaked out. Considering the negative earnings impact of the recent credit crunch to the banking sector as well as more disciplined lending to the real economy, we would continue to underweight banks, with more emphasis on non-bank financials (such as property and brokerage) as well as good-quality growth sectors with higher earnings visibility (such as property, IT, healthcare, consumer discretionary). We remain cautious on energy and telecom sectors due to their lackluster growth prospects.

4
HARVEST FUNDS (CAYMAN)STATEMENT OF FINANCIAL POSITION (Unaudited)As at 30 June 2013
Asia Frontier Equity Fund China Equity Fund 30 June 2013 31 December 2012 30 June 2013 31 December 2012Assets US$ US$ HK$ HK$
Current assetsFinancial assets at fair value through profit or loss 18,275,224 10,686,695 226,369,162 251,741,310Dividends and other receivables 40,943 30,921 3,511,080 -Amounts due from broker 236,587 299,437 526,583 -Cash and cash equivalents 1,508,036 706,328 6,885,104 3,515,850Total assets 20,060,790 11,723,381 237,291,929 255,257,160
Liabilities
Current liabilitiesFinancial liabilities at fair value through profit or loss - 232 - -Administration fee payable 1,749 1,220 7,563 15,177Audit fee payable 18,047 19,150 72,718 76,839Management fee payable 35,442 9,479 320,048 166,952Amounts due to broker 196,505 470,104 384,425 128,538Trustee fee payable 1,024 234 12,586 5,258Other payables 31,543 8,474 38,991 33,608Total liabilities (excluding net assets attributable to unitholders) 284,310 508,893 836,331 426,372
Net assets attributable to unitholders (after amortisation of preliminary expense adjustment) 19,776,480 11,214,488 236,455,598 * 254,830,788 *
Represented by:Net assets attributable to unitholders (before amortisation of preliminary expense adjustment) 19,803,510 11,266,313 - -Adjustment for different basis adopted by the Sub- Funds in arriving at net assets attributable to unitholders (27,030) (51,825) - -
Number of units in issue-Class I (USD) 1,444,393 546,160 3,000,000 3,000,000Number of units in issue-Class J (JPY) 314,179 404,927 - -Number of units in issue-Class A (HKD) - - 100 -
Net assets attributable to unitholders per unit (before amortisation of preliminary expense adjustment)-Class I (USD) 10.628 10.389 78.819 84.959Net assets attributable to unitholders per unit (before amortisation of preliminary expense adjustment)-Class J (JPY) 14.170 13.810 - -Net assets attributable to unitholders per unit (before amortisation of preliminary expense adjustment)-Class A (HKD) - - - -
* Net assets attributable to unitholders of China Equity Fund are classified as equity in accordance with IAS 32.

5
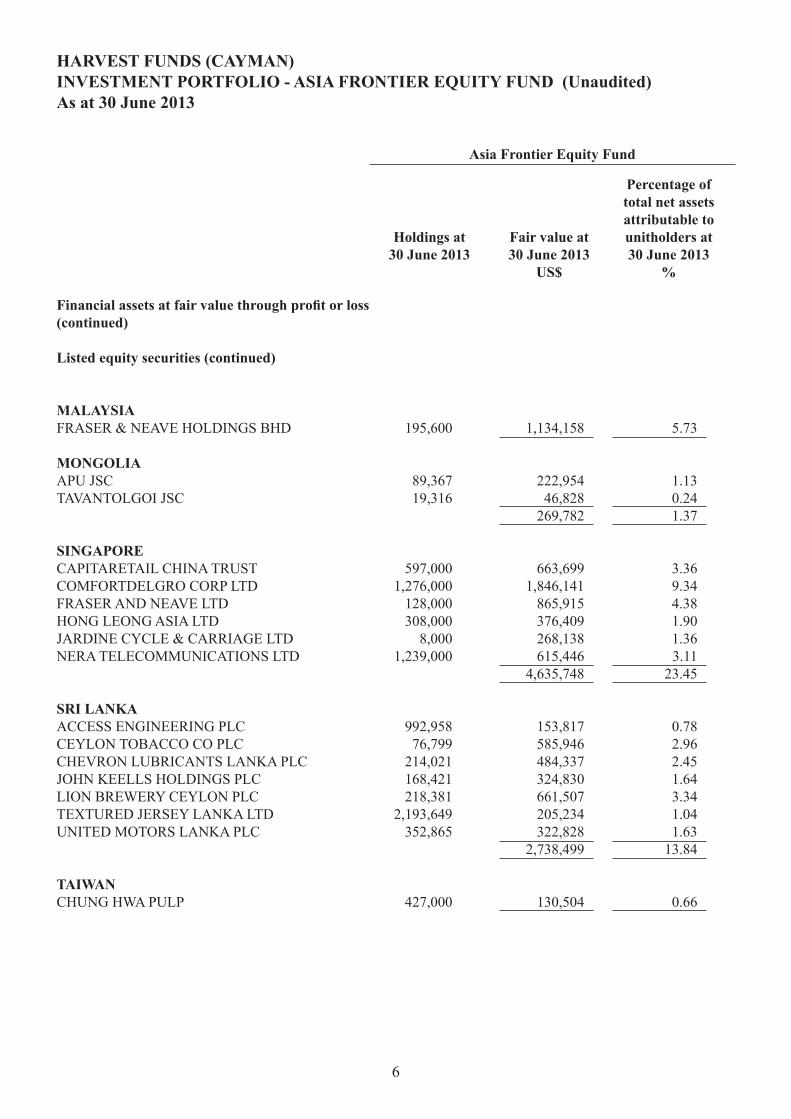
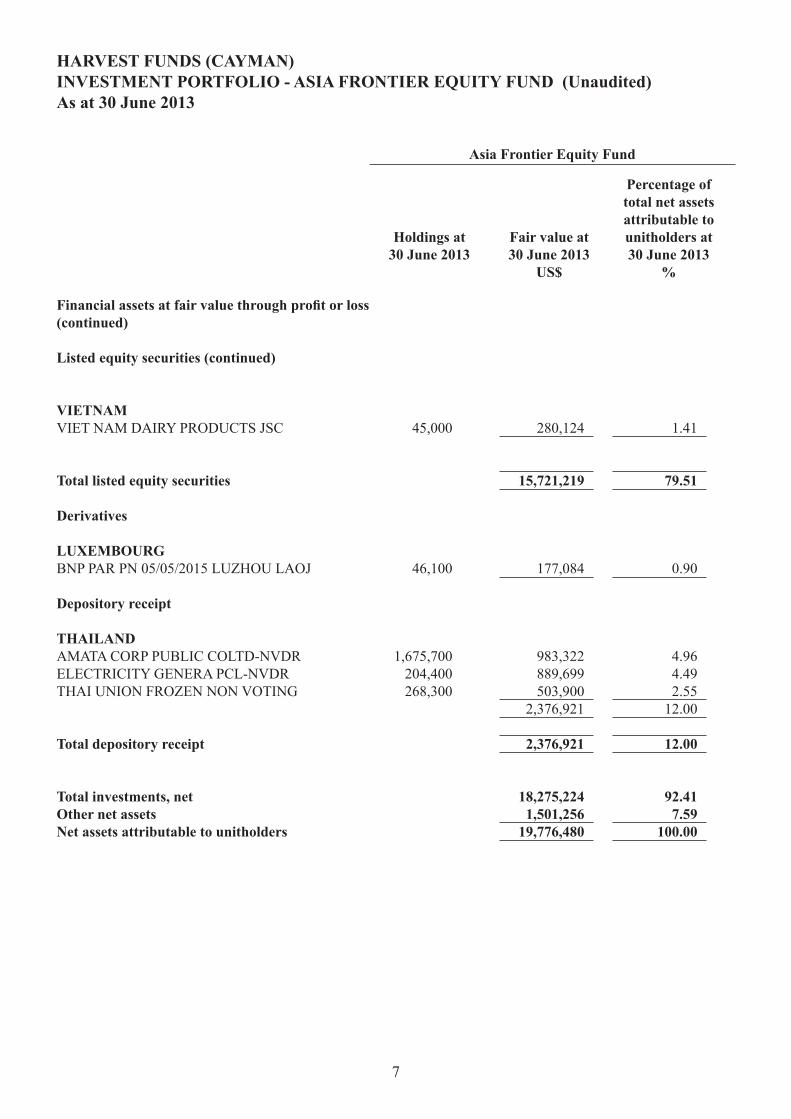
HARVEST FUNDS (CAYMAN)INVESTMENT PORTFOLIO - ASIA FRONTIER EQUITY FUND (Unaudited)As at 30 June 2013
Financial assets at fair value through profit or loss
By Geography - Primary
Listed equity securities
AUSTRALIARIO TINTO LTD 11,500 551,277 2.79
BANGLADESHBATA SHOE CO 37,100 268,773 1.36BRITISH AMERICAN TOBACCO 69,900 968,289 4.90LINDE BANGLADESH LTD 70,550 529,431 2.6MARICO BANGLADESH LTD 31,400 194,930 0.99 1,961,423 9.93
HONG KONGCHANGSHA ZOOMLION HEAVY IN-H 698,400 500,635 2.53CHINA CITY RAILWAY TRANSPORT 1,492,000 142,345 0.72CHINA MACHINERY ENGINEERIN-H 800,000 434,224 2.20SINOCOM SOFTWARE GROUP LTD 2,306,000 258,655 1.31WEIFU HIGH TECHNOLOGY GROUP-B 85,500 297,627 1.50XIAO NAN GUO RESTAURANTS HLD 786,000 128,697 0.65ZHAOJIN MINING INDUSTRY - H 265,500 170,808 0.86JARDINE MATHESON HLDGS LTD 8,000 484,000 2.45LUK FOOK HOLDINGS INTL LTD 154,000 358,178 1.81PERFECT SHAPE PRC HOLDINGS LTD 3,934,000 278,958 1.41SHANGRI-LA ASIA LTD 168,000 290,239 1.47 3,344,366 16.91
INDONESIAMITRA PINASTHIKA MUSTIKA TBK 2,763,500 317,420 1.61TIPHONE MOBILE INDONESIA TBK 5,823,500 357,918 1.81 675,338 3.42
Holdings at 30 June 2013
Asia Frontier Equity Fund
Percentage of total net assets attributable tounitholders at 30 June 2013
%
Fair value at 30 June 2013
US$
6
Financial assets at fair value through profit or loss(continued)
Listed equity securities (continued)
MALAYSIAFRASER & NEAVE HOLDINGS BHD 195,600 1,134,158 5.73
MONGOLIAAPU JSC 89,367 222,954 1.13TAVANTOLGOI JSC 19,316 46,828 0.24 269,782 1.37
SINGAPORECAPITARETAIL CHINA TRUST 597,000 663,699 3.36COMFORTDELGRO CORP LTD 1,276,000 1,846,141 9.34FRASER AND NEAVE LTD 128,000 865,915 4.38HONG LEONG ASIA LTD 308,000 376,409 1.90JARDINE CYCLE & CARRIAGE LTD 8,000 268,138 1.36NERA TELECOMMUNICATIONS LTD 1,239,000 615,446 3.11 4,635,748 23.45
SRI LANKAACCESS ENGINEERING PLC 992,958 153,817 0.78CEYLON TOBACCO CO PLC 76,799 585,946 2.96CHEVRON LUBRICANTS LANKA PLC 214,021 484,337 2.45JOHN KEELLS HOLDINGS PLC 168,421 324,830 1.64LION BREWERY CEYLON PLC 218,381 661,507 3.34TEXTURED JERSEY LANKA LTD 2,193,649 205,234 1.04UNITED MOTORS LANKA PLC 352,865 322,828 1.63 2,738,499 13.84
TAIWANCHUNG HWA PULP 427,000 130,504 0.66
Holdings at 30 June 2013
Asia Frontier Equity Fund
Percentage of total net assets attributable tounitholders at 30 June 2013
%
Fair value at 30 June 2013
US$
HARVEST FUNDS (CAYMAN)INVESTMENT PORTFOLIO - ASIA FRONTIER EQUITY FUND (Unaudited)As at 30 June 2013
7
Holdings at 30 June 2013
Asia Frontier Equity Fund
Percentage of total net assets attributable tounitholders at 30 June 2013
%
Fair value at 30 June 2013
US$
Financial assets at fair value through profit or loss(continued)
Listed equity securities (continued)
VIETNAMVIET NAM DAIRY PRODUCTS JSC 45,000 280,124 1.41
Total listed equity securities 15,721,219 79.51
Derivatives
LUXEMBOURGBNP PAR PN 05/05/2015 LUZHOU LAOJ 46,100 177,084 0.90
Depository receipt
THAILANDAMATA CORP PUBLIC COLTD-NVDR 1,675,700 983,322 4.96ELECTRICITY GENERA PCL-NVDR 204,400 889,699 4.49THAI UNION FROZEN NON VOTING 268,300 503,900 2.55 2,376,921 12.00
Total depository receipt 2,376,921 12.00
Total investments, net 18,275,224 92.41Other net assets 1,501,256 7.59Net assets attributable to unitholders 19,776,480 100.00
HARVEST FUNDS (CAYMAN)INVESTMENT PORTFOLIO - ASIA FRONTIER EQUITY FUND (Unaudited)As at 30 June 2013
8
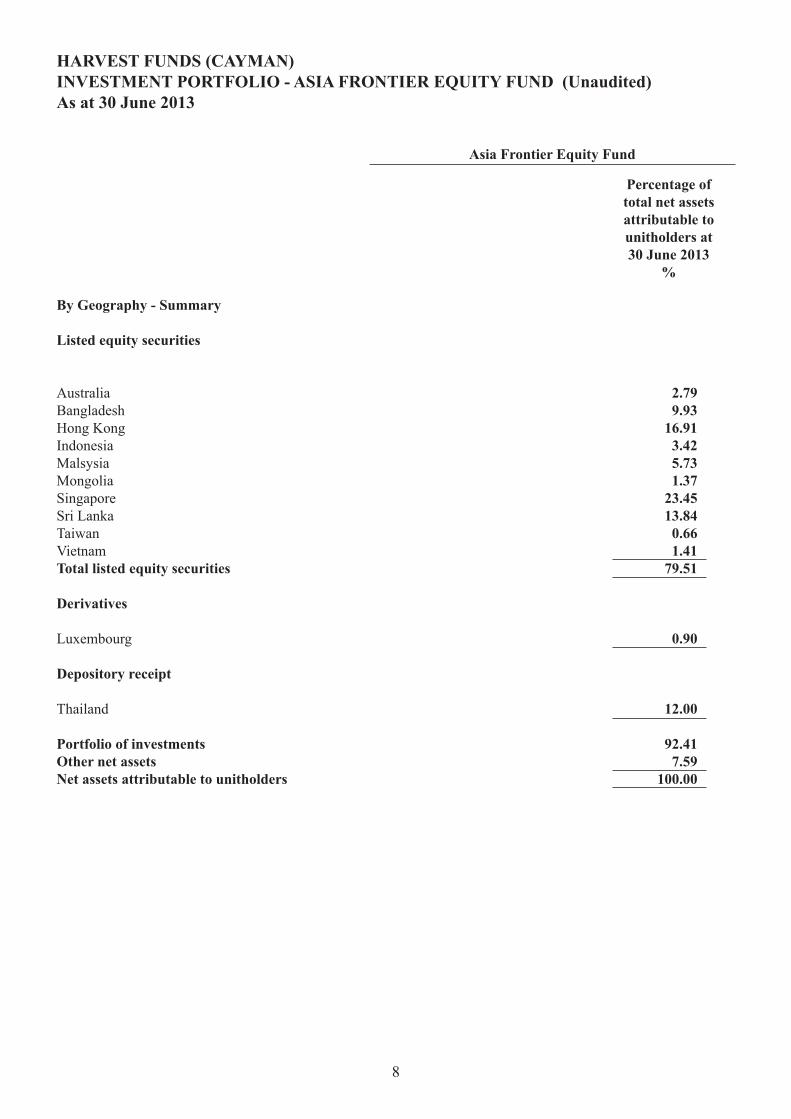
Asia Frontier Equity Fund
Percentage of total net assets attributable tounitholders at 30 June 2013
%
By Geography - Summary
Listed equity securities
Australia 2.79Bangladesh 9.93Hong Kong 16.91Indonesia 3.42Malsysia 5.73Mongolia 1.37Singapore 23.45Sri Lanka 13.84Taiwan 0.66Vietnam 1.41Total listed equity securities 79.51
Derivatives
Luxembourg 0.90
Depository receipt
Thailand 12.00
Portfolio of investments 92.41Other net assets 7.59Net assets attributable to unitholders 100.00
HARVEST FUNDS (CAYMAN)INVESTMENT PORTFOLIO - ASIA FRONTIER EQUITY FUND (Unaudited)As at 30 June 2013

9
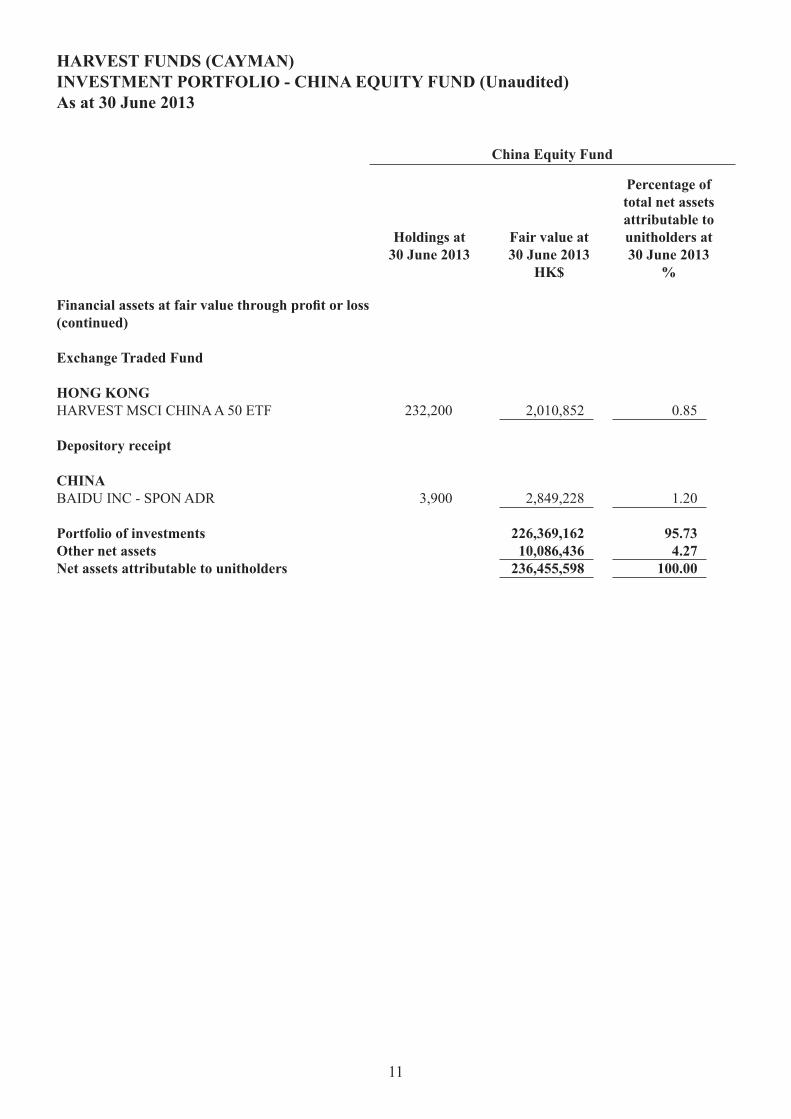
HARVEST FUNDS (CAYMAN)INVESTMENT PORTFOLIO - CHINA EQUITY FUND (Unaudited)As at 30 June 2013
Financial assets at fair value through profit or loss
By Geography - Primary
Listed equity securities
HONG KONGANHUI CONCH CEMENT CO LTD-H 112,000 2,352,000 0.99BEIJING ENTERPRISES WATER GR 2,964,000 8,239,920 3.48BIOSTIME INTERNATIONAL HOLDI 79,000 3,436,500 1.45CHINA COMMUNICATIONS CONST-H 343,000 2,082,010 0.88CHINA CONSTRUCTION BANK-H 3,384,000 18,578,160 7.86CHINA DATANG CORP RENEWABL - H 1,391,000 2,322,970 0.98CHINA DONGXIANG GROUP CO 3,621,000 4,526,250 1.91CHINA ITS HOLDINGS CO LTD 1,674,000 2,929,500 1.24CHINA MACHINERY ENGINEERIN-H 520,000 2,189,200 0.93CHINA MENGNIU DAIRY CO 127,000 3,524,250 1.49CHINA MODERN DAIRY HOLDINGS 930,000 2,064,600 0.87CHINA NATIONAL BUILDING MA-H 662,000 4,600,900 1.95CHINA OVERSEAS LAND & INVEST 170,000 3,459,500 1.46CHINA PHARMACEUTICAL GROUP 690,000 2,677,200 1.13CHINA RESOURCES POWER HOLDIN 264,000 4,878,720 2.06CHINA SOUTHERN AIRLINES CO-H 622,000 1,946,860 0.82CITIC SECURITIES CO LTD-H 151,000 2,080,780 0.88ENN ENERGY HOLDINGS LTD 122,000 5,044,700 2.13FUFENG GROUP LTD 1,635,328 4,104,673 1.74FUTURE BRIGHT HOLDINGS LTD 1,080,000 2,419,200 1.02GEELY AUTOMOBILE HOLDINGS LT 1,375,000 4,620,000 1.95GOODBABY INTERNATIONAL HOLDI 693,000 2,134,440 0.90HAITONG SECURITIES CO LTD-H 237,600 2,233,440 0.94HISENSE KELON ELEC HLD-H 685,000 2,952,350 1.25HUADIAN FUXIN ENERGY CORP -H 1,172,000 2,590,120 1.10IND & COMM BK OF CHINA-H 3,593,000 17,569,770 7.43KUNLUN ENERGY CO LTD 322,000 4,430,720 1.87KWG PROPERTY HOLDING LTD 1,685,000 6,841,100 2.89 126,829,833 53.60
Holdings at 30 June 2013
China Equity Fund
Percentage of total net assets attributable tounitholders at 30 June 2013
%
Fair value at 30 June 2013
HK$

10
Financial assets at fair value through profit or loss(continued)
Listed equity securities (continued)
HONG KONG (continued)LUEN THAI HOLDINGS LTD 849,000 2,428,140 1.03MICROPORT SCIENTIFIC CORP 158,000 1,034,900 0.44PACIFIC TEXTILES HOLDINGS 273,000 2,375,100 1.00PETROCHINA CO LTD-H 574,000 4,735,500 2.00PING AN INSURANCE GROUP CO-H 119,500 6,237,900 2.64SAMSON HOLDING LTD 1,115,000 1,616,750 0.68SEMICONDUCTOR MANUFACTURING 9,295,000 5,298,150 2.24SIHUAN PHARMACEUTICAL HLDGS 520,000 2,652,000 1.12SINO BIOPHARMACEUTICAL 1,516,000 7,625,480 3.22SINOCOM SOFTWARE GROUP LTD 804,000 699,480 0.30SUNAC CHINA HOLDINGS LTD 2,722,000 13,827,760 5.85TCL COMMUNICATION TECH HLDGS 1,773,000 6,170,040 2.61TECHTRONIC INDUSTRIES CO 133,500 2,477,760 1.06TENCENT HOLDINGS LTD 46,600 14,175,720 6.00TONGDA GROUP HOLDINGS LTD 8,250,000 3,795,000 1.61TPV TECHNOLOGY LTD 1,660,000 2,938,200 1.25WEICHAI POWER CO LTD-H 91,000 2,083,900 0.88WINTEAM PHARMACEUTICAL GROUP 2,696,000 9,328,160 3.95XINYI GLASS HOLDINGS LTD 374,000 2,255,220 0.96 91,755,160 38.84
UNITED STATESSINA CORP 6,663 2,924,089 1.24
Total listed equity securities 221,509,082 93.68
Holdings at 30 June 2013
China Equity Fund
Percentage of total net assets attributable tounitholders at 30 June 2013
%
Fair value at 30 June 2013
HK$
HARVEST FUNDS (CAYMAN)INVESTMENT PORTFOLIO - CHINA EQUITY FUND (Unaudited)As at 30 June 2013
11
Financial assets at fair value through profit or loss(continued)
Exchange Traded Fund
HONG KONGHARVEST MSCI CHINA A 50 ETF 232,200 2,010,852 0.85
Depository receipt
CHINABAIDU INC - SPON ADR 3,900 2,849,228 1.20
Portfolio of investments 226,369,162 95.73Other net assets 10,086,436 4.27Net assets attributable to unitholders 236,455,598 100.00
Holdings at 30 June 2013
China Equity Fund
Percentage of total net assets attributable tounitholders at 30 June 2013
%
Fair value at 30 June 2013
HK$
HARVEST FUNDS (CAYMAN)INVESTMENT PORTFOLIO - CHINA EQUITY FUND (Unaudited)As at 30 June 2013

12
China Equity Fund
Percentage of total net assets attributable tounitholders at 30 June 2013
%
By Geography - Summary
Listed equity securities
Hong Kong 92.44United States 1.24Total listed equity securities 93.68
Exchange Traded Fund
Hong Kong 0.85
Depository receipt
China 1.20
Portfolio of investments 95.73Other net assets 4.27Net assets attributable to unitholders 100.00
HARVEST FUNDS (CAYMAN)INVESTMENT PORTFOLIO - CHINA EQUITY FUND (Unaudited)As at 30 June 2013