harvard and tanzania celebrate 25 years of collaboration
TRANSCRIPT

1
Harvard and Tanzania Celebrate 25 Years of Collaboration
Implementation Science and the Practice of Public Health: The Case of
PEPFAR
Donna Spiegelman, ScD
Professor of Epidemiologic Methods
Departments of Epidemiology, Biostatistics, Nutrition and Global Health
Harvard TH Chan School of Public Health

2
Introduction to Implementation Science

3
It takes 17 years to turn 14 percent of original research to the benefit of patient care

4
The “Know-Do” Gap: MDG 4 – Under 5 Mortality
Under 5 mortality Preventable
Lancet 2005; 365:1147

5
The Know-Do Gap: MDG 5 -- Maternal mortality is nearly entirely preventable
6
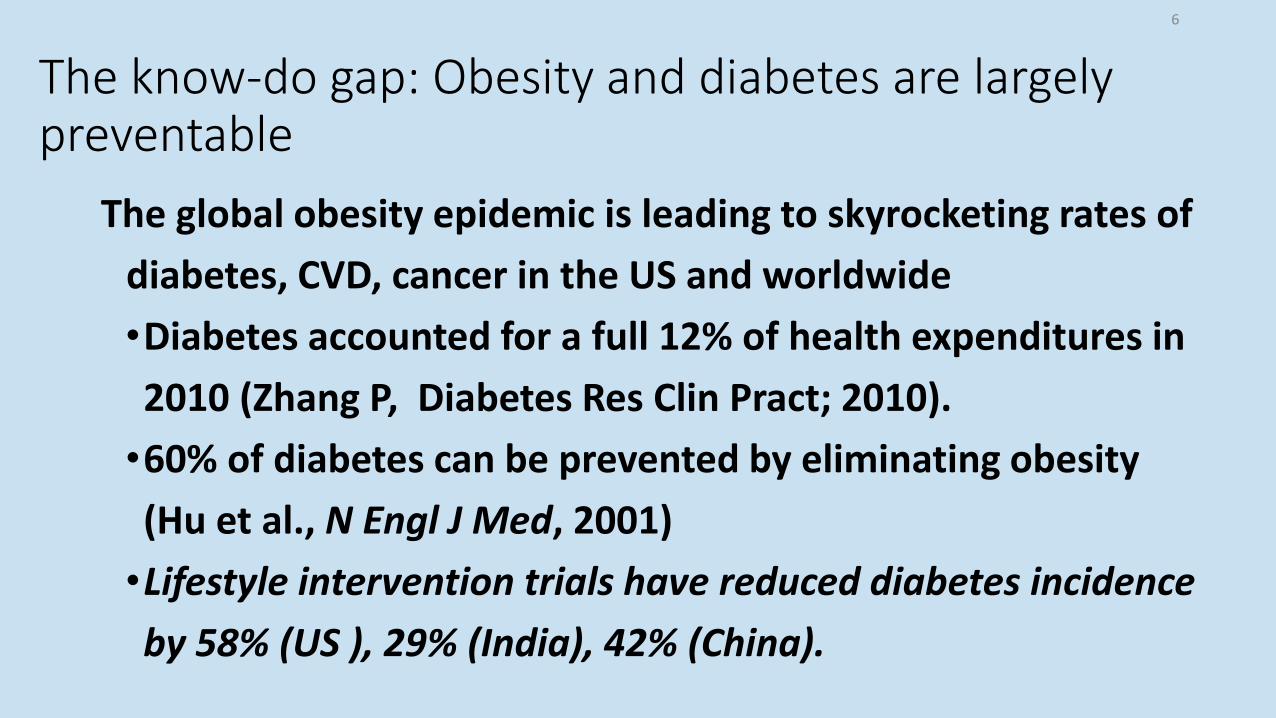
The know-do gap: Obesity and diabetes are largely preventable
The global obesity epidemic is leading to skyrocketing rates of
diabetes, CVD, cancer in the US and worldwide
•Diabetes accounted for a full 12% of health expenditures in
2010 (Zhang P, Diabetes Res Clin Pract; 2010).
•60% of diabetes can be prevented by eliminating obesity
(Hu et al., N Engl J Med, 2001)
•Lifestyle intervention trials have reduced diabetes incidence
by 58% (US ), 29% (India), 42% (China).

7Implementation Science --Definitions
“A systematic, scientific approach to ask and answer questions about how to get ‘what works’
to people who need it with greater speed, fidelity, efficiency, quality and relevant coverage”
“The scientific study of programs and interventions which promote the systematic uptake of clinical research findings and other evidence-based approaches into routine clinical practice and public health policy, hence improving the quality (effectiveness, reliability, safety, appropriateness, equity, efficiency) of health care.”
“Implementation science is about determining what works, in real-life full-scale settings.”

8
The implementation pipeline
efficacy
effectiveness and cost-effectiveness
implementation
dissemination

9
Features of Implementation and Dissemination Science Research
3 types of research with unique features, designs, and objectives
• Theory-driven
•Mixed methods
•Adaptation vs. Fidelity
•Contextual (?when? ?where?) vs. External validity
• Economic evaluation/cost-effectiveness
• Sustainability
•Diffusion (network science)

10
The Impact of PEPFAR PMTCT Funding on Infant Mortality and Antenatal Care in Kenya
A quasi-experimental evaluation
10

11
Co-authors
Kenya Medical Research Institute/Walter Reed Project HIV Program, KenyaIsaac Tsikhutsu, MBChB, MMED1
Fredrick Sawe, MBChB, MMED2
Jane Mumbi, BSN2
Duncan Kirui2
William Sugut2
Harvard T.H. Chan School of Public HealthDonna Spiegelman, ScD 1
Dale Barnhart 3
11
Office of the U.S. Global AIDS CoordinatorNareen Abboud, PhD, MPH4
Walter Reed Army Institute of Research, U.S. Military HIV Research ProgramTiffany Hamm, PhD4
Peter Coakley, MD, DTM&H4
LTC Patrick Hickey, MD4
Vanessa Wolfman, MD, MPH4
Elizabeth Lee, DrPH4
1Principle investigator; 2Associate Investigator; 3Co-Investigator; 4Collaborator

12
Background
• PEPFAR : the U.S. President’s Emergency Plan for AIDS Relief
• PMTCT: Prevention of mother-to-child transmission of HIV
• Kenya has been a PEPFAR-focus country since 2004.
• PEPFAR has invested over $240 million dollars in PMTCT programs in Kenya since 2004
Source: PEPFAR Dashboards
12

13
Note: 10-year mortality rates come KDHS reports.
PEFPAR funding has coincided with a drastic decrease in infant mortality
2003 2008 20142008 2014
13

14
Study Design: A dose-response model
• Quasi-experimental design
• Continous generalization of a difference-in-difference study
• Based on the principle that if a causal relationship exists, a higher “dose” of the exposure should lead to a stronger effect
• Dose-response models do not need to be linear!
14

15
Exposure: PEPFAR funding for PMTCT
▪ Country Operational Plans (COPs)▪ Submitted annually by all
PEPFAR implementing partners
▪ Describe planned expenditures
▪ Disaggregated by activity, including PMTCT
▪ PMTCT funding allocated to provinces based on narrative details in the COPs
▪ Used to calculate annual per capita funding and cumulative per capita funding
15

16
Outcomes
▪ Data on individual outcomes came from two nationally-representative, cross-sectional surveys:
▪ Kenyan Demographic and Health Survey (KDHS)
▪ Kenyan AIDS Indicator Survey (KAIS)
▪ Use similar methodology and identical or near-identical wording for many HIV/AIDS questions
▪ Also gather additional demographic and socioeconomic data
Sample pages from DHS and KAIS surveys
16

17
Outcomes
HIV testing at ANC• Receiving HIV counselling, testing, and test results as part of antenatal care• N=21,048 mothers who gave birth ≤5 years before the interview date
Neonatal mortality• Death within the first 30 days of life• N=37,616 children born 1-60 months prior to the interview date
Infant mortality• Death within the first year of life• N=30,424 children born 12-60 months prior to the interview date
17

18
Annual per-capita Funding for PMTCT
• Not associated with infant mortality in the year of funding allocation
• A $0.33 increase was associated with:
• a 11% (95% CI: 1-21%) reduction in infant mortality after a 1-year lag
• a 12% (95% CI: 0-22%) reduction in infant mortality after a 2-year lag
18
Infant mortality

19
Cumulative per-capita Funding for PMTCT
• A $0.83 increase was associated with a 31% reduction in infant mortality (95% CI: 11-46%) in the year of funding allocation.
• Association became weaker after subsequent lags
19
Infant mortality

20
Annual per-capita Funding for PMTCT
• Not associated with HIV testing at ANC in the year of funding allocation or when using a 1- to 2-year lag
• With 3-year lag, a $0.33 increase was associated with a 6% increase (95% CI: 2-10%) in HIV testing at ANC
20
HIV testing at ANC

21
Cumulative per-capita Funding for PMTCT
• Not associated with HIV testing at ANC in the year of funding allocation
• A $0.83 increase was linearly associated with:
• 6% increase in HIV testing at ANC after a 1- and 2-year lag (95% CIs: 3-9% and 2-9%, respectively)
• a 42% (95% CI: 26-59%) increase in testing after a 3-year lag
21
HIV testing at ANC

22
• Not associated with annual per-capita funding
• Not associated with cumulative per-capita funding
22
Neonatal mortality

23
Delayed Effects of Annual Funding
23
Annual per capita funding was notassociated with health outcomes in the year of allocation but became beneficial at later lags
Full impact of funding may not be observable for several years
Lagged effect may reflect:• Logistical delays in transferring PEPFAR
funds to implementing partners and local PMTCT programs
• Biologic realities of the outcomes of interest
Donors and program evaluators may wish to consider both logistic and biologic factors when defining a time horizon for program evaluations

24
Summary: Main findings
PEPFAR funding for PMTCT was associated with reduced infant mortality and increased HIV testing at ANC in Kenya.
Our findings are best interpreted as the effect of living in a province that receives a given level of PEPFAR funding and would likely underestimate the benefits of interacting directly with a PEPFAR-funded PMTCT program.
24

25
Thank you!
Kenya Medical Research Institute/Walter Reed Project HIV Program, KenyaIsaac Tsikhutsu, MBChB, MMED1
Fredrick Sawe, MBChB, MMED2
Jane Mumbi, BSN2
Duncan Kirui2
William Sugut2
Harvard T.H. Chan School of Public HealthDonna Spiegelman, ScD 1
Dale Barnhart 3
25
Office of the U.S. Global AIDS CoordinatorNareen Abboud, PhD, MPH4
Walter Reed Army Institute of Research, U.S. Military HIV Research ProgramTiffany Hamm, PhD4
Peter Coakley, MD, DTM&H4
LTC Patrick Hickey, MD4
Vanessa Wolfman, MD, MPH4
Elizabeth Lee, DrPH4
1Principle investigator; 2Associate Investigator; 3Co-Investigator; 4Collaborator

26
References
Background
• Luboga SA, Stover B, Lim TW, et al. Did PEPFAR investments result in health system strengthening? A retrospective longitudinal study measuring non-HIV health service utilization at the district level. Health Policy Plan 2016; 31(7): 897-909.
• Cohen RL, Li Y, Giese R, Mancuso JD. An evaluation of the President's Emergency Plan for AIDS Relief effect on health systems strengthening in sub-Saharan Africa. J Acquir Immune Defic Syndr 2013; 62(4): 471-9.
• Duber HC, Coates TJ, Szekeras G, Kaji AH, Lewis RJ. Is there an association between PEPFAR funding and improvement in national health indicators in Africa? A retrospective study. J Int AIDS Soc 2010; 13: 21.
• Lee MM, Izama MP. Aid Externalities: Evidence from PEPFAR in Africa. World Development 2015; 67: 281-94.
• Bendavid E, Holmes CB, Bhattacharya J, Miller G. HIV development assistance and adult mortality in Africa. JAMA 2012; 307(19): 2060-7. 30.
• Bendavid E. The President's Emergency Plan for AIDS Relief in Africa: An Evaluation of Outcomes. Annals of Internal Medicine 2009; 150(10): 688.
• Liu L, Oza S, Hogan D, et al. Global, regional, and national causes of child mortality in 2000-13, with projections to inform post-2015 priorities: an updated systematic analysis. Lancet 2015; 385(9966): 430-40.
26

27
ReferencesData sources
• Office of U.S. Global AIDS Coordinator. PEPFAR Dashboards. https://data.pepfar.net/global (accessed November 22 2016).
• Office of U.S. Global AIDS Coordinator. Country Operational Plans. https://www.pepfar.gov/countries/cop/index.htm (accessed November 22 2016).
• Central Bureau of Statistics [Kenya], Ministry of Health [Kenya], ORC Macro. Kenya Demographic and Health Survey 2003 [Dataset]. Calverton, Maryland, USA: CBS, MOH, and ORC Macro; 2004.
• National Bureau of Statistics [Kenya], National AIDS Control Council [Kenya], National AIDS/STD Control Programme [Kenya], Health MoP, Sanitation [Kenya], Kenya Medical Research Institute. Kenya Demographic and Health Survey 2008-09 [Dataset]. Calverton, Maryland, USA: KNBS and ICF Macro; 2010.
• National Bureau of Statistics [Kenya], Ministry of Health [Kenya], National AIDS Control Council [Kenya], Kenya Medical Research Institute, Population NCf, Development [Kenya]. Kenya Demographic and Health Survey 2014 [Dataset]. Rockville, MD, USA; 2015.
• National AIDS and STI Control Programme (NASCOP) [Kenya]. Kenya AIDS Indicator Survey 2007 [Dataset]. Nairobi: National Bureau of Statistics [Kenya]; 2009.
• National AIDS and STI Control Programme (NASCOP) K. Kenya AIDS Indicator Survey 2012. Nairobi: National Bureau of Statistics,, [Kenya]; 2014.
• World Bank. Subnational Population Database.
• PEPFAR Bilateral Countries. https://www.pepfar.gov/countries/bilateral/index.htm (accessed January 11 2018).
• The DHS Program: Where We Work. https://dhsprogram.com/Where-We-Work/Country-List.cfm (accessed January 11 2018).
27

28
References
Μethods
• Fitzmaurice G, Laird N, Ware J. Applied Longitudinal Analysis. 2 ed. Hoboken, New Jersey: John Wiley & Sons, Inc; 2011.
• Wacholder S. Binomial regression in GLIM: estimating risk ratios and risk differences. Am J Epidemiol 1986; 123(1): 174-84.
• Zou G. A modified poisson regression approach to prospective studies with binary data. Am J Epidemiol 2004; 159(7): 702-6.
• Durrleman S, Simon R. Flexible regression models with cubic splines. Stat Med 1989; 8(5): 551-61.
• Govindarajulu US, Malloy EJ, Ganguli B, Spiegelman D, Eisen EA. The comparison of alternative smoothing methods for fitting non-linear exposure-response relationships with Cox models in a simulation study. Int J Biostat 2009; 5(1): Article 2.
• Hertzmark E, Li R, Hong B, Spiegelman D. The SAS GLMCURV9 Macro. 2014. https://www.hsph.harvard.edu/donna-spiegelman/software/glmcurv9/.
28