hart/mcinturff march 2010 interviews: 1,000 adults, including104
TRANSCRIPT

8/14/2019 HART/McINTURFF March 2010 Interviews: 1,000 Adults, Including104
http://slidepdf.com/reader/full/hartmcinturff-march-2010-interviews-1000-adults-including104 1/29
HART/McINTURFF Study #10156--page 1March 2010 NBC News/Wall Street Journal Survey
Interviews: 1,000 adults, including104 reached by cell phone
FINAL
Study #10156
NBC News/Wall Street Journal SurveyMarch 11,13-14, 2010
Please note: all results are shown as percentages unless otherwise stated.
The margin of error for 1,000 Adult interviews is ±3.10% The margin of error for the 846 Registered Voter interviews is ±3.37%
(ASK ALL) Q2a For statistical purposes only, would you please tell me how old you are? (IF “REFUSED,” ASK:) Well,
would you tell me which age group you belong to? (READ LIST.)
18-24 ................................................ 1025-29 ................................................ 7
30-34 ................................................ 9
35-39 ................................................ 9
40-44 ................................................ 11
45-49 ................................................ 8
50-54 ................................................ 10
55-59 ................................................ 10
60-64 ................................................ 10
65-69 ................................................ 5
70-74 ................................................ 5
75 and over ....................................... 6
Not sure/refused ............................. --
Q2b To ensure that we have a representative sample, would you please tell me whether you are from a Hispanicor Spanish-speaking background?
Yes, Hispanic .................................... 11
No, not Hispanic ............................... 88
Not sure/refused ............................. 1
Q2c And again, for statistical purposes only, what is your race--white, black, Asian, or something else?
White ................................................. 75
Black ................................................. 11
Asian ................................................. 2
Other ................................................. 4
Hispanic (VOL) ................................6
Not sure/refused .............................. 2
48 Male52 Female

8/14/2019 HART/McINTURFF March 2010 Interviews: 1,000 Adults, Including104
http://slidepdf.com/reader/full/hartmcinturff-march-2010-interviews-1000-adults-including104 2/29
HART/McINTURFF Study #10156--page 2March 2010 NBC News/Wall Street Journal Survey
Q3 All in all, do you think that things in the nation are generally headed in the right direction, or do you feel thatthings are off on the wrong track?
High Low
3/101/23 -25/10
1/10-14/10 12/09 10/09 9/09 7/09 9/01
10/17-20/08+
Headed in the right direction ...... 33 32 34 33 36 39 39 72 12Off on the wrong track ............... 59 58 54 55 52 48 49 11 78
Mixed (VOL) ............................ 5 7 10 10 9 10 9 11 7Not sure ................................... 3 3 2 2 3 3 3 6 3
6/09 4/09 2/09 1/09 12/08
10/17-20/08
+10/4-5/08+
9/19-22/08+
42 43 41 26 26 12 12 1646 43 44 59 60 78 77 739 10 9 9 10 7 9 9
3 4 6 6 4 3 2 2
8/08+ 7/08+ 6/08+ 4/08+3/7-
10/08+ 1/08+ 9/07 1/0718 13 16 15 20 20 25 2867 74 71 73 66 68 63 5712 10 11 10 11 9 9 133 3 2 2 3 3 3 2
9/06+ 1/06 9/05 1/05 9/04+ 1/04 9/0331 31 32 40 39 47 3854 57 57 47 49 43 5012 10 8 10 10 6 8
3 2 3 3 2 4 4
1/03 9/02 1/02 9/01 12/99
36 42 62 72 49
47 43 20 11 3414 12 14 11 153 3 4 6 2
+ Results shown reflect responses among registered voters.
Q4a In general, do you approve or disapprove of the job that Barack Obama is doing as president?
3/101/23-25/10
1/10-14/10 12/09 10/09 9/09 8/09 7/09
Approve .................................... 48 50 48 47 51 51 51 53
Disapprove ............................... 47 44 43 46 42 41 40 40Not sure .................................. 5 6 9 7 7 8 9 7
6/09 4/09 2/0956 61 6034 30 2610 9 14

8/14/2019 HART/McINTURFF March 2010 Interviews: 1,000 Adults, Including104
http://slidepdf.com/reader/full/hartmcinturff-march-2010-interviews-1000-adults-including104 3/29
HART/McINTURFF Study #10156--page 3March 2010 NBC News/Wall Street Journal Survey
Q4b Do you generally approve or disapprove of the job that Barack Obama is doing in handling the economy?
3/101/23-25/10
1/10-14/10 12/09 10/09 9/09 7/09
Approve ............................................ 47 47 43 42 47 50 49Disapprove ........................................ 50 49 49 51 46 42 44Not sure .......................................... 3 4 8 7 7 8 7
6/09 4/09 2/0951 55 5638 37 3111 8 13
Q5a Do you generally approve or disapprove of the job Barack Obama is doing in handling the war inAfghanistan?
3/10* 12/09Approve ............................................ 53 46Disapprove ....................................... 35 42Not sure .......................................... 12 12
*Asked of one-half the respondents (FORM A).
Q5b In general, do you approve or disapprove of the job that Barack Obama is doing in handling the situation inIraq?
3/10**Approve ............................................ 53Disapprove ........................................ 39Not sure .......................................... 8
**Asked of one-half the respondents (FORM B).
BUSH TREND
4/06 3/06 1/06 12/05 11/05
Approve ....................................... 33 35 39 36 32Disapprove .................................. 62 61 56 60 64Not sure .................................... 5 4 5 4 4
9/05 7/05 5/0537 39 4458 55 525 6 4
Q6 And, how would you rate Barack Obama on improving America's image around the world? Use a five-pointscale, on which a "five" means a very good rating, a "one" means a very poor rating, and a "three" means amixed rating.
Very Good
Rating
Very Poor
Rating Cannot
5 4 3 2 1 Rate
Improving America's image around the world* 17 18 31 11 22 1
35 33
* Asked of one-half the respondents (FORM A).
8/14/2019 HART/McINTURFF March 2010 Interviews: 1,000 Adults, Including104
http://slidepdf.com/reader/full/hartmcinturff-march-2010-interviews-1000-adults-including104 4/29
HART/McINTURFF Study #10156--page 4March 2010 NBC News/Wall Street Journal Survey
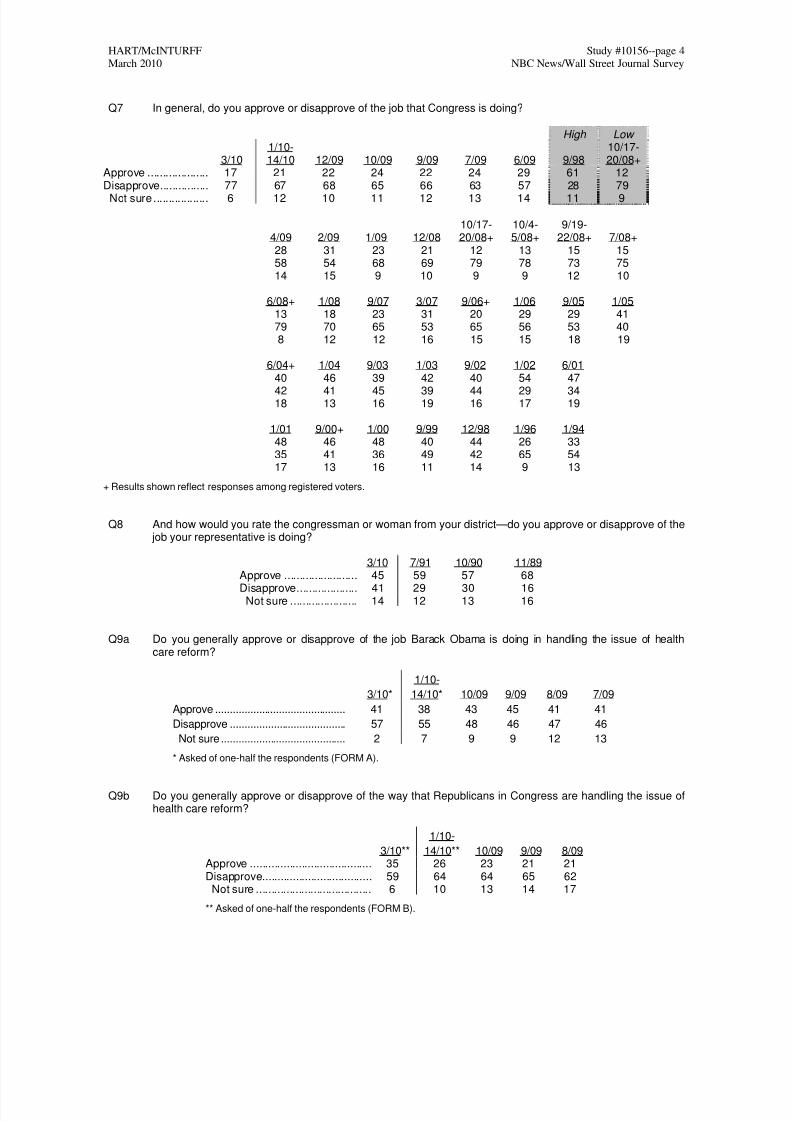
Q7 In general, do you approve or disapprove of the job that Congress is doing?
High Low
3/101/10-14/10 12/09 10/09 9/09 7/09 6/09 9/98
10/17-20/08+
Approve .................... 17 21 22 24 22 24 29 61 12
Disapprove................ 77 67 68 65 66 63 57 28 79Not sure .................. 6 12 10 11 12 13 14 11 9
4/09 2/09 1/09 12/0810/17-20/08+
10/4-5/08+
9/19-22/08+ 7/08+
28 31 23 21 12 13 15 1558 54 68 69 79 78 73 7514 15 9 10 9 9 12 10
6/08+ 1/08 9/07 3/07 9/06+ 1/06 9/05 1/0513 18 23 31 20 29 29 4179 70 65 53 65 56 53 408 12 12 16 15 15 18 19
6/04+ 1/04 9/03 1/03 9/02 1/02 6/01
40 46 39 42 40 54 4742 41 45 39 44 29 3418 13 16 19 16 17 19
1/01 9/00+ 1/00 9/99 12/98 1/96 1/9448 46 48 40 44 26 3335 41 36 49 42 65 5417 13 16 11 14 9 13
+ Results shown reflect responses among registered voters.
Q8 And how would you rate the congressman or woman from your district—do you approve or disapprove of the job your representative is doing?
3/10 7/91 10/90 11/89Approve ........................ 45 59 57 68Disapprove .................... 41 29 30 16Not sure ...................... 14 12 13 16
Q9a Do you generally approve or disapprove of the job Barack Obama is doing in handling the issue of healthcare reform?
3/10*
1/10-
14/10* 10/09 9/09 8/09 7/09
Approve ............................................. 41 38 43 45 41 41
Disapprove ........................................ 57 55 48 46 47 46
Not sure ........................................... 2 7 9 9 12 13
* Asked of one-half the respondents (FORM A).
Q9b Do you generally approve or disapprove of the way that Republicans in Congress are handling the issue ofhealth care reform?
3/10**
1/10-
14/10** 10/09 9/09 8/09Approve ........................................ 35 26 23 21 21Disapprove .................................... 59 64 64 65 62Not sure ...................................... 6 10 13 14 17
** Asked of one-half the respondents (FORM B).

8/14/2019 HART/McINTURFF March 2010 Interviews: 1,000 Adults, Including104
http://slidepdf.com/reader/full/hartmcinturff-march-2010-interviews-1000-adults-including104 5/29
HART/McINTURFF Study #10156--page 5March 2010 NBC News/Wall Street Journal Survey
Q10 Now I'm going to read you the names of several public figures and groups, and I'd like you to rate yourfeelings toward each one as either very positive, somewhat positive, neutral, somewhat negative, or verynegative. If you don't know the name, please just say so.
Very
Positive
Somewhat
Positive Neutral
Somewhat
Negative
Very
Negative
Don't KnowName/
Not SureBarack Obama
March 2010 ............................... 31 19 11 14 24 1
January 23-25, 2010 ................. 29 23 14 14 20 -
January 10-14, 2010 ................. 29 23 12 16 19 1
December 2009 ........................ 29 21 13 15 22 -
October 2009 ............................ 36 20 11 12 21 -
September 2009 ....................... 38 18 11 14 19 -
July 2009 .................................. 37 18 10 14 20 1
June 2009 ................................. 41 19 11 12 17 -
April 2009 ................................. 45 19 12 10 13 1
February 2009 .......................... 47 21 12 9 10 1
January 2009 ............................ 43 23 17 8 6 3
December 2008 ........................ 45 22 15 8 8 2
October 17-20, 2008+ ............... 37 19 10 10 23 1
October 4-5, 2008+ ................... 30 22 12 12 23 1
September 19-22, 2008+ .......... 29 19 15 14 22 1
September 6-8, 2008+ .............. 33 20 13 12 20 2
August 2008+ ........................... 28 22 13 17 19 1
July 2008+ ................................ 27 21 16 11 23 2
June 2008+ ............................... 25 23 17 11 22 2
April 2008+ ............................... 23 23 16 17 20 1
March 2008+ ............................. 24 25 18 16 16 1
January 2008 ............................ 19 30 22 11 14 4December 2007 ........................ 17 29 22 14 12 6
November 2007 ........................ 15 28 24 12 12 9
September 2007 ....................... 15 27 23 13 12 10
July 2007 .................................. 16 26 24 12 10 12
April 2007 ................................. 19 26 25 8 6 16
March 2007 ............................... 18 19 26 11 6 20
High
February 2009 .......................... 47 21 12 9 10 1
Low
Oct. 28-30, 2006+ ..................... 14 17 18 5 6 40
+ Results shown reflect responses among registered voters.

8/14/2019 HART/McINTURFF March 2010 Interviews: 1,000 Adults, Including104
http://slidepdf.com/reader/full/hartmcinturff-march-2010-interviews-1000-adults-including104 6/29

8/14/2019 HART/McINTURFF March 2010 Interviews: 1,000 Adults, Including104
http://slidepdf.com/reader/full/hartmcinturff-march-2010-interviews-1000-adults-including104 7/29
HART/McINTURFF Study #10156--page 7March 2010 NBC News/Wall Street Journal Survey
Q.10 (cont'd)
VeryPositive
SomewhatPositive Neutral
SomewhatNegative
VeryNegative
Don't KnowName/
Not Sure
The Republican Party
March 2010 ................................ 6 25 24 20 23 2
January 23-25, 2010 .................. 7 25 27 18 20 3January 10-14, 2010 .................. 7 23 27 24 18 1
December 2009 .......................... 5 23 27 24 19 2
October 2009 ............................. 6 19 27 23 23 2
September 2009 ......................... 5 23 27 22 21 2
July 2009 .................................... 9 19 29 21 20 2
June 2009 .................................. 6 19 29 23 21 2
April 2009 ................................... 7 22 25 22 22 2
February 2009 ............................ 7 19 24 25 22 3
December 2008 .......................... 7 20 20 26 26 1
October 17-20, 2008+ ................ 11 21 18 23 25 2
October 4-5, 2008+ .................... 12 23 17 21 26 1
September 19-22, 2008+ ........... 13 21 18 19 28 1
September 6-8, 2008+ ............... 18 22 15 18 25 2
August 2008+ ............................. 10 25 22 19 23 1
July 2008+ .................................. 8 23 20 22 26 1
June 2008+ ................................ 7 21 24 22 25 1
April 2008+ ................................. 8 19 23 22 26 2
March 7-10, 2008+ ..................... 10 24 15 21 28 2
January 2008 ............................. 13 21 26 19 18 3
November 2007 .......................... 8 24 24 20 22 2
September 2007 ......................... 8 23 20 27 20 2
July 2007 .................................... 8 25 19 23 23 2
January 2007 ............................. 10 23 21 23 21 2
Oct 28-30, 2006+ ....................... 15 20 16 20 28 1
July 2006 .................................... 11 22 18 21 25 3January 2006 ............................. 13 24 20 20 22 1
May 2005 ................................... 13 27 17 19 22 2
February 2005 ............................ 17 27 19 18 18 1
October 2004+ ........................... 20 24 18 15 22 1
January 2002 ............................. 20 32 24 12 9 3
January 1998 ............................. 9 29 30 18 12 2
January 1994 ............................. 12 30 29 16 9 4
High
December 2001 .......................... 21 36 18 13 9 3
Low
October 2009 ............................. 6 19 27 23 23 2

8/14/2019 HART/McINTURFF March 2010 Interviews: 1,000 Adults, Including104
http://slidepdf.com/reader/full/hartmcinturff-march-2010-interviews-1000-adults-including104 8/29
HART/McINTURFF Study #10156--page 8March 2010 NBC News/Wall Street Journal Survey
Q.10 (cont'd)
VeryPositive
SomewhatPositive Neutral
SomewhatNegative
VeryNegative
Don't KnowName/
Not Sure
The Tea Party Movement
March 2010 ................................. 13 16 22 10 18 21
January 23-25, 2010 ................... 14 14 20 6 15 31Karl RoveMarch 2010* ............................... 5 9 17 11 20 38November 2005* ......................... 3 7 18 10 25 37
Tiger Woods
March 2010* ............................... 7 9 39 20 18 7December 2009 .......................... 5 10 38 18 24 5April 1997 ................................... 57 19 13 1 1 9
Rahm Emanuel
March 2010** .............................. 4 12 18 7 17 42
January 2009 ** .......................... 3 12 18 7 7 53
Sarah Palin
March 2010** .............................. 12 18 21 13 32 4
December 2009 .......................... 14 18 23 14 26 5
October 2009 .............................. 11 16 22 15 31 5
July 2009 .................................... 14 18 20 16 27 5
April 2009 ................................... 14 18 24 11 27 6
December 2008 ** ...................... 15 20 16 15 30 4
October 17-20, 2008+ ................. 23 15 13 13 34 2
October 4-5, 2008+ ..................... 26 18 15 15 22 4
September 19-22, 2008+ ............ 26 16 17 12 24 5
September 6-8, 2008+ ................ 30 17 17 10 17 9
Mitt Romney
March 2010** .............................. 7 20 29 16 9 19
July 2009* ................................... 10 18 30 12 8 22April 2008+ **.............................. 9 19 31 17 11 13
January 2008 .............................. 7 21 24 19 13 16
December 2007 .......................... 9 16 26 16 11 22
November 2007 .......................... 4 18 27 17 12 22
September 20074....................... 6 18 26 14 11 25
June 2007 * ................................ 5 16 23 13 7 36
March 2007 ** ............................. 4 11 24 11 6 44
December 2006 .......................... 3 8 22 7 4 56* Asked of one-half the respondents (FORM A).** Asked of one-half the respondents (FORM B).+ Results shown reflect responses among registered voters.

8/14/2019 HART/McINTURFF March 2010 Interviews: 1,000 Adults, Including104
http://slidepdf.com/reader/full/hartmcinturff-march-2010-interviews-1000-adults-including104 9/29
HART/McINTURFF Study #10156--page 9March 2010 NBC News/Wall Street Journal Survey
THIS TABLE IS RANKED BY D/S (TOTAL POSITIVE – TOTAL NEGATIVE)
Summary Table of ImagesTotal
PositiveTotal
NegativeD/S
Barack Obama 50 38 12
Mitt Romney 27 25 2
The Tea Party Movement 29 28 1
The Democratic Party 37 43 -6Rahm Emanuel 16 24 -8
The Republican Party 31 43 -12
Sarah Palin 30 45 -15
Karl Rove 14 31 -17
Tiger Woods 16 38 -22
(ASK ALL)Q11 Please tell me how interested you are in November's elections, using a scale from one to ten, on which a
"ten" means that you are very interested in November's elections and a "one" means that you are not at allinterested. You may choose any number from one to ten. (IF "NOT SURE," RECORD AS "DK.")
3/10+1/23-
25/10+1/10-14/10 12/09 12/07 11/07
10/13-16/06+
9/30-10/2/06+
10, very interested ..................... 47 41 44 48 62 59 53 469 ................................................. 6 6 5 6 9 9 8 98 ................................................. 15 16 12 12 13 12 14 177 ................................................. 9 10 10 10 5 7 7 126 ................................................. 5 5 7 5 3 3 6 55 ................................................. 9 14 11 9 4 5 5 64 ................................................. 2 2 2 2 1 1 2 13 ................................................. 3 2 2 2 1 1 1 22 ................................................. - 1 1 1 - - 1 -1, not interested at all ................. 4 3 5 5 2 3 3 2Cannot rate .............................. - - 1 - - - - -
9/8-
11/06+
7/06+ 6/06+ 4/06+ 3/06+ 1/06+
47 51 47 49 45 468 9 8 7 7 716 17 17 17 18 1510 10 9 10 11 125 4 5 5 5 58 6 8 7 7 72 2 1 2 1 21 - 2 - 2 1- - 1 1 1 12 1 2 2 3 41 - - - - -
+ Results shown reflect responses among registered voters.

8/14/2019 HART/McINTURFF March 2010 Interviews: 1,000 Adults, Including104
http://slidepdf.com/reader/full/hartmcinturff-march-2010-interviews-1000-adults-including104 10/29
HART/McINTURFF Study #10156--page 10March 2010 NBC News/Wall Street Journal Survey
Q12a What is your preference for the outcome of this year's congressional elections--(ROTATE:) a Congresscontrolled by Republicans or a Congress controlled by Democrats?
3/10+1/23-
25/10+1/10-
14/10+ 12/09+ 10/09+ 9/09+ 7/09+ 4/09+ 11/08+Republican-controlled Congress ..... 42 42 41 41 38 40 39 39 36
Democrat-controlled Congress ....... 45 44 41 43 46 43 46 48 48Not sure ........................................ 13 14 18 16 16 17 15 13 16
10/08+ 9/08+ 8/08+ 7/08+ 6/08+ 4/08+ 3/08+36 37 36 36 33 34 3549 50 47 49 52 49 4915 13 17 15 15 17 16
11/07+ 9/07+ 10/06+ 9/06+ 7/06+ 6/06+ 4/06+37 35 37 39 38 38 3946 47 52 48 48 49 4517 18 11 13 14 13 16
3/06+ 1/06+ 12/05+ 11/05+ 10/05+ 7/05+ 5/05+37 38 38 37 39 40 4050 47 46 48 48 45 4713 15 16 15 13 15 13
10/04+ 9/04+ 6/04+ 5/04+ 3/04+ 1/04 12/13/03
43 42 42 41 42 42 4244 46 44 44 45 43 4213 12 14 15 13 15 16
10/02+ 9/02 7/02 6/02 1/02 12/01 12/99
43 42 43 42 44 42 4042 42 41 41 40 40 4415 16 16 17 16 18 16
10/99 7/99 6/99 4/99 3/99 10/98+ 9/98
39 39 42 41 37 41 4041 43 41 40 43 43 3920 18 17 19 20 16 21
7/98 6/98 2/98 1/98 12/97 9/97 7/97 4/97
41 39 41 40 41 41 45 4440 40 37 42 37 39 39 3819 21 22 18 22 20 16 18
+ Results shown reflect responses among registered voters.

8/14/2019 HART/McINTURFF March 2010 Interviews: 1,000 Adults, Including104
http://slidepdf.com/reader/full/hartmcinturff-march-2010-interviews-1000-adults-including104 11/29
HART/McINTURFF Study #10156--page 11March 2010 NBC News/Wall Street Journal Survey
Q12b In the next election for U.S. Congress, do you feel that your representative deserves to be reelected, or doyou think that it is time to give a new person a chance?
3/10+1/10-
14/10+ 12/09+ 10/09+ 9/09+ 7/08+ 11/07+Deserves to be reelected ........... 38 39 38 41 40 40 39
Give new person a chance ........ 51 49 49 49 49 47 51Not sure ................................... 11 12 13 10 11 13 10
6/07+10/13-16/06+
9/30-10/2/06+
9/8-11/06+ 7/06+ 6/06+
41 39 38 41 38 4248 45 45 43 48 4511 16 17 16 14 13
3/06+ 1/06+ 12/05+ 11/05+ 5/05+ 10/04+41 41 41 37 42 4948 46 44 51 45 3411 13 15 12 13 17
10/02+ 9/02 10/00+ 9/00+ 6/00+ 12/99 10/98+
42 41 50 49 49 42 4839 42 35 38 39 47 3719 17 15 13 12 11 15
12/97+ 10/94+ 9/94 5/94 1/94 10/93 9/9341 39 30 34 35 34 3745 49 53 50 47 52 4714 12 17 16 18 14 16
7/93 10/92+ 9/92+ 7/92+ 4/92+ 2/92+ 1/92+30 31 31 27 33 37 4255 56 56 62 57 52 4815 13 13 11 10 11 10
+ Results shown reflect responses among registered voters.

8/14/2019 HART/McINTURFF March 2010 Interviews: 1,000 Adults, Including104
http://slidepdf.com/reader/full/hartmcinturff-march-2010-interviews-1000-adults-including104 12/29
HART/McINTURFF Study #10156--page 12March 2010 NBC News/Wall Street Journal Survey
Q12c In general, do you think that it is better for the same political party to control both the Congress and thepresidency, so they can work together more closely, or do you think that it is better to have different politicalparties controlling the Congress and the presidency to prevent either one from going too far?
3/1010/4-5/08+ 12/13/03 12/02 10/00+
9/00+ 12/
All
Adults
Reg
Voters+etter if same party controls Congress and the presidency 30 31 41 32 29 41 41 3etter if different parties control Congress and the presidency 61 60 48 57 62 47 47 6Not sure 9 9 11 11 9 12 12 7
9/98 9/97 6/96+ 12/95 1/95 10/9434 25 43 42 33 3655 67 44 48 55 5511 8 13 10 12 9
6/94 1/94 10/93 12/92 4/92+ 1/92+30 33 30 37 32 2859 56 58 51 61 6211 11 12 12 7 10
10/92+ 12/92 9/92+ 8/92+ 7/92+ 4/92+39 37 40 43 40 3247 51 46 44 47 6114 12 14 13 13 7
1/92+ 10/91+ 10/90+ 1/90+ 9/86+28 24 23 24 2862 67 67 63 6410 9 10 13 8
Results shown reflect responses among registered voters.

8/14/2019 HART/McINTURFF March 2010 Interviews: 1,000 Adults, Including104
http://slidepdf.com/reader/full/hartmcinturff-march-2010-interviews-1000-adults-including104 13/29
HART/McINTURFF Study #10156--page 13March 2010 NBC News/Wall Street Journal Survey
(ASKED OF RESPONDENTS WHO HAD HEARD OF THE TEA PARTY MOVEMENT, Q10:1-5)Q13 From what you know about the so-called Tea Party Movement, would it be a third party that you would be
interested in voting for this year for Congress?
3/10+Yes ......................................................................................................... 20
No .......................................................................................................... 50Depends (VOL) ................................................................................... 5Not sure ............................................................................................... 7
Unaware of Tea Party (10:6) ................................................................. 18+ Results shown reflect responses among registered voters.
Now, thinking some more about you preference for who controls Congress…
(RESULTS REFLECT REGISTERED VOTERS WHO PREFER REPUBLICAN CONTROL OF CONGRESS(Q12a:1))Q14a Which one or two of the following reasons best explains why you would prefer the Republicans to be in
control of Congress? (RANDOMIZE LIST. ACCEPT UP TO TWO RESPONSES.)
TABLE RANKED BY HIGHEST PERCENTAGE
3/10+To reduce government spending ....................................................................... 42To stop health care legislation ........................................................................... 29To keep taxes down .......................................................................................... 24To promote moral values ................................................................................... 16To protest the policies of Barack Obama ........................................................... 11To strengthen national defense ......................................................................... 10To stop Democrats from controlling Congress................................................... 10To protest against special interests ................................................................... 4Other (VOL) .................................................................................................... 2
All of these (VOL) ........................................................................................... 6None of these (VOL) ....................................................................................... 1
+ Results shown reflect responses among registered voters.
(RESULTS REFLECT REGISTERED VOTERS WHO PREFER DEMOCRATIC CONTROL OF CONGRESS(Q12a:2))Q14b Which one or two of the following reasons best explains why you would prefer the Democrats to be in control
of Congress? (RANDOMIZE LIST. ACCEPT UP TO TWO RESPONSES.)
TABLE RANKED BY HIGHEST PERCENTAGE
3/10+To look out for working people ................................................................... 39To pass health care legislation ................................................................... 31To support the policies of Barack Obama................................................... 28To protest against special interests ............................................................ 10To prevent Republicans from controlling Congress .................................... 10
To continue current economic policies ....................................................... 7To support policy in Iraq and Afghanistan .................................................. 6To continue in the same direction in Washington ....................................... 6Other (VOL) ............................................................................................. 2All of these (VOL) .................................................................................... 1None of these (VOL) ................................................................................ 2
+ Results shown reflect responses among registered voters.

8/14/2019 HART/McINTURFF March 2010 Interviews: 1,000 Adults, Including104
http://slidepdf.com/reader/full/hartmcinturff-march-2010-interviews-1000-adults-including104 14/29
HART/McINTURFF Study #10156--page 14March 2010 NBC News/Wall Street Journal Survey
(ROTATE Q15 AND Q16)Now, switching topics... Q15 Now I'm going to list some government offices, and I'd like you to tell me how much of the time you trust
each one to do what is right--just about always, most of the time, only some of the time or never.(RANDOMIZE)
TABLE RANKED BY HIGHEST PERCENTAGE OF TOTAL ALWAYS/MOST
Total
Always/
Most
Justabout
Always
Mostof theTime
Total
Some/
Never
Onlysome ofthe time Never
NotSure D
The President .................................................................... 49 15 34 51 33 18 -
Your mayor ........................................................................ 46 13 33 42 31 11 12
Your representative in the U.S. House of Representatives 41 9 32 54 44 10 5 -
Your U.S. Senators ............................................................ 38 8 30 60 49 11 2 -
Your governor .................................................................... 37 8 29 60 39 21 3 -
Your state legislature ....................................................... 34 6 28 60 49 11 6 -
The U.S. Congress ............................................................ 23 4 19 76 59 17 1 -

8/14/2019 HART/McINTURFF March 2010 Interviews: 1,000 Adults, Including104
http://slidepdf.com/reader/full/hartmcinturff-march-2010-interviews-1000-adults-including104 15/29
HART/McINTURFF Study #10156--page 15March 2010 NBC News/Wall Street Journal Survey
Q16 When it comes to (READ ITEM) which party do you think would do a better job--the Democratic Party, theRepublican Party, or both about the same? If you think that neither would do a good job, please just say so.(RANDOMIZE)
THIS TABLE HAS BEEN RANKED BY THE PERCENTAGE WHO GIVE THE ADVANTAGE TO THE DEMOCRATIC PARTY
PartyAdvantage DemocraticParty RepublicanParty Both AboutThe Same Neither NotSure
Dealing with global warming
March 2010 ................................. D-24 39 15 18 21 7
July 2009*.................................... D-27 40 13 22 19 6
January 2008 .............................. D-45 53 8 22 10 7
July 2007 ..................................... D-39 48 9 19 17 7
Dealing with health care
March 2010 ................................. D-9 37 28 15 19 1
July 2009 ..................................... D-17 40 23 15 19 3
July 2008+ ................................... D-31 49 18 12 16 5
January 2008 ............................... D-36 51 15 17 12 5
July 2007 ..................................... D-36 49 13 14 21 3March 2006 ................................. D-31 43 12 21 19 5
November 2005 ........................... D-26 43 17 17 18 5
December 2004 ........................... D-18 39 21 23 11 6
January 2004 ............................... D-26 48 22 18 10 2
December 13, 2003 ..................... D-18 43 25 14 13 6
October 2002+ ............................ D-25 46 21 19 11 3
June 2002.................................... D-22 38 16 23 18 5
June 2001.................................... D-21 41 20 21 12 6
December 1999 ........................... D-26 43 17 21 13 6
March 1999 ................................. D-24 42 18 23 12 5
October 1998+ ............................ D-20 41 21 26 8 4September 1998 .......................... D-20 40 20 24 13 3
June 1998.................................... D-13 25 12 34 23 6
May 1996..................................... D-20 42 22 16 17 3
December 1995 ........................... D-21 43 22 13 16 6
October 1994 ............................... D-12 37 25 12 20 6
July 1994 ..................................... D-16 37 21 18 18 6
May 1994..................................... D-9 26 17 38 15 4
October 1993 ............................... D-28 44 16 16 18 6
March 1993 ................................. D-48 57 9 17 12 5
July 1992+ ................................... D-34 44 10 21 19 6
April 1992+ .................................. D-36 48 12 17 18 5
October 1991+ ............................ D-34 46 12 18 16 8
October 1991 ............................... D-23 39 16 24 12 9
+ Results shown reflect responses among registered voters.* Asked of one-half the respondents (FORM A).** Asked of one-half the respondents (FORM B).

8/14/2019 HART/McINTURFF March 2010 Interviews: 1,000 Adults, Including104
http://slidepdf.com/reader/full/hartmcinturff-march-2010-interviews-1000-adults-including104 16/29
HART/McINTURFF Study #10156--page 16March 2010 NBC News/Wall Street Journal Survey
Q.16 (cont’d) PartyAdvantage
DemocraticParty
RepublicanParty
Both AboutThe Same Neither
NotSure
Dealing with the economy
March 2010 ............................... - 31 31 18 18 2
July 2009 ..................................... D-6 35 29 19 14 3
July 2008+ ................................... D-16 41 25 14 14 6January 2008 ............................... D-18 43 25 21 8 3
July 2007 ..................................... D-15 41 26 17 12 4
October 13-16, 2006+ ................. D-13 43 30 17 7 3
September 2006+ ........................ D-12 40 28 17 10 5
March 2006 ................................. D-12 39 27 20 11 3
November 2005 ........................... D-14 39 25 17 14 5
December 2004 ........................... D-9 39 30 20 7 4
July 2004+ ................................... D-8 40 32 19 7 2
January 2004+ ............................ R-2 36 38 15 8 2
December 13, 2003 ..................... R-1 37 38 14 7 5
October 2002+ ............................ D-6 36 30 21 9 4
June 2002.................................... D-1 32 31 24 9 4
June 2001.................................... D-6 37 31 20 6 6
December 1999 ........................... D-3 34 31 24 7 4
March 1999 ................................. D-6 35 29 26 6 4
September 1998 ............................ - 31 31 29 6 3
September 1997 ............................ R-9 25 34 26 9 6
October 1996 ................................. D-4 36 32 15 10 7
May 1996+ .................................. R-4 26 30 27 14 3
December 1995 ........................... R-8 22 30 27 17 4
June 1995.................................... R-12 17 29 29 23 2
October 1994 ............................... R-8 22 30 28 16 4
July 1994 ..................................... R-11 18 29 32 17 4June 1994.................................... R-5 21 26 39 12 2
October 1993 ............................... R-5 22 27 20 28 3
March 1993 ................................. D-16 34 18 34 11 3
July 1992+ ................................. D-8 26 18 35 18 3
May 1992................................... D-6 29 23 26 17 5
January 1992+ .......................... D-5 28 23 33 12 4
October 1991+ .......................... R-1 27 28 26 14 5
+ Results shown reflect responses among registered voters.* Asked of one-half the respondents (FORM A).** Asked of one-half the respondents (FORM B).

8/14/2019 HART/McINTURFF March 2010 Interviews: 1,000 Adults, Including104
http://slidepdf.com/reader/full/hartmcinturff-march-2010-interviews-1000-adults-including104 17/29
HART/McINTURFF Study #10156--page 17March 2010 NBC News/Wall Street Journal Survey
Q.16 (cont’d) PartyAdvantage
DemocraticParty
RepublicanParty
Both AboutThe Same Neither
NotSure
Reducing the federal deficit
March 2010 ................................. R-6 24 30 18 25 3
July 2009 ..................................... R-6 25 31 18 22 4
January 2008 .............................. D-22 42 20 17 15 6July 2007 ..................................... D-25 43 18 14 21 4
November 2005 .......................... D-19 38 19 15 22 6
January 2004 ............................... D-11 37 26 18 15 4
December 13, 2003 ..................... D-13 38 25 12 16 10
September 1997 ............................ R-8 23 31 22 18 6
October 1996 ................................. R-3 29 32 11 19 9
June 1995 ...................................... R-21 16 37 17 26 4
October 1993 ................................. D-4 27 23 27 18 5
March 1993 .................................... D-23 39 16 23 18 4
April 1992+ .................................... D-1 20 19 18 37 6
October 1991+ ............................... R-5 24 29 16 24 7
October 1990+ ............................... R-2 25 27 19 23 6
Dealing with taxes
March 2010 ................................. R-11 25 36 19 18 2
July 2009 ..................................... R-7 28 35 17 16 4
July 2008+ ................................... D-1 37 36 8 15 4
January 2008 .............................. D-5 36 31 17 12 4
July 2007 ..................................... D-9 36 27 14 18 5
March 2006 ................................. D-9 35 26 21 15 3
November 2005 ........................... D-10 40 30 14 12 4
January 2004 .............................. R-2 35 37 16 10 2
December 13, 2003 ..................... R-3 34 37 12 9 9
October 2002+ ............................ R-5 31 36 17 11 5June 2002.................................... R-6 27 33 20 15 5
June 2001.................................... R-8 28 36 20 11 5
December 1999 ........................... R-3 30 33 19 13 5
March 1999 ................................. R-6 29 35 20 12 4
September 1997 ............................ R-5 26 31 20 16 7
October 1998+ ............................ - 32 32 21 10 5
September 1998 .......................... R-6 29 35 22 11 3
October 1996 ................................. R-5 30 35 15 13 7
May 1996+ .................................. R-9 25 34 17 19 5
December 1995 ........................... R-8 26 34 14 20 6
June 1995.................................... R-13 22 35 15 22 6November 1994 ........................... R-13 23 36 16 17 8
October 1994 ............................... R-15 23 38 17 18 4
October 1993 ............................... R-11 23 34 16 23 4
+ Results shown reflect responses among registered voters.* Asked of one-half the respondents (FORM A).** Asked of one-half the respondents (FORM B).

8/14/2019 HART/McINTURFF March 2010 Interviews: 1,000 Adults, Including104
http://slidepdf.com/reader/full/hartmcinturff-march-2010-interviews-1000-adults-including104 18/29
HART/McINTURFF Study #10156--page 18March 2010 NBC News/Wall Street Journal Survey
Q.16 (cont’d) PartyAdvantage
DemocraticParty
RepublicanParty
Both AboutThe Same Neither
NotSure
Dealing with the war onterrorism
March 2010* .............................. R-14 22 36 25 15 2
July 2009** .................................. R-8 26 34 25 11 4July 2008+ ................................... R-11 29 40 16 10 5
January 2008 .............................. R-1 30 31 27 8 4
July 2007 ..................................... - 29 29 20 18 4
October 13-16, 2006+ ................. R-10 25 35 25 11 4
September 8-11, 2006+ ............... R-14 24 38 21 12 5
November 2005 ........................... R-9 26 35 23 11 5
December 2004 ........................... R-18 24 42 22 7 5
January 2004 ............................... R-24 23 46 22 6 3
December 13, 2003 ..................... R-26 20 46 19 9 5
October 2002+ ............................ R-36 13 49 27 6 5
Dealing with terrorism
March 2010** ............................. R-21 16 37 33 12 2
+ Results shown reflect responses among registered voters.* Asked of one-half the respondents (FORM A).** Asked of one-half the respondents (FORM B).

8/14/2019 HART/McINTURFF March 2010 Interviews: 1,000 Adults, Including104
http://slidepdf.com/reader/full/hartmcinturff-march-2010-interviews-1000-adults-including104 19/29
HART/McINTURFF Study #10156--page 19March 2010 NBC News/Wall Street Journal Survey
And, thinking again about Congress…Q17a If there were a place on your ballot that allowed you to vote to defeat and replace every single member of
Congress, including your own representative, would you do this, or not?
3/10+Yes ..................................................................... 50
No ....................................................................... 47Not sure ............................................................ 3+ Results shown reflect responses among registered voters.
(RESULTS REFLECT REGISTERED VOTERS WHO SAY “YES” IN Q17a).Q17b What if this meant that even though there would be all new members the Democrats would still control the
majority in the Congress? Would you still vote to replace every member of Congress, or not?
3/10+Yes ..................................................................... 72No ...................................................................... 22Not sure............................................................ 6
+ Results shown reflect responses among registered voters.
(RESULTS REFLECT REGISTERED VOTERS WHO RESPONDENTS WHO SAY “YES” IN Q17a).Q17c What if this meant that even though there would be all new members the Republicans would control the
majority in the Congress? Would you still vote to replace every member of Congress, or not?
3/10+Yes ...................................................................... 73No ....................................................................... 24Not sure ............................................................ 3
+ Results shown reflect responses among registered voters.

8/14/2019 HART/McINTURFF March 2010 Interviews: 1,000 Adults, Including104
http://slidepdf.com/reader/full/hartmcinturff-march-2010-interviews-1000-adults-including104 20/29
HART/McINTURFF Study #10156--page 20March 2010 NBC News/Wall Street Journal Survey
Q18a Please tell me which one or two of the following words or phrases best describe your feelings about mostmembers of Congress. If you do not have an opinion just say so. (RANDOMIZE LIST. ACCEPT UP TOTWO RESPONSES.)
TABLE RANKED BY HIGHEST PERCENTAGE
3/10*
Are only interested in staying in office ........................................................ 37Too close to special interest groups ........................................................... 28
Too partisan ................................................................................................ 19
Supporting pork projects that create government waste ............................. 16
Getting things done for the people they represent ...................................... 6
Looking out for the needs of average people .............................................. 6
Care about the country ............................................................................... 5
Hard working............................................................................................... 4
No Opinion ............................................................................................... 14
None of these (VOL) ................................................................................ 1
* Asked of one-half the respondents (FORM A).
Q18b Please tell me which one or two of the following words or phrases best describe your feelings about yourown member in Congress. If you do not have an opinion just say so. (RANDOMIZE LIST. ACCEPT UP TOTWO RESPONSES.)
TABLE RANKED BY HIGHEST PERCENTAGE 3/10**
Are only interested in staying in office .......................................................... 23
Getting things done for the people they represent ........................................ 13
Too close to special interest groups ............................................................. 12
Hard working................................................................................................. 10
Too partisan .................................................................................................. 10
Looking out for the needs of average people ................................................ 10
Cares about the country ............................................................................... 9
Supporting pork projects that create government waste ............................... 5
No Opinion ................................................................................................. 31None of these (VOL) .................................................................................. -
** Asked of one-half the respondents (FORM B).
Q19 As you may know, there have been a number of allegations of ethics violations and misconduct by membersof Congress. Do you think this Congress has had more ethical problems than those in the past, fewer ethicalproblems than those in the past, or about the same number of ethical problems as those in the past?
3/10 6/06All
AdultsReg.
Voters+10/13-16/06+
AllAdults
Reg.Voters+
More ethical problems ..................................... 30 29 33 33 34Fewer ethical problems ................................... 4 3 3 3 2About the same number of ethical problems ... 63 65 62 60 60Not sure ......................................................... 3 3 2 4 4
+ Results shown reflect responses among registered voters.

8/14/2019 HART/McINTURFF March 2010 Interviews: 1,000 Adults, Including104
http://slidepdf.com/reader/full/hartmcinturff-march-2010-interviews-1000-adults-including104 21/29
HART/McINTURFF Study #10156--page 21March 2010 NBC News/Wall Street Journal Survey
Now turning to the economy… Q20 During the next twelve months, do you think that the nation’s economy will get better, get worse, or stay
about the same?
3/101/10-14/10 10/09 9/09 7/09 6/09 4/09 12/08 10/08+
Economy will get better .................... 41 41 42 47 44 46 38 36 38
Economy will get worse ................... 22 19 22 20 21 22 30 28 20Economy will stay about the same... 36 38 33 30 32 29 30 34 37Not sure ......................................... 1 2 3 3 3 3 2 2 5
7/08+ 6/08+ 4/08+ 3/07 1/07 9-10/06+ 6/0625 21 19 16 21 22 1643 49 45 31 16 22 3928 27 29 49 60 51 434 3 7 4 3 5 2
4/06 3/06 1/06 12/05 5/05 1/05 10/04+17 24 24 26 28 43 4344 27 30 34 30 17 1036 46 42 37 36 36 333 3 4 3 6 4 14
9/04+ 5/04+ 3/04+ 1/04 11/03 9/03 7/0343 42 44 50 49 44 4513 16 18 10 15 19 1633 34 35 37 33 33 3411 8 3 3 3 4 4
5/03+ 1/03 12/02 10/02+ 9/02 7/02 4/0249 35 40 41 39 41 5017 25 20 20 18 20 1331 37 35 34 39 37 323 3 5 5 4 2 5
12/01 4/011 3/01 10/98+ 9/98 4/97 1/9650 36 28 17 19 19 21
15 25 29 24 22 22 2132 34 37 54 53 57 523 5 6 5 6 2 6
7/95 4/95 12/94 10/94 9/94 6/94 5/9420 24 31 31 28 28 2721 23 17 24 24 17 2154 50 46 40 44 52 495 3 6 5 4 3 3
3/94 1/94 10/93 9/93 7/93 6/93 4/93 3/9329 44 21 23 20 23 33 3916 16 27 24 29 27 21 1552 36 50 51 48 47 44 433 4 2 2 3 3 2 3
1 Prior to April 2001, the question was phrased, “Over the past year…”+ Results shown reflect responses among registered voters.

8/14/2019 HART/McINTURFF March 2010 Interviews: 1,000 Adults, Including104
http://slidepdf.com/reader/full/hartmcinturff-march-2010-interviews-1000-adults-including104 22/29

8/14/2019 HART/McINTURFF March 2010 Interviews: 1,000 Adults, Including104
http://slidepdf.com/reader/full/hartmcinturff-march-2010-interviews-1000-adults-including104 23/29
HART/McINTURFF Study #10156--page 23March 2010 NBC News/Wall Street Journal Survey
Turning to the issue of health care… Q24 From what you have heard about Barack Obama’s health care plan, do you think his plan is a good idea or a
bad idea? If you do not have an opinion either way, please just say so.
3/101/23-25/10
1/10-14/10 12/09 10/09 9/09 8/09 7/09 6/09 4/09
Good idea ....................... 36 31 33 32 38 39 36 36 33 33Bad idea ......................... 48 46 46 47 42 41 42 42 32 26Do not have an opinion ... 15 22 18 17 16 17 17 17 30 34
Not sure ........................ 1 1 3 4 4 3 5 5 5 7
Q25 Do you think it would be better to pass Barack Obama’s health care plan and make its changes to the healthcare system or to not pass this plan and keep the current health care system?
3/10 12/09 10/09 9/09Better to pass this plan, make these changes ........... 46 41 45 45Better to not pass this plan, keep current system ...... 45 44 39 39Neither (VOL) .......................................................... 4 7 8 9Not sure ................................................................... 5 8 8 7
Q26a If you knew that your representative in Congress voted with the Republicans to defeat the current healthcare bill, would you be more likely or less likely to vote for him or her, or would it make no difference to youeither way in your vote?
3/10+*
More likely .................................................................................. 31
Less likely................................................................................... 34
No difference either way .......................................................... 34
Not sure.................................................................................... 1
+ Results shown reflect responses among registered voters.* Asked of one-half the respondents (FORM A).
Q26b If you knew that your representative in Congress voted with the Democrats to pass the current health carebill, would you be more likely or less likely to vote for him or her, or would it make no difference to you eitherway in your vote?
3/10+**
More likely ................................................................................. 28
Less likely ................................................................................. 36
No difference either way ......................................................... 34
Not sure .................................................................................. 2+ Results shown reflect responses among registered voters.** Asked of one-half the respondents (FORM B).
Q26c And, suppose the health care reform bill passes Congress this year. If a candidate for Congress proposedrepealing and overturning this health care bill, would you be more likely or less likely to vote for him or her,or would it make no difference to you either way in your vote?
3/10+More likely ................................................................................. 37Less likely.................................................................................. 33No difference either way.......................................................... 29Not sure................................................................................... 1
+ Results shown reflect responses among registered voters.
8/14/2019 HART/McINTURFF March 2010 Interviews: 1,000 Adults, Including104
http://slidepdf.com/reader/full/hartmcinturff-march-2010-interviews-1000-adults-including104 24/29
HART/McINTURFF Study #10156--page 24March 2010 NBC News/Wall Street Journal Survey
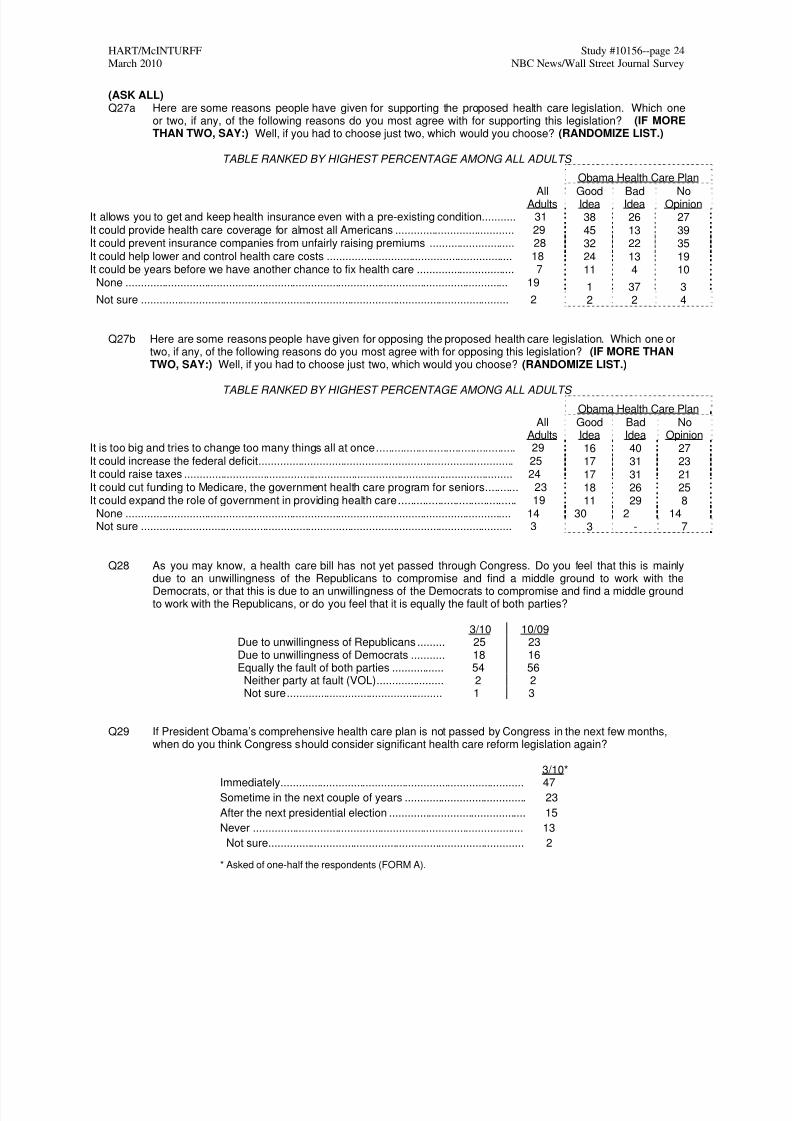
(ASK ALL)Q27a Here are some reasons people have given for supporting the proposed health care legislation. Which one
or two, if any, of the following reasons do you most agree with for supporting this legislation? (IF MORETHAN TWO, SAY:) Well, if you had to choose just two, which would you choose? (RANDOMIZE LIST.)
TABLE RANKED BY HIGHEST PERCENTAGE AMONG ALL ADULTS
Obama Health Care Plan
AllAdults
GoodIdea
BadIdea
NoOpinion
It allows you to get and keep health insurance even with a pre-existing condition ........... 31 38 26 27It could provide health care coverage for almost all Americans ....................................... 29 45 13 39It could prevent insurance companies from unfairly raising premiums ............................ 28 32 22 35It could help lower and control health care costs ............................................................. 18 24 13 19It could be years before we have another chance to fix health care ................................ 7 11 4 10None .............................................................................................................................. 19 1 37 3Not sure ......................................................................................................................... 2 2 2 4
Q27b Here are some reasons people have given for opposing the proposed health care legislation. Which one ortwo, if any, of the following reasons do you most agree with for opposing this legislation? (IF MORE THANTWO, SAY:) Well, if you had to choose just two, which would you choose? (RANDOMIZE LIST.)
TABLE RANKED BY HIGHEST PERCENTAGE AMONG ALL ADULTS
Obama Health Care PlanAll
AdultsGoodIdea
BadIdea
NoOpinion
It is too big and tries to change too many things all at once .............................................. 29 16 40 27It could increase the federal deficit .................................................................................... 25 17 31 23It could raise taxes ............................................................................................................ 24 17 31 21It could cut funding to Medicare, the government health care program for seniors ........... 23 18 26 25It could expand the role of government in providing health care ....................................... 19 11 29 8None ............................................................................................................................... 14 30 2 14Not sure .......................................................................................................................... 3 3 - 7
Q28 As you may know, a health care bill has not yet passed through Congress. Do you feel that this is mainlydue to an unwillingness of the Republicans to compromise and find a middle ground to work with theDemocrats, or that this is due to an unwillingness of the Democrats to compromise and find a middle groundto work with the Republicans, or do you feel that it is equally the fault of both parties?
3/10 10/09Due to unwillingness of Republicans ......... 25 23Due to unwillingness of Democrats ........... 18 16Equally the fault of both parties ................. 54 56Neither party at fault (VOL) ...................... 2 2Not sure ................................................... 1 3
Q29 If President Obama’s comprehensive health care plan is not passed by Congress in the next few months,when do you think Congress should consider significant health care reform legislation again?
3/10*Immediately ................................................................................ 47
Sometime in the next couple of years ........................................ 23
After the next presidential election ............................................. 15
Never ......................................................................................... 13
Not sure.................................................................................... 2
* Asked of one-half the respondents (FORM A).

8/14/2019 HART/McINTURFF March 2010 Interviews: 1,000 Adults, Including104
http://slidepdf.com/reader/full/hartmcinturff-march-2010-interviews-1000-adults-including104 25/29
HART/McINTURFF Study #10156--page 25March 2010 NBC News/Wall Street Journal Survey
Now, thinking about something else…Q30 In the U.S. Senate there is a procedure called the filibuster which prevents legislation from coming to a vote
unless there are sixty votes out of the one-hundred US Senators, meaning that more than a simple majorityis necessary for legislation to pass. Over the last few months, how much have you seen, read, or heardabout the use of this procedure called a filibuster?
3/10
A lot ............................................................................................ 33Some .......................................................................................... 26
Not too much .............................................................................. 23
Nothing at all .............................................................................. 17
Not sure.................................................................................... 1
Q31 Would you favor or oppose the Democrats using a Senate rule called reconciliation that would allow them toavoid a Republican filibuster and resolve the final details of the health care bill so it can pass with a majorityvote? If you do not know enough about this to have an opinion, please say so.
S/R/H Filibuster Procedure
3/10 A lot Some
Not toomuch/
NothingFavor .......................................................................................... 26 44 24 14Oppose ....................................................................................... 35 42 41 24No opinion .................................................................................. 37 13 33 59Not sure .................................................................................... 2 1 2 3
Now changing topics again…Q32a Thinking of the situation in Afghanistan over the past three months, do you think the situation there has
gotten better, gotten worse, or stayed about the same?
3/10*Gotten better ........................................ 25Gotten worse ....................................... 22
Stayed about the same ........................ 50Not sure ............................................. 3
* Asked of one-half the respondents (FORM A).
Q32b Thinking of the situation in Iraq over the past three months, do you think the situation there has gottenbetter, gotten worse, or stayed about the same?
3/10** 6/07 4/07Gotten better ........................................ 31 10 12Gotten worse ........................................ 9 54 49Stayed about the same ........................ 57 33 37Not sure ............................................. 3 3 2
** Asked of one-half the respondents (FORM B).

8/14/2019 HART/McINTURFF March 2010 Interviews: 1,000 Adults, Including104
http://slidepdf.com/reader/full/hartmcinturff-march-2010-interviews-1000-adults-including104 26/29
HART/McINTURFF Study #10156--page 26March 2010 NBC News/Wall Street Journal Survey
Q33 And now, thinking about Iran, if Iran continues with its nuclear research and is close to developing a nuclearweapon, do you believe that the United States should or should not initiate military action to destroy Iran'sability to make nuclear weapons? (IF "SHOULD" OR "SHOULD NOT," ASK:) And do you feel stronglyabout that, or not?
3/10 10/09* 7/08+ 3/07 9/06+ 7/06 4/06Should Initiate Military Action 51
Feel strongly .......................................... 39 45 31 33 38 37 33Do not feel strongly ................................ 12 7 10 10 16 11 9Should NOT Initiate Military Action 38 Do not feel strongly ................................ 11 10 13 12 12 11 13Feel strongly .......................................... 27 27 33 35 27 29 33Depends (VOL) .................................... 3 NA NA NA NA NA 5Not sure ............................................... 8 11 13 10 7 12 7
* Asked of one-half the respondents (FORM A).+ Results shown reflect responses among registered voters.

8/14/2019 HART/McINTURFF March 2010 Interviews: 1,000 Adults, Including104
http://slidepdf.com/reader/full/hartmcinturff-march-2010-interviews-1000-adults-including104 27/29
HART/McINTURFF Study #10156--page 27March 2010 NBC News/Wall Street Journal Survey
FACTUALS: Now I am going to ask you a few questions for statistical purposes only.
Q34/35 Do you have a health plan, that is, are you covered by a private health insurance plan or by a governmentprogram such as Medicare, Medicaid, or Tricare? (IF YES, THEN ASK:) What kind of health plan do youhave? (DO NOT READ LIST. ACCEPT ONLY ONE RESPONSE. IF MORE THAN ONE, ASK:) Well, whatkind of plan would you say your primary plan is? (IF RESPONDENT SAYS SOMETHING NOT ON LIST,RECORD UNDER 6--OTHER.)
Yes, Have A Health Plan Private health insurance ......................... 60MediCARE .............................................. 16MediCAID................................................ 4Tricare ..................................................... 3VA, military .............................................. 1Other (specify) ...................................... 1Don't know what kind of plan ................ 2
NO, Do Not Have A Health Plan ............. 13Don't know/refused ................................. 1
QF1a Are you currently registered to vote at this address?
Registered ....................................... 85Not registered .................................. 15Not sure ......................................... -
F1b/c. A lot of people are unable to get out and vote for many reasons. Did you happen to vote in last November'selection for president? (IF “YES,” ASK:) For whom did you vote––Barack Obama, John McCain, orsomeone else?
Yes, Voted Voted for Barack Obama ................ 41Voted for John McCain ................... 34Voted for someone else ................. 4Not sure .......................................... 5
No, Did Not Vote ............................. 16
Not sure ........................................ -
QF1d And did you happen to vote in the 2006 election for U.S. Congress?
Yes, voted ....................................... 63No, did not vote ............................... 32Not sure ......................................... 5

8/14/2019 HART/McINTURFF March 2010 Interviews: 1,000 Adults, Including104
http://slidepdf.com/reader/full/hartmcinturff-march-2010-interviews-1000-adults-including104 28/29
HART/McINTURFF Study #10156--page 28March 2010 NBC News/Wall Street Journal Survey
QF2 Are you currently employed? (IF "CURRENTLY EMPLOYED," ASK:) What type of work do you do?(RECORD UNDER "6--OTHER.") (IF "NOT CURRENTLY EMPLOYED," ASK:) Are you a student, ahomemaker, retired, or unemployed and looking for work?
Currently EmployedProfessional, manager............................. 16White-collar worker .................................. 22
Blue-collar worker .................................... 18Farmer, rancher ....................................... -Not Currently Employed Student .................................................... 4Homemaker ............................................. 8Retired ..................................................... 22Unemployed, looking for work ................. 8Not sure ................................................. 2
QF3 What is the last grade that you completed in school? (DO NOT READ CHOICES.)
Grade school ............................................................ 1Some high school..................................................... 5High school graduate ............................................... 25
Some college, no degree ......................................... 18Vocational training/2-year college ............................ 104-year college/bachelor's degree ............................. 23Some postgraduate work, no degree ....................... 22-3 years postgraduate work/master's degree ......... 12Doctoral/law degree ................................................. 3Not sure/refused..................................................... -
QF4 Generally speaking, do you think of yourself as (ROTATE:) a Democrat, a Republican, an independent, orsomething else? (IF "DEMOCRAT" OR "REPUBLICAN," ASK:) Would you call yourself a strong(Democrat/Republican) or not a very strong (Democrat/Republican)? (IF "NOT SURE," CODE AS "NOTVERY STRONG DEMOCRAT/REPUBLICAN.") (IF "INDEPENDENT," ASK:) Do you think of yourself ascloser to the Republican Party, closer to the Democratic Party, or do you think of yourself as strictlyindependent? (IF "NOT SURE," CODE AS "STRICTLY INDEPENDENT.")
Strong Democrat ............................. 20Not very strong Democrat ............... 12Independent/lean Democrat ............ 12Strictly Independent ........................ 15Independent/lean Republican ......... 13Not very strong Republican ............. 8Strong Republican........................... 15Other (VOL) .................................... 4
Not sure ........................................ 1
QF5 Thinking about your general approach to issues, do you consider yourself to be liberal, moderate, orconservative? (IF "LIBERAL" OR "CONSERVATIVE," ASK:) Do you consider yourself to be very(liberal/conservative) or somewhat (liberal/conservative)?
Very liberal ...................................... 10Somewhat liberal ............................. 14Moderate ......................................... 35Somewhat conservative .................. 21Very conservative ............................ 17
Not sure ......................................... 3

8/14/2019 HART/McINTURFF March 2010 Interviews: 1,000 Adults, Including104
http://slidepdf.com/reader/full/hartmcinturff-march-2010-interviews-1000-adults-including104 29/29
HART/McINTURFF Study #10156--page 29March 2010 NBC News/Wall Street Journal Survey
QF6a What is your religion?
Protestant (includes Baptist, Lutheran, Methodist, Episcopal,Presbyterian, and other Christians) ............................................. 50 CONTINUE
Catholic ......................................................................................... 24Jewish ........................................................................................... 2 Skip to Q.F7Muslim .......................................................................................... 1
Mormon/LDS/Church of Jesus Christ of Latter Day Saints ........... 2Other ............................................................................................. 9None ............................................................................................. 10 CONTINUENot sure/refused ......................................................................... 2
(RESULTS REFLECT RESPONDENTS WHO SAY PROTESTANT, OTHER, NONE, OR NOT SURE IN QF6a.) QF6b Would you describe yourself as either a fundamentalist or an evangelical Christian, or would you not
describe yourself that way?
Fundamentalist/evangelical ............................................ 15Neither fundamentalist nor evangelical .......................... 48Not sure ........................................................................ 8
Catholic/Jewish/Muslim/Mormon (Q.F6a) ....................... 29
QF7 How often do you attend services at a church, synagogue, mosque, or other place of worship? (READLIST.)
Never ................................................ 17Once a year ...................................... 8A few times a year ............................ 18Once a month ................................... 8About twice a month ......................... 10Once a week or more often .............. 37Not sure .......................................... 2
F8a/b. Are you a current or retired labor union member? (IF “NO,” OR “NOT SURE,” ASK:) Is anyone else in yourhousehold a current or retired labor union member?
Labor union member ....................... 13Union household ............................. 8Non-union household ...................... 77Not sure ......................................... 2
QF9 If you added together the yearly income of all the members of your family who were living at home last year,would the total be less than ten thousand dollars, between ten thousand dollars and twenty thousanddollars, between twenty thousand dollars and thirty thousand dollars, between thirty thousand dollars andforty thousand dollars, between forty thousand dollars and fifty thousand dollars, between fifty thousanddollars and seventy-five thousand dollars, between seventy-five thousand dollars and one hundred thousanddollars, or would the total be more than that?
Less than $10,000 ............................... 5
Between $10,000 and $20,000 ............ 7
Between $20,000 and $30,000 ............ 10
Between $30,000 and $40,000 ............ 10
Between $40,000 and $50,000 ............ 7
Between $50,000 and $75,000 ............ 16
Between $75,000 and $100,000 .......... 14
More than $100,000 ............................. 21
Not sure/refused ................................ 10