harry keys: tongariro alpine crossing
TRANSCRIPT

1 Copyright photograph by NZ Herald
Cities on Volcanoes ConferenceYogayakarta, INDONESIA
Paul Dawson photo
Sustainable Summits 2016, Aoraki Mt Cook National Park, 7-11 AugustHarry Keys ([email protected])
Department of Conservation
DOC-2848662
2
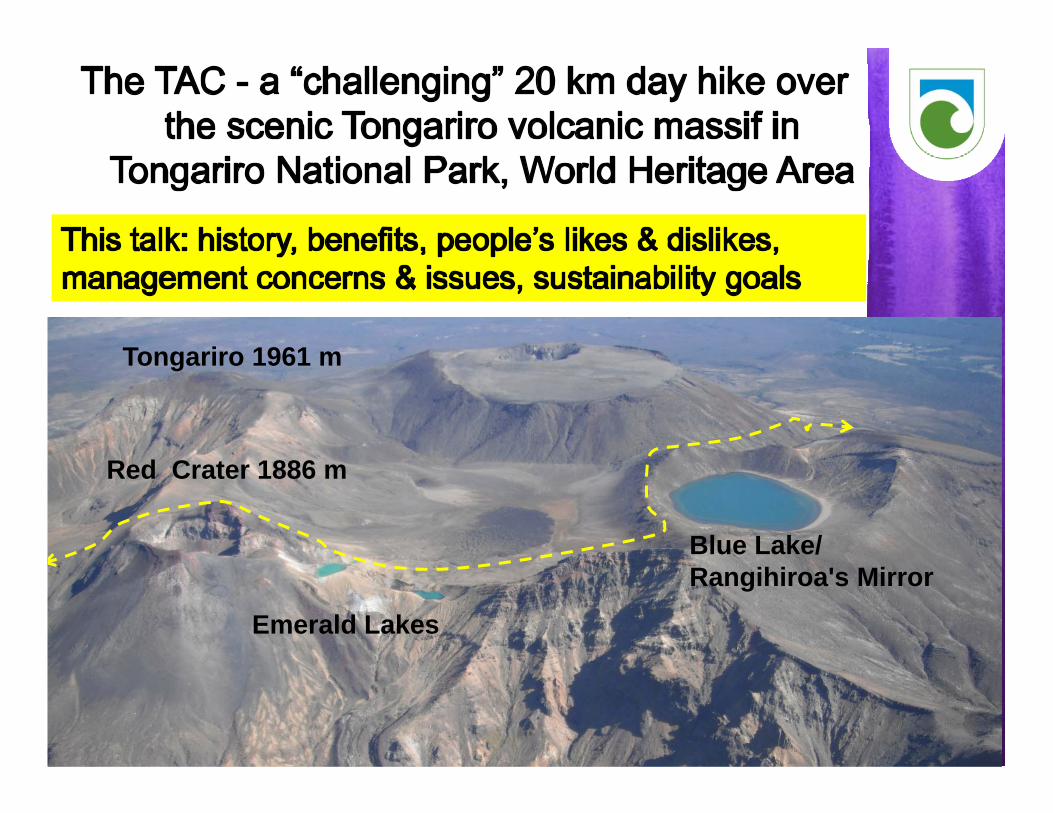
Red Crater 1886 m
Tongariro 1961 m
Emerald Lakes
Blue Lake/Rangihiroa's Mirror

3 Copyright photograph by NZ Herald
Cities on Volcanoes ConferenceYogayakarta, INDONESIA
Ngauruhoe last erupted 1974-77
Red Crater last erupted 1934
Te Maari last erupted 2012Mangatepopo carpark & Roadend
To Ketetahi Roadend
Alpine area subject to severe weather year round
3 historically active volcanic vents
Centre of North island, very accessible
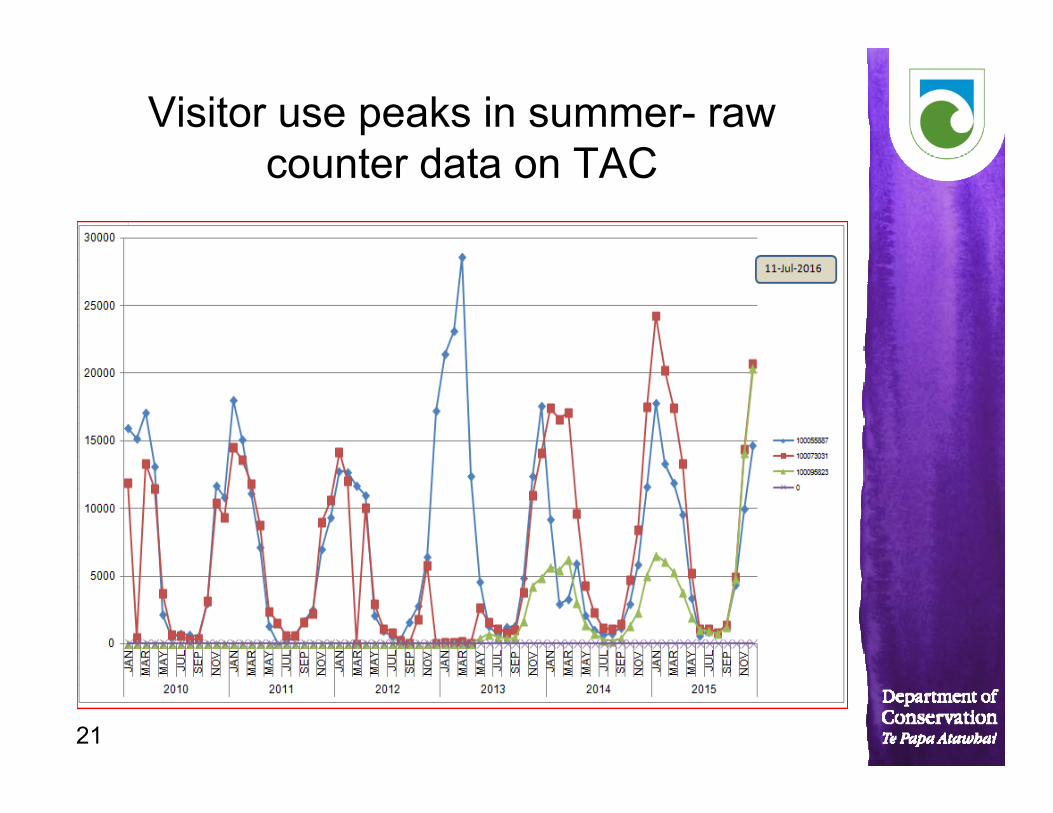
Visitor use peaks over summer

4
A short history of the CrossingLeft: 1908 tourist group at Emerald Lakes - few people,
no managementRight: Now many people, management important,
moving towards co-management with iwi
2013 opening ceremony after eruptions
5
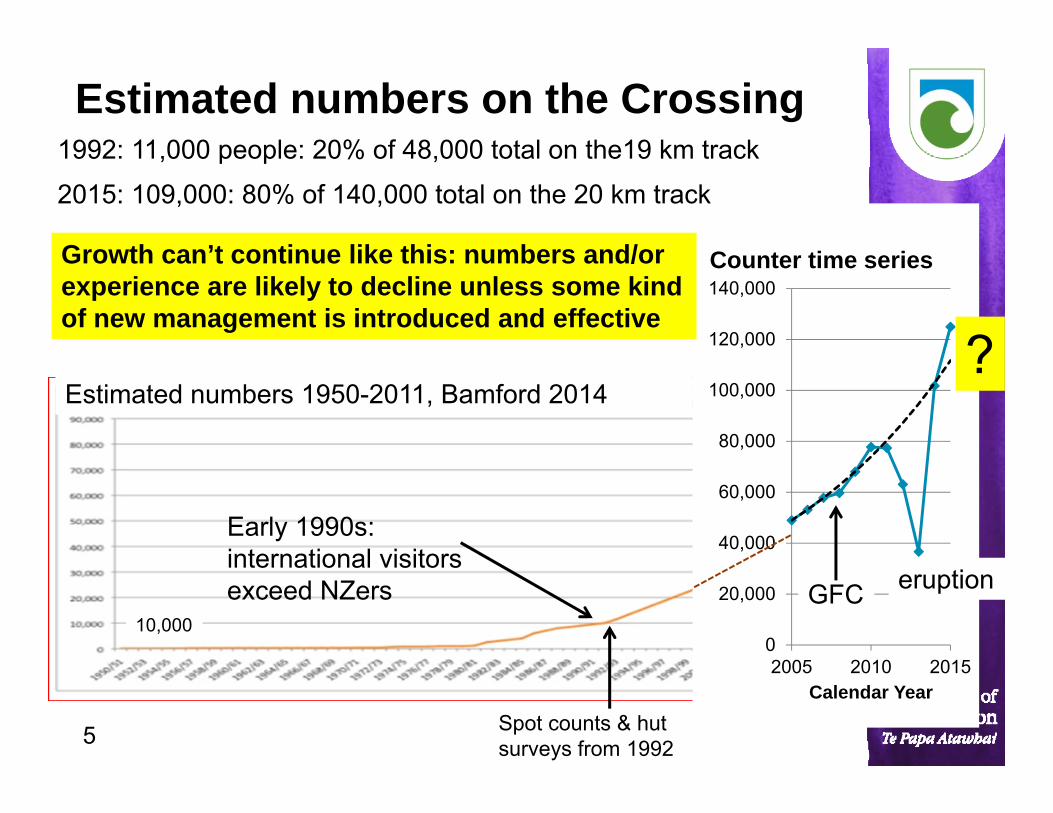
Estimated numbers on the Crossing
10,000
Spot counts & hut surveys from 1992
Early 1990s: international visitors exceed NZers
0
20,000
40,000
60,000
80,000
100,000
120,000
140,000
2005 2010 2015Calendar Year
Counter time series
1992: 11,000 people: 20% of 48,000 total on the19 km track
2015: 109,000: 80% of 140,000 total on the 20 km track
Estimated numbers 1950-2011, Bamford 2014
GFC eruption
?
Growth can’t continue like this: numbers and/or experience are likely to decline unless some kind of new management is introduced and effective
6
Economic benefits
• Large number of people• Almost 90% stay 1 or 2 nights in local districts • $200/day spent on accommodation & transport
per TNP summer visitor ($20 million/year)• Strong growth (9%/year, average compound rate)• 80-90% use buses & rental vehicles• 21 transport concessions; 22 guiding concessions
mostly local• >50 bus and rental car companies used• Increased number of school/youth visits &
benefits from education

7
• 46% 20-29 years, 22% 30-39; strong social media use
• International 76% (range 70-80%, trend appears to have weakened)
• No reduction in numbers of NZers
• Domestic (2012): AKL 43%, Wgtn 12%, South Is 3%
• Gender: even ratio• Party size: 1 =13%, 2 =46%,
3-4 =24%• 60% 0-1 hike/year of this type
Demographics etcBased on 6 visitor surveys
0
5000
10000
15000
20000
25000
30000
35000
0
10
20
30
40
50
60
70
80
90
Inte
rnat
iona
l & d
omes
tic p
ropo
rtio
ns
Survey year/season
% international
% domestic
Apparent no.NZ

8
Social and recreational benefits
“strong benefits”, “clear majority satisfied” [similar to expectations], “huge sense of achievement” Angus & Assoc 2012, Blaschke & Whitney 2007
Helping meet DOCs 2025 goals: 50% international visitors visit a national park;90% of New Zealanders enriched by our nature
2012 Q: What did you most enjoy?
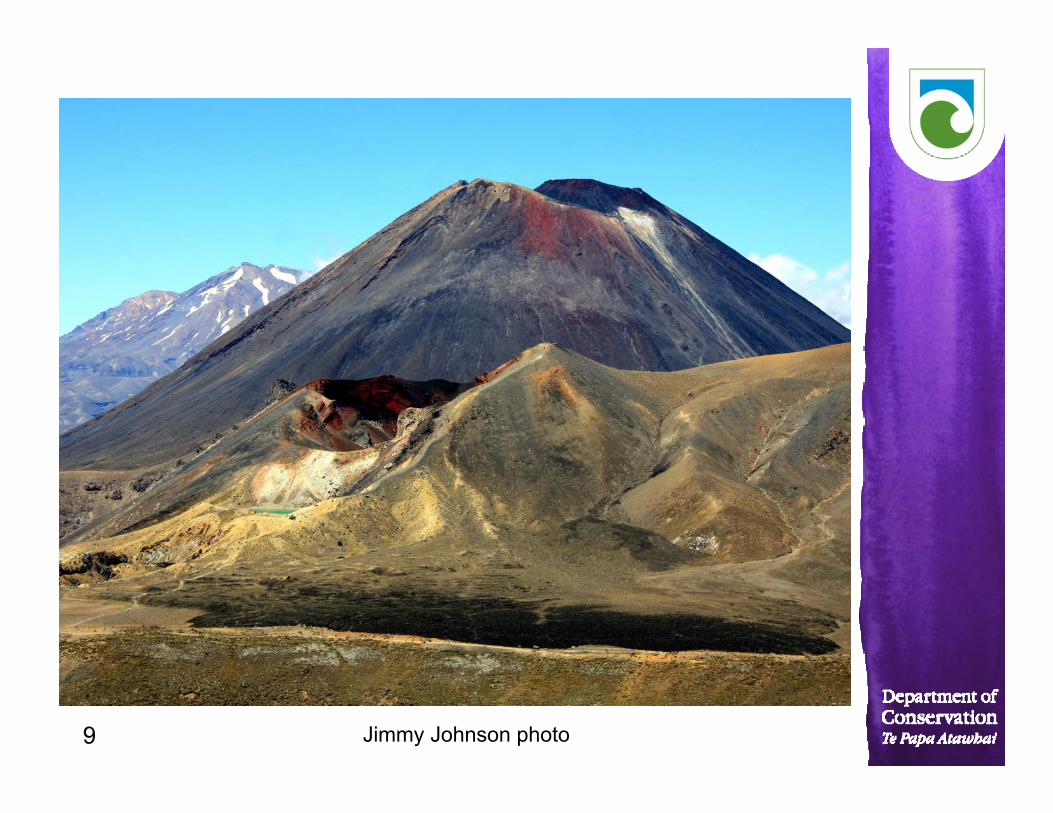
9 Jimmy Johnson photo

10
Visitor concerns2012 survey question: What did you least enjoy?
Bubs Smith photo

11 Copyright photograph by NZ Herald
Cities on Volcanoes ConferenceYogayakarta, INDONESIA
Main management concerns & issues1. cost per person (“just need funding”)
Track work ($3 pp)
Rescue, SAR & volcanic risk management – visitor safety ($2 pp)
Toilets/waste-management ($1.50 pp)
Road maintenance Concession management
2. challenge to solve Crowding on track at times &
maintaining satisfaction Protecting cultural values & identity Transport & car parking Effective planning/consultation Top: DOC;
Bottom: Paul Carr
12 Copyright photograph by NZ Herald
Cities on Volcanoes ConferenceYogayakarta, INDONESIA
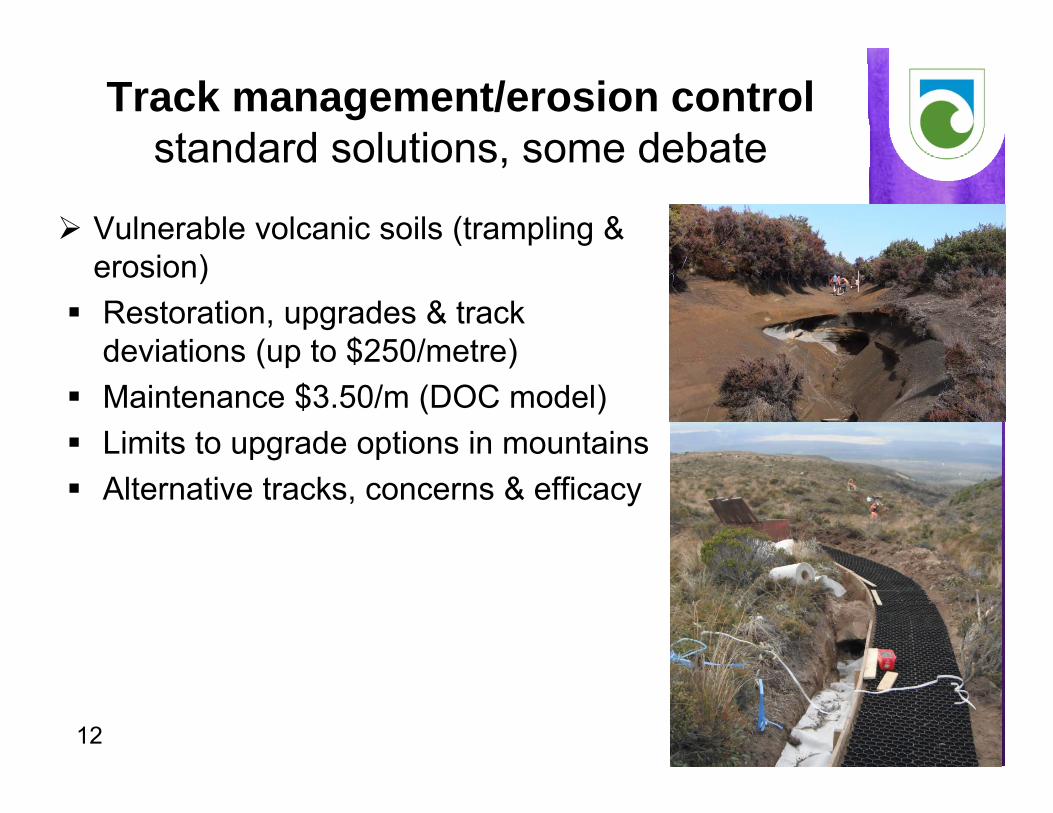
Track management/erosion controlstandard solutions, some debate
Vulnerable volcanic soils (trampling & erosion) Restoration, upgrades & track
deviations (up to $250/metre) Maintenance $3.50/m (DOC model) Limits to upgrade options in mountains Alternative tracks, concerns & efficacy
13 Copyright photograph by NZ Herald
Cities on Volcanoes ConferenceYogayakarta, INDONESIA
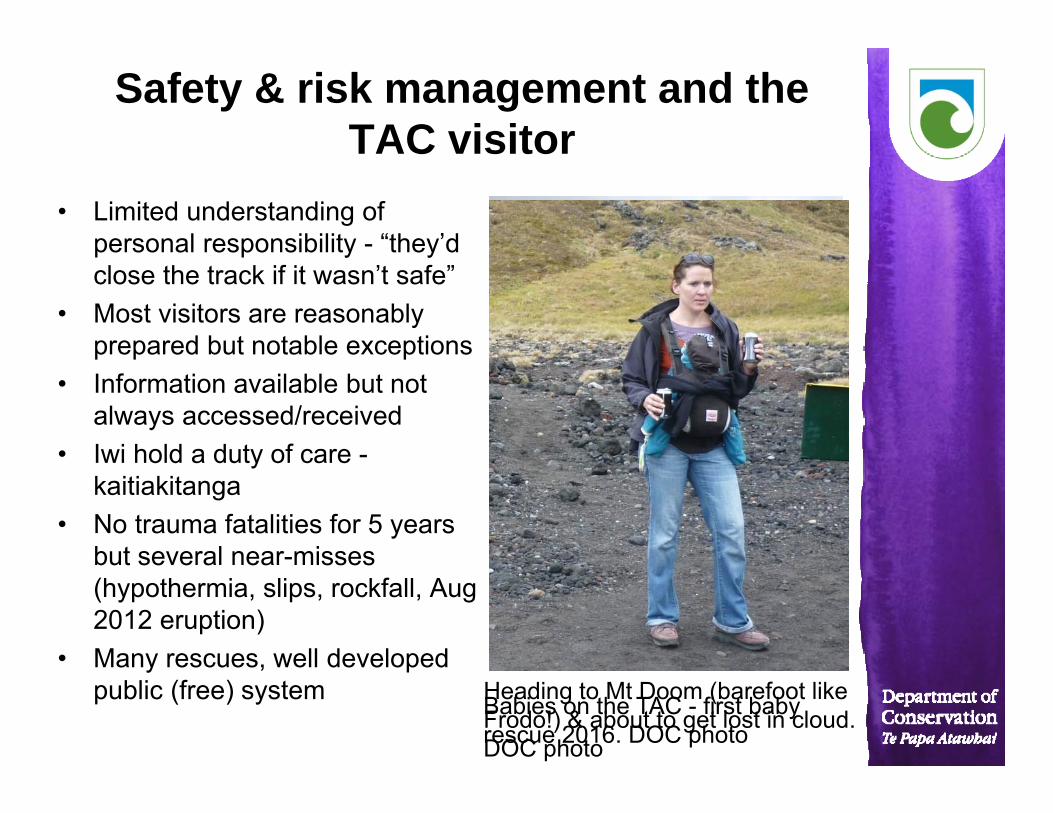
Safety & risk management and the TAC visitor
• Limited understanding of personal responsibility - “they’d close the track if it wasn’t safe”
• Most visitors are reasonably prepared but notable exceptions
• Information available but not always accessed/received
• Iwi hold a duty of care -kaitiakitanga
• No trauma fatalities for 5 years but several near-misses (hypothermia, slips, rockfall, Aug 2012 eruption)
• Many rescues, well developed public (free) system Heading to Mt Doom (barefoot like
Frodo!) & about to get lost in cloud. DOC photo
Babies on the TAC - first baby rescue 2016. DOC photo
14
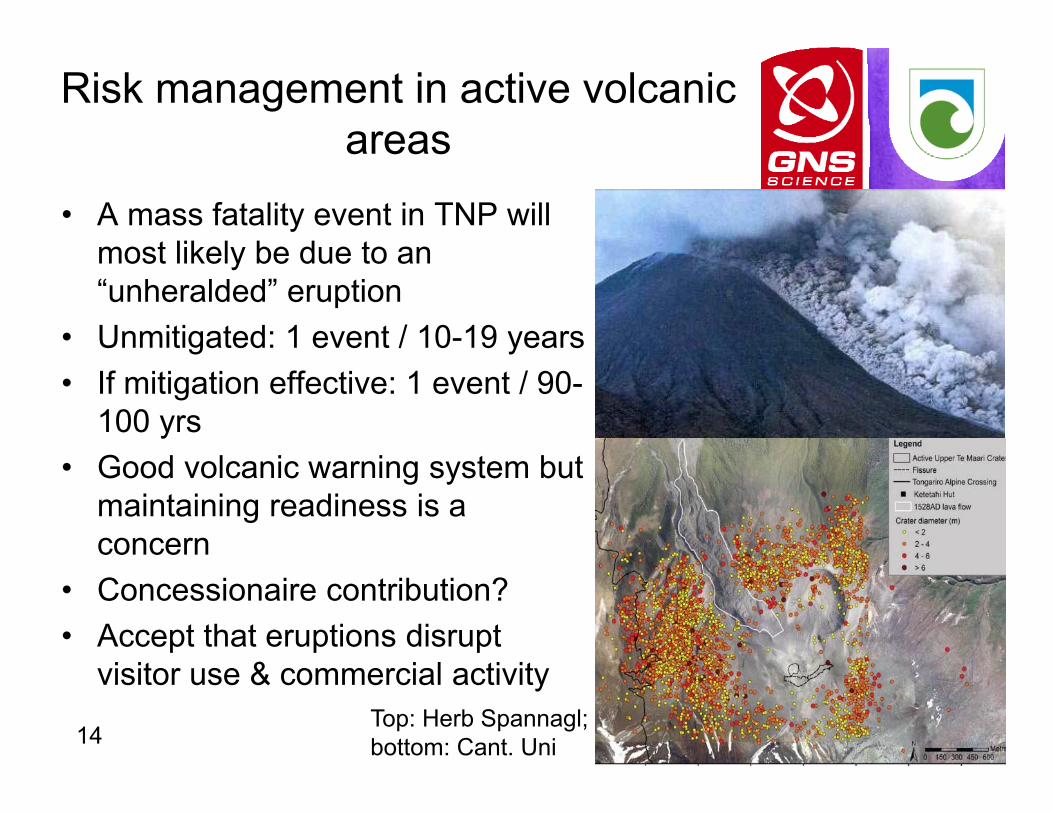
• A mass fatality event in TNP will most likely be due to an “unheralded” eruption
• Unmitigated: 1 event / 10-19 years • If mitigation effective: 1 event / 90-
100 yrs• Good volcanic warning system but
maintaining readiness is a concern
• Concessionaire contribution?• Accept that eruptions disrupt
visitor use & commercial activityTop: Herb Spannagl; bottom: Cant. Uni
Risk management in active volcanic areas

15
噴石(奥の院)Ontake eruption 2014: 58 hikers killed (5 missing) most of them by flying rocks. Similar eruption to Tongariro 2012, so many lessons (e.g. need for effective communications & warnings)

16 Copyright photograph by NZ Herald
Cities on Volcanoes ConferenceYogayakarta, INDONESIA
Toilets
“Dissatisfaction rates relatively high” Angus Assoc 2012 (annual numbers c 85,000)
Plan to double number of toilet pans and locations in 2 years & reduce waste volume. CAPEX $500,000
Difficult siting decisions to minimise impact on scenic, cultural & aesthetic values
Personal poo kits practical?
Top: DOC; bottom: Bubs Smith

17
2005: “Integrated use limits” aka “carrying capacity” identified: exceeded when >550-600 people-counts/day2012: number confirmed≥ 600 counts/day = negative perceptions, sense of crowding, detracts from experience20% of survey days in 2005 had ≥600 counts34% in 2012 had ≥600 55% in Jan-April 2016 had ≥600 3 days with ≥2000 counts in 2016≈ 40% of NZ Ranker reviewers now mention crowding etc
Crowding perceptions
Peak day queue up Red Crater ridge: at the chain section requested by concessionaires
18 Copyright photograph by NZ Herald
Cities on Volcanoes ConferenceYogayakarta, INDONESIA
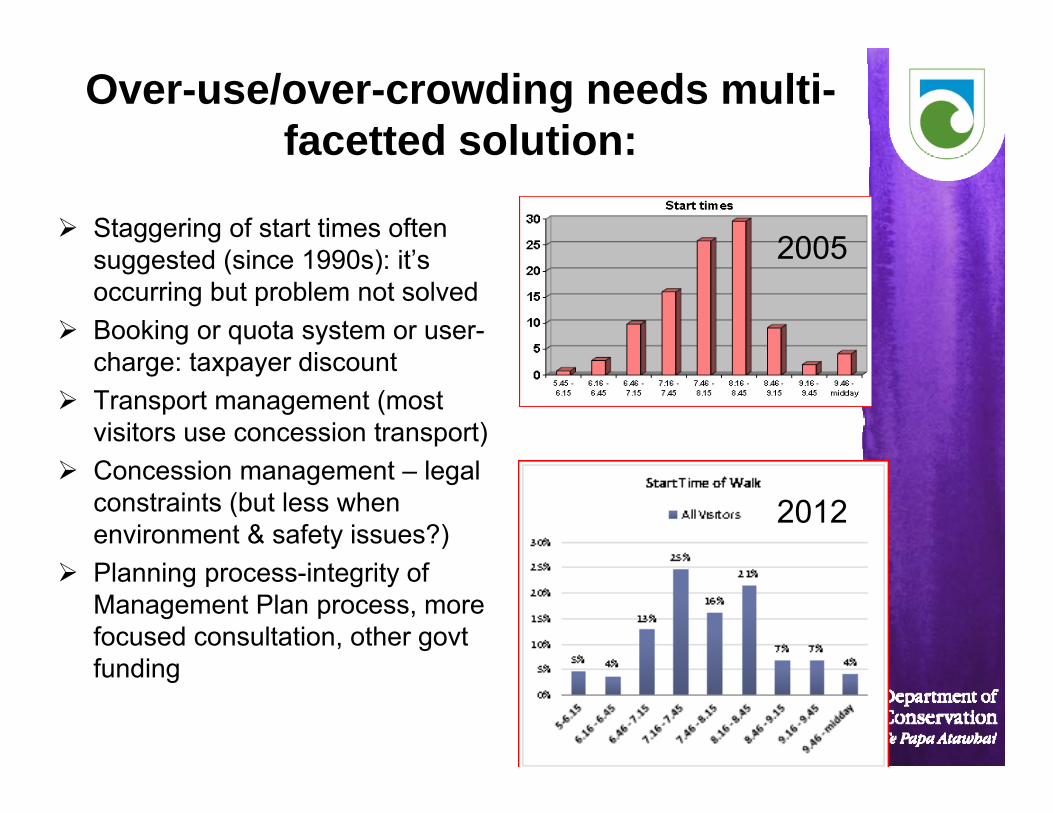
Over-use/over-crowding needs multi-facetted solution:
Staggering of start times often suggested (since 1990s): it’s occurring but problem not solved
Booking or quota system or user-charge: taxpayer discount
Transport management (most visitors use concession transport)
Concession management – legal constraints (but less when environment & safety issues?)
Planning process-integrity of Management Plan process, more focused consultation, other govt funding
2005
2012
19
Cities on Volcanoes ConferenceYogayakarta, INDONESIA
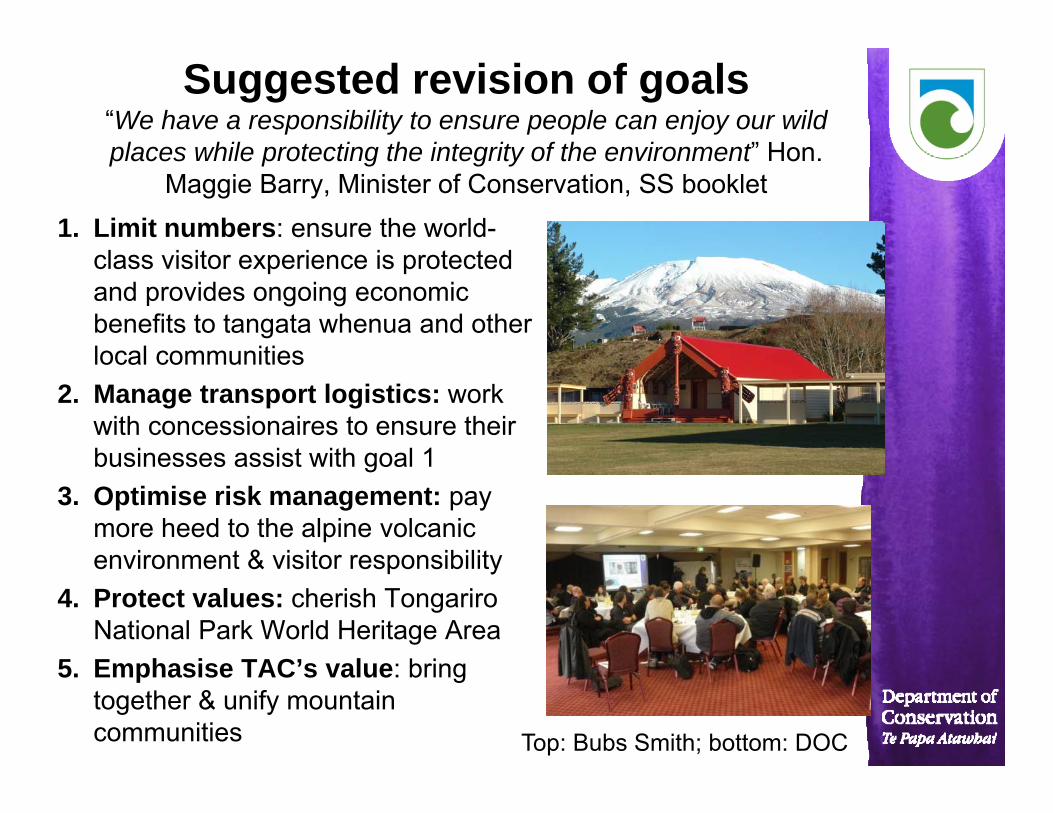
Suggested revision of goals “We have a responsibility to ensure people can enjoy our wild places while protecting the integrity of the environment” Hon.
Maggie Barry, Minister of Conservation, SS booklet1. Limit numbers: ensure the world-
class visitor experience is protected and provides ongoing economic benefits to tangata whenua and other local communities
2. Manage transport logistics: work with concessionaires to ensure their businesses assist with goal 1
3. Optimise risk management: pay more heed to the alpine volcanic environment & visitor responsibility
4. Protect values: cherish Tongariro National Park World Heritage Area
5. Emphasise TAC’s value: bring together & unify mountain communities Top: Bubs Smith; bottom: DOC
202,000,000
2,500,000
3,000,000
3,500,000
4,000,000
0
20,000
40,000
60,000
80,000
100,000
120,000
140,000
160,000
180,000
200,000
2000 2005 2010 2015 2020
Inte
rnat
iona
l vis
itor a
rriv
als
and
fore
cast
Visi
tor N
umbe
rs (b
ased
on
raw
Ket
etah
i cou
nter
dat
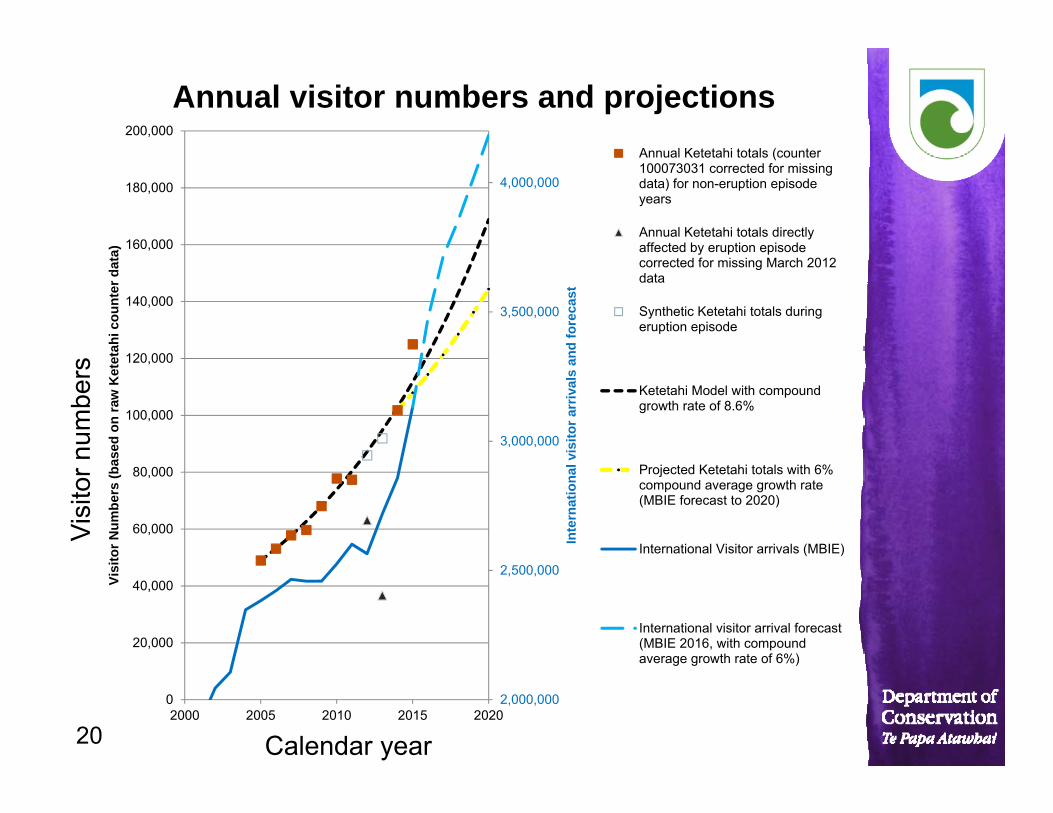
a)Annual visitor numbers and projections
Annual Ketetahi totals (counter100073031 corrected for missingdata) for non-eruption episodeyears
Annual Ketetahi totals directlyaffected by eruption episodecorrected for missing March 2012data
Synthetic Ketetahi totals duringeruption episode
Ketetahi Model with compoundgrowth rate of 8.6%
Projected Ketetahi totals with 6%compound average growth rate(MBIE forecast to 2020)
International Visitor arrivals (MBIE)
International visitor arrival forecast(MBIE 2016, with compoundaverage growth rate of 6%)
Calendar year
Visi
tor n
umbe
rs
21
Visitor use peaks in summer- raw counter data on TAC

22
TAC rescue operations: police-organized (≈ 70% of total). Average 2x10⁻⁴ ops/person

23
Crowding: examined in 1993-96, 2005 & 2012 surveys
2005
2012
2015/16 Bubs Smith photos
• Red Crater area most crowding reported
• Ketetahi roadend largest increase

24 Copyright photograph by NZ Herald
Cities on Volcanoes ConferenceYogayakarta, INDONESIA
Quote from Blaschke & Whitney 2007• Currently, transport concessions do not impose any limits on the number of
walkers able to be carried, so that on busy days transport operators have unlimited discretion to run additional busloads. Comments made during the focus group discussions identified a number of further issues with the concession process. Allegations and anecdotal information were provided concerning conditions of concessions not being adhered to, under-reporting of numbers of walkers carried, and the presence of non-authorised operators within the park providing transport services and in some cases guiding services to significant numbers of walkers.
• DOC’s intention for the concession system is that it “helps the Department to ensure that the various concession activities are compatible with the primary aim of protecting the land and other resources. It also helps to make sure that services and facilities provided for visitors are appropriate, of a suitable standard and that other activities do not conflict with visitor enjoyment.” (http://www.doc.govt.nz/About-DOC/Concessions/index.asp).
• It would be difficult to argue that the current system for transport concessions for the Crossing achieves this stated intention.

25
What they say about the TAC
• DOC brochure 1990s: “Often described as the best one day walk in NZ”
• Lonely Planet: “one of the world’s greatest one-day hikes”
• Wikipedia: “among the most popular day hikes in the country”
• Trip Advisor: Rating 5*, 1056 reviews (85% excellent, 12% VG, 0.2% terrible)
• NZ Rankers: 90%*, 788 reviews• *caution with these stats
26
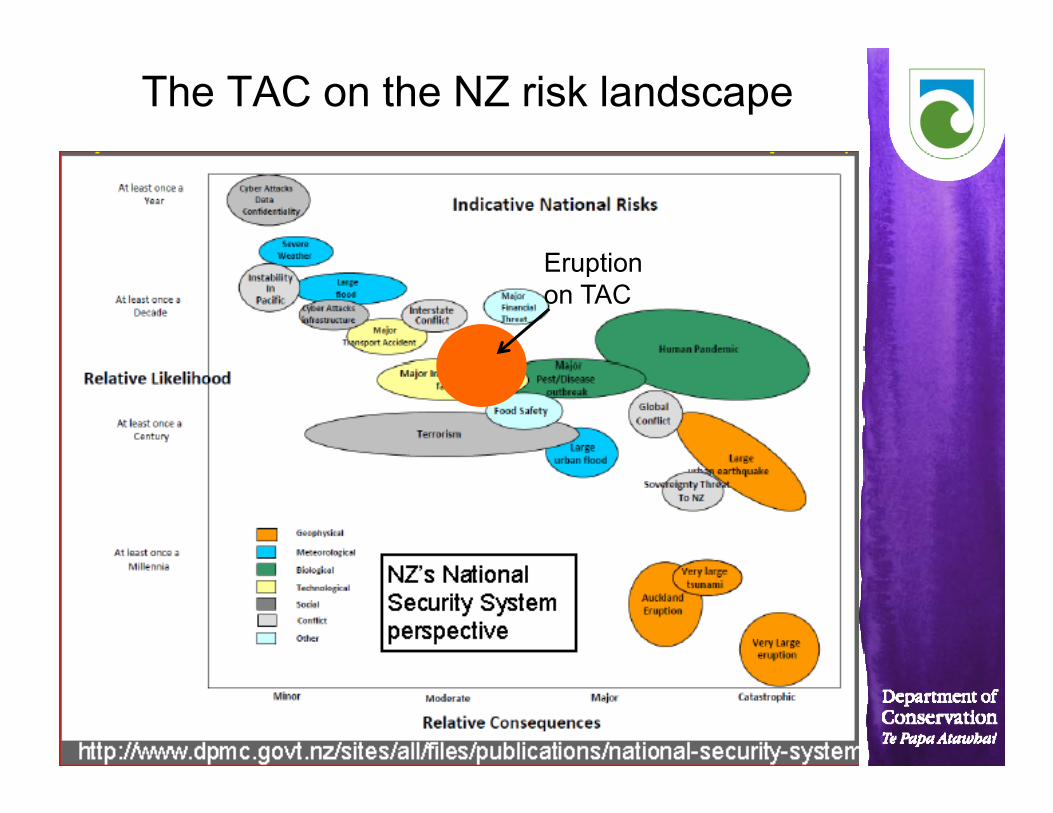
Eruption on TAC
The TAC on the NZ risk landscape

27 Copyright photograph by NZ Herald
Cities on Volcanoes ConferenceYogayakarta, INDONESIA
TAC with existing & proposed toilet sites
Angus Associates 2012
Additional slides for reference

28
Summary in Bamford 2014:Currently the Department of Conservation and Ngati
Hikairo Ki Tongariro are assessing their options forsustainably managing the TAC. Their 5 objectives are:
1. Develop and future-proof the TAC as a sustainable world-class visitor experience;
2. Increase knowledge, respect and understanding of the values of Tongariro National Park (TNP);
3. Use the TAC to promote and grow the region(s) and to ensure that it contributes to the economic sustainability of local communities;
4. Provide economic opportunities and resources for the development of Ngati Hikairo ki Tongariro;
5. Use the TAC to bring together and unify mountain communities.
29
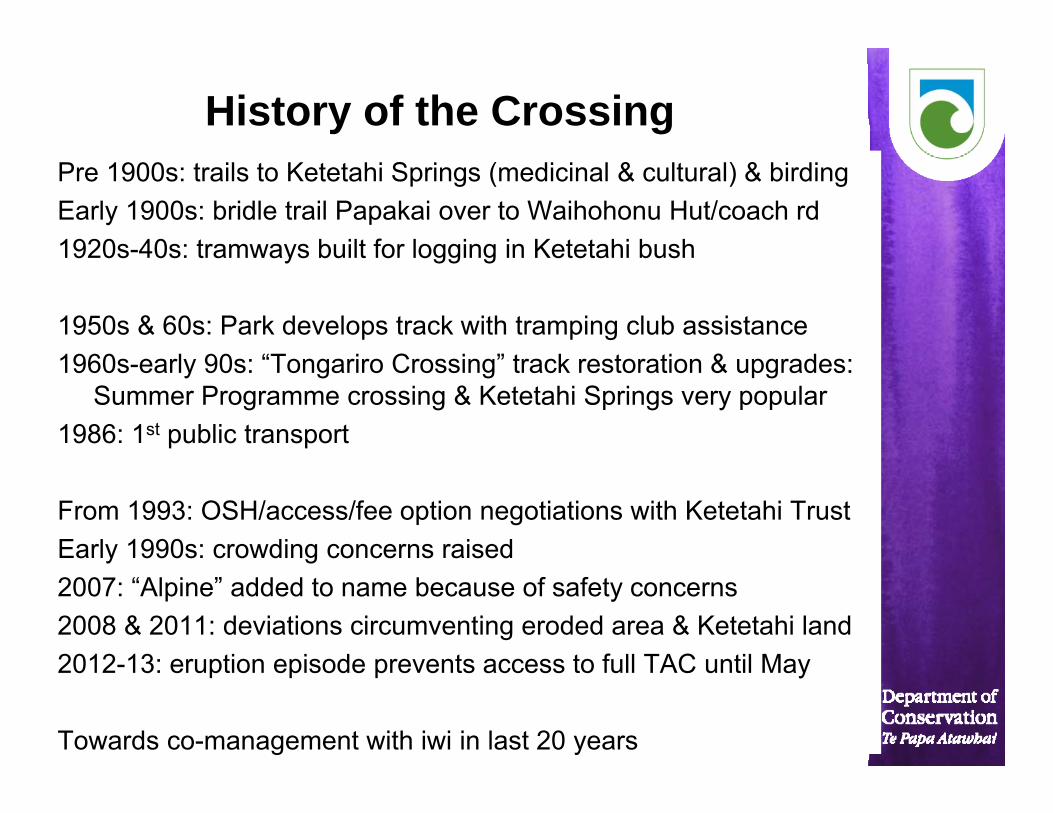
History of the CrossingPre 1900s: trails to Ketetahi Springs (medicinal & cultural) & birding Early 1900s: bridle trail Papakai over to Waihohonu Hut/coach rd 1920s-40s: tramways built for logging in Ketetahi bush
1950s & 60s: Park develops track with tramping club assistance 1960s-early 90s: “Tongariro Crossing” track restoration & upgrades:
Summer Programme crossing & Ketetahi Springs very popular1986: 1st public transport
From 1993: OSH/access/fee option negotiations with Ketetahi Trust Early 1990s: crowding concerns raised2007: “Alpine” added to name because of safety concerns2008 & 2011: deviations circumventing eroded area & Ketetahi land 2012-13: eruption episode prevents access to full TAC until May
Towards co-management with iwi in last 20 years

30

31
Visitor surveys and other references• Angus & Associates 2012• Bamford 2014• Blaschke & Whitney 2007• Coomber & Leonard 2005• Dhellemmes 2016• Gibson 1996• Keys, Williams and Leonard 2014• Olsen 2001• Slee and Curtis 1993• Visitor countersAcknowledgements to Bubs Smith and other photographers, DOC & police colleagues, GNS Science and Canterbury University