harry gwala district health plan 2018/19 - 2020/21€¦ · harry gwala district health plan 2018/19...
TRANSCRIPT

HARRY GWALA
DISTRICT HEALTH PLAN
2018/19 - 2020/21
(KWAZULU-NATAL)

Harry Gwala District Health Plan 2018/19
Page 2 of 78
ACKNOWLEDGEMENTS
The Planning Monitoring and Evaluation Unit wishes to extend its acknowledgements to the
members of District Office Management, Hospital and CHC Management for their
dedication and commitment and involvement in the whole process of data collection,
collation and finalization of the plan. A high level of teamwork and active participation of
different people in the district, BroadReach Healthcare (supporting partner) has resulted in
the successful completion of the health plan.
A special thank you goes to the following people:
1. Mrs G.L.L. Zuma District Manager
2. Mrs B.A. Mkhize Deputy District Manager Planning, M&E Unit
3 Mr. S.A. Cekwana Cooperate Service Manager
4 Mr. B.H.S Makhaye Deputy Manager Clinical & Programme Services
5 Ms K.A. Mtinjana Deputy Manager District Planner
6 Mrs. N. Binase CEO-EGUM
7 Mrs S. Maseko CEO- Christ the King Hospital
8 Ms N. Hadebe CEO –St. Apollinaris Hospital
9 Dr. N. Gumede CEO- Pholela CHC
10 Mrs. N.A. Keswa CEO-Rietvlei Hospital
11 Dr. E. Mthembu CEO/ Medical Manager –St Margaret’s TB/MDR Hospital
12 Mr. R. Hadebe CEO Umzimkhulu Hospital
13 Mrs R Dladla District Human Resource Manager
14 Ms T.Manzi District Principal accountant
15 Mrs N. Nxele District Finance Manager
16 Mr. S. Zwane District Pharmacist
17 Mrs. T.G.O. Sikhakhane Nursing Manager - Pholela CHC
18 Miss L. Mthembu Nursing Manager – Christ the King
19 Mrs. J. Mlotshwa Nursing Manager - St Margaret’s TB/MDR Hospital
20 Mrs. J. Nqophiso Nursing Manager - Rietvlei Hospital
21 Mr. B. Msibi Nursing Manager - Umzimkhulu Hospital
22 Miss T. Khumalo Nursing Manager - St. Apollinaris Hospital
23 Mr. S. Maphumulo Nursing Manager - EGUM
24 Mr. T. Zondi District Information Officer
25 Ms F.F. Shabalala District Facilities Information Officer
26 Mrs N.Ngubane Civil Society Sector Chairperson
27 Mrs M, Hlongwa Harry Gwala District Municipality
28 Mrs F. Dlamini EGUM M&E Manager
29 Miss S Mpongomo Rietvlei M&E Manager
30 Mrs E. Zondi St Margaret’s M&E Manager
31 BroadReach Healthcare NGO Partner

Harry Gwala District Health Plan 2018/19
Page 3 of 78
OFFICIAL SIGN-OFF
It is hereby certified that this District Health Plan:
Was developed by the district management team of Harry Gwala District with the
technical support from the district health services and the strategic planning Units at the
Provincial head office.
Was prepared in line with the current Strategic Plan and Annual Performance Plan of the
KwaZulu Natal Department of Health.

Harry Gwala District Health Plan 2018/19
Page 4 of 78
EXECUTIVE SUMMARY BY THE DISTRICT MANAGER
The District Health Plan will give a brief overview of the 2016/2017 previous performance and
outline the Districts aspirations based on the diseases burden and the outcomes of the
indicators as per District Health Barometer 2016 2017.
1 DISTRICT SERVICE DELIVERY PERFORMANCE
Harry Gwala health district has performed fairly well in previous years in terms of strategic
priority programmes though there are challenges to meet some of the set targets. These
challenges have been identified and will be addresses in this plan.
PHC SERVICES
PHC Re engineering
Family health teams are in place though not enough to cover entire district due to financial
constraints which made it impossible to enrol teams to entire district. This has contributed to
below target performance of PHC utilisation rate 2.7 in 2016/17
School health teams have performed exceptionally well in terms of schools that were
accredited as health promoting school which totalled to 20 schools for previous year
2017/18.
The challenge remained with meeting the targets of screening of grades R and 8 thus the
district aspiration being increase PHC utilisation and increase screening of Grade R and 8
IDEAL CLINIC REALISATION AND MAINTAINANCE (ICRM)
National and Provincial assessment of clinics is still ongoing, marked achievements noted at
UMzimkhulu supported clinics all have achieved the status. Focus will be at Dr. NDZ clinics
and Ubuhlebezwe clinics for the next 3yr cycle.
The challenge in some of the clinics is related to infrastructure especially at NDZ sub-district.
The district aspiration is to increase the number of facilities scoring from 53%to above 80%
and the vital measures scoring on NCS from 0% to 100% BY 2021.
HIV and AIDS
HIV and AIDS nerve centre meetings and reviews are in place, implementation of Universal
testing and treatment (UTT) and capacitation of health care workers on key population
service provision is ongoing. Challenges identified: low paediatric initiation, low viral load
done and increasing numbers of loss to follow up. These challenges will be addressed in this
three year plan. The district interventions will focus on NIMART training acceleration plan and
mentorship especially in support of paediatric initiation , retaining clients on treatment and
active defaulter tracing at all levels assisted by supporting partner BroadReach.

Harry Gwala District Health Plan 2018/19
Page 5 of 78
TB CONTROL PROGRAM
TB control program has performed well this financial year as it is on track with the 90/90/90
strategic goals targets; with achievements of 92% TB on Success rate ; 85 % Cure rate; death
rate at 4 % below; and the loss to follow up (Defaulter)rate at 3%. The district is still struggling
with meeting roll out targets for TIER.Net TB module.
Strategies on clinical, systems and community interventions are in place to upscale the roll
out with inclusion of Sub districts teams and supporting partner (BroadReach).
District aspiration will focus on to reduce HIV incidence using 90/90/90 strategy.
MCWHN
The MNCWH program has remarkable improved Maternal, Child and Women’s Health and
has managed to achieve low baby PCR positivity rate around 10 weeks to 1%, under 5 year
severe acute malnutrition fatality rate at 2.1%.
Maternal death is within 95/100 000 and cervical cancer screening at 80%.
Despite the hard work and engagements the District is still struggling to achieve targets on
immunization coverage under 1 year, couple year protection rate, child under 1year
mortality and in patient early neonatal death rate.
Immunisation coverage has improved at UMzimkhulu and Ubuhlebezwe sub districts. Focus
for the district will be in the remaining sub districts DR.NDZ and Ubuhlebezwe.
The district aspiration will channel strategies and resources towards reducing neonatal
deaths and under 5 year’s mortality rate.
Women’s health will focus on improving couple year protection rate and decreasing
teenage pregnancy.
NON COMMUNICABLE DISEASES
Non Communicable Diseases have become the 3rd leading cause of death for ages
between 25-64 years and 65 and above both in males and females in Harry Gwala district as
per 2010-2016 barometers. Though screening services has improved in terms of targets, it is
not convincing that all deserving clients have been initiated on treatment and well
managed. Cataract surgeries have improved; as the projection shows that the district will
meet the target of 700 clients since for the past 3 quarters of 2017/18 698 cataracts were
conducted.
Shortage of ophthalmic nurses and optometrists in the district has negatively affected eye
care services.
Lack of community awareness in screening and dangers of chronic conditions has drastically
increased the risk mortality and morbidity.

Harry Gwala District Health Plan 2018/19
Page 6 of 78
The district will be focusing on community awareness, community screening campaigns and
roll out of Palliative care services. Integration of 90-90-90 strategies in management of NCD
will be rolled out in the next 3 year cycle.
SUPPORT SERVICES
Pharmaceuticals
The District Pharmaceutical services are currently managing CCMDD in the entire district. The
district has achieved to reduce stock out of tracer items through implementation of stock
visibility system, which tracks and monitor stock outs, thus enabling shifting of stock within
facilities.
Transport
Transport remains the cost driver in the district in terms of maintenance and repairs resulting
from poor topography, terrains and distance in-between service points. EMS and Forensic
services vehicles are managed through district fleet management.
The focus on EMS is to reduce the response times as of the pillars to improve quality of care
according to the key steps to prevent avoidable maternal, neonatal and child mortality is
rapid inter-facility emergency transport system
Infrastructure
District infrastructure unit has supported institutions towards ensuring all planned projects are
implemented and maintenance budget utilised appropriately.
Finance
The district has managed to channel more budgets to PHC with the previous DHER; this will
be maintained as the district is prioritizing PHC health services over district hospital services.
District budget for 2017/18 has been managed as per prescript with 92% spent by end
February 2018.
Human resource
WISN training has been completed, implementation pending because of budgetary
constraints. District Equity Plan is in place and is being implemented in all sub districts.

Harry Gwala District Health Plan 2018/19
Page 7 of 78
EPIDEMIOLOGICAL PROFILE
The District planning process required District Information Officer compile comprehensive
epidemiological health information of the District (as per Annexure C) before the district planning
workshop and make it available to the District Management Team to define aspirations, and
identify key interventions.
Provide the following sections of the comprehensive epidemiological health information for the
District, as a minimum:
District Map with Population distribution, sub district boundaries,
6.Population distribution

Harry Gwala District Health Plan 2018/19
Page 8 of 78
Greater Kokstad Local Municipality has 17% of the population. The municipality is mainly
composed of low cost houses which are located at Shayamoya, Horse shoe , Mphela
,Franklin (Lindelani).Quarters informal settlement ward 2,Marikana ward 8,Bambayi ward8
and Chocolate City ward 1 and farm areas. There are formal house for the middle income
group.
NDZ Local Municipality contributes 23% of the total district population with 94% of the
population living below poverty line, with Ward 4 at Kilmun and Ward 7 at Gqumeni and
Qulashe being the most deprived wards in the sub-district; It is the 2nd largest sub- district
within Harry Gwala District.
Underberg areas are most dominated with migrant laborers from Lesotho and Eastern Cape
and from the nearby Swartberg Farms which contribute to treatment defaulter rates. (see
graph above).
UBuhlebezwe Local Municipality’s population is predominantly formed by formal (traditional)
dwellings with few sugar cane and forestry farm areas. This Local Municipality is marked with low
cost houses at Mahehle, Springvale, Ndwebu area which was previously at UGu district and
Fairview with informal dwellings as well.
UMzimkhulu Local Municipality has the largest population. It is mainly constituted of traditional
dwellings with few low cost at Ibisi, Riverside and informal settlement like Sisulu Settlement areas
close to town enroute R56 which is a main road which has high accidents occurrences.
37%
17%
23%
23%
Umzimkhulu
Kokstad
NDZ
Ubuhlebezwe

Harry Gwala District Health Plan 2018/19
Page 9 of 78
Harry Gwala District is sub-divided into four local municipalities following merge r of Ingwe and
KwaSani local municipalities, to form Dr. Nkosazane Dlamini- Zuma Local Municipality known as
NDZ Local municipality.
NDZ Local municipality comprises of both tribal and pockets of farm areas with hard to reach
areas. There are variations of head count from clinic to clinic some with high headcount others
with low headcount, like Underberg clinic with high headcount. This is mainly due to the transport
flow from two clinics i.e. Kilmun and Qulashe to Underberg, Ncwadi clinic’s performance is

Harry Gwala District Health Plan 2018/19
Page 10 of 78
affected by UMgungundlovu District due to its proximity resulting in low PHC utilization rate from
the low headcount.
The sub- district has the second largest population; this population is affected by the migrant
labourers from Lesotho and Eastern Cape Province as well as from nearby Swartberg farms. The
mobility of this population, especially found in farms where farmers import seasonal workers from
Eastern Cape and Lesotho also contributes to high treatment defaulter rates, which is addressed
in terms of cross-border meetings. The sub-district has one district one district hospital and CHC
with 12 clinics, 3 WBOT Underberg Clinic has an MOU (Maternal and Obstetric units).
Greater Kokstad Local Municipality has got two fixed clinics, 3 Health Posts , 3 mobile clinics and 1
district hospital that refers to Edendale Regional Hospital at UMgungundlovu District, transfers to
the nearest Port Shepstone Regional Hospital which is in UGu district is dependent on the
availability of beds. There are no WBOTs due to staff shortages.
Kokstad Local Municipality‘s services are affected directly by Eastern Cape Province because of
its soft boundary, this is evident in the high number of non-referred cases and high TB defaulter
rate of clients mostly from Eastern Cape. People from nearby villages access services from
Kokstad PHC facilities as they are centrally situated in town where people do their day to day
shopping.
Ubuhlebezwe Local Municipality has the third largest population. It has 10 clinics, 2 mobile services
and 2 WBOTs. Health post at ward 5 is operating with challenges of staff retention as it is in a
grossly rural hard to reach area, but its need to exist is obvious from the 100% increase of the
headcount from the previous year. There is one district hospital which refers to uMgungundlovu.
UMzimkhulu Local Municipality has the largest population and is the most rural poverty stricken
hence it was identified as the Presidential Node. It has 16 fixed PHC clinics with 3 mobile clinics, 4
WBOTs . This local municipality has 1 district hospital and 2 specialized hospitals i.e. MDR TB Hospital
St. Margaret Hospital and UMzimkhulu Psychiatric Hospital. Roads are mostly gravel with poor
terrains; making it difficult for the people to access health services. The situation is worse during the
rainy season
The district has a functional District AIDS Council (DAC) and OSS (DTT) which is working closely with
the Department of Health providing intersectoral strategic direction in response to community
health related interventions.
6. Population per selected category
Population category 2016 2017 2018 2019 2020
under 1 year 14407 14457 14470 14409 14219
under 5 years 72589 73011 73061 72782 72257
05-09 years 66387 67833 69021 70025 70987

Harry Gwala District Health Plan 2018/19
Page 11 of 78
Population category 2016 2017 2018 2019 2020
10-14 years 55463 57255 59395 61642 63715
15-19 years 51329 50282 50113 50658 51905
20-24 years 55669 54036 52097 49973 48111
25-29 years 53387 54241 54434 54211 53414
30-34 years 37890 40956 44006 47005 49859
35-39 years 23714 25787 28043 30313 32373
40-44 years 16330 16904 17578 18434 19585
45-49 years 13383 13375 13442 13596 13847
50-54 years 12228 12090 11929 11759 11603
55-59 years 10910 10785 10674 10574 10465
60-64 years 9327 9257 9168 9065 8954
65-69 years 7394 7339 7278 7211 7137
70-74 years 5574 5522 5448 5358 5262
75-79 years 3948 3906 3863 3803 3723
80 years and older 3899 3850 3812 3780 3761
Total 499428 506435 513362 520188 526956
Estimated pregnant women 15415 15469 15483 15418 15214
Source: Mid-Year Population Estimates 2016, StatsSA (as per 2016 demarcations)
Note ; the highlighted population categories are some of the life course groups that will be
focussed on.
The projections on population growth for the under five years from 2019 onwards seems to be
declining. This could be attributed to high death rate in this age category (as evident in the
DHB 2015/16). The major causes of death for this age category are diarrhoeal diseases
(22.5%) as well as lower respiratory infections (22.5%). There is also a noticeable decline in the
reproduction rate as indicated on the estimated pregnant of women (as indicated from the
table above). This will be monitored against the performance of indicators like the child
mortality rate and couple year protection rate.
The high death rate due to injuries as well as HIV/AIDS amongst the 15 to 24 years according
to Health Barometer 2015 within the district is seen as contributing to the decline of the
population projection of growth rate from 2020. The effectiveness of interventions that are
planned for the three years should be targeting the injuries of this age group and research if
need be to focus on this life group.

Harry Gwala District Health Plan 2018/19
Page 12 of 78
There is a gradual decline in life span of the 50 years and above due to increase in deaths on
clients with NCDs (as evident in the DHB 2015/16). Key interventions addressing the NCD
program will be implemented as part of this plan.
While there is decline in estimated pregnant women, the increase in delivery in the facility
under 18 years rate is a cause for concern. Harry Gwala District is ranked amongst the top 10
worst performing districts for this indicator. This has implications for child under 1 year mortality
and maternal deaths.
7. Social determinants of health
Sub-Districts Data Source Greater
Kokstad NDZ Ubuhlebezwe Umzimkhulu District
Un
em
plo
ym
en
t
rate
Census 2001 41.2% 46.1% 61.6% 68.0% 52.6%
Census 2011 28.9% 27.7% 34.0% 46.6% 33.0%
C/ S 2007 11% 18.% 12% 25% 17%
C / S 2016
Tota
l nu
mb
er
of
ho
use
ho
lds
Census 2001 20566 26032 23107 36677 106382
Census 2011 19140 26746 23487 42909 112282
C/ S 2007 14321 26710 21804 43545 127659
C / S 2016 19140 26201 25516 42909 116766
Pe
rce
nta
ge
of
po
pu
latio
n li
vin
g
be
low
po
ve
rty li
ne
of
R2
83
pe
r m
on
th Census 2001
Census 2011 57.0% 58% 68% 73.0% 62.9%
C/ S 2007 97% 86% 97% 98% 93%
C / S 2016 11220 28637 56937 30245 127039
Nu
mb
er
of
ho
use
ho
lds
in
Info
rma
l dw
elli
ng
Census 2001 6725 19458 17724 29305 73404
Census 2011 3139 17322 16371 28878 65685
C/ S 2007 6336 1131 3334 3080 13881
C / S 2016
Nu
mb
er
of
ho
use
ho
lds
in
form
al d
we
llin
g
Census 2001 13841 6574 5383 7372 32978
Census 2011 16001 9424 7116 14031 46597
C/ S 2007
C / S 2016
P e r c e n t a g e
o f H o u s e h o l d s w it h
a c c e s s t o
s a n it a ti o n
Census 2001 59.9% 16% 9.9% 2.3% 20.8%

Harry Gwala District Health Plan 2018/19
Page 13 of 78
Sub-Districts Data Source Greater
Kokstad NDZ Ubuhlebezwe Umzimkhulu District
Census 2011 60.1% 17% 12.0% 6.4% 22.4%
C/ S 2007 88% 92% 88% 92% 90%
C / S 2016 12437 3364 3007 4363 23171
Ho
use
ho
lds
with
ac
ce
ss t
o p
ota
ble
wa
ter
Census 2001 19365
Census 2011 9676 8958 4955 6277 5973
C/ S 2007 12891 10255 3920 19365 9486
C / S 2016 14311 9995 5081 7231 36618
Pe
rce
nta
ge
of
Ho
use
ho
lds
with
ac
ce
ss t
o
ele
ctr
icity
Census 2001 49.9% 36.9% 28.6% 54% 36.7%
Census 2011 80.7% 62.7% 53.9% 64.5% 64.9%
C/ S 2007 58.5% 50% 46% 54% 52%
C / S 2016 15446 14013 27656 14273 71388
Ad
ult li
tera
cy r
ate
Census 2001 25.7% 15.4% 13.9% 11.8% 16.4%
Census 2011 31.1% 26.1% 33% 202% 28%
C/ S 2007 32% 37% 35% 42% 36%
C / S 2016
Source: Stats SA (Local Government Handbook)
The Unemployment rate is at 33 % for the district according to the Census 2011 with the adult
literacy of 28%. The high adult illiteracy results in the high levels of people earning below R283 per
month (62.9 %) and high levels of unemployment. The low socio- economic status of communities
renders them vulnerable to diseases. This too could contribute to treatment defaulter rate of
chronic diseases as a patient who does not have enough money will opt to buy food than to go
and collect medication. The implementation of CCMDD program may address some of these
challenges.
The source of employment for most of people is forestry farms, sugar plantations and
supermarkets. Those qualifying for social grants are using them as their main source of income.
Informal dwellings linked to poor access to sanitation are associated with sporadic diarrheal cases
that are reported from time to time. This has been noted during information meetings.
Ubuhlebezwe Local Municipality has the lowest electricity supply of at 53 % followed by NDZ Local
municipality with 62.7% of electricity supply. All health facilities in the district have electricity supply
but there are challenges with back up supply of generators to maintain in instances when there
are electricity interruptions. According to South African Multidimensional Poverty Index (SAMPI)
Harry Gwala District has got two wards that fall within the most deprived top 34 wards i.e. Ward 5

Harry Gwala District Health Plan 2018/19
Page 14 of 78
at Ubuhlebezwe (which ranks number 19) and ward 4 at NDZ (which ranks number 23). Seven
wards are within the top 100 most deprived wards, 4 are from UMzimkhulu one from NDZ .These
wards are prioritized when allocating outreach services.
Water and Sanitation
Greater Kokstad local Municipality is ahead in the provision of sanitation and water services
compared to other local municipalities. This is largely caused by the mushrooming of informal
settlement this Municipality which has resulted in the provision of sanitation through mobile toilets.
Informal settlements such as Bhambayi, Chocolate city and Marikana have no basic water and
sanitation services; this becomes a threat of waterborne diseases.
NDZ Local Municipality has wards that comprise of formal traditional dwellings which never had
piped water (these are most from the previous Ingwe Municipality). These areas are entirely
dependent on boreholes and pit privy systems however the construction of Bulwer Dam will be a
source of water supply once it has been completed. Areas which are from previously Kwa Sani
Local Municipality have piped water except informal dwellings where they are dependent on
springs and boreholes. Municipality provides technical support in cases of drought. Sporadic
cases of diarrhoea are reported if there is extra influx of people.
UMzimkhulu Local Municipality comprise of formal traditional dwellings which never had piped
water, 28 000 informal dwellings do not have water and sanitation services. Communities from
these formal traditional dwellings are dependent on boreholes and spring water and sometimes
supplies from Municipality. Sanitation is mainly pit privy .The picture contributes to sporadic cases
of diarrhoea which is reported throughout the year.
These challenges and water and sanitation in the district are addressed by IDPs.
8. Causes of Mortality
The five leading causes of death in the under 5 years are mainly diarrhoeal diseases, lower
respiratory infections, Preterm birth complications , birth asphyxia and HIV and AIDS
according to the DHB 2015/16. Diarrhoeal diseases deaths related contributory factors have
been identified to be mostly related to herbal intoxication. This has been identified in all sub-
districts .Preterm birth complications deaths are mostly related to extreme prematurity mostly
due to low socio economic background. Specialised equipment like CPAP and presence of

Harry Gwala District Health Plan 2018/19
Page 15 of 78
Medical Air are essential in management of premature babies of which not all District
Hospitals have got them like EGUM and St Apollinaris. Deaths from asphyxia are due to
compromised intra partum care.
HIV and AIDS related conditions have taken the lead in the 10 major causes of deaths as per
2014/2015 Health Barometer from 15.7% in 2013/ 2014 to 19.4% in 2014/2015. The key
population group mostly affected being within the ages of 15 and 24 years which is mostly
the child bearing age as well as the life course group tertiary education level.
Ages between 25 and 64 are equally affected but according to the population ratio both
males and females share almost the same percentage.
There have been no significant changes in HIV ANC Prevalence. It has been constantly be
above 35%. In 2011 it has been 35.9% in 2012, 36.6 in 2013 and 35.7 in 2014.
TB death rate is fluctuating between 26.2 .8%, 23.1 and 16.4% in 2014/ 2015 according to
Health Barometer 2015/2016. Previously Ingwe as a sub- district recorded the highest rate in
the district at 15.4%, and Ubuhlebezwe sub- district the lowest at 3.9%. The rest of the sub-
districts range from 7% to 7.6%.
Kokstad is having the highest defaulter rate, 13.3% in 2015. This seems to be the common
trend. The contributory factors being the soft boundary between KZN and Eastern Cape.
Kokstad is an economic hub thus attracting job seekers and has low cost houses as well as
informal settlements with poor ventilation facilities
Non Communicable diseases appear to be remaining at the same level but in terms of the
death figures rate they are increasing , Cerebro vascular diseases 5.6 % in 2013/ 2014 and 5.
7 in 2014/ 2015. Hypertensive heart diseases 2.0% in 2013/2014 and 2.4 in 2014/ 2015 diabetes
mellitus 2.9 % in 2013/ 2014 and 3.8 in 2014/ 2015.
Years of life lost due to interpersonal violence are a new trend that is gradually increasing
from 1.4% in 2013/2014 to 2.05 in 2014/ 2015. This is more related to alcohol and drug abuse
that are on the increase even in the rural communities. This will be addressed in the Part B of
the document
9. SERVICE DELIVERY PLATFORM AND MANAGEMENT
The District planning process required District Information Officer compile comprehensive
epidemiological health information of the District before the district planning workshop and make
it available to the District Management Team to define aspirations, and identify key interventions.
Provide the following sections of the comprehensive epidemiological health information for the
District (as outlined in Annexure C) is required as a minimum:

Harry Gwala District Health Plan 2018/19
Page 16 of 78
Number of facilities per sub- district by level, 2016/17
Sub-districts
Wa
rd b
ase
d o
utr
ea
ch
tea
ms
Clin
ic
CH
C
Mo
bile
s
He
alth
Po
sts
Hig
h T
ran
smis
sio
n A
rea
s
Dis
tric
t H
osp
ita
l
Re
gio
na
l Ho
spita
l
Ce
ntr
al/
Tert
iary
Ho
spita
ls
Oth
er
Ho
spita
ls
Greater Kokstad 0 2 0 3 3 1 1 0 0 0
Dr. NDZ 3 12 1 5 1 1 1 0 0 0
Ubuhlebezwe 2 9 0 2 1 1 1 0 0 0
Umzimkhulu 4 16 0 3 0 1 1 0 0 2
DISTRICT 9 39 1 13 5 4 4 0 0 2
Primary Health Care delivery platform is affected by the number of clinics resulting in long
distances that the clients have to travel to what they refer as the nearest health facility. Due the
high poverty rate, makes the community to weigh between goings to the clinic against buying
food with the little money he has got, resulting in defaulter rate. Use of WBOT and any outreach
programs to be considered in supporting the continuum of care.
The funding challenges have put on hold on construction of some clinics even though they have
been approved like the construction of CHC at Umzimkhulu Local Municipality.
The WBOT functionality is mostly affected by the staff retention which is a general challenge in the
district.
The two specialised hospitals at Umzimkhulu is the Psychiatric hospital, which serves beyond the
Harry district population, part of Ugu population and part of Alfred Nzo , Eastern Cape
Municipality because of its proximity.
St. Margaret hospital has been utilized as MDR TB hospital but discussion is under way to be
converted to a CHC by 2022
10. Human Resources for Health (filled posts)
Co
mm
un
ity
h
ea
lth
wo
rke
r
Nu
rsin
g A
ssis
tan
t
En
rolle
d n
urs
e
Pro
fess
ion
al n
urs
e
Do
cto
r
Ph
arm
ac
ist
De
ntist
Oc
cu
pa
tio
na
l
the
rap
ist
Ph
ysi
oth
era
pis
t
Sp
ee
ch
th
era
pis
t
Au
dio
log
ist
Clin
ica
l A
sso
cia
tes
Oth
er

Harry Gwala District Health Plan 2018/19
Page 17 of 78
Co
mm
un
ity
h
ea
lth
wo
rke
r
Nu
rsin
g A
ssis
tan
t
En
rolle
d n
urs
e
Pro
fess
ion
al n
urs
e
Do
cto
r
Ph
arm
ac
ist
De
ntist
Oc
cu
pa
tio
na
l
the
rap
ist
Ph
ysi
oth
era
pis
t
Sp
ee
ch
th
era
pis
t
Au
dio
log
ist
Clin
ica
l A
sso
cia
tes
Oth
er
Greater Kokstad 108 34 34 94 6 2 1 0 1 0 0 0 9
Dr. NDZ 233 68 74 166 11 1 0 1 2 0 0 2 12
Ubuhlebezwe 237 68 71 131 8 5 0 2 1 0 0 2 13
Umzimkhulu 319 45 130 257 17 4 1 3 3 0 0 3 17
HARRY GWALA
DISTRICT
878 215 309 648 42 12 2 7 7 0 0 7 51
District has been successful in deployment of human resources equitably within all sub
districts such as, Professional Nurses, Pharmacist and Allied Health workers.
All institutions within the district including district office as an institution are operational with
the approved organization structure although some of the posts that have been approved in
the organogram are not yet implemented due to the shortage of funds for the filling of the
post.
The district is unable to recruit scarce skills employees, the challenge is that there is no
retention strategy in place to prevent high turnover rate, the multiracial / private schools that
are preferred by the child bearing age of the middle class are only at Greater Kokstad and
Ubuhlebezwe Local Municipalities. This put pressure to other sub- districts that do not have
them.
The unavailability of the Audiologist in the whole district compromises the management of
the clients that are in need of the service as they have to be referred to the nearest districts.
Community Health Workers may be seen as one of the category with high numbers but due
to the rural nature of the district their availability in all municipality wards provide the
seamless continuum of care in the wards however due to the vast nature of the wards they
are not availability in all villages.
The shortage of doctors is amongst the top 5 commonest patient’s complaints. This is linked
to long waiting periods which compromised quality care. Close monitoring of sessional
doctors has to be done by Medical Managers.
Low numbers of dentists are to be seen against low restoration and creative interventions are
to be put in place to address the challenge.

Harry Gwala District Health Plan 2018/19
Page 18 of 78
11. Management and efficiency indicators for the service delivery platform
Sub-districts
Hospital PHC
District Hospital Efficiency Management
Av
era
ge
len
gth
of
sta
y (
da
ys)
Inp
atie
nt
be
d u
tilis
atio
n r
ate
(%
)
OP
D n
ew
clie
nt
no
t re
ferr
ed
rate
(%
)
Exp
en
ditu
re p
er
pa
tie
nt
da
y
eq
uiv
ale
nt
(R
an
d)
Inp
atie
nt
Cru
de
De
ath
Ra
te (
%)
Pro
vin
cia
l an
d lo
ca
l
go
ve
rnm
en
t d
istr
ict
he
alth
serv
ice
s e
xpe
nd
itu
re p
er
ca
pita
(un
insu
red
po
pu
latio
n)
(Ra
nd
)
Pro
vin
cia
l an
d lo
ca
l
go
ve
rnm
en
t p
rim
ary
he
alth
ca
re e
xpe
nd
itu
re p
er
ca
pita
(un
insu
red
po
pu
latio
n)
(Ra
nd
) P
rov
inc
ial a
nd
loc
al
go
ve
rnm
en
t e
xp
en
ditu
re p
er
prim
ary
he
alth
ca
re h
ea
dc
ou
nt
(Ra
nd
)
Pe
rce
nta
ge
of
ass
ess
ed
PH
C
fac
ilitie
s w
ith
90
% o
f th
e t
rac
er
me
dic
ine
s a
va
ilab
le (
%)
Pe
rce
nta
ge
Id
ea
l Clin
ics
(%)
PH
C f
ac
ilitie
s u
sin
g H
ea
lth
Pa
tie
nt
Re
gis
tra
tio
n (
No
)
PH
C U
tilis
atio
n R
ate
(N
o)
PH
C <
5 U
tilis
atio
n R
ate
(N
o)
23
22
21
20
19
8
7
6
5
4
3
2
1
DR. NDZ
Indicator 5.3 63.3 38.2 3264 6.1
Numerator 33742 33742 2856 133046261 390 2.6
Denominator 6349 53296 7479 40756 6349 279167
Greater Kokstad
Indicator 4.9 43.5 56.1 2524 5.4 1284168
Numerator 36758 36758 6079 140659609 405 2.4
Denominator 7566 84416 10858 55728 7566 179127
Ubuhlebezwe
Indicator 4.8 53.4 50.1 2791 5.7 878049
Numerator 39338 39338 4692 149195165 468 2.7

Harry Gwala District Health Plan 2018/19
Page 19 of 78
Sub-districts
Hospital PHC
District Hospital Efficiency Management
Av
era
ge
len
gth
of
sta
y (
da
ys)
Inp
atie
nt
be
d u
tilis
atio
n r
ate
(%
)
OP
D n
ew
clie
nt
no
t re
ferr
ed
rate
(%
)
Exp
en
ditu
re p
er
pa
tie
nt
da
y
eq
uiv
ale
nt
(R
an
d)
Inp
atie
nt
Cru
de
De
ath
Ra
te (
%)
Pro
vin
cia
l an
d lo
ca
l
go
ve
rnm
en
t d
istr
ict
he
alth
serv
ice
s e
xpe
nd
itu
re p
er
ca
pita
(un
insu
red
po
pu
latio
n)
(Ra
nd
)
Pro
vin
cia
l an
d lo
ca
l
go
ve
rnm
en
t p
rim
ary
he
alth
ca
re e
xpe
nd
itu
re p
er
ca
pita
(un
insu
red
po
pu
latio
n)
(Ra
nd
) P
rov
inc
ial a
nd
loc
al
go
ve
rnm
en
t e
xp
en
ditu
re p
er
prim
ary
he
alth
ca
re h
ea
dc
ou
nt
(Ra
nd
)
Pe
rce
nta
ge
of
ass
ess
ed
PH
C
fac
ilitie
s w
ith
90
% o
f th
e t
rac
er
me
dic
ine
s a
va
ilab
le (
%)
Pe
rce
nta
ge
Id
ea
l Clin
ics
(%)
PH
C f
ac
ilitie
s u
sin
g H
ea
lth
Pa
tie
nt
Re
gis
tra
tio
n (
No
)
PH
C U
tilis
atio
n R
ate
(N
o)
PH
C <
5 U
tilis
atio
n R
ate
(N
o)
23
22
21
20
19
8
7
6
5
4
3
2
1
Denominator 8278 73647 9371 53449 8278 292889
Umzimkhulu
Indicator 4.7 55.2 89.7 2359 4.5 2.2
Numerator 39688 39688 42891 147015581 376 426157
Denominator 8380 71913 47808 62321 8380 2295315
Harry Gwala
Indicator 4.9 52.8 74.9 2685 5.4 2.5
Numerator 149505 149505 56518 569916617 1639 1254868
Denominator 30573 283271 75486 212254 30573 5928633
KZN Indicator 5.4 56.2 49.4 2566 5.4 2.7
RSA Indicator 4.4 67.4 59.3 2568 5.1 2.3
Source: DHIS, BAS, Ideal Clinic Information System

Harry Gwala District Health Plan 2018/19
Page 20 of 78
ALOS is within Provincial target of 5 days. BUR is constantly below the norm (except for NDZ), the contributory factor has been the under-
utilisation of acute paediatric beds and non-adherence to general admission criteria. OPD Headcount not referred is still high as clients still
bypass PHC facilities. Expenditure per patient day equivalent is high because of the low BUR with full staff complement. High crude death rate
at NDZ is high, the preliminary investigation shows that clients present late. These poor performing indicators will be addressed in this plan.
PHC utilisation rate is low due to WBOT data not included in the numerator. Clients who were enrolled on CCMDD also contributed to the low
PHC utilisation rate.

Harry Gwala District Health Plan 2018/19
Page 21 of 78
12. QUALITY OF CARE
12.1 TOP 20 WORST PERFORMING IDEAL CLINIC ELEMENTS PHC FACILITIES
Poor Signage
Basic Life Support training
Incomplete client Records
Non-functional Clinic Committees
Non availability of National Guidelines (clinical audit, Ordering of general supplies, referral
guidelines, inventory books)
No backup system for electricity black outs
Staffing not in line with WISN
Poor representation in LTT and WTT OSS
No Web access
Doctors and therapists visits
Essential medical equipment unavailability
Policies not signed by National
No storage space
Incomplete Clinical audits
12.2 TOP 20 WORST PERFORMANCE NATIONAL CORE STANDARDS IN DISTRICT HOSPITALS
Emergency trollies not appropriately stocked.
Functional system to supply piped medical gas to all clinical areas is inadequate
Functional system to supply piped suction/vacuum to all clinical areas is not adequate.
Safety checks during and after surgery is not conducted according to WHO guidelines
Informed consent forms are not completed correctly
Some tracer medicines are not available
Clinical audits are not conducted.
Clinical risk forum not existing
Adverse events committee non-functional
Adverse blood reactions are not documented and reported
Disaster management plan is not known by staff
Clinical management group policies are not in place
SOP for needle stick injury not available.
Non functionality Occupational Health and Safety committee.
Staff who have received Post exposure Prophylaxis are not retested
Turn-around-time for critical stock not set and monitored regularly
Annual management inspection reports on safety hazards and maintenance is not done
There is visible loose electric wiring and collapsing ceiling

Harry Gwala District Health Plan 2018/19
Page 22 of 78
Staff –patient ratio in key areas not in accordance with the approved staffing plan for
emergency unit/out-patient/ medical/surgical and Paediatrics
Ramps with hand-rails to cater for disabled clients are not available
12.3 TOP 5 CHALLENGES REPORTED BY PATIENTS IN PATIENT SURVEYS AND PATIENTS COMPLAINTS
Long waiting times
Negative staff attitude
Poor food services
Unavailability of Doctors
Shortage of supplies e.g. hand washing material, toilet papers.

Harry Gwala District Health Plan 2018/19
Page 23 of 78
13 ORGANISATIONAL STRUCTURE OF THE DISTRICT MANAGEMENT
TEAM
The full establishment of the District Management Team gives support to the sub-districts
which are key services delivery platforms. The challenge is provision of close support and
monitoring of sub-districts is the vast nature of the district which results in travelling long
distances to reach the facilities. The proposed sub- districts plan will probably ideal to
address the challenge.
DISTRICT MANAGER
DEPUTY MANAGER INTEGRATED DHS DEVELOPMENT
PROGRAMME MANAGERS X8
DEPUTY MANAGER DHS PLANNING MONITORING EVALUATION
DISTRICT INFORMATION
TEAM
DISTRICT PLANNER DISTRICT ENGINEER
DEPUTY MANAGER CORPORATE SERVICE
SCM &FINANCE MANAGERS
INSTITUTIONS
4 District Hospitals
2 Specialized Hospitals
1CHC
1vacant,spcialised and chc
CLINIC MANAGERS
MOBILE TEAMS
HEALTH POSTS

Harry Gwala District Health Plan 2018/19
Page 24 of 78
14 DISTRICT HEALTH EXPENDITURE
BUDGET AND EXPENDITURE
Budget: Adjusted Appropriation Expenditure TOTAL
Province *Transfer to LG LG Own Province Transfer to LG LG Own Budget Expenditure
2.1: District Management 25 545 000.00 0.00 0.00 26 668 572.00 0.00 0.00 25 545 000.00 26 668 572.00
2.2: Clinics 234 194 000.00 0.00 0.00 216 767 272.00 0.00 0.00 234 194 000.00 216 767 272.00
2.3: Community Health Centres 42 562 000.00 0.00 0.00 42 483 591.00 0.00 0.00 42 562 000.00 42 483 591.00
2.4: Community Services 0.00 0.00 0.00 0.00 0.00 0.00 0.00 0.00
2.5: Other Community Services 80 976 000.00 0.00 0.00 79 896 542.00 0.00 0.00 80 976 000.00 79 896 542.00
2.6: HIV/AIDS 163 718 000.00 0.00 0.00 176 240 700.00 0.00 0.00 163 718 000.00 176 240 700.00
2.7: Nutrition 2 700 000.00 0.00 0.00 3 151 882.00 0.00 0.00 2 700 000.00 3 151 882.00
2.9: District Hospitals 480 437 000.00 0.00 0.00 469 747 986.00 0.00 0.00 480 437 000.00 469 747 986.00
TOTAL DISTRICT 1 030 132 000.00 0.00 0.00 1 014 956 545.00 0.00 0.00 1 030 132 000.00 1 014 956 545.00
Source: District Health Expenditure Review (2016/17) or BAS*LG - Local Government
The increase in budget and expenditure in the past years has been gradual e.g Clinics budget has increased from R206 854.00 in 20115/16 to
R234 194 000 in 2016/17.The expenditure has been maintained within the limits. The reflection of Clinics to be under spending should not be seen
as true reflection, as this is mainly due to delays in journals as well as BAS that closed early before all the payments being processed.
HIV and AIDS budget has increased from R161921000 IN 2015/16 to R163 718 000 in 2016/17 but over expenditure remains.

Harry Gwala District Health Plan 2018/19
Page 25 of 78
Overspending in HIV/ AIDS budget was incurred from VCT test kits which are in line with the increase in the number of people tested and the
coverage. The increase in the number of test kits used was in response the Universal test and treat program ( UTT) that was introduced in
September 2016. The support of Partner Broad Reach and other Community Based Organizations through additional Human Resource assisted
the district to be able to do Community testing. The implementation of UTT meant increase in the ARV Therapy expenditure as well.
The District Management over expenditure resulted from the out of adjustment of two officials one at level 12 and the other at level 10 at the
district that whom HR issues are not resolved.

Harry Gwala District Health Plan 2018/19
Page 26 of 78
15 DISTRICT ASPIRATIONS AND INDICATOR TARGETS
List the District aspirations, and map to the Provincial DoH Strategic Plan 2015-2020 goals.
# District Aspiration Provincial Strategic Plan
2015-2020 Goal(s)
1. 1.1 Reduce neonatal mortality rate from 12.5 to 7.0 by 2021 Reduce neonatal and
under 5 years child mortality
1.2 Maintain under 5 child mortality below 5% by 2021
2. Reduce maternal mortality rate from 97/k to 95/k Reduce maternal mortality
2.1 Increase ANC visit before 20 weeks from 73.3% to 80% by 2021
2.2 Reduce teenage pregnancy rate from 10.4% to 7%by 2021
3 Improve Women’s Health
3.1 Increase couple year protection rate from 69% to 80% by 2021
Improve Women’s Health
3.2 Increase cervical cancer coverage from 79% to 86% by 2021
4. Reduce HIV incidence using 90/90/90 strategy Manage HIV prevalence
4.1 Increases number of HIV test from 137449 to 197650 by 2021
4.2 Increase the number MMC from 5231 to 6432 by 2021.
4.3Mantain PCR positivity rate around 10 weeks at <1% by 2021
4.4 Increase the number of clients started (adult) on ART from 10271 to 13000
by 2021
4.5 Increase the number of clients started (children) on ART from 395 to 438 by
2021
4.6 Increase the number of ANC clients on ART from 1513 to 1708 by 2021
4.7 Reduce LTFU rate from 25% to <10% by 2021
4.8 Increase total remaining on ART from 49519 to 82120 by 2021
4.9. Increase viral load completion rate from 67% to 90% by 2021
4.10.Increase viral load suppression rate 92% to 95 %by 2021
5. Reduce premature mortality from NCD through prevention and treatment
5.1 Reduce the incidence of hypertension of clients from 40 years and above
from 49.5 to 23.8 to by 2021
Reduce mortality and
morbidity of non-
communicable diseases
Re-engineering primary and
community-based mental
health services
Screen at least 35% of PHC
clients for mental disorders
by March 2020
5.2 Increase the number( screenings ) of clients screened for diabetes from 40
years and above from 120 000 to 138 915 by 2021
5.2.2 Maintain reduction of the incidence of clients with diabetes of clients
from 40years and above at 1.9
5.3. Increase the number of clients screened for mental disorders from 378939

Harry Gwala District Health Plan 2018/19
Page 27 of 78
# District Aspiration Provincial Strategic Plan
2015-2020 Goal(s)
to 391885 by 2021
5.4 Increase the cataract surgery rate from 1222.2 /1ml to 830 (per 1 million) to
2230/million by 2021
5.5. Increase the number of eligible clients accessing rehabilitation services
from 18687 to 19621 by March 2021
6.
Improve patient experience survey rate from 82 % to 95% by 2021 Sustain a complaint
resolution rate of 95% (or
more) in all public health
facilities from March 2020
onwards
7. Improve compliance to the Ideal Clinic and National Core Standards
7.1. Increase percentage of clinics scoring above 80% on ideal clinic
realisation from 53% to 80 %y 2021
Improve compliance to the
Ideal Clinic and National
Core Standards
7.2 Increase percentage of health facilities (district hospitals) scoring above
80% on extreme and vital measures of National Core Standards from 0% to
100% by 2021
8. Accelerate implementation of PHC re-engineering
8.1 Increase PHC utilisation rate (adult) from 3 to 3. 1 by 2021.
Accelerate implementation
of PHC re-engineering
8.2 Increase PHC utilisation rate children <5yrs) from 4.0 to 4.2 by 2021
8.3 Increase the number of accredited health promoting schools from 11 to 30
by 2021
8.4 Increase grade R,1,8 screening coverage from 23.1 by 15% per annum by
2021
9. Improve TB outcomes
9.1 Increase TB screening (5years and older) from 80.8% to 95% by 2021
Improve TB outcomes
9.2 Reduce TB death rate from 11.8 to below <5% by 2021
9.3 Improve TB success rate from 82.5% to 90-% by 2021
9.4 Reduce LTFU rate from 4.4% o <3 5% by 2021
9.5 Improve TB MDR not evaluated rate 10% to 0% by 2021
9.6 Maintain LTFU rate (MDR) at <5 by 2021
9.7 Reduce TB death rate (MDR) from 15% to 10% by 2021
10. Improve hospital efficiencies
10.1 Reduce ALOS from 4.9 to 3.5 by 2021
10.2 Increase BUR from 62.5 % to 70% by 2021
10.3 Reduce OPD Head count unrefferred cases from 56 518 to 42 279 by 2021
Improve hospital efficiencies
Harry Gwala District Health Plan 2018/19
Page 28 of 78
# District Aspiration Provincial Strategic Plan
2015-2020 Goal(s)
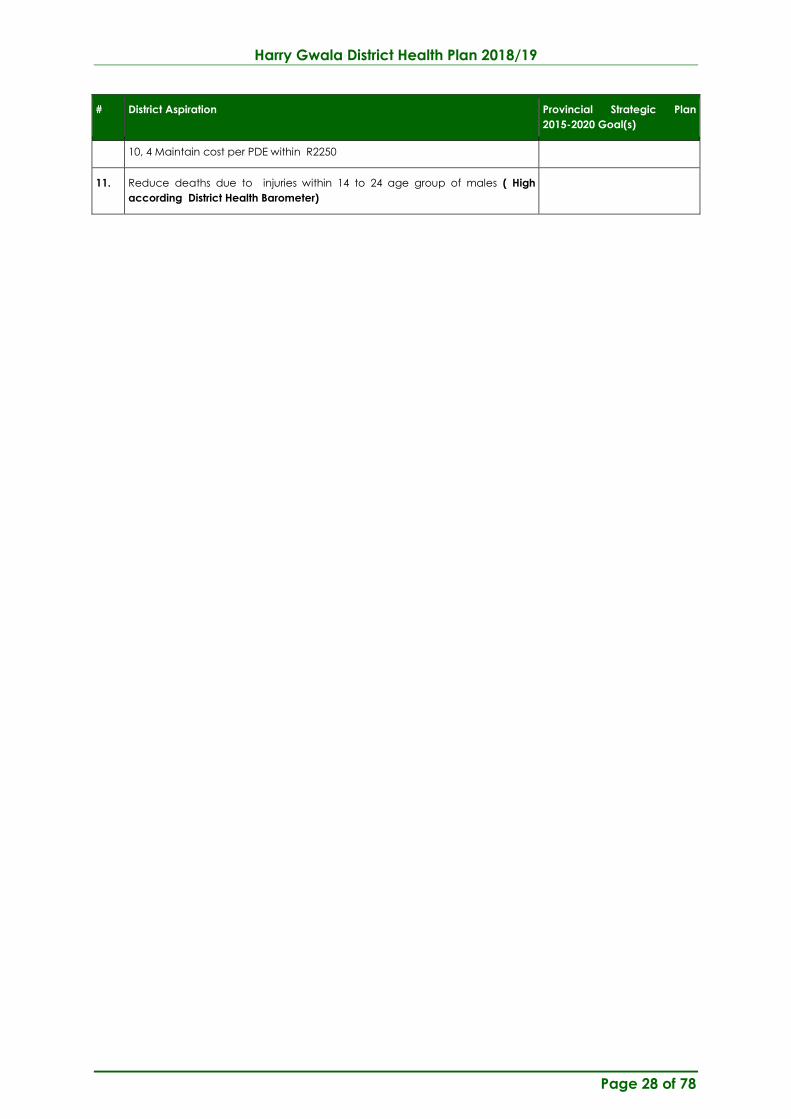
10, 4 Maintain cost per PDE within R2250
11. Reduce deaths due to injuries within 14 to 24 age group of males ( High
according District Health Barometer)

Harry Gwala District Health Plan 2018/19
Page 29 of 78
16. Indicator Targets for Theory of Change (impact, outcome and output) of aspirations
District Aspiration 1:
District Aspiration Indicato Audited
performance
2014/15
Audited
performance
2015/16
Audited
performance
2016/17
Estimated
performance
2017/18
Target
2018/19
Target
2019/20
Target
2020/21
Dis
tric
t A
spira
tio
n 1
. 1
.1 R
ed
uc
e
un
de
r 5 c
hild
mo
rta
lity ra
te
fro
m
12. R
ed
uc
e n
eo
na
tal
de
ath
ra
re fr
om
12.5
to
7
.0
Type
Imp
ac
t
Inpatient neonatal
death rate
18.7 13.6 12.5 12 14.6 7.0 7.0
Numerator 163 109 95 66 111 558 586
Denominator 8705 8009 7593 5627 7593 7973 8371
Ou
tco
me
PCR Positive around
10weeks
1.5 0.9 0.8 <1% 1% 1 1
Numerator 55 29 22 10 27 12 18
Denominator 3655 2616 2698 1447 2668 1205 1708
Under 1 year
Immunization
coverage
77 68.5 70.5 60% 90% 90% 90%
Numerator 9743 8798 9128 8701 13023 12968 12797
Denominator 12596 12799 155430 14457 14470 14409 14219
Ou
tco
me
Under 5yrs mortality
rate
42.0 50.0 39 46.1 46 46.7 46.4
Numerator 70 56 79 117 112 107 101
Denominator 2946 2808 3119 2540 2413 2293 2178

Harry Gwala District Health Plan 2018/19
Page 30 of 78
District Aspiration Indicato Audited
performance
2014/15
Audited
performance
2015/16
Audited
performance
2016/17
Estimated
performance
2017/18
Target
2018/19
Target
2019/20
Target
2020/21
Ou
tpu
t
Diarrhoeal 3.1 2.5 2.5 5 2.6 2% 2%
Numerator 24 13 14 12 11 7 4
Denominator 777 529 571 325 529 364 191
District Aspiration 2:
District Aspiration Indicator(refer to Annex C for
the proposed indicator names
for health
outcomes/programmes)
Audited
performance
2014/15
Audited
performance
2015/16
Audited
performance
2016/17
Estimated
performance
2017/18
Target
2018/19
Target
2019/20
Target
2020/21
1.
Re
du
ce
ma
tern
al d
ea
th r
ate
Imp
ac
t
Maternal deaths 136/k 97/k 92/k 97/k 95/K 95/K 95K
Numerator 12 8 7 6 6 8 8
Denominator 8797 8227 7593 6212 7593 8608 9005
Ou
tco
me
Delivery in facility
under 18
year’s
9.7 9.9 10.4 24.1 7.2 7% 7%
Numerator 850 800 796 460 551 562 586
Denominator 8750 8050 7650 1904 7650 8033 8371
Ou
t
pu
t ANC 1ST visit be
before 20 weeks
57.1% 64.6% 73.3% 73% 84% 80% 80%

Harry Gwala District Health Plan 2018/19
Page 31 of 78
District Aspiration Indicator(refer to Annex C for
the proposed indicator names
for health
outcomes/programmes)
Audited
performance
2014/15
Audited
performance
2015/16
Audited
performance
2016/17
Estimated
performance
2017/18
Target
2018/19
Target
2019/20
Target
2020/21
Numerator 6593 6460 6790 6683 8707 8678 9111
Denominator 11507 10007 9393 9155 10332 10847 11389
I
Antenatal clients
initiated on ART
97.6 93.4 93.0 94% 100% 100% 100%
Numerator 2359 1695 1513 944 1612 1434 1708
Denominator 732 1823 1627 1089 1612 1434 1708
Ou
tco
me
N/A N/A N/A N/A N/A N/A N/A N/A
Numerator N/A N/A N/A N/A N/A N/A N/A
Denominator N/A N/A N/A N/A N/A N/A N/A
Ou
tpu
t
Mother Post-natal
visit within 6 days %
72% 72% 64.2 70.3 85% 90% 90%
Numerator 6296 5858 4915 5335 6503 7230 7534
Denominator 8750 8050 7650 7614 7650 7650 8371
District Aspiration 3:
District Aspiration Indicator Audited
performance
2014/15
Audited
performance
2015/16
Audited
performance
2016/17
Estimated
performance
2017/18
Target
2018/19
Target
2019/20
Target
2020/21
A s p ir a ti o n : 3 :
I m p r o v e
w o m e n ’s
h e a lt h
Type

Harry Gwala District Health Plan 2018/19
Page 32 of 78
District Aspiration Indicator Audited
performance
2014/15
Audited
performance
2015/16
Audited
performance
2016/17
Estimated
performance
2017/18
Target
2018/19
Target
2019/20
Target
2020/21
Ou
tco
me
Couple year
Protection
22% 63% 75% 33% 80% 80% 80%
Numerator 70511 82457 121037 45148 108722 110842 112561
Denominator 324019 131739 1609620 135141 135903 138552 140701
Ou
tpu
t
Cervical Cancer
screening
81.8 73.4 110% 79.1 85% 85% 85.9%
Numerator 6822 6641 10133 7152 13615 81021 83197
Denominator 137102 90012 111216 35951 16018 95319 98232
District Aspiration 4:
District
Aspiration
Indicator Audited
performance
2014/15
Audited
performance
2015/16
Audited
performance
2016/17
Estimated
performance
2017/18
Target
2018/19
Target
2019/20
Target
2020/21
1 st 9 0
P r o c e s s & i n p u t
MMC 6035 4854 5213 7396 5601 6432 5895
Ou
t
pu
t HIV test done -
total
144 221 135 444 319 015 137449 189616 231694 197650
Type Male condom
distribution
8061653 10804875 11469300 3048000 8718602 14009823 15410805
Female condom
distribution
84392 192427 228074 181542 241925 253268 265931
O u t c o m e
2 n d
9 0 - 9 0 - 9 0 Number of clients 1998 7795 10249 7059 10710 12011 12612

Harry Gwala District Health Plan 2018/19
Page 33 of 78
District
Aspiration
Indicator Audited
performance
2014/15
Audited
performance
2015/16
Audited
performance
2016/17
Estimated
performance
2017/18
Target
2018/19
Target
2019/20
Target
2020/21
started (adult) on
ART
Ou
t
co
me
2n
d
90-
90-
90 number of clients
started (children
98 297 349 10 337 365 388
Outcome
2nd 90-
90-90
TROA 38894 46656 49519 55776 61984 77064 82120
Ou
tco
me
2n
90
-90-
90
Viral load
suppression @ 6
months
83.3% 84.6% 92.2% 92.3% 90% 90% 90%
Numerator 2171 4002 4741 1155 10271 10024 10530
Denominator 2606 4728 8193 1252 11412 11138 11700
Viral load
completion at
6months
42.4% 46% 62.7% 90% 90% 90% 90%
Numerator 2606 4728 5141 1252 10271 11138 1300
Denominator 6144 10332 18193 1863 11412 12376 13300
District Aspiration 5:
District
Aspiration
Indicator(refer to Annex C for
the proposed indicator names
for health
outcomes/programmes)
Audited
performance
2014/15
Audited
performance
2015/16
Audited
performance
2016/17
Estimated
performance
2017/18
Target
2018/19
Target
2019/20
Target
2020/21

Harry Gwala District Health Plan 2018/19
Page 34 of 78
District
Aspiration
Indicator(refer to Annex C for
the proposed indicator names
for health
outcomes/programmes)
Audited
performance
2014/15
Audited
performance
2015/16
Audited
performance
2016/17
Estimated
performance
2017/18
Target
2018/19
Target
2019/20
Target
2020/21
Asp
ira
tio
n:
5
Re
du
ce
p
rem
atu
re
mo
rta
lity
fro
m
NC
D
thro
ug
h
pre
ve
ntio
n
a
nd
tre
atm
en
t
Ou
tco
me
Hypertension
incidence
New Indicator 2.3 11.3 26.0 25/1000 24/1000 23/1000
Numerator New Indicator 207 1021 2161 2080 2006 1940
Denominator New Indicator 88657 89951 83192 83192 83580 84337
Ou
tco
me
Diabetes
incidence
New Indicator 31.1/1000 10.36/1000 11.1/1000 8/1000 5/1000 3.1/1000
Numerator New Indicator 2758 932 915 666 418 257
Denominator New indicator 88657 89951 83192 83192 83580 84337
Ou
tco
me
Cataract Rate 177.6/1ml 562.5/1ml 683/1ml 577/1ml 1948/1ml 2019/million 2230/million
Numerator 85 273 721 877 1000 1050 1175
Denominator 478535 485308 492203 506435 513362 520188 526956
Ou
tpu
t Clients screened
for mental
disorders
8% 10% 36% 36.1% 37% 40% 45%
Numerator 112339 150394 378939 541661 568744 624197 716266
Denominator 1 404 242 1 457 778 1 053 280 1501782 1539951 1560492 1591702

Harry Gwala District Health Plan 2018/19
Page 35 of 78
District Aspiration 6:
District Aspiration Indicator(refer to Annex C for
the proposed indicator names
for health
outcomes/programmes)
Audited
performance
2014/15
Audited
performance
2015/16
Audited
performance
2016/17
Estimated
performance
2017/18
Target
2018/19
Target
2019/20
Target
2020/21
Asp
ira
tio
n 6
: Im
pro
ve
TB
ou
tco
me
s
Imp
ac
t TB death rate 6.1 6 7.5 5.2 <5% <5% <5%
Numerator 79 50 248 25
Denominator 1279 831 3326 480
Ou
tco
me
TB success Rate 73% 62% 81.6 78.3 85% 90% 90%
Numerator 102 111 2713 376
Denominator 139 178 3326 480
Numerator
District Aspiration 7:
District Aspiration Indicator Audited
performance
2014/15
Audited
performance
2015/16
Audited
performance
2016/17
Estimated
performance
2017/18
Target
2018/19
Target
2019/20
Target
2020/21
Asp
ira
tio
n:
Imp
rove
TB
co
me
s
Ou
tco
me
TB clients LTFU 5% 5% 4.4% <3 % <3.5% 3.5% 3.5%
Numerator 61 39 146 16
Denominator 1279 831 3326 481
Ou
tco
me
TB/HIV co infected i
client initiated on ART
rate
83% 24% 87.8% 97% 97% 97% 97%

Harry Gwala District Health Plan 2018/19
Page 36 of 78
District Aspiration Indicator Audited
performance
2014/15
Audited
performance
2015/16
Audited
performance
2016/17
Estimated
performance
2017/18
Target
2018/19
Target
2019/20
Target
2020/21
Numerator 914 17 1210 1591 1670 1753 1840
Denominator 1099 708 1378 1643 1725 1811 1901
District Aspiration 8:
District Aspiration Indicator Audited
performance
2014/15
Audited
performance
2015/16
Audited
performance
2016/17
Estimated
performance
2017/18
Target
2018/19
Target
2019/20
Target
2020/21
Imp
rove
Ho
spita
l Eff
icie
nc
ies
ALOS 5.1 5.1 4.9 5.0 5.0 5.1 5.1
Inpatient days 274698 164602 149505 156980 164829 173070 181723
Separations 33695 33330 30573 30781 32320 33936 35632
BUR 65.0% 63.0% 52.8 57.6 60.9 67.1 70.5
Inpatient days 274698 164602 149505 156980 164829 173070 181723
Inpatients beds 726 706 706 706 706 706 706
New not referred
cases
39.8 62.7 74.9 61.2 50.1 41.0 33.5
Numerator 69819 72320 56518 50866 45779 41201 37080
Denominator 178179 116128 75486 83034 91337 100470 110517
Cost per PDE 2162.8 2250 2685 2250 2250 2250 2250
Expenditure total 443822163 455367004 569916617 1 379 634 750

Harry Gwala District Health Plan 2018/19
Page 37 of 78
District Aspiration Indicator Audited
performance
2014/15
Audited
performance
2015/16
Audited
performance
2016/17
Estimated
performance
2017/18
Target
2018/19
Target
2019/20
Target
2020/21
PDE 231552 231903 212254 233479
District Aspiration 9:
District Aspiration Indicator Audited
performance
2014/15
Audited
performance
2015/16
Audited
performance
2016/17
Estimated
performance
2017/18
Target
2018/19
Target
2019/20
Target
2020/21
A
cc
ele
rate
PH
C R
e-
en
gin
ee
rin
g
PHC utilisation rate 2.9 3.0 3.0 2.6 2.7 3.0 3.1
Numerator 1404242 1457778 1254868 1317611 1317611 1560564 1633564
Denominator 478535 485308 499428 506435 513362 520188 526956
PHC Utilisation rate
under 5yrs
4.1 4.5 4.2 4.6 5.1 5.6 6.2
Numerator 252714 280736 308809 339689 373657 411022 452124
Denominator 61967 62566 72589 73011 73061 72782 72257
Number of Health
Promoting schools
11 12 11 19 22 26 30

Harry Gwala District Health Plan 2018/19
Page 38 of 78
17 BOTTLENECKS AND ROOT CAUSES
Summarise Bottlenecks and Root-causes in the template below along with the corresponding aspiration:
Bottlenecks / Challenges Root Causes District
Aspiration #
District
Aspiration
1.1. Poor communication & intersectoral co-
ordination
1.2. Poor quality of care
1.3.. Inadequate use of service delivery
platforms and referral/linkages with
communities.
2. Shortage of neonatal equipment.
3. Poor Perinatal Care.
Failure to understand dangers of herbal intoxication.
Delay/ ordering of equipment financial.
Inefficient monitoring of partogram
1
1
Reduce under 5 child mortality rate
Reduce neonatal mortality rate from death rate
from to by 2021
2. a. Poor quality of care
b. Inadequate use of service delivery
platforms and referral/linkages with
communities
c. Poor infrastructure, medicine and
procurement and supply chain management
Non adherence to guidelines and protocols 2 Reduce number of maternal deaths from 5 to 2 by
2021
3a. Failure to understand indicators and targets
b. Poor quality of care
Negative Staff attitude 3 Improve Women’s Health
4. Failure to understand indicators and targets
b. Poor quality of care
Negative Staff attitude 4 Reduce HIV incidence using 90/90/90 strategy from
35.7to…by 2021
Poor quality of care Negative Staff attitude 4
4a. Poor quality of care
b. Poor communication & intersect oral co-
ordination
c. Inadequate use of service delivery
Poor healthy lifestyle 5 Reduce premature mortality from NCD’s through
prevention and treatment to <10% by 2021

Harry Gwala District Health Plan 2018/19
Page 39 of 78
Bottlenecks / Challenges Root Causes District
Aspiration #
District
Aspiration
platforms and referral/linkages with
communities
6. Poor quality of care
b. Poor communication & intersectoral co-
ordination
Negative Staff attitude 6 Improve patient satisfaction rate from 82 % to 95%
by 2021
7. Poor communication & intersectoral co-
ordination
7.1 Quality of service
7.2 Communication and inter-sectoral
coordination
Negative Staff attitude
Gaps in filling of client records
Poor performing indicators without monitoring
progress in quality
improvement plans
Clinic committees are not empowered enough to
understand their roles and support
7 Improve compliance to the Ideal Clinic and
National Core Standards
Increase the number of clinics with Ideal Clinic
Realisation Status from to Clinics by 2021
8.1 Service delivery platform
8.2 Human Resource
Poor access due to geographical/topography
Transport route is redirecting the clients to outside the
Sub-district
Shortage of staff has
Shortage of vehicles interferes with the outreach
schedule
8
Accelerate implementation of PHC re-engineering
9.1 Service delivery platform Noncompliance and defaulting of treatment
especially the males
Beliefs and use of other methods resulting in late
reporting
Associated comorbidities in one client(more than
one condition)
Stakeholders like Traditional healers and faith healers
9 Improve TB outcomes
9.2 Communication and inter-sectoral
coordination
9
Harry Gwala District Health Plan 2018/19
Page 40 of 78
Bottlenecks / Challenges Root Causes District
Aspiration #
District
Aspiration
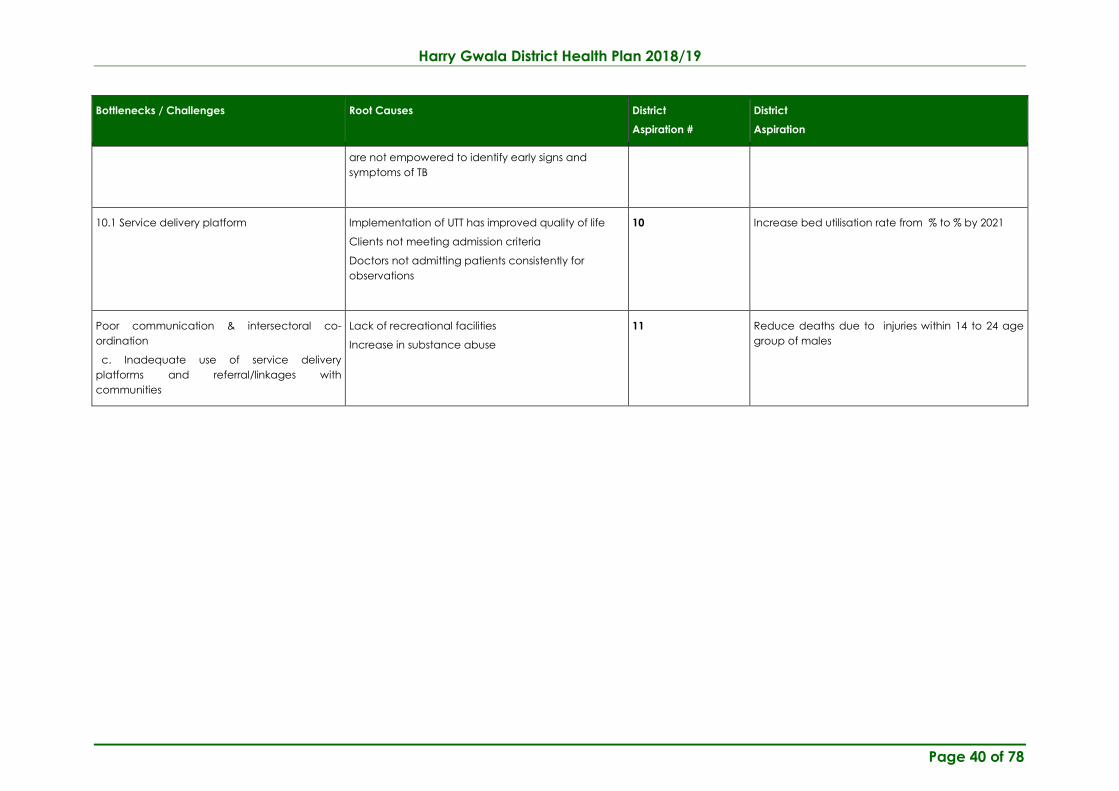
are not empowered to identify early signs and
symptoms of TB
10.1 Service delivery platform Implementation of UTT has improved quality of life
Clients not meeting admission criteria
Doctors not admitting patients consistently for
observations
10 Increase bed utilisation rate from % to % by 2021
Poor communication & intersectoral co-
ordination
c. Inadequate use of service delivery
platforms and referral/linkages with
communities
Lack of recreational facilities
Increase in substance abuse
11 Reduce deaths due to injuries within 14 to 24 age
group of males

Harry Gwala District Health Plan 2018/19
Page 41 of 78
18. KEY INTERVENTIONS
District
Aspiration #
Population Geography Public Health Intervention Costing
Life Course
Group
Key Population
**
(Sub-
district)** Ward ** Key Intervention Root Cause**
Service
Delivery
Platform*
Amount Funding
Source
1.1
1.2.
0-28 days
0-4 years
Neonates all
sexes
Children under
5 years
All sub-
districts
All sub-
districts
All Wards Skilling Health Care providers
on identification of danger
signs on new born babies
(ESMOE.
Resourcing Health facilities with
essential equipment.
Empower OMs on quality of
information to be discussed
with Clinic Committees.
Skilling of Health Workers on
IMCI
Community dialogues on
dangers of herbal intoxication
Lack of skills (BLS),
reading of CTG and
intervention
Failure to understand
dangers of herbal
intoxication by the
communities
DH , PHC
PHC
Voted funds
2
10-40 years Women of
bearing
ALL
2.1Skilling Health Care
Providers ( ESMOE . EOST)
2.2. Monitor the availability of
resources in health care
Lack of skills (BLS),
reading of CTG and
intervention
DH &PHC

Harry Gwala District Health Plan 2018/19
Page 42 of 78
District
Aspiration #
Population Geography Public Health Intervention Costing
Life Course
Group
Key Population
**
(Sub-
district)** Ward ** Key Intervention Root Cause**
Service
Delivery
Platform*
Amount Funding
Source
facilities including equipment
and HR.
2.3. Liaise with EMS in provision
of rapid interfaculty and
community transport system.
2.4 Provide support on sub-
district Child/ PPIP review
meetings to improve quality of
labour and delivery
management
Insufficient infra- structure
to provide medical air
DH, PHC
Delayed EMS response
time
DH, PHC
3. 10-40 years Young Women
& men.
Child bearing
stage women
All Sub-
districts.
3.1 Extend of SRH services to
the Youth at FET/TVETS.
3.2 Promote dual protection.
3.3. Enforce Health workers
cervical cancer screening
norm
3.4 Conduct value clarification
Negative staff attitude
DH, WBOT ,
PHC
Voted funds
4. 1.5 and older Males and
Females
All All Develop partnerships with
community based partners to
service key populations to
increase HTC coverage.
Poor intersectoral
coordination
DH,PHC Voted Funds,
CG
4 All age groups Males and
females
All All Monitor the implementation of
UTT in facilities
Provide NIMART mentorship
Conduct value clarification
Negative staff attitude
Lack of skills in HIV
management
DH, WBOT.
PHC
Voted funds
&CG

Harry Gwala District Health Plan 2018/19
Page 43 of 78
District
Aspiration #
Population Geography Public Health Intervention Costing
Life Course
Group
Key Population
**
(Sub-
district)** Ward ** Key Intervention Root Cause**
Service
Delivery
Platform*
Amount Funding
Source
4 15-49 years Males All Market quarterly MMC camp
schedule and walk in.
Increase demand creation by
collaborating with community
structures,
Targeting TVETs, Prisons and
tribal courts.
Collaborate with (GPs )
general practitioners, other
departments and izindlondlo
to increase MMC uptake
Poor intersectoral
coordination
DH, PHC
CG
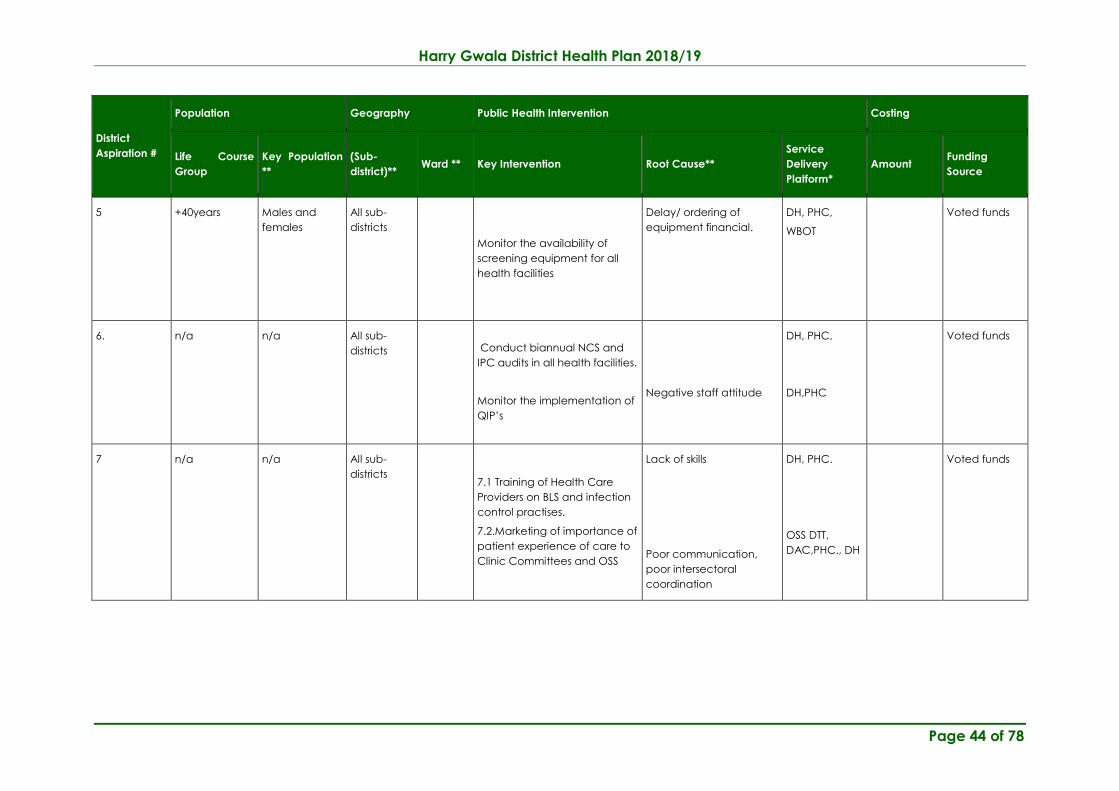
5. +40years Males and
females
All sub-
districts
Facilitate screening services for
all clients 40 years and above
for hypertension in all facilities
Conduct value clarification
Negative staff attitude DH,WBOT,PHC Voted funds
5 +40years Males and
females
All sub-
districts
Facilitate screening services for
all clients 40 years and above
for diabetes in all facilities
Conduct value clarification
Negative staff attitude DH,WBOT,PHC Voted funds
Harry Gwala District Health Plan 2018/19
Page 44 of 78
District
Aspiration #
Population Geography Public Health Intervention Costing
Life Course
Group
Key Population
**
(Sub-
district)** Ward ** Key Intervention Root Cause**
Service
Delivery
Platform*
Amount Funding
Source
5 +40years Males and
females
All sub-
districts
Monitor the availability of
screening equipment for all
health facilities
Delay/ ordering of
equipment financial.
DH, PHC,
WBOT
Voted funds
6. n/a n/a All sub-
districts
Conduct biannual NCS and
IPC audits in all health facilities.
Monitor the implementation of
QIP’s
Negative staff attitude
DH, PHC,
DH,PHC
Voted funds
7 n/a n/a All sub-
districts
7.1 Training of Health Care
Providers on BLS and infection
control practises.
7.2.Marketing of importance of
patient experience of care to
Clinic Committees and OSS
Lack of skills
Poor communication,
poor intersectoral
coordination
DH, PHC.
OSS DTT,
DAC,PHC., DH
Voted funds

Harry Gwala District Health Plan 2018/19
Page 45 of 78
District
Aspiration #
Population Geography Public Health Intervention Costing
Life Course
Group
Key Population
**
(Sub-
district)** Ward ** Key Intervention Root Cause**
Service
Delivery
Platform*
Amount Funding
Source
8 All age groups
All age groups
Males and
Females
Males and
females
All
All
8.1.Community Stakeholder
awareness on Preventive and
Promotive health.
8.2 Advocate for an increase
in the number of clinics
operating on extended hours
poor intersectoral
coordination
Poor access due to
geographical/topograph
y
WBOT, PHC
PHC
Voted Funds
9. 5 years and
above
Males and
females
All 9.1 TB Screening of 5 years
and above
9.2 Review tracing of lost to
follow up system within the
District.
9.3 Communicate with
referring facility on tracing and
screening of MDR-TB contacts.
9.4 Use patient centered care
(Patient empowerment,
engagement and increase
family involvement) in the
management of TB&MDR TB.
Revive Quarterly Cross border
meetings with Ugu and Alfred
Negative staff attitude
Poor communication
Poor communication
Beliefs and use of other
methods resulting in late
presentation
DHY, WBOT,
PHC, DH
CG and voted
funds

Harry Gwala District Health Plan 2018/19
Page 46 of 78
District
Aspiration #
Population Geography Public Health Intervention Costing
Life Course
Group
Key Population
**
(Sub-
district)** Ward ** Key Intervention Root Cause**
Service
Delivery
Platform*
Amount Funding
Source
Nzo districts
10. All age groups Males &
females
All 10.1 Monitor performance
district hospitals on patient’s
average length of stay on
quarterly basis.
10.2 Monitor performance
district hospitals on bed
utilisation rate on quarterly
basis.
10.3 Monitor functionality of
Gateways in terms extended
operating hours on quarterly
basis.
10.4. Conduct Resource
Planning meetings to monitor
district Hospital expenditure
per PDE
Noncompliance to
Admission and discharge
criteria.
District Office, DH
DH
DH
PHC
Voted
11. 14- 24 years Males and
females
All Facilitate community Youth
dialogues and camps on
substance abuse.
Present to community
structures the status of self-
Increased Substance
abuse.
Peer Pressure
PHC, OSS Voted Funds

Harry Gwala District Health Plan 2018/19
Page 47 of 78
District
Aspiration #
Population Geography Public Health Intervention Costing
Life Course
Group
Key Population
**
(Sub-
district)** Ward ** Key Intervention Root Cause**
Service
Delivery
Platform*
Amount Funding
Source
inflicted
Youth Festival, Sports
recreational activities
WBOT, ISHP, PHC, DH, SsH (refer to PART B: STEP 3 and 4 for further guidance)

Harry Gwala District Health Plan 2018/19
Page 48 of 78
19. Public Health Interventions in three dimensions
Provincial District Sub-district Facility
Strategy: Prevent avoidable neonatal and child deaths
Clinical Conduct onsite mentorship and
ESMOE drills
ESMOE drills, BANK, KINC, HBB, IYCF &
IMAM
ESMOE drills, BANK, KINC, HBB, IYCF &
IMAM
Community Presentations on Perinatal and Child
care at DAC and DTT OSS
Presentations at Local OSS AND
LAC’s
Community Dialogues
Systems Monitor resource Health Care
facilities including equipment and
human resources
Pregnancy testing and PCR kits made
available
Pregnancy testing and PCR kits
made available
Monitor linkage of Babies
District Aspiration 1: 1.2 Maintain under 5 child mortality rate below 5%
Strategy: Improve immunization under 1 year From 70.5% to 90%
Clinical Monitoring and Supervision of sub-
district’s performance
-Intensify and monitor
implementation of fast queues for
immunizations (EPI) especially in Dr.
NDZ
Conduct evidence based profiling of
under 1’s
Community Presentation of district campaigns at
District OSS structures
Community involvement and
accountability
Use of CCG’s in household combing
Systems Monitor the functionality of backup
generators in cases of electricity
failures
Conduct outreach immunisation
catch-up campaigns once a quarter
per facility
-Intensify and monitor
implementation of fast queues for
immunizations (EPI)
Strategy: Reduce severe acute malnutrition incidence under 5 years to below 2.1
Clinical Monitor SAM admitted and identify Audit the functioning of Phila Screen all under five children on

Harry Gwala District Health Plan 2018/19
Page 49 of 78
Provincial District Sub-district Facility
the affected areas Mntwana Centres weight for height and give
supplements as per need
Community Advocating the use of Phila Mntwana
Centres
Presentation at War rooms the status
of local Phila Mntwana figures
Linkage of MAM to CCG’s and War
rooms
Systems Monitor the availability and shortages
of equipment at Centres
Equipping the Phila Mntwana
Centres with Material resources
Ordering of resources as needed.
Strategy: Reduce under-5 diarrhoea with dehydration incidence to less than 10 per 1000 by March 2020
Clinical Skilling of Health Workers on IMCI Monitor the implementation of
guidelines as per IMCI
Implementation of guidelines
Community Presentation of statistics of diarrhoeal
related deaths related to herbal
intoxication at OSS structures
Community dialogues on dangers of
herbal intoxication
Health Education on dangers of
Herbal intoxication
Systems Monitor the implementation of IMCI
guidelines
Review of admission criteria for
children
Proper assessment and prompt
referral of clients
Strategy Reduce the under-5 pneumonia incidence to less than 85 per 1000 by March 2020
Clinical Skill auditing of Health Care workers
trained on IMCI
Skilling of Health Workers on IMCI Health education on early signs of
Pneumonia
Community Presentation of statistics of
pneumonia related deaths related at
OSS structures
Skilling of CCG’S on Community IMCI Awareness of clinic committees on
childhood illnesses
System Monitor the implementation of IMCI
guidelines
Review of admission criteria for
children
Proper assessment and prompt
referral of clients
District Aspiration 2: 2.1 Reduce maternal deaths

Harry Gwala District Health Plan 2018/19
Page 50 of 78
Provincial District Sub-district Facility
Strategy: Increase ANC visit before 20 weeks from 70% to 80% by 202 family Planning uptake
Clinical Monitor screening for life threatening
conditions
Monitor ANC before 20 weeks in
Information meeting
Screen all women of child bearing
age for pregnancy
Community Marketing Early ANC bookings at
district structures like OSS
Capacitate community on
importance of early booking by
conducting imbizos and community
dialogues
Monitor households pregnancy
testing by CCG’s
Systems Monitor the implementation of
maternity guidelines
Availability of pregnancy testing kits,
referral of positive cases
Availability of pregnancy testing kits,
referral of positive cases
Strategy: Reduce Primary cause of Maternal deaths
Clinical Skilling of Health Providers (
ESMOE, EOST)
ESMOE drills, BANK, KINC, HBB, IYCF &
IMAM
ESMOE drills, BANK, KINC, HBB, IYCF &
IMAM
Community Rapid inter facility and
community Emergency transport
Monitor EMS response time
Capacitate stakeholders on causes
of maternal deaths by conducting
community dialogues
Systems Appropriate resourced health
facilities including equipment &
HR
Market use of mothers lodge Refer clients far from clinic to
mothers lodge
District Aspiration 2: 2.2 Reduce maternal deaths :
Strategy: Reduce teenage pregnancy
Clinical Facilitate the implementation of
Happy hours/ policies and guidelines.
Have functional friendly youth
services in all facilities
Implement happy hour and
FastTrack teenagers
Use guidelines and policies
Community Market contraception, condom use Conduct teenage pregnancy Educate teenagers on

Harry Gwala District Health Plan 2018/19
Page 51 of 78
Provincial District Sub-district Facility
& dialogues awareness’s in schools disadvantages of teenage
pregnancy
Systems Market youth programs Provide transport for outreaches Have Champions for youth friendly
services
District Aspiration 3: 3.1 Improve women’s Health:
Strategy: Increase couple year protection rate from to
Clinical Extension of SRH services to the Youth
at FET/TVETS
Marketing service through health
talks
Marketing service through health
talks
Community Marketing of Dual protection
Procurement of condoms, IUCD’s
and other methods
Implementation of dual methods of
contraceptives
Systems Integration of Family Planning with
other services
Training on IUCD insertion & and
promote tubal ligation and
vasectomy.
Insertion IUCD insertion & promotion
of Tubal ligation.
Strategy: Increase cervical cancer screening coverage to 80% or more
Clinical Conduct clinical audit to monitor the
implementation of guidelines
Train on cervical cancer screening
procedure
Conduct cervical cancer screening
procedure as per guidelines
Community Support Phila Mah outreach
campaign.
Marketing service through health
talks
Health education on Phila service
through health talks by CCG’s
Systems Enforce cervical cancer
screening norm
Monitor Cervical screening in all
facilities
Conduct cervical screening as per
norm
District Aspiration 4: 4.1 Reduce HIV incidence using 90/90/90 strategy
Strategy: Increase number of HIV tests done
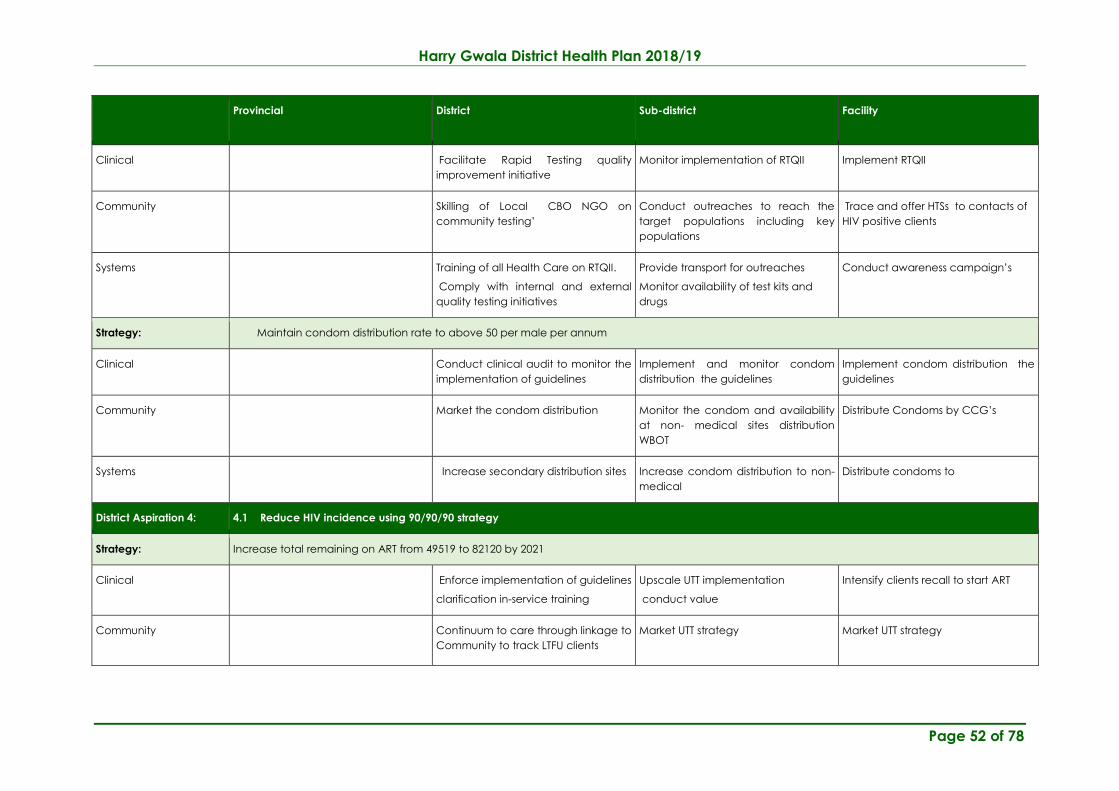
Harry Gwala District Health Plan 2018/19
Page 52 of 78
Provincial District Sub-district Facility
Clinical Facilitate Rapid Testing quality
improvement initiative
Monitor implementation of RTQII Implement RTQII
Community Skilling of Local CBO NGO on
community testing’
Conduct outreaches to reach the
target populations including key
populations
Trace and offer HTSs to contacts of
HIV positive clients
Systems Training of all Health Care on RTQII.
Comply with internal and external
quality testing initiatives
Provide transport for outreaches
Monitor availability of test kits and
drugs
Conduct awareness campaign’s
Strategy: Maintain condom distribution rate to above 50 per male per annum
Clinical Conduct clinical audit to monitor the
implementation of guidelines
Implement and monitor condom
distribution the guidelines
Implement condom distribution the
guidelines
Community Market the condom distribution Monitor the condom and availability
at non- medical sites distribution
WBOT
Distribute Condoms by CCG’s
Systems Increase secondary distribution sites Increase condom distribution to non-
medical
Distribute condoms to
District Aspiration 4: 4.1 Reduce HIV incidence using 90/90/90 strategy
Strategy: Increase total remaining on ART from 49519 to 82120 by 2021
Clinical Enforce implementation of guidelines
clarification in-service training
Upscale UTT implementation
conduct value
Intensify clients recall to start ART
Community Continuum to care through linkage to
Community to track LTFU clients
Market UTT strategy
Market UTT strategy

Harry Gwala District Health Plan 2018/19
Page 53 of 78
Provincial District Sub-district Facility
Systems Monitor Viral Completion and
Suppression
Conduct regular in-service (case
studies) in ART initiating especially
children on ART
Utilize Tier.net to ID +ve clients
Strategy: Initiate and manage HIV co-infected clients as per protocol
Clinical Clinical auditing of clinical charts to
monitor implementation of guidelines
Conduct in-service training day on
completion of ART adult, paeds and
TB clinical stationary
Implementation of guidelines
Community Educate stakeholders in in co-
infection e.g DAC
Educate stakeholders in in co-
infection at local community
structures
Health Education through CCG, at
warrooms
Systems Train at least one Tier.Net champion
per sub district
Monitor the data quality fow from
facilities
Capturing and submit data to next
level
District Aspiration 5: 5. Reduce premature mortality from NCD through prevention and treatment
Strategy: 5.1 reduce the hypertension incidence to 23/1000 by 2021prove family Planning uptake
Clinical Monitor availability of diabetes
screening tools in all health facilities
Monitor HPT screening coverage in
information meetings
Screening in all service points
Community Marketing of NCD management to
stakeholders
Capacitate community on
importance of screening for
hypertension
Conduct outreaches for screening
for chronic conditions
Systems Facilitate the availability of guidelines Provide transport, guidelines and
treatment and BP machines
Order treatment per re order levels
Strategy: 5. 2 Reduce the diabetes incidence diabetes to < 3.1 by 2021

Harry Gwala District Health Plan 2018/19
Page 54 of 78
Provincial District Sub-district Facility
Clinical Availability of diabetes screening
tools in all health facilities
Monitor Massive screening at all
service points
Screening at all service points
Community Marketing of NCD management to
stakeholders
Collaborate on community
Campaigns &, Operation MBO
Conduct outreaches for screening
for chronic conditions
Systems Facilitate the availability of
guidelines
Provide transport, guidelines and
treatment and BP machines
Order treatment per re order levels
Strategy: 5.3. Increase the cataract surgery rate to 2230 /million by 2021
Clinical N/A Sustain adequate consumables/
supplies for cataract operations
Screening of clients for referral
Community Marketing vision 2020 to the
community stakeholders
Marketing vision 2020 to the
community stakeholders
Health education on eye conditions
Systems Mobilise for Increase the number of
clients referred by sub- districts
Facilitate referral pathways to Rietvlei
for surgery
Facilitate referral pathways to
Rietvlei for surgery
Strategy: 6.1Improve patients’ experience of care rate from 82% to 95%
Clinical Availability of medicines and
supplies all times
Availability of medicines and supplies
all times
Monitoring of stock levels ordering
according to scheduled dates
Community Investigation of complaints and
client’s dissatisfaction
Market the importance of patients
experience survey rate at district
community structures
Marketing of importance of patients’
experience survey rate to Clinic
Committees and OSS
Educate clients on importance to
give accurate answers
Systems Facilitate the availability of client
satisfaction survey guidelines and
standard operating procedures
Distribute client satisfaction survey
guidelines and standard operating
procedures
Implement guidelines using SOPS
District Aspiration 7: 7. Improve compliance to the Ideal Clinic and National Core Standards
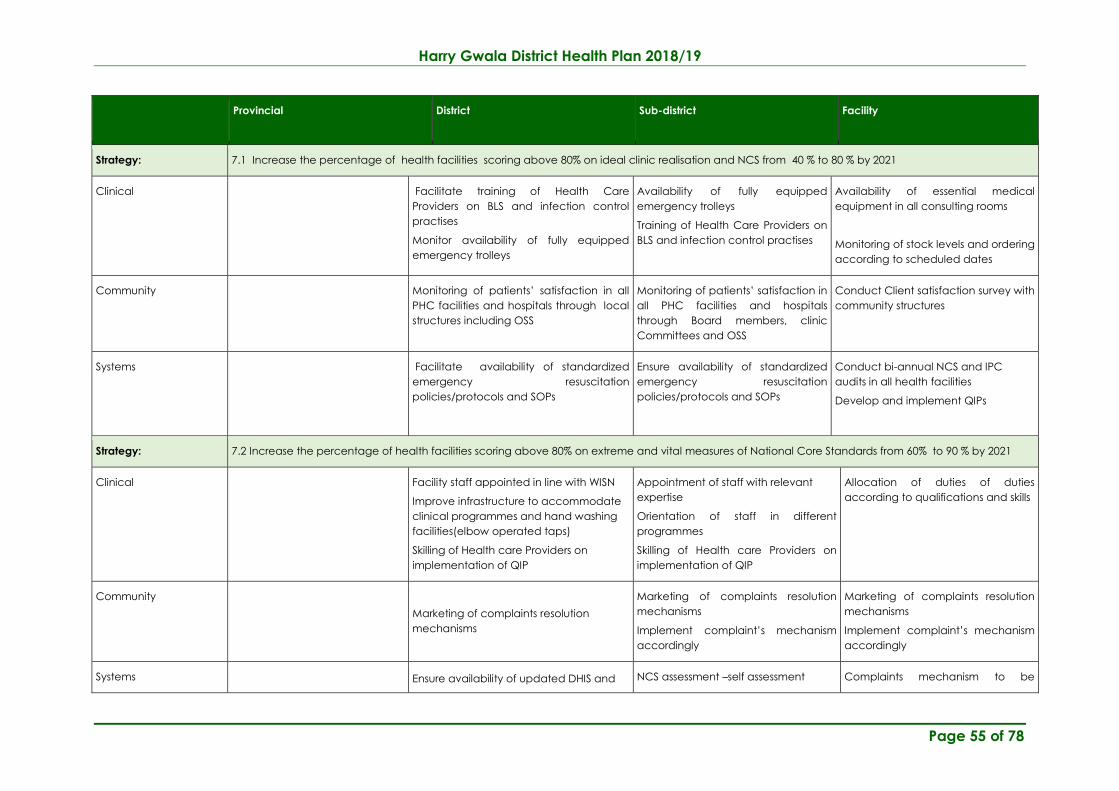
Harry Gwala District Health Plan 2018/19
Page 55 of 78
Provincial District Sub-district Facility
Strategy: 7.1 Increase the percentage of health facilities scoring above 80% on ideal clinic realisation and NCS from 40 % to 80 % by 2021
Clinical Facilitate training of Health Care
Providers on BLS and infection control
practises
Monitor availability of fully equipped
emergency trolleys
Availability of fully equipped
emergency trolleys
Training of Health Care Providers on
BLS and infection control practises
Availability of essential medical
equipment in all consulting rooms
Monitoring of stock levels and ordering
according to scheduled dates
Community Monitoring of patients’ satisfaction in all
PHC facilities and hospitals through local
structures including OSS
Monitoring of patients’ satisfaction in
all PHC facilities and hospitals
through Board members, clinic
Committees and OSS
Conduct Client satisfaction survey with
community structures
Systems Facilitate availability of standardized
emergency resuscitation
policies/protocols and SOPs
Ensure availability of standardized
emergency resuscitation
policies/protocols and SOPs
Conduct bi-annual NCS and IPC
audits in all health facilities
Develop and implement QIPs
Strategy: 7.2 Increase the percentage of health facilities scoring above 80% on extreme and vital measures of National Core Standards from 60% to 90 % by 2021
Clinical Facility staff appointed in line with WISN
Improve infrastructure to accommodate
clinical programmes and hand washing
facilities(elbow operated taps)
Skilling of Health care Providers on
implementation of QIP
Appointment of staff with relevant
expertise
Orientation of staff in different
programmes
Skilling of Health care Providers on
implementation of QIP
Allocation of duties of duties
according to qualifications and skills
Community
Marketing of complaints resolution
mechanisms
Marketing of complaints resolution
mechanisms
Implement complaint’s mechanism
accordingly
Marketing of complaints resolution
mechanisms
Implement complaint’s mechanism
accordingly
Systems Ensure availability of updated DHIS and NCS assessment –self assessment Complaints mechanism to be

Harry Gwala District Health Plan 2018/19
Page 56 of 78
Provincial District Sub-district Facility
required tools
Facilitate NCS assessment/peer review
Monitor implementation of QIPs
Complaints mechanism to be
displayed at strategic points for clients
in local languages
displayed at strategic points for
clients in local languages.
Conduct self- assessment
Develop and implement QIPs
District Aspiration 8: 8.1. Accelerate implementation of PHC re-engineering
Strategy: 8.1 Increase PHC utilisation rate (adult) from 3 to 3.1y 2021
Clinical Monitor the medicines out stocks at sub-
districts
Monitor the ordering of medicine
stock by clinics
Maintain medicine stock levels as per
norm
Community Community Stakeholder awareness on
Preventive and Promotive health
Community Stakeholder awareness
on Preventive and Promotive health
Health education on preventive and
promotive health
Systems Advocate for an increase in the number
of clinics operating on extended hours
Assign targets per PN – Staff–patient
ratio.
Clients consultation even after hours
Strategy: 8.2 Increase the number of accredited health promoting schools from 11 to 30 by 2021
Clinical Facilitate that each sub- district prepare
three schools for being processed to be
Health Promoting School
Prepare 3 schools per year to
comply to be a health promoting
school.
Identify and support local schools in
preparation
Community Re-orientate the School principals on
Health Promoting School concept
Identify the Schools with School
principals on Health Promoting
School concept
Introduce the Health Promoting
concepts to School Governing bodies
System Align SHTs into PHC clinics Monitor implementation of school
health services
Support preparation of the identified
schools

Harry Gwala District Health Plan 2018/19
Page 57 of 78
Provincial District Sub-district Facility
Strategy Increase grade R, 1 and 8 screening coverage
Clinical Facilitate procurement of Dental
materials for teeth restorations,
Procurement of Dental materials for
teeth restorations
Implement the restoration according
to targets
Community Presentation on importance of oral
hygiene at district structures to
stakeholders
Awareness of School governing bodies
and Clinic Committees on importance
of Screening of educators
Health Education on oral hygiene
System Align SHTs into PHC clinics Monitor implementation of school
health services
Support the local health school
teams with material.
District Aspiration 9: 9. Improve TB outcomes
Strategy: u Increase TB screening (5years and older) from 80% to 95% 2021
Clinical Facilitate clinical audits of clinical
charts
Implementation of QIP audit reports Implementation of QIP audit reports
Community Community mobilisation on
readiness for local campaigns
Community outreach programs to
intensify TB screening
Community outreach programs to
intensify TB screening
Systems Data verification Data verification Data verification
Strategy: Improve TB success rate from 82.5% to90% by 2021
Clinical Unlock bottlenecks that hinder
client’s evaluation and transferring
out.
Evaluation of all clients and recall
transferred out
Evaluation of all clients and recall
transferred out
Community Facilitate the availability of family
support structures
Strengthen family support on DOT Facilitate the establishment of
support groups

Harry Gwala District Health Plan 2018/19
Page 58 of 78
Provincial District Sub-district Facility
Systems Facilitate the linkage of CCG and
DOT support system
Strengthen family support on DOT Strengthen the functionality of
adherence clubs
Strategy Improve TB MDR not evaluated rate (MDR) from 10% to0%y 2021
Clinical Monitor the availability of guidelines
in all sub- districts
Implementation of guidelines Implementation of guidelines
Community Facilitate the availability of family
support structures
Strengthen family support on DOT Strengthen family support on DOT
System Review tracing of lost to follow up
system
Facilitate the tracing of lost to follow
up
Support community and family
linkages
Strategy Reduce LTFU rate from 4.4 to < 3.5 2021
Clinical Facilitate the resources to enhance
tracking system
Implementation of client tracking
system
Implementation of client tracking
system
Community Facilitate the establishment of
Adherence clubs
Strengthen family support on
adherence to treatment
Strengthen family support on
adherence to treatment
System Review tracing of lost to follow up
system within the District.
Strengthen the community facility
linkages
Strengthen the community facility
linkages
District Aspiration 10: 10. Improve hospital efficiencies
Strategy: 10.1 Reduce ALOS from 4.9 to 3.5 days
Clinical Monitor the utilisation of session
doctors
Monitor doctor’s rounds, admission
and discharge criteria.
Follow-up on discharged patients
Community Use OSS structure on orientation of
admission and discharges processes
Empower community for early
consultation
Educate on early consultation

Harry Gwala District Health Plan 2018/19
Page 59 of 78
Provincial District Sub-district Facility
Systems Value clarification to promote PHC
re- engineering.
Provide transport for outreaches Use guidelines and protocols
Strategy: 10.2 Improve BUR from 62.5. to 70%
Clinical Monitor the utilisation of session
doctors
Review admission criteria Adhere to triaging processes and
referral criteria
Community Promote the utilisation of
Government facilities for
comprehensive care
Capacitate community for early
consultation
Conduct Imbizo`s and community
dialogue
Health education community for
early consultation
Systems Follow up on referral policy to be
signed
Improve referral system Implement policy and guidelines
Strategy 10.3 Reduce OPD Head count unreferred cases by 7% each year
Clinical Monitor sub- districts with clinics
medicines shortages
Address shortage of medicines at PHC
facilities
Monitoring of medicines stock levels
Community District stakeholder presentations on
referral patterns
Clinic Committees and Hospital
Boards education on PHC re-
engineering
Clinic Committees and Hospital
Boards education on PHC re-
engineering
Systems Value clarification to address
negative staff attitudes
Extension of operating hours at PHC
facilities
Extension of operating hours at PHC
facilities
Strategy Maintain cost per PDE within R2555
Clinical Monitor quarterly expenditure Identify cost drivers N/A
Community Information sharing on implications
of cost drivers with District
Cost drivers to be discussed with
Hospital boards and community
N/A

Harry Gwala District Health Plan 2018/19
Page 60 of 78
Provincial District Sub-district Facility
Community structures structures
System Onsite support of bid committees Monitor cash flow N/A
District Aspiration11: 11. Reduce deaths due to injuries within 14 to 24 age group of males
Strategy: 11.1 Reduce deaths’ due to self-inflicted injuries
Clinical Data analysis to identify the sub-
districts mostly affected
Monitor the sections areas mostly
affected
Health education re-increase of
deaths of young people
Community Diseases burden to be discussed
with District Health council, OSS
structures
Community dialogues to engage
youth on possible causes and
interventions
Present to local War rooms and
izimbizo’s on the severity on the
condition
Systems Identify sub-districts responses in
relation to social ills and substance
abuse
Diseases burden to be discussed with
District Health council, OSS strictures
SEE INTEVENTION STRATGIES

Harry Gwala District Health Plan 2018/19
Page 61 of 78
ANNEXURE A: Comprehensive Health Information to conduct situational analysis
Population distribution, sub-district boundaries and health facility locations
Population per selected category
Population category 2016 2017 2018 2019 2020
under 1 year 14407 14457 14470 14409 14219
under 5 years 72589 73011 73061 72782 72257
05-09 years 66387 67833 69021 70025 70987
10-14 years 55463 57255 59395 61642 63715
15-19 years 51329 50282 50113 50658 51905
20-24 years 55669 54036 52097 49973 48111
25-29 years 53387 54241 54434 54211 53414
30-34 years 37890 40956 44006 47005 49859
35-39 years 23714 25787 28043 30313 32373
40-44 years 16330 16904 17578 18434 19585
45-49 years 13383 13375 13442 13596 13847
50-54 years 12228 12090 11929 11759 11603
55-59 years 10910 10785 10674 10574 10465
60-64 years 9327 9257 9168 9065 8954
65-69 years 7394 7339 7278 7211 7137

Harry Gwala District Health Plan 2018/19
Page 62 of 78
Population category 2016 2017 2018 2019 2020
70-74 years 5574 5522 5448 5358 5262
75-79 years 3948 3906 3863 3803 3723
80 years and older 3899 3850 3812 3780 3761
Total 499428 506435 513362 520188 526956
Estimated pregnant women 15415 15469 15483 15418 15214
Source: Mid-Year Population Estimates 2016, StatsSA (as per 2016 demarcations)
Number of facilities by level, 2016/17
Sub-districts Ward based
outreach teams Clinic CHC District Hospital
Regional
Hospital
Central/
Tertiary
Hospitals
Other
Hospitals
Greater Kokstad 5 2 0 1 N/A N/A 0
NDZ 17 12 1 1 N/A N/A 0
Ubuhlebezwe 12 9 0 1 N/A N/A 0
UMzimkhulu 19 16 0 1 N/A N/A 2
District 53 39 1 4 N/A N/A 2

Harry Gwala District Health Plan 2018/19
Page 63 of 78
Human resources – filled posts as at 31st March 2017
SUB- DISTRICTS
Co
mm
un
ity
he
alth
wo
rke
r
Nu
rsin
g
Ass
ista
nt
En
rolle
d n
urs
e
Pro
fess
ion
al
nu
rse
Do
cto
r
Ph
arm
ac
ist
De
ntist
Oc
cu
pa
tio
na
l
the
rap
ist
Ph
ysi
oth
era
pi
st
Sp
ee
ch
the
rap
ist
Au
dio
log
ist
Greater Kokstad 34 49 111 7 7
Dr. NDZ 69 97 181 12 10
Ubuhlebezwe 71 86 138 8 8
UMzimkhulu 128 91 199 22 7
HARRY GWALA DISTRICT 639 302 323 629 49 32 5 8 9 2 0
Source: Persal
Management and efficiency indicators for the service delivery platform - PHC
Sub-districts
Efficiency Management
Pro
vin
cia
l a
nd
lo
ca
l
go
ve
rnm
en
t d
istr
ict
he
alth
serv
ice
s e
xp
en
ditu
re p
er
ca
pita
(u
nin
sure
d
po
pu
latio
n)
(Ra
nd
)
Pro
vin
cia
l a
nd
lo
ca
l
go
ve
rnm
en
t p
rim
ary
he
alth
ca
re e
xp
en
ditu
re
pe
r c
ap
ita
(u
nin
sure
d
po
pu
latio
n)
(Ra
nd
)
Pro
vin
cia
l a
nd
lo
ca
l
go
ve
rnm
en
t e
xp
en
ditu
re
pe
r p
rim
ary
he
alth
ca
re
he
ad
co
un
t (R
an
d)
Pe
rce
nta
ge
of
ass
ess
ed
PH
C f
ac
ilitie
s w
ith
90
% o
f
the
tra
ce
r m
ed
icin
es
av
aila
ble
(%
)
Pe
rce
nta
ge
Id
ea
l C
linic
s
(%)
PH
C f
ac
ilitie
s u
sin
g H
ea
lth
Pa
tie
nt
Re
gis
tra
tio
n (
No
)
PH
C U
tilis
atio
n R
ate
(N
o)
PH
C <
5 U
tilis
atio
n R
ate
(No
)
8 7 6 5 4 3 2 1

Harry Gwala District Health Plan 2018/19
Page 64 of 78
Sub-districts
Efficiency Management
Pro
vin
cia
l a
nd
lo
ca
l
go
ve
rnm
en
t d
istr
ict
he
alth
serv
ice
s e
xp
en
ditu
re p
er
ca
pita
(u
nin
sure
d
po
pu
latio
n)
(Ra
nd
)
Pro
vin
cia
l a
nd
lo
ca
l
go
ve
rnm
en
t p
rim
ary
he
alth
ca
re e
xp
en
ditu
re
pe
r c
ap
ita
(u
nin
sure
d
po
pu
latio
n)
(Ra
nd
)
Pro
vin
cia
l a
nd
lo
ca
l
go
ve
rnm
en
t e
xp
en
ditu
re
pe
r p
rim
ary
he
alth
ca
re
he
ad
co
un
t (R
an
d)
Pe
rce
nta
ge
of
ass
ess
ed
PH
C f
ac
ilitie
s w
ith
90
% o
f
the
tra
ce
r m
ed
icin
es
av
aila
ble
(%
)
Pe
rce
nta
ge
Id
ea
l C
linic
s
(%)
PH
C f
ac
ilitie
s u
sin
g H
ea
lth
Pa
tie
nt
Re
gis
tra
tio
n (
No
)
PH
C U
tilis
atio
n R
ate
(N
o)
PH
C <
5 U
tilis
atio
n R
ate
(No
)
Greater Kokstad
Indicator 2.4
Numerator 179127
Denominator 878049
NDZ
Indicator
Numerator
Denominator
Ubuhlebezwe
Indicator 2.7
Numerator 292889
Denominator
Umzimkhulu
Indicator
Numerator
Denominator
District Indicator

Harry Gwala District Health Plan 2018/19
Page 65 of 78
Sub-districts
Efficiency Management
Pro
vin
cia
l a
nd
lo
ca
l
go
ve
rnm
en
t d
istr
ict
he
alth
serv
ice
s e
xp
en
ditu
re p
er
ca
pita
(u
nin
sure
d
po
pu
latio
n)
(Ra
nd
)
Pro
vin
cia
l a
nd
lo
ca
l
go
ve
rnm
en
t p
rim
ary
he
alth
ca
re e
xp
en
ditu
re
pe
r c
ap
ita
(u
nin
sure
d
po
pu
latio
n)
(Ra
nd
)
Pro
vin
cia
l a
nd
lo
ca
l
go
ve
rnm
en
t e
xp
en
ditu
re
pe
r p
rim
ary
he
alth
ca
re
he
ad
co
un
t (R
an
d)
Pe
rce
nta
ge
of
ass
ess
ed
PH
C f
ac
ilitie
s w
ith
90
% o
f
the
tra
ce
r m
ed
icin
es
av
aila
ble
(%
)
Pe
rce
nta
ge
Id
ea
l C
linic
s
(%)
PH
C f
ac
ilitie
s u
sin
g H
ea
lth
Pa
tie
nt
Re
gis
tra
tio
n (
No
)
PH
C U
tilis
atio
n R
ate
(N
o)
PH
C <
5 U
tilis
atio
n R
ate
(No
)
Numerator
Denominator
Source: DHIS, BAS, Ideal Clinic Information System
Management and efficiency indicators for the service delivery platform - Hospitals
Hospital Name
District Hospital Regional Hospital Tertiary / Central Hospitals
Ave
rag
e le
ng
th o
f st
ay
(da
ys)
Inp
atie
nt
be
d u
tilis
atio
n
rate
(%
)
OP
D n
ew
clie
nt
no
t
refe
rre
d r
ate
(%
)
Ex
pe
nd
itu
re p
er
pa
tie
nt
da
y e
qu
iva
len
t (
Ra
nd
)
Inp
atie
nt
Cru
de
De
ath
Ra
te (
%)
Ave
rag
e le
ng
th o
f st
ay
(da
ys)
Inp
atie
nt
be
d u
tilis
atio
n
rate
(%
)
OP
D n
ew
clie
nt
no
t
refe
rre
d r
ate
(%
)
Ex
pe
nd
itu
re p
er
pa
tie
nt
da
y e
qu
iva
len
t (
Ra
nd
)
Inp
atie
nt
Cru
de
De
ath
Ra
te (
%)
Ave
rag
e le
ng
th o
f st
ay
(da
ys)
Inp
atie
nt
be
d u
tilis
atio
n
rate
(%
)
OP
D n
ew
clie
nt
no
t
refe
rre
d r
ate
(%
)
Ex
pe
nd
itu
re p
er
pa
tie
nt
da
y e
qu
iva
len
t (
Ra
nd
)
Inp
atie
nt
Cru
de
De
ath
Ra
te (
%)
23 22 21 20 19 18 17 16 15 14 13 12 11 10 9
Christ the king Indicator 4.8 54783 50.1 2851.1 5.7 N/A N/A N/A N/A N/A N/A N/A N/A N/A

Harry Gwala District Health Plan 2018/19
Page 66 of 78
Hospital Name
District Hospital Regional Hospital Tertiary / Central Hospitals
Ave
rag
e le
ng
th o
f st
ay
(da
ys)
Inp
atie
nt
be
d u
tilis
atio
n
rate
(%
)
OP
D n
ew
clie
nt
no
t
refe
rre
d r
ate
(%
)
Ex
pe
nd
itu
re p
er
pa
tie
nt
da
y e
qu
iva
len
t (
Ra
nd
)
Inp
atie
nt
Cru
de
De
ath
Ra
te (
%)
Ave
rag
e le
ng
th o
f st
ay
(da
ys)
Inp
atie
nt
be
d u
tilis
atio
n
rate
(%
)
OP
D n
ew
clie
nt
no
t
refe
rre
d r
ate
(%
)
Ex
pe
nd
itu
re p
er
pa
tie
nt
da
y e
qu
iva
len
t (
Ra
nd
)
Inp
atie
nt
Cru
de
De
ath
Ra
te (
%)
Ave
rag
e le
ng
th o
f st
ay
(da
ys)
Inp
atie
nt
be
d u
tilis
atio
n
rate
(%
)
OP
D n
ew
clie
nt
no
t
refe
rre
d r
ate
(%
)
Ex
pe
nd
itu
re p
er
pa
tie
nt
da
y e
qu
iva
len
t (
Ra
nd
)
Inp
atie
nt
Cru
de
De
ath
Ra
te (
%)
hospital Numerator 39656 39656 4679
1523878
64 468 N/A
N/A N/A N/A N/A N/A N/A N/A N/A
Denominator 8278 187 32778 53449 8278 N/A N/A N/A N/A N/A N/A N/A N/A N/A
EGUM hospital
Indicator 4.9 51506 56.1 2441.5 5.4 N/A N/A N/A N/A N/A N/A N/A N/A N/A
Numerator 36885 36885 4749 1360597
31 405 N/A
N/A N/A N/A N/A N/A N/A N/A N/A
Denominator 7566 185 46339 55728 7566 N/A N/A N/A N/A N/A N/A N/A N/A N/A
Rietvlei
hospital
Indicator 4.7 54541 89.7 2257.2 4.5 N/A N/A N/A N/A N/A N/A N/A N/A N/A
Numerator 39692 39692 4971 1406695
78 376 N/A
N/A N/A N/A N/A N/A N/A N/A N/A
Denominator 8380 188 54512 62320 8380 N/A N/A N/A N/A N/A N/A N/A N/A N/A
St Apollinaries
hospital
Indicator 5.3 59855 38.2 3275.7 6.1 N/A N/A N/A N/A N/A N/A N/A N/A N/A
Numerator 33828 33828 4623 1335019
66 390 N/A
N/A N/A N/A N/A N/A N/A N/A N/A
Denominator 6349 146 18417 40756 6349 N/A N/A N/A N/A N/A N/A N/A N/A N/A

Harry Gwala District Health Plan 2018/19
Page 67 of 78
Hospital Name
District Hospital Regional Hospital Tertiary / Central Hospitals
Ave
rag
e le
ng
th o
f st
ay
(da
ys)
Inp
atie
nt
be
d u
tilis
atio
n
rate
(%
)
OP
D n
ew
clie
nt
no
t
refe
rre
d r
ate
(%
)
Ex
pe
nd
itu
re p
er
pa
tie
nt
da
y e
qu
iva
len
t (
Ra
nd
)
Inp
atie
nt
Cru
de
De
ath
Ra
te (
%)
Ave
rag
e le
ng
th o
f st
ay
(da
ys)
Inp
atie
nt
be
d u
tilis
atio
n
rate
(%
)
OP
D n
ew
clie
nt
no
t
refe
rre
d r
ate
(%
)
Ex
pe
nd
itu
re p
er
pa
tie
nt
da
y e
qu
iva
len
t (
Ra
nd
)
Inp
atie
nt
Cru
de
De
ath
Ra
te (
%)
Ave
rag
e le
ng
th o
f st
ay
(da
ys)
Inp
atie
nt
be
d u
tilis
atio
n
rate
(%
)
OP
D n
ew
clie
nt
no
t
refe
rre
d r
ate
(%
)
Ex
pe
nd
itu
re p
er
pa
tie
nt
da
y e
qu
iva
len
t (
Ra
nd
)
Inp
atie
nt
Cru
de
De
ath
Ra
te (
%)
District
Indicator 4.9 54909 74.9 26507.7 5.4 N/A N/A N/A N/A N/A N/A N/A N/A N/A
Numerator 150061 150061 18968 56261913
9 1639 N/A
N/A N/A N/A N/A N/A N/A N/A N/A
Denominator 30573 706 152046 212253 30573 N/A N/A N/A N/A N/A N/A N/A N/A N/A
Annual trends Deaths and Patient day equivalent, 2014/15 - 2016/17
2014/15 2015/16 2016/17
Data Element
(Number)
PH
C /
CH
C /
MO
U*
Dis
tric
t H
osp
ita
l
Re
gio
na
l H
osp
ita
l
Ce
ntr
al/
tert
iary
Ho
spita
l
Dis
tric
t To
tal
PH
C /
CH
C /
MO
U
Dis
tric
t H
osp
ita
l
Re
gio
na
l H
osp
ita
l
Ce
ntr
al/
tert
iary
Ho
spita
l
Dis
tric
t To
tal
PH
C /
CH
C /
MO
U
Re
gio
na
l H
osp
ita
l
Ce
ntr
al/
tert
iary
ho
spita
l
Dis
tric
t To
tal
Maternal deaths 12 8 7
Live births 8705 8009 6321
Still births 138 140 104

Harry Gwala District Health Plan 2018/19
Page 68 of 78
2014/15 2015/16 2016/17
Data Element
(Number)
PH
C /
CH
C /
MO
U*
Dis
tric
t H
osp
ita
l
Re
gio
na
l H
osp
ita
l
Ce
ntr
al/
tert
iary
Ho
spita
l
Dis
tric
t To
tal
PH
C /
CH
C /
MO
U
Dis
tric
t H
osp
ita
l
Re
gio
na
l H
osp
ita
l
Ce
ntr
al/
tert
iary
Ho
spita
l
Dis
tric
t To
tal
PH
C /
CH
C /
MO
U
Re
gio
na
l H
osp
ita
l
Ce
ntr
al/
tert
iary
ho
spita
l
Dis
tric
t To
tal
Ch
ild (
un
de
r 5 y
ea
rs)
Infa
nt
(un
de
r 1
ye
ar)
Ne
on
at
al
Death in facility 0-7days
Death in facility 8-28 days
Death in facility 29 days - 11
months
Death in facility 12 – 59
months
Diarrhoea death under 5 years 24 13 14
Pneumonia death under 5 years 12 11 13
Severe acute malnutrition death under 5 years 23 17 15
TB Deaths
DR TB Deaths
Inpatient death total - 1827 - 1694 - 1639
Patient day equivalent - 344500 - 23190
3
- 212253
*MOU – Maternal Obstetric Unit

Harry Gwala District Health Plan 2018/19
Page 69 of 78
Burden of disease profile
For the percentage of deaths by broad cause, deaths are classified into four groups, namely: (i) injuries; (ii) non-communicable diseases; (iii) HIV
and TB; and (iv) communicable diseases together with maternal, perinatal and nutritional conditions. Data are given by gender and age group
for the period 2010–2015. The second part of the graph shows the 10 leading single causes of death within each age group (both genders) for
2009–2014 combined.
Percentage of deaths by broad cause and leading causes, 2010- 2015

Harry Gwala District Health Plan 2018/19
Page 70 of 78
Women and Maternal Health
Impact Outcome Output
Inst
itu
tio
na
l m
ate
rna
l
mo
rta
lity
ra
tio
(P
er
10
0K
)
De
live
ry
in
fac
ility
u
nd
er
18 y
ea
rs r
ate
(%
)
An
ten
ata
l c
lie
nt
initia
ted
on
AR
T ra
te (
%)
Mo
the
r p
ost
na
tal
vis
it
with
in 6
da
ys
rate
(%
)
An
ten
ata
l 1st
v
isit
be
fore
20 w
ee
ks
rate
(%
)
Ce
rvic
al
scre
en
ing
co
ve
rag
e (
%)
Co
up
le
ye
ar
pro
tec
tio
n
rate
(%
)
7 6 5 4 3 2 1
Dr Nkosazana Dlamini
Zuma-NDZ
Indicator 11.9 95.6 488.6 74.1 189.0 67.3
Numerator 160 185 671 960 2627 16852
Denominator 1351 197 1351 1298 3482 31940
Greater Kokstad
Indicator 10.8 96.2 55.4 60.3 102.1 58.4
Numerator 161 294 853 820 1225 11036
Denominator 1512 307 1512 1367 1876 22377
Ubuhlebezwe
Indicator 11.0 95.9 59.5 70.5 66.9 62.6
Numerator 181 377 981 1249 1156 16241
Denominator 1604 396 1604 1801 3235 28573
uMzimkhulu
Indicator
8.3 87.7 90.1 77.9 116.1 61.1
Numerator 161 397 1580 2423 3236 24351

Harry Gwala District Health Plan 2018/19
Page 71 of 78
Impact Outcome Output
Inst
itu
tio
na
l m
ate
rna
l
mo
rta
lity
ra
tio
(P
er
10
0K
)
De
live
ry
in
fac
ility
u
nd
er
18 y
ea
rs r
ate
(%
)
An
ten
ata
l c
lie
nt
initia
ted
on
AR
T ra
te (
%)
Mo
the
r p
ost
na
tal
vis
it
with
in 6
da
ys
rate
(%
)
An
ten
ata
l 1st
v
isit
be
fore
20 w
ee
ks
rate
(%
)
Ce
rvic
al
scre
en
ing
co
ve
rag
e (
%)
Co
up
le
ye
ar
pro
tec
tio
n
rate
(%
)
7 6 5 4 3 2 1
Denominator
1790 451 1790 3129 5375 50656
District
Indicator 10.4 93.0 64.2 72.3 109.3 61.3
Numerator 160 1253 4085 5452 8244 68480
Denominator 6257 1351 6257 7595 13968 133546
Annual trends Child Health
Impact Outco
me
Output
Ch
ild u
nd
er
5 y
ea
rs
dia
rrh
oe
a s
e f
ata
lity
rate
(%
Dia
) C
hild
un
de
r 5 y
ea
rs
pn
eu
mo
nia
ca
se
fata
lity
ra
te %
C
hild
un
de
r 5 y
ea
rs
pn
eu
mo
nia
ca
se
fata
lity
ra
te %
C
hild
un
de
r 5 y
ea
rs
sev
ere
ac
ute
ma
lnu
tritio
n c
ase
fata
lity
ra
te %
Inp
atie
nt
de
ath
< 1
ye
ar
rate
Inp
atie
nt
de
ath
< 5
ye
ars
ra
te
Inp
atie
nt
ea
rly
ne
on
ata
l d
ea
th r
ate
Pe
r 1
K
Inp
atie
nt
ne
on
ata
l
de
ath
ra
te P
er
1K
In
fan
t 1
st P
CR
te
st
po
sitiv
e a
rou
nd
10
we
ek
s ra
te (
%)
Sc
ho
ol G
rad
e 1
scre
en
ing
co
ve
rag
e
(%)
Sc
ho
ol G
rad
e 8
scre
en
ing
co
ve
rag
e
(%)
HPV
1st
do
se
co
ve
rag
e (
%)
HPV
2n
d d
ose
co
ve
rag
e (
%)
Vita
min
A c
ove
rag
e
12
-59
(%
)
Imm
un
isa
tio
n
co
ve
rag
e u
nd
er
1 y
ea
r
(%)
Me
asl
es
2n
d d
ose
co
ve
rag
e (
%)
Infa
nt
ex
clu
siv
ely
bre
ast
fed
at
DTa
P-I
PV
-
Hib
-HB
V 3
rd d
ose
ra
te
(%)
17 16 15 14 13 12 11 10 9 8 7 6 5 4 3 2 1

Harry Gwala District Health Plan 2018/19
Page 72 of 78
Impact Outco
me
Output
Ch
ild u
nd
er
5 y
ea
rs
dia
rrh
oe
a s
e f
ata
lity
rate
(%
Dia
) C
hild
un
de
r 5 y
ea
rs
pn
eu
mo
nia
ca
se
fata
lity
ra
te %
C
hild
un
de
r 5 y
ea
rs
pn
eu
mo
nia
ca
se
fata
lity
ra
te %
C
hild
un
de
r 5 y
ea
rs
sev
ere
ac
ute
ma
lnu
tritio
n c
ase
fata
lity
ra
te %
Inp
atie
nt
de
ath
< 1
ye
ar
rate
Inp
atie
nt
de
ath
< 5
ye
ars
ra
te
Inp
atie
nt
ea
rly
ne
on
ata
l d
ea
th r
ate
Pe
r 1
K
Inp
atie
nt
ne
on
ata
l
de
ath
ra
te P
er
1K
In
fan
t 1
st P
CR
te
st
po
sitiv
e a
rou
nd
10
we
ek
s ra
te (
%)
Sc
ho
ol G
rad
e 1
scre
en
ing
co
ve
rag
e
(%)
Sc
ho
ol G
rad
e 8
scre
en
ing
co
ve
rag
e
(%)
HPV
1st
do
se
co
ve
rag
e (
%)
HPV
2n
d d
ose
co
ve
rag
e (
%)
Vita
min
A c
ove
rag
e
12
-59
(%
)
Imm
un
isa
tio
n
co
ve
rag
e u
nd
er
1 y
ea
r
(%)
Me
asl
es
2n
d d
ose
co
ve
rag
e (
%)
Infa
nt
ex
clu
siv
ely
bre
ast
fed
at
DTa
P-I
PV
-
Hib
-HB
V 3
rd d
ose
ra
te
(%)
Dr Nkosazana
Dlamini Zuma-
NDZ
Indicator 1.7 2.1 2.1 7.2 4.7 13.2 14.9 2.7 63.8 11.6 91.8 85.5 137.2
Numerator 2 3 1 29 34 23 26 7 15545 1956 3162
Denominator 121 145 48 401 730 1340 1340 446 9370 31382 3170
Greater Kokstad
Indicator 0.8 0.8 2.1 6.4 3.7 9.3 11.5 0.6 43.6 41.6 62.7 83.8 128.9
Numerator 1 1 1 29 30 17 21 2 7324 1343 1977
Denominator 132 122 47 455 818 1513 1513 528 4300 1604 1533
Ubuhlebezwe
Indicator 6.9 2.6 11.9 6.4 4.4 8.1 9.1 0.5 39.1 19.6 69.6 82.2 117.0
Numerator 10 6 8 27 35 15 17 4 15156 4306 3238
Denominator 144 233 67 424 789 1679 1679 645 8092 2808 2767
UMzimkulu
Indicator 0.6 2.6 12.8 13.6 8.0 18.8 22.0 0.7 56.5 41.6 84.0 65.7 97.6
Numerator 1 3 5 54 58 40 47 5 771 326 35351 3523 5195
Denominator 174 117 39 398 727 1789 1789 589 15692 5363 5318
District Indicator 2.5 2.1 7.5 8.3 5.1 12.5 14.6 0.8 50.7 29.1 72.9 70.5 106.1

Harry Gwala District Health Plan 2018/19
Page 73 of 78
Impact Outco
me
Output
Ch
ild u
nd
er
5 y
ea
rs
dia
rrh
oe
a s
e f
ata
lity
rate
(%
Dia
) C
hild
un
de
r 5 y
ea
rs
pn
eu
mo
nia
ca
se
fata
lity
ra
te %
C
hild
un
de
r 5 y
ea
rs
pn
eu
mo
nia
ca
se
fata
lity
ra
te %
C
hild
un
de
r 5 y
ea
rs
sev
ere
ac
ute
ma
lnu
tritio
n c
ase
fata
lity
ra
te %
Inp
atie
nt
de
ath
< 1
ye
ar
rate
Inp
atie
nt
de
ath
< 5
ye
ars
ra
te
Inp
atie
nt
ea
rly
ne
on
ata
l d
ea
th r
ate
Pe
r 1
K
Inp
atie
nt
ne
on
ata
l
de
ath
ra
te P
er
1K
In
fan
t 1
st P
CR
te
st
po
sitiv
e a
rou
nd
10
we
ek
s ra
te (
%)
Sc
ho
ol G
rad
e 1
scre
en
ing
co
ve
rag
e
(%)
Sc
ho
ol G
rad
e 8
scre
en
ing
co
ve
rag
e
(%)
HPV
1st
do
se
co
ve
rag
e (
%)
HPV
2n
d d
ose
co
ve
rag
e (
%)
Vita
min
A c
ove
rag
e
12
-59
(%
)
Imm
un
isa
tio
n
co
ve
rag
e u
nd
er
1 y
ea
r
(%)
Me
asl
es
2n
d d
ose
co
ve
rag
e (
%)
Infa
nt
ex
clu
siv
ely
bre
ast
fed
at
DTa
P-I
PV
-
Hib
-HB
V 3
rd d
ose
ra
te
(%)
Numerator 14 13 15 139 157 95 111 18 771 326 73376 9128 13572
Denominator 571 617 201 1678 3064 6321 6321 2208 37454 12957 12788
Annual trends HIV
3rd 90
Outcome
2nd 90
Output
1st 90
Process and Input
Sub-District
Pro
po
rtio
n
Vira
l lo
ad
do
ne
- A
du
lt (
%)
Pro
po
rtio
n
vira
l lo
ad
do
ne
- C
hild
(%
)
Pro
po
rtio
n
Vira
l lo
ad
sup
pre
sse
d -
Ad
ult (
%)
Pro
po
rtio
n
Vira
l Lo
ad
Su
pp
ress
ed
- c
hild
(%
)
Pro
po
rtio
n
rem
ain
ing
in
ca
re -
Ad
ults
(%)
Pro
po
rtio
n
rem
ain
ing
in
ca
re -
ch
ild (
%)
Clie
nts
re
ma
inin
g
on
AR
T ra
te -
all (
%)
HIV
te
st
po
sitiv
e
clie
nt
15
ye
ars
an
d o
lde
r ra
te
(in
clu
din
g A
NC
) (%
HIV
te
stin
g
co
ve
rag
e
(in
clu
din
g
an
ten
ata
l
ca
re)
(%)
Me
dic
al
ma
le
circ
um
cis
ion
ra
te (
%)
Ma
le
co
nd
om
dis
trib
utio
n
co
ve
rag
e
(co
nd
om
s)
Fe
ma
le
co
nd
om
dis
trib
utio
n
co
ve
rag
e
(co
nd
om
s)
12 11 10 9 8 7 6 5 4 3 2 1
Dr Nkosazana Dlamini
Zuma-NDZ
Indicator 69.8 2
Numerator 2675866 56167
Denominator 35662 42349

Harry Gwala District Health Plan 2018/19
Page 74 of 78
3rd 90
Outcome
2nd 90
Output
1st 90
Process and Input
Sub-District
Pro
po
rtio
n
Vira
l lo
ad
do
ne
- A
du
lt (
%)
Pro
po
rtio
n
vira
l lo
ad
do
ne
- C
hild
(%
)
Pro
po
rtio
n
Vira
l lo
ad
sup
pre
sse
d -
Ad
ult (
%)
Pro
po
rtio
n
Vira
l Lo
ad
Su
pp
ress
ed
- c
hild
(%
)
Pro
po
rtio
n
rem
ain
ing
in
ca
re -
Ad
ults
(%)
Pro
po
rtio
n
rem
ain
ing
in
ca
re -
ch
ild (
%)
Clie
nts
re
ma
inin
g
on
AR
T ra
te -
all (
%)
HIV
te
st
po
sitiv
e
clie
nt
15
ye
ars
an
d o
lde
r ra
te
(in
clu
din
g A
NC
) (%
HIV
te
stin
g
co
ve
rag
e
(in
clu
din
g
an
ten
ata
l
ca
re)
(%)
Me
dic
al
ma
le
circ
um
cis
ion
ra
te (
%)
Ma
le
co
nd
om
dis
trib
utio
n
co
ve
rag
e
(co
nd
om
s)
Fe
ma
le
co
nd
om
dis
trib
utio
n
co
ve
rag
e
(co
nd
om
s)
Greater Kokstad
Indicator 5.5 2.3
Numerator 1707679 60949
Denominator 26684 26662
Ubuhlebezwe
Indicator 81.2 1.0
Numerator 2521910 36662
Denominator 31603 38481
UMzimkulu
Indicator 93.8 1.1
Numerator 4563845 74296
Denominator 49424 67363
District
Indicator 81.5 1.3
Numerator 11469300 228074
Denominator 143373 174855

Harry Gwala District Health Plan 2018/19
Page 75 of 78
Annual trends TB
Impact Outcome Output Process
Sub-district
TB d
ea
th r
ate
(ETR
.ne
t) (
%)
Dru
g-r
esi
sta
nt
TB c
lie
nt
de
ath
ra
te (
%)
TB/H
IV c
o-i
nfe
cte
d c
lie
nt
on
AR
T ra
te (
ETR
.Ne
t) (
%)
TB c
lie
nt
tre
atm
en
t su
cc
ess
rate
(ETR
.ne
t) (
%)
TB c
lie
nt
loss
to
fo
llo
w u
p
rate
(ETR
.Ne
t) (
%)
TB r
ifa
mp
icin
re
sist
an
ce
co
nfirm
ed
clie
nt
rate
(%
)
TB r
ifa
mp
icin
re
sist
an
t
co
nfirm
ed
tre
atm
en
t st
art
rate
(%
)
Dru
g-r
esi
sta
nt
TB t
rea
tme
nt
suc
ce
ss r
ate
(%
)
Dru
g-r
esi
sta
nt
TB c
lie
nt
loss
to f
ollo
w-u
p r
ate
(%
)
TB c
lie
nt
initia
ted
on
tre
atm
en
t ra
te (
%)
TB s
ym
pto
m 5
ye
ars
an
d
old
er
scre
en
ed
in
fa
cility
rate
(%
)
11 10 9 8 7 6 5 4 3 2 1
Dr Nkosazana
Dlamini Zuma-NDZ
Indicator 7.2% 98.6% 86.5% 1.8%
Numerator 8 285 96 2
Denominator 111 289 111 111
Greater Kokstad
Indicator 3.7% 91.4% 85.6% 8.8%
Numerator 8 459 184 19
Denominator 215 502 215 215
Ubuhlebezwe
Indicator 4.7% 97% 94% 0%
Numerator 7 382 140 0
Denominator 149 394 149 149
UMzimkulu
Indicator 5.8% 100% 91.4% 2.2%
Numerator 8 481 127 3

Harry Gwala District Health Plan 2018/19
Page 76 of 78
Impact Outcome Output Process
Sub-district
TB d
ea
th r
ate
(ETR
.ne
t) (
%)
Dru
g-r
esi
sta
nt
TB c
lie
nt
de
ath
ra
te (
%)
TB/H
IV c
o-i
nfe
cte
d c
lie
nt
on
AR
T ra
te (
ETR
.Ne
t) (
%)
TB c
lie
nt
tre
atm
en
t su
cc
ess
rate
(ETR
.ne
t) (
%)
TB c
lie
nt
loss
to
fo
llo
w u
p
rate
(ETR
.Ne
t) (
%)
TB r
ifa
mp
icin
re
sist
an
ce
co
nfirm
ed
clie
nt
rate
(%
)
TB r
ifa
mp
icin
re
sist
an
t
co
nfirm
ed
tre
atm
en
t st
art
rate
(%
)
Dru
g-r
esi
sta
nt
TB t
rea
tme
nt
suc
ce
ss r
ate
(%
)
Dru
g-r
esi
sta
nt
TB c
lie
nt
loss
to f
ollo
w-u
p r
ate
(%
)
TB c
lie
nt
initia
ted
on
tre
atm
en
t ra
te (
%)
TB s
ym
pto
m 5
ye
ars
an
d
old
er
scre
en
ed
in
fa
cility
rate
(%
)
Denominator 139 481 139 139
District
Indicator 5% 26.9% 96.5% 89.1% 3.9% 63% 100% 57.1% 15.1% DHIS DHIS
Numerator 31 32 1607 547 24 75 75 68 18
Denominator 614 119 1666 614 614 119 75 119 119

Harry Gwala District Health Plan 2018/19
Page 77 of 78
Annual trend Non-communicable diseases 2016/17
Sub-districts Outcome
Hypertension incidence (Per 1K) Diabetes incidence (Per 1K)
2 1
Dr Nkosazana Dlamini
Zuma-NDZ
Indicator 81.6 1.3
Numerator 2627 187
Denominator 41407p 122704
Greater Kokstad
Indicator 67.1 4.1
Numerator 817 297
Denominator 20859 74265
Ubuhlebezwe
Indicator 17.2 1.6
Numerator 366 169
Denominator 38679 109480
UMzimkhulu
Indicator 19.5 1.5
Numerator 664 279
Denominator 62391 193150
District
Indicator 49.5 1.9
Numerator 4474 932
Denominator 163337 499599
Unemployment rate 36.0%
Youth unemployment rate (15-34 years) 44.4%
No schooling 10.2%
Matric 23.5%
Higher education 6.4%
Households 123705
Female headed households 53.9%
Formal dwellings 41.7%
Flush toilet connected to sewerage 18.4%

Harry Gwala District Health Plan 2018/19
Page 78 of 78
Weekly refuge removal 23.1%
Piped water inside dwellings 11.4%
Electricity for lighting 81.0%
Blue drop water score 63.4%