harris county home sales report november 2014
TRANSCRIPT

Bulman Real Estate 2600 South Shore Blvd #300 League City, TX. 77573 281.450.8689 [email protected]
Market Report – Single Family Homes
Harris&County,&Texas&1&November 2014
JEFF BULMAN, BROKER / OWNER $200,000,000 in real estate sales
Degree in Real Estate Certified Residential Specialist
Corporate Relocation Specialist Member of the Institute for Luxury Home Marketing
Member of the National Association of Realtors Member of the Texas Association of Realtors
Member of the Houston Association of Realtors

1RY�����180,000
1RY�����169,440
�6
&KDQJH10,560
Nov-2013 vs Nov-2014: The median sold price is up 6%Median Sold Price by Month
Bulman Real Estate | 281.450.8689
Nov-2013 vs. Nov-2014
Jeff Bulman
&ODUXV�0DUNHW0HWULFV� 12/12/2014Information not guaranteed. © 2014 - 2015 Terradatum and its suppliers and licensors (www.terradatum.com/about/partners).
1/2
MLS: HAR Bedrooms:AllAll
Construction Type:All1 Year Monthly SqFt:
Bathrooms: Lot Size:All All Square FootagePeriod:All
Counties:Property Types: : Single-Family
HarrisPrice:

Median Sold Price by MonthNov-2013 vs Nov-2014: The median sold price is up 6%
Bulman Real Estate | 281.450.8689Jeff Bulman
Sold Median Price Units Avg DOMTime Period
Nov-14 180,000 2,817 41
Oct-14 180,945 3,756 41
Sep-14 179,900 3,584 37
Aug-14 185,500 4,111 36
Jul-14 188,000 4,283 33
Jun-14 192,500 4,203 36
May-14 185,000 4,007 37
Apr-14 179,000 3,580 46
Mar-14 177,871 3,393 46
Feb-14 170,000 2,755 52
Jan-14 160,000 2,260 53
Dec-13 175,000 3,371 49
Nov-13 169,440 2,917 47
&ODUXV�0DUNHW0HWULFV� 12/12/2014Information not guaranteed. © 2014 - 2015 Terradatum and its suppliers and licensors (www.terradatum.com/about/partners).
22/

Nov-2013 vs Nov-2014: The median price of for sale properties is up 29% and the median price of sold properties is up 6%
Bulman Real Estate | 281.450.8689
Nov-2013 vs. Nov-2014
177,894 29
Jeff Bulman
229,0001RY�����
Median For Sale vs Median Sold
&KDQJH1RY����� �51,106
1RY����� 1RY����� �169,440 6
Nov-2013 vs. Nov-2014
180,000&KDQJH10,560
&ODUXV�0DUNHW0HWULFV� 12/12/2014Information not guaranteed. © 2014 - 2015 Terradatum and its suppliers and licensors (www.terradatum.com/about/partners).
1/2
MLS: HAR Bedrooms:AllAll
Construction Type:All1 Year Monthly SqFt:
Bathrooms: Lot Size:All All Square FootagePeriod:All
Counties:Property Types: : Single-Family
HarrisPrice:

Median For Sale vs Median SoldNov-2013 vs Nov-2014: The median price of for sale properties is up 29% and the median price of sold properties is up 6%
Bulman Real Estate | 281.450.8689Jeff Bulman
For SaleMedian SoldMedianFor Sale # Properties # PropertiesSold Price Difference
Time Period
Nov-14 13,107 2,817229,000 180,000 -49,000Oct-14 14,542 3,756220,000 180,945 -39,055Sep-14 15,010 3,584215,000 179,900 -35,100Aug-14 15,821 4,111209,999 185,500 -24,499Jul-14 16,045 4,283209,900 188,000 -21,900Jun-14 15,774 4,203209,000 192,500 -16,500May-14 15,483 4,007205,000 185,000 -20,000Apr-14 14,881 3,580199,900 179,000 -20,900Mar-14 14,443 3,393191,815 177,871 -13,944Feb-14 13,896 2,755186,000 170,000 -16,000Jan-14 14,018 2,260182,000 160,000 -22,000Dec-13 13,984 3,371175,087 175,000 -87Nov-13 15,010 2,917177,894 169,440 -8,454
&ODUXV�0DUNHW0HWULFV�Information not guaranteed. © 2014 - 2015 Terradatum and its suppliers and licensors (www.terradatum.com/about/partners).
12/12/201422/

1RY�����2,817
1RY�����2,917
�-3
&KDQJH-100
Nov-2013 vs Nov-2014: The number of Sold properties is down -3%Sold Properties by Month
Bulman Real Estate | 281.450.8689
Nov-2013 vs. Nov-2014
Jeff Bulman
&ODUXV�0DUNHW0HWULFV� 12/12/2014Information not guaranteed. © 2014 - 2015 Terradatum and its suppliers and licensors (www.terradatum.com/about/partners).
1/2
MLS: HAR Bedrooms:AllAll
Construction Type:All1 Year Monthly SqFt:
Bathrooms: Lot Size:All All Square FootagePeriod:All
Counties:Property Types: : Single-Family
HarrisPrice:

Sold Properties by MonthNov-2013 vs Nov-2014: The number of Sold properties is down -3%
Bulman Real Estate | 281.450.8689Jeff Bulman
Time Period
Full Market
Units Median Price Avg DOM
Bank Properties
Units % Bank Median Price
Non-Bank Properties
Units % Non-Bank Median PriceNov-14 180,0002,817 41 185 6.6 90,000 2,632 93.4 187,518
Oct-14 180,9453,756 41 223 5.9 99,574 3,533 94.1 187,500
Sep-14 179,9003,584 37 210 5.9 104,899 3,374 94.1 186,512
Aug-14 185,5004,111 36 213 5.2 96,000 3,898 94.8 192,000
Jul-14 188,0004,283 33 212 4.9 107,575 4,071 95.1 195,000
Jun-14 192,5004,203 36 266 6.3 104,999 3,937 93.7 202,360
May-14 185,0004,007 37 209 5.2 95,000 3,798 94.8 192,355
Apr-14 179,0003,580 46 261 7.3 92,800 3,319 92.7 188,990
Mar-14 177,8713,393 46 276 8.1 92,129 3,117 91.9 188,100
Feb-14 170,0002,755 52 279 10.1 94,000 2,476 89.9 180,475
Jan-14 160,0002,260 53 253 11.2 91,000 2,007 88.8 170,000
Dec-13 175,0003,371 49 285 8.5 88,800 3,086 91.5 185,000
Nov-13 169,4402,917 47 273 9.4 93,000 2,644 90.6 179,900
&ODUXV�0DUNHW0HWULFV� 12/12/2014Information not guaranteed. © 2014 - 2015 Terradatum and its suppliers and licensors (www.terradatum.com/about/partners).
22/

1RY�����3,281
1RY�����2,793
�17
&KDQJH488
Nov-2013 vs Nov-2014: The number of Under Contract properties is up 17%Under Contract Properties by Month
Bulman Real Estate | 281.450.8689
Nov-2013 vs. Nov-2014
Jeff Bulman
&ODUXV�0DUNHW0HWULFV� 12/12/2014Information not guaranteed. © 2014 - 2015 Terradatum and its suppliers and licensors (www.terradatum.com/about/partners).
1/2
AllBathrooms: SqFt:All
: Single-Family
All Square FootageConstruction Type: Lot Size:HAR
Harris
Period: 1 Year MonthlyPrice:MLS:
All AllAll
Property Types:
Bedrooms:
Counties:

Under Contract Properties by MonthNov-2013 vs Nov-2014: The number of Under Contract properties is up 17%
Bulman Real Estate | 281.450.8689Jeff Bulman
Median Price UnitsUnits Median Price% Non-Bank
Full Market
% BankAvg DOMMedian Price
Bank Properties
Units
Non-Bank Properties
Time PeriodNov-14 185,0003,281 43 194,94993.13,056101,9006.9225Oct-14 185,0003,539 42 194,68592.73,28299,9007.3257Sep-14 184,9003,533 42 191,84093.83,315103,3006.2218Aug-14 185,0003,772 37 189,90094.73,57397,0005.3199Jul-14 189,0003,970 35 195,00094.43,748103,5005.6222Jun-14 194,9004,129 34 199,90094.63,906104,9005.4223May-14 189,1104,123 34 197,94594.63,900104,9005.4223Apr-14 189,9004,111 38 199,90094.23,87196,7505.8240Mar-14 184,4503,903 44 194,90093.23,63899,9006.8265Feb-14 179,9003,241 47 189,90091.82,97491,5008.2267Jan-14 179,9003,051 53 189,99591.12,77890,0008.9273Dec-13 169,9002,357 55 179,90089.72,11590,00010.3242Nov-13 175,8632,793 49 187,50090.72,53390,7509.3260
&ODUXV�0DUNHW0HWULFV� 12/12/2014Information not guaranteed. © 2014 - 2015 Terradatum and its suppliers and licensors (www.terradatum.com/about/partners).
22/

1RY�����3,688
1RY�����3,329
�11
&KDQJH359
Nov-2013 vs Nov-2014: The number of New properties is up 11%New Properties by Month
Bulman Real Estate | 281.450.8689
Nov-2013 vs. Nov-2014
Jeff Bulman
&ODUXV�0DUNHW0HWULFV� 12/12/2014Information not guaranteed. © 2014 - 2015 Terradatum and its suppliers and licensors (www.terradatum.com/about/partners).
1/2
MLS: HAR Bedrooms:AllAll
Construction Type:All1 Year Monthly SqFt:
Bathrooms: Lot Size:All All Square FootagePeriod:All
Counties:Property Types: : Single-Family
HarrisPrice:

New Properties by MonthNov-2013 vs Nov-2014: The number of New properties is up 11%
Bulman Real Estate | 281.450.8689Jeff Bulman
Median Price UnitsUnits Median Price% Non-Bank
Full Market
% BankMedian Price
Bank Properties
Units
Non-Bank Properties
Time PeriodNov-14 207,5513,688 184 5.0 110,000 3,504 95.0 214,877Oct-14 205,0004,663 262 5.6 105,200 4,401 94.4 217,000Sep-14 199,0004,444 271 6.1 102,300 4,173 93.9 209,000Aug-14 194,9005,160 234 4.5 103,800 4,926 95.5 199,900Jul-14 195,0005,757 258 4.5 95,700 5,499 95.5 199,990Jun-14 198,5505,550 249 4.5 110,000 5,301 95.5 205,000May-14 205,0005,777 239 4.1 109,900 5,538 95.9 215,000Apr-14 201,0005,395 304 5.6 107,250 5,091 94.4 214,900Mar-14 197,5004,789 303 6.3 99,900 4,486 93.7 209,900Feb-14 189,9004,083 280 6.9 99,900 3,803 93.1 199,500Jan-14 187,0004,240 308 7.3 99,000 3,932 92.7 198,065Dec-13 174,9002,834 263 9.3 97,900 2,571 90.7 184,900Nov-13 175,0003,329 275 8.3 97,000 3,054 91.7 182,140
&ODUXV�0DUNHW0HWULFV� 12/12/2014Information not guaranteed. © 2014 - 2015 Terradatum and its suppliers and licensors (www.terradatum.com/about/partners).
22/

1RY�����13,107
1RY�����15,010
�-13
&KDQJH-1,903
Nov-2013 vs Nov-2014: The number of For Sale properties is down -13%For Sale Properties by Month
Bulman Real Estate | 281.450.8689
Nov-2013 vs. Nov-2014
Jeff Bulman
&ODUXV�0DUNHW0HWULFV� 12/12/2014Information not guaranteed. © 2014 - 2015 Terradatum and its suppliers and licensors (www.terradatum.com/about/partners).
1/2
MLS: HAR Bedrooms:AllAll
Construction Type:All1 Year Monthly SqFt:
Bathrooms: Lot Size:All All Square FootagePeriod:All
Counties:Property Types: : Single-Family
HarrisPrice:

For Sale Properties by MonthNov-2013 vs Nov-2014: The number of For Sale properties is down -13%
Bulman Real Estate | 281.450.8689Jeff Bulman
Median Price UnitsUnits Median Price% Non-Bank
Full Market
% BankAvg DOMMedian Price
Bank Properties
Units
Non-Bank Properties
Time PeriodNov-14 229,00013,107 90 700 5.3 112,150 12,407 94.7 239,990Oct-14 220,00014,542 87 846 5.8 110,000 13,696 94.2 234,900Sep-14 215,00015,010 88 860 5.7 109,950 14,150 94.3 225,000Aug-14 209,99915,821 85 869 5.5 108,000 14,952 94.5 220,000Jul-14 209,90016,045 84 922 5.7 110,000 15,123 94.3 220,000Jun-14 209,00015,774 85 981 6.2 110,000 14,793 93.8 220,000May-14 205,00015,483 87 1,007 6.5 109,000 14,476 93.5 219,000Apr-14 199,90014,881 92 1,076 7.2 106,650 13,805 92.8 215,000Mar-14 191,81514,443 99 1,105 7.7 105,000 13,338 92.3 205,000Feb-14 186,00013,896 104 1,128 8.1 104,600 12,768 91.9 199,500Jan-14 182,00014,018 109 1,192 8.5 100,500 12,826 91.5 195,000Dec-13 175,08713,984 123 1,243 8.9 99,900 12,741 91.1 189,000Nov-13 177,89415,010 113 1,309 8.7 99,900 13,701 91.3 189,500
&ODUXV�0DUNHW0HWULFV� 12/12/2014Information not guaranteed. © 2014 - 2015 Terradatum and its suppliers and licensors (www.terradatum.com/about/partners).
22/

1RY�����1,425
1RY�����1,067
�34
&KDQJH358
Nov-2013 vs Nov-2014: The number of Expired properties is up 34%Expired Properties by Month
Bulman Real Estate | 281.450.8689
Nov-2013 vs. Nov-2014
Jeff Bulman
12/12/2014&ODUXV�0DUNHW0HWULFV� 1/2
MLS: HAR Bedrooms:AllAll
Construction Type:All1 Year Monthly SqFt:
Bathrooms: Lot Size:All All Square FootagePeriod:All
Counties:Property Types: : Single-Family
HarrisPrice:

Expired Properties by MonthNov-2013 vs Nov-2014: The number of Expired properties is up 34%
Bulman Real Estate | 281.450.8689Jeff Bulman
Median Price Units% BankAvg DOMUnits Median Price
Bank Properties
Units
Non-Bank Properties
% Non-Bank Median Price
Full Market
Nov-14 224,9001,425 94 49 3.4 115,000 1,376 96.6 232,581Oct-14 222,0001,584 90 73 4.6 115,999 1,511 95.4 229,900Sep-14 214,9451,598 83 58 3.6 118,450 1,540 96.4 220,000Aug-14 200,0001,483 87 81 5.5 114,900 1,402 94.5 215,000Jul-14 214,9501,414 90 65 4.6 112,000 1,349 95.4 225,000Jun-14 198,0001,357 88 94 6.9 99,000 1,263 93.1 214,990May-14 192,4501,136 95 52 4.6 104,500 1,084 95.4 203,385Apr-14 199,7001,064 102 68 6.4 116,500 996 93.6 210,000Mar-14 175,0001,054 110 68 6.5 108,900 986 93.5 181,208Feb-14 187,9001,001 112 59 5.9 99,999 942 94.1 195,000Jan-14 169,9451,154 116 71 6.2 100,000 1,083 93.8 179,900Dec-13 169,0001,849 121 117 6.3 95,000 1,732 93.7 175,000Nov-13 179,9001,067 103 69 6.5 115,000 998 93.5 185,000
&ODUXV�0DUNHW0HWULFV� 12/12/2014Information not guaranteed. © 2014 - 2015 Terradatum and its suppliers and licensors (www.terradatum.com/about/partners).
22/

Nov-2013 vs Nov-2014: The number of for sale properties is down -13% and the number of sold properties is down -3%
Bulman Real Estate | 281.450.8689
Nov-2013 vs. Nov-2014
15,010 -13
Jeff Bulman
13,1071RY�����
Supply & Demand by Month
&KDQJH1RY����� �-1,903
1RY����� 1RY����� �2,917 -3
Nov-2013 vs. Nov-2014
2,817&KDQJH
-100
&ODUXV�0DUNHW0HWULFV� 12/12/2014Information not guaranteed. © 2014 - 2015 Terradatum and its suppliers and licensors (www.terradatum.com/about/partners).
1/2
MLS: HAR Bedrooms:AllAll
Construction Type:All1 Year Monthly SqFt:
Bathrooms: Lot Size:All All Square FootagePeriod:All
Counties:Property Types: : Single-Family
HarrisPrice:

Supply & Demand by MonthNov-2013 vs Nov-2014: The number of for sale properties is down -13% and the number of sold properties is down -3%
Jeff Bulman Bulman Real Estate | 281.450.8689
For Sale Sold# Properties
Avg DOM Avg DOM# Properties
Time Period
Nov-14 90 4113,107 2,817Oct-14 87 4114,542 3,756Sep-14 88 3715,010 3,584Aug-14 85 3615,821 4,111Jul-14 84 3316,045 4,283Jun-14 85 3615,774 4,203May-14 87 3715,483 4,007Apr-14 92 4614,881 3,580Mar-14 99 4614,443 3,393Feb-14 104 5213,896 2,755Jan-14 109 5314,018 2,260Dec-13 123 4913,984 3,371Nov-13 113 4715,010 2,917
&ODUXV�0DUNHW0HWULFV� 12/12/2014Information not guaranteed. © 2014 - 2015 Terradatum and its suppliers and licensors (www.terradatum.com/about/partners).
22/
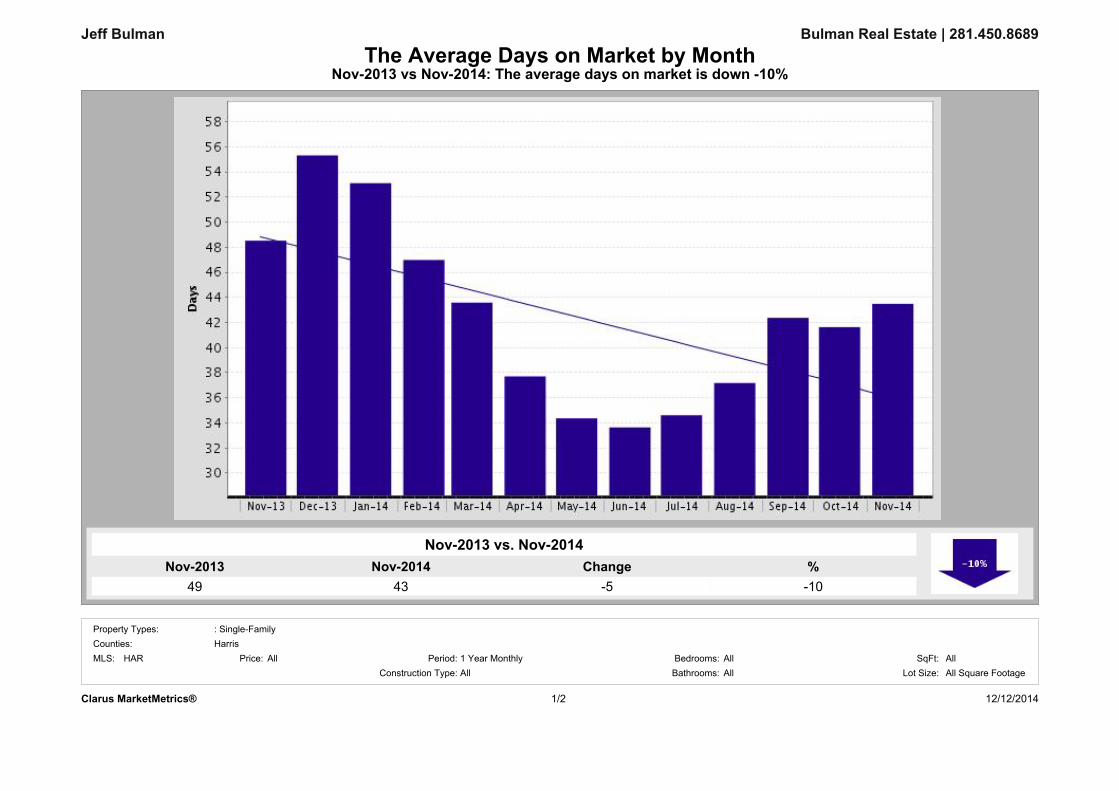
1RY�����43
1RY�����49
�-10
&KDQJH-5
Nov-2013 vs Nov-2014: The average days on market is down -10%The Average Days on Market by Month
Bulman Real Estate | 281.450.8689
Nov-2013 vs. Nov-2014
Jeff Bulman
HarrisAll 1 Year Monthly
Counties:Period:Price:
Property Types: : Single-Family
12/12/20141/2&ODUXV�0DUNHW0HWULFV�
All Square FootageBedrooms: All AllSqFt:
All Lot Size:Bathrooms:AllConstruction Type:MLS: HAR

The Average Days on Market by MonthNov-2013 vs Nov-2014: The average days on market is down -10%
Bulman Real Estate | 281.450.8689Jeff Bulman
# UC UnitsAvg DOMTime PeriodNov-14 3,28143Oct-14 3,53942Sep-14 3,53342Aug-14 3,77237Jul-14 3,97035Jun-14 4,12934May-14 4,12334Apr-14 4,11138Mar-14 3,90344Feb-14 3,24147Jan-14 3,05153Dec-13 2,35755Nov-13 2,79349
&ODUXV�0DUNHW0HWULFV� 2/2 12/12/2014Information not guaranteed. © 2014 - 2015 Terradatum and its suppliers and licensors (www.terradatum.com/about/partners).

Nov-2013 vs Nov-2014: The average months supply of inventory is down -36.0%
Bulman Real Estate | 281.450.8689
Nov-2013 vs. Nov-2014
4.0 -36.0
Jeff Bulman
2.61RY�����
Months Supply of Inventory
&KDQJH1RY����� �-1.4
&ODUXV�0DUNHW0HWULFV� 12/12/2014Information not guaranteed. © 2014 - 2015 Terradatum and its suppliers and licensors (www.terradatum.com/about/partners).
1/2
MLS: HAR Bedrooms:AllAll
Construction Type:All1 Year Monthly SqFt:
Bathrooms: Lot Size:All All Square FootagePeriod:All
Counties:Property Types: : Single-Family
HarrisPrice:
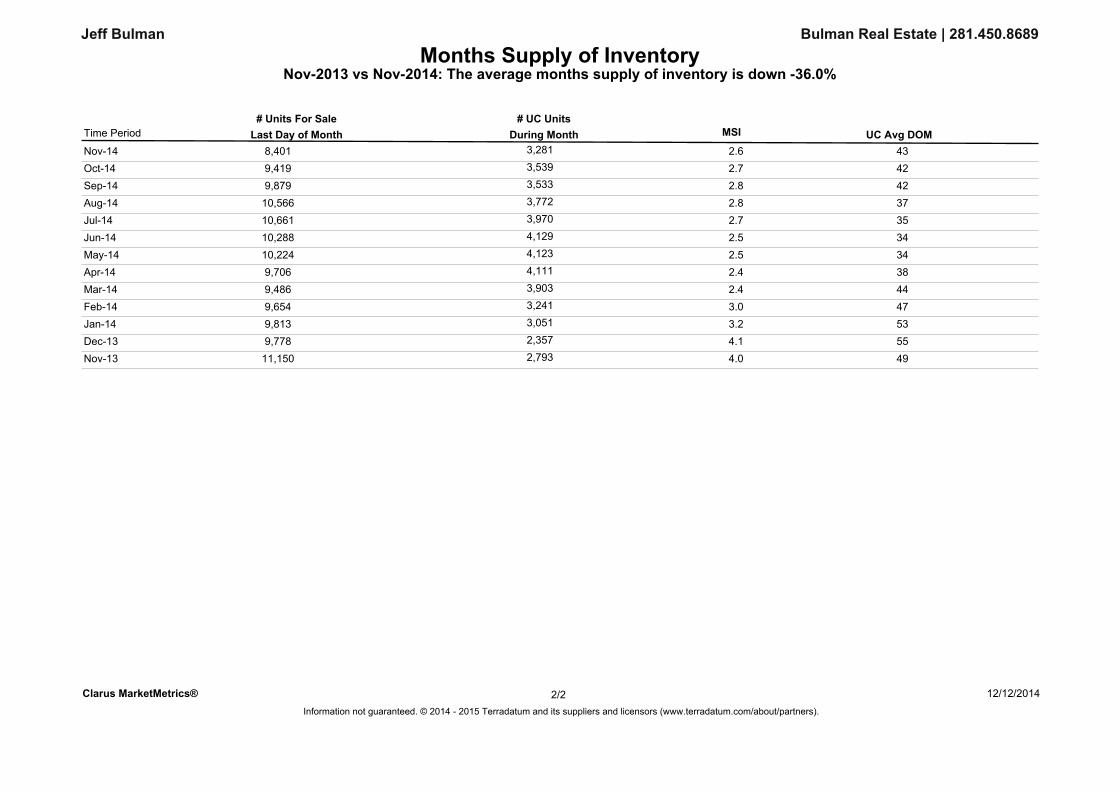
Months Supply of InventoryNov-2013 vs Nov-2014: The average months supply of inventory is down -36.0%
Jeff Bulman Bulman Real Estate | 281.450.8689
During MonthLast Day of Month MSI# Units For Sale # UC Units
UC Avg DOMTime Period
Nov-14 3,281 438,401 2.6Oct-14 3,539 429,419 2.7Sep-14 3,533 429,879 2.8Aug-14 3,772 3710,566 2.8Jul-14 3,970 3510,661 2.7Jun-14 4,129 3410,288 2.5May-14 4,123 3410,224 2.5Apr-14 4,111 389,706 2.4Mar-14 3,903 449,486 2.4Feb-14 3,241 479,654 3.0Jan-14 3,051 539,813 3.2Dec-13 2,357 559,778 4.1Nov-13 2,793 4911,150 4.0
&ODUXV�0DUNHW0HWULFV� 12/12/2014Information not guaranteed. © 2014 - 2015 Terradatum and its suppliers and licensors (www.terradatum.com/about/partners).
22/